
Abstract
Introduction
Although differentiation between benign and malignant small renal tumors (≤4 cm) is still difficult, it is a demand for decision making and determining the treatment strategy. Our aim is to evaluate the role of multidetector row computed tomography (MDCT) in the differentiation of small renal clear cell carcinoma (RCC) and renal oncocytoma (RO).
Methods
We reviewed triphasic computed tomographic (CT) scans performed in 43 patients diagnosed with RCC (n = 23) and RO (n = 21). After an unenhanced CT phase of the upper abdomen, triple-phase acquisition included a cortico-medullary phase (CMP), a nephrographic phase (NP), and a pyelographic phase (PP), and lesions were evaluated both qualitatively and quantitatively.
Results
RCCs were hypervascular in 13 cases and hypovascular in 10 cases, while ROs were hypervascular in nine cases and hypovascular in 12 cases. Mean attenuation values (MAVs) for hypervascular RCCs and hypervascular ROs on unenhanced examination were 34.0 ± 7.1 and 31.3 ± 8.1 HU, respectively. Enhancement in CMP was 173.1 ± 45.2 HU for RCCs and 151.1 ± 36.0 HU for ROs and a gradual wash-out in NP (148.8 ± 34.3 and 137.1 ± 33.9 HU for RCCs and ROs, respectively) and in PP (98.2 ± 36.0 HU for RCCs and 79.4 ± 21.5 HU for ROs) was observed. MAV for hypovascular RCCs and hypovascular ROs on unenhanced examination were 32.4 ± 12.0 and 28.9 ± 8.0 HU, respectively. Both hypovascular RCCs and ROs showed a statistically significant difference in each post contrastographic phase.
Conclusions
Absolute attenuation and the quantitative amount of the enhancement were not strong predictors for RO and RCC differentiation.
Introduction
The differentiation of small renal lesions (≤4 cm) by imaging is essential for choosing the most adequate therapeutic treatment.
Through the years, some criteria have been proposed to differentiate benign and malignant renal tumors based on dimensions (≤3 or ≥3 cm), morphological aspect (‘ball type mass’ and ‘bean type mass’), tumor vascularity (enhancement), and the presence or absence of a central scar; however, all these criteria were demonstrated nonspecific (1-6).
The role of renal biopsy remains controversial, as renal oncocytoma (RO) may also have the same cellular elements of renal clear cell carcinoma (RCC) with atypia and pleomorphism. Because of their common origin (from collecting duct cells), the differentiation between RO and chromophobe RCC is only possible by the histological examination of their surgical specimen. Nerveless, biopsy is recommended as the first step in case of thermoablative treatment (7).
Despite the advances of magnetic resonance (MR) in differentiation between malignant and benign lesions and the various histotypes (8-10), multiphasic multidetector row computed tomography (MDCT) is considered the elective diagnostic choice. The association with single photon emission CT (SPECT) can be helpful in the diagnosis of rare renal tumors (11). Recently, split-bolus MDCT technique has been proposed by splitting intravenous contrast medium into two to three boluses and combining phase images in a single scan, achieving a significant dose reduction to the patient (12-15).
An effective method to obtain an accurate evaluation of these renal lesions is the association of qualitative and quantitative analysis using time-density curves (16).
The aim of this study is to identify qualitative as well as quantitative findings for the diagnosis of small (≤4 cm) RCC and RO by triphasic MDCT.
Materials and Methods
For this retrospective study, data obtained from our clinical practice were evaluated and written informed consent was obtained from all patients. Gathering information was performed in compliance with the Declaration of Helsinki principles and Italian Good Clinical Practice regulations.
We retrospectively reviewed triphasic CT scans performed in the last 4 years in 43 patients (20 females and 23 males; mean age was 59 years) with histological and immunohistochemical diagnosis of RCC (n = 23) and RO (n = 21).
Definitive histological diagnosis of surgical specimen in chromophobe RCC was based on Hale's immunohistochemical method (colloidal iron stain), which is positive in chromophobe subtypes and negative in RO. Other immunohistochemical analysis was based on the search of cytokeratin expression, especially CD7, where RO is CD7-negative, whereas RCC is CD7-positive.
Lesions were located in the right kidney (n = 23) and in the left kidney (n = 21), with a double lesion in one case; lesions diameter ranged from 1 to 4 cm (mean diameter was 2.8 cm).
One patient, who was in follow-up for a peritoneal dermoid cyst, had a RO and a synchronous contralateral small RCC. This condition, in addition to pulmonary cysts and cutaneous fibrofolliculomas, suggested the hypothesis of Birt-Hogg-Dubé syndrome, whose diagnosis was confirmed later by genetic analysis.
CT Protocol
CT scans were performed with 16-slice (Light Speed Plus and Light Speed Pro 16, GE Healthcare, Milwaukee, Wisconsin, USA) and 64-slice (Philips Brilliance, Best, Netherlands) MDCT. After an unenhanced CT phase of the upper abdomen, triple-phase acquisition included a cortico-medullary phase (CMP), a nephrographic phase (NP), and a pyelographic phase (PP).
Scan delay after intravenous contrast medium injection was 35-40 seconds for CMP, 80 seconds for NP, and 5 minutes for PP.
A bolus of intravenous contrast material (Iopamidol, Iopamiro 370 mgI/ml; Bracco, Milan, Italy and Iodixanol, Visipaque 320 mgI/ml; GE Healthcare, Milwaukee, Wisconsin, USA) was injected (120-150 ml at a rate of 4 ml/sec) in an antecubital vein using an 18-gauge needle, followed by 20 ml saline flush at a rate of 4 ml/sec.
Bolus test was not used in any patient, because none of them had a decreased cardiac output or significant renal impairment.
Our CT protocol involved slice thickness of 2.5 mm, gantry rotation speed of 0.75 seconds, reconstruction index 1.25, beam pitch: 0.935:1, 120 kilovolts peak (kVp), and automatic tube current (milliampere; mA) modulation using z-axis (Auto mA technique) or dose modulation (Z-DOM).
MDCT examinations were completed with sagittal, coronal, or curved multiplanar reconstructions (MPRs).
Image Analysis
Image analysis consisted of two steps: qualitative and quantitative analysis. The qualitative and quantitative analyses were performed on a workstation for reporting and image processing (Advantage Workstation 4.2; GE Healthcare, Milwaukee, Wisconsin, USA, and MagicView; Philips Medical Systems, Best, Netherlands).
For the qualitative analysis of renal lesions, all images were retrospectively assessed by two radiologists (MS, and ADA, with 25 years and 15 years of experience in abdominal CT interpretation) and the findings were made in consensus.
Quantitative analysis revealed two enhancement patterns of the lesions during the CMP:
Hyperdense or hypervascular (Fig. 1): attenuation similar or higher than renal cortex during CMP.
Hypodense or hypovascular (Fig. 2): attenuation lower than renal cortex during CMP.
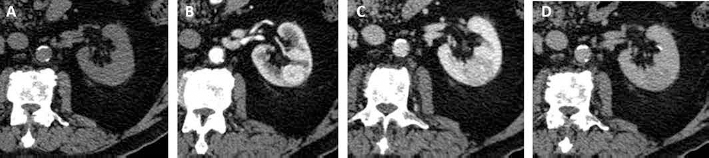
(A) Triphasic MDCT: small left mesorenal homogeneous hypervascular RCC. The lesion shows maximum enhancement in CMP (B) and gradual wash-out in NP (C) and PP (D).
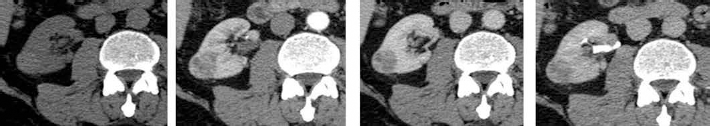
Triphasic MDCT: small right mesorenal homogeneous hypovacular RCC. The lesion shows progressive homogeneous enhancement.
Furthermore, other elements were defined, such as homogeneity/heterogeneity of the lesions (presence or absence of necrotic/hemorrhagic areas within the lesion that identify heterogenesity), tumor margins, and the presence of a capsule/pseudo-capsule.
Quantitative analysis of the average values of attenuation (HU) in each acquisition phase allowed the determination of time/density curves for each lesion. Attenuation values were calculated in each phase using a circular region of interest (ROI). ROIs obtained covered one-half to two-thirds of the lesion, excluding calcifications and necrotic or hemorrhagic areas. In case of heterogenesity of the lesion, ROI was determined in the most homogeneous area.
The obtained values were used to generate attenuation curves for each lesion in any CT acquisition phase, and then, the absolute and relative wash-out percentages in NP and in PP were calculated using the following formula:
Absolute wash-out % in NP or PP =
(CMP HU – NP or PP HU)/
CMP HU– unenhanced HU × 100
Relative wash-out % in NP or PP =
(CMP HU – NP or PP HU)/
CMP HU × 100
Statistical Analysis
Student's t-test was used for comparative analysis of the average values of attenuation [mean values in HU ± standard deviation (SD)]. A p value less than 0.05 was considered statistically significant. SPSS for windows software (version 13.0; SPSS Inc., Chicago, Illinois, USA) was used for the statistical analysis.
Results
The lesions appeared on CT-scans as round exophytic mass, with diameter ranging from 1 to 4 cm (average diameter 2.8 cm); none of the ROs showed the typical central scar because of their small size.
Qualitative Analysis
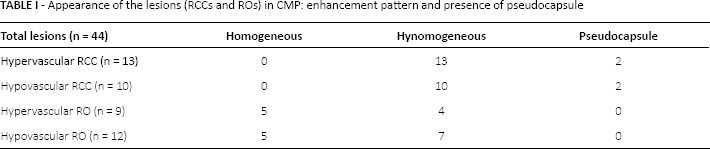
Enhancement patterns of the lesions in CMP for RCC and RO and typical parameters of the lesions are summarized in Table I. RCCs (n = 23) were hypervascular in 13 cases (Fig. 1) and hypovascular in 10 cases (Fig. 2), while ROs (n = 21) were hypervascular in nine cases (Fig. 3) and hypovascular in 12 cases (Fig. 4).
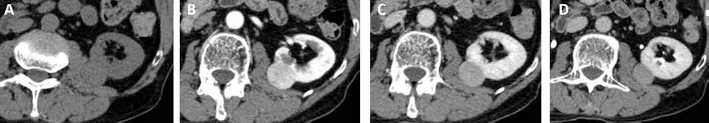
(A) Triphasic MDCT: small left hypervascular homogeneous RO. The lesion shows intense enhancement in CMP (B) and gradual wash-out in NP (C) and PP (D).
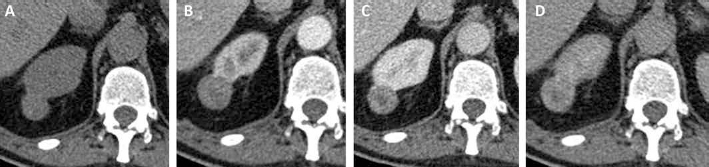
(A) Triphasic MDCT: small right mesorenal heterogeneous hypovascular RO. The lesion is homogeneous and hypodense in CMP (B)with gradual enhancement in NP (C) and PP (D).
Appearance of the lesions (RCCs and ROs) in CMP: enhancement pattern and presence of pseudocapsule
Quantitative Analysis
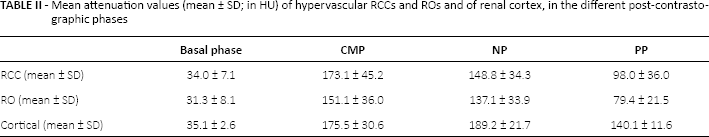
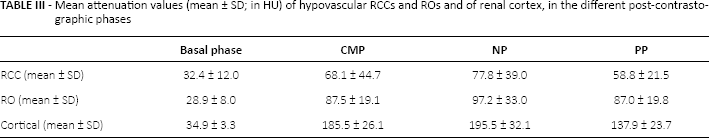
The mean attenuation values (mean ± SD; in HU) of the different post-contrastographic phases (CMP, NP, and PP) of hypervascular and hypovascular RCCs and ROs and of renal cortex are summarized in Tables II and III and in Figures 5 and 6.
Mean attenuation values (mean ± SD; in HU) of hypervascular RCCs and ROs and of renal cortex, in the different post-contrastographic phases
Mean attenuation values (mean ± SD; in HU) of hypovascular RCCs and ROs and of renal cortex, in the different post-contrastographic phases
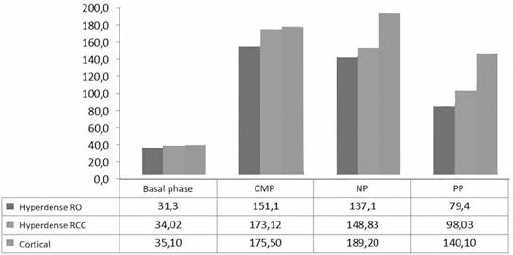
Mean attenuation values of hypervascular lesions (RCCs and ROs) and of renal cortex, in the different post-contrastographic phases.
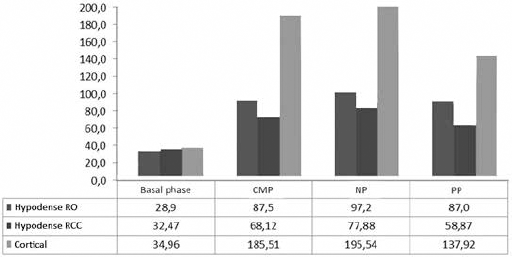
Mean attenuation values of hypovascular lesions (RCCs and ROs) and of renal cortex, in the different post-contrastographic phases.
Mean attenuation values for hypervascular RCCs (Fig. 1) and hypervascular ROs (Fig. 3) on unenhanced examination were 34.0 ± 7.1 and 31.3 ± 8.1 HU, respectively. Enhancement in CMP was 173.1 ± 45.2 HU for RCCs and 151.1 ± 36.0 HU for ROs and a gradual wash-out in NP (148.8 ± 34.3 and 137.1 ± 33.9 HU for RCCs and ROs, respectively) and in PP (98.2 ± 36.0 HU for RCCs and 79.4 ± 21.5 HU for ROs) was observed.
With respect to renal cortex, hypervascular RCCs showed no statistically significant difference in each post-contrastographic phase (p>0.05), whereas ROs showed statistically significant difference in both CMP (p<0.05), and, even more in NP and in PP (p<0.01).
On the contrary, mean attenuation values for hypovascular RCCs (Fig. 2) and hypovascular ROs (Fig. 4) on unenhanced examination were 32.4 ± 12.0 and 28.9 ± 8.0 HU, respectively. Moreover, enhancement in CMP was 68.1 ± 44.7 HU for RCCs and 87.5 ± 19.1 HU for ROs, with a gradual wash-out in NP (77.8 ± 39.0 and 97.2 ± 33.0 HU for RCCs and ROs, respectively) and in PP (58.8 ± 21.5 and 87.0 ± 19.8 HU for RCCs and ROs, respectively).
In respect to renal cortex, both hypovascular RCCs and ROs with showed a statistically significant difference in each post-contrastographic phase (p<0.05).
Figure 7 shows the absolute and the relative wash-out percentage of RCCs and ROs. The absolute and relative wash-out percentage for the hypovascular RCCs were 24.5 and -1.11, respectively, while for the hypervascular RCCs were 52.4 and 44.5, respectively. Hypovascular ROs showed absolute and relative wash-out of -16.4 and -4.85, respectively, while for the hypervascular ROs were 58.5 and 47.0, respectively.
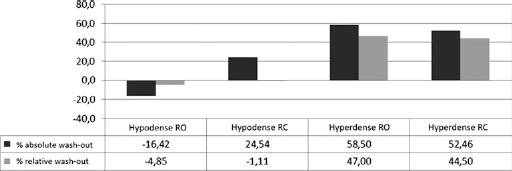
Absolute and relative wash-out percentage of ROs and RCCs.
Discussion
In the last years, the widespread use of ultrasonography and CT has led to an increased detection of small solid renal tumors (≤4 cm) (17). The surgical approach for renal lesions ≤4 cm is tumorectomy, leaving the final diagnosis to histologic findings. However, the concept of treating all small solid renal masses in the same manner as carcinoma is not correct from a radiological perspective, as imaging should avoid unnecessary surgery for benign tumors that could benefit from follow-up strategy.
RCCs, accounting for approximately 70% of renal cortical tumors and 90% of metastases, have the greatest metastatic potential, whereas RO accounts only for 3-7% of all renal lesions and it is virtually benign (18). As a result, clinical implications and therapeutic strategies may differ for RCC and RO, which renders preoperative identification of RCC and RO of great clinical interest.
Several studies have described imaging features of RO (i.e., well differentiated margins; homogeneous enhancement without hemorrhage, calcification, or necrosis; presence of a central stellate scar; and a spoke-wheel pattern of arterial enhancement) (19-22). Although these imaging findings are characteristic, they are not unique.
Currently, there are no reliable imaging features for the accurate differentiation between RO and RCC. Kim et al suggested that segmental enhancement inversion at biphasic MDCT is helpful in identifying RO (23). Conversely, McGahan et al found the presence of segmental enhancement inversion pattern in only one of 16 small ROs (24). In the study by Ren et al, no tumors showed distinct segmental enhancement inversion (25).
In our study, we tried to assess the qualitative as well as quantitative enhancement patterns at triphasic MDCT in order to identify features that can help in differential diagnosis between RO and RCC. We found that absolute attenuation and the quantitative amount of the enhancement were not strong predictors for RO and RCC differentiation. Our observation is in accordance with the results of others (26-28).
Bird et al investigated enhancement and wash-out values obtained by MDCT to distinguish RO from RCC in tumors <4 cm (29). They demonstrated that CMP enhancement greater than 500% and wash-out values greater than 50% are exclusively seen in ROs. These findings are in contrast to our analysis because, in our experience, neither absolute nor relative wash-out was statistically significant.
Shebel et al demonstrated that wash-in curves in CMP and particularly wash-out curves in PP do not allow the differentiation between renal malignant and benign lesions (papillary carcinoma vs. benign lesions) (30).
The limits of our study are its retrospective nature and the small number of patients relative to the various histotypes. High radiation exposure should be considered when multiphasic MDCT protocol is used. However, if differential diagnosis between RO and RCC is not possible and the aim is to differentiate cystic from solid lesions (hypervascular or hypovascular), it is possible to reduce radiation dose by triple bolus MDCT.
In conclusion, differentiation between small (≤4 cm) RO and RCC based on enhancement features is not possible as demonstrated by the comparative evaluation of time/density enhancement curves. Multiphasic MDCT (CMP, NP, and PP), through qualitative-quantitative analysis of the enhancement, has an important impact on patients with small renal masses, reducing the numbers of false-positive cases, with a remarkable impact on the choice of the most adequate treatment (total or partial nephrectomy).
Footnotes
Financial support: The authors have not received any funding for this study.
Conflict of interest: All authors declare that there is no conflict of interest regarding the publication of this paper.