
Abstract
Using a common property resource conceptualization, this article introduces a new methodology for crowding valuation in touristic city centres. Crowding issues are defined in terms of utility gains or losses through a stated-preference choice experiment, making it possible to quantify crowding disturbances in monetary terms. The proposed method is applied to the case of Antwerp, Belgium, specifically focusing on the effect of use density on local inhabitants. The case study serves to reveal quantitatively the theorized quadratic effects of crowding on the space utility of residents. Potential utility effects of different crowding levels are discussed and compared to actual use levels. The methodology provides new opportunities for threshold optimization in crowding-sensitive urban areas, taking into account a community-based norm development.
Introduction
Law (1993: 1) notices how ‘large cities are arguably the most important type of tourist destinations across the world’, offering considerable economic benefits for the region concerned (Law, 1992; Plaza, 2000) and leading cities to compete against each other in order to gain a competitive advantage and attract increased tourist revenues (Matias et al., 2011). However, debates about sustainable development of (tourist) resources have started to frame these economic benefits in a larger context of urban tourist impacts, also recognizing potential detrimental effects of unsustainable growth on, among other things, the quality of life of local residents (Albalate and Bell, 2010; Neuts et al., 2012).
Briassoulis (2002) and Healy (1994, 2006) regard spatial limitations of the resource as one of the defining factors in sustainability issues. Especially in cases where exclusion of potential users from these resources is usually considered socially unacceptable or physically impossible. An important subset of urban tourist resources (e.g. public squares and streets) are linked to the economic concept of open access resources (Healy, 1994, 2006; Vail and Hultkrantz, 2000). In these instances, the physical limitation of available space means that open access could potentially lead to congestive effects when the resource carrying capacity is violated, causing a disruptive effect on the resource outcome (e.g. Albalate and Bell, 2010; Neuts and Nijkamp, 2012). It thus becomes important to monitor indicators reflecting the carrying capacity of tourist spaces, such as the response to specific use-levels.
This article presents an econometric approach to the issue of crowding in historic city centres. Applying a framework with similarities to environmental economics and linked with a sociological normative theory, preferred use-levels of local residents are analytically deduced and compared to optimal and acceptable crowding situations. Furthermore, deviations from the preferred level are valuated, giving insights into the societal costs and benefits of diverse urban crowding levels experienced by local residents in touristic city centres. In the next part, social carrying capacity is discussed, following the theoretical model of Hardin’s (1968) open-access resources. Next, the study method is presented in detail, with specific attention to the construction of choice experiments and their underlying statistical attributes. Finally, the empirical results of the case study are described in light of the theoretical model and actual use-levels, after which conclusions are drawn.
Defining a carrying capacity level of social density
The notion of carrying capacity is closely linked to the idea of a sustainability threshold and the belief that unchecked tourism growth can cause irreversible damage to local ecological, economical and/or social resources (Coccossis and Mexa, 2004; Neuts and Nijkamp, 2012). As noted by Navarro Jurado et al. (2013) carrying capacity shares the same practical difficulties as the concept of sustainability, in part due to the diversity of capacity types. Especially in the context of social density operationalization of carrying capacity has proven difficult. This is related to the fact that the social density threshold is considered a socially constructed perception, only indirectly related to the actual spatial capacity and influenced to a large extent by personal, interpersonal and resource characteristics (see e.g. Manning, 1999; Navarro Jurado et al., 2013; Neuts and Nijkamp, 2012). As a result, crowding situations, defined as social threshold violations, could be induced well before actual congestion – based on physical use-limits – sets in (Absher and Lee, 1981; Hall, 2001).
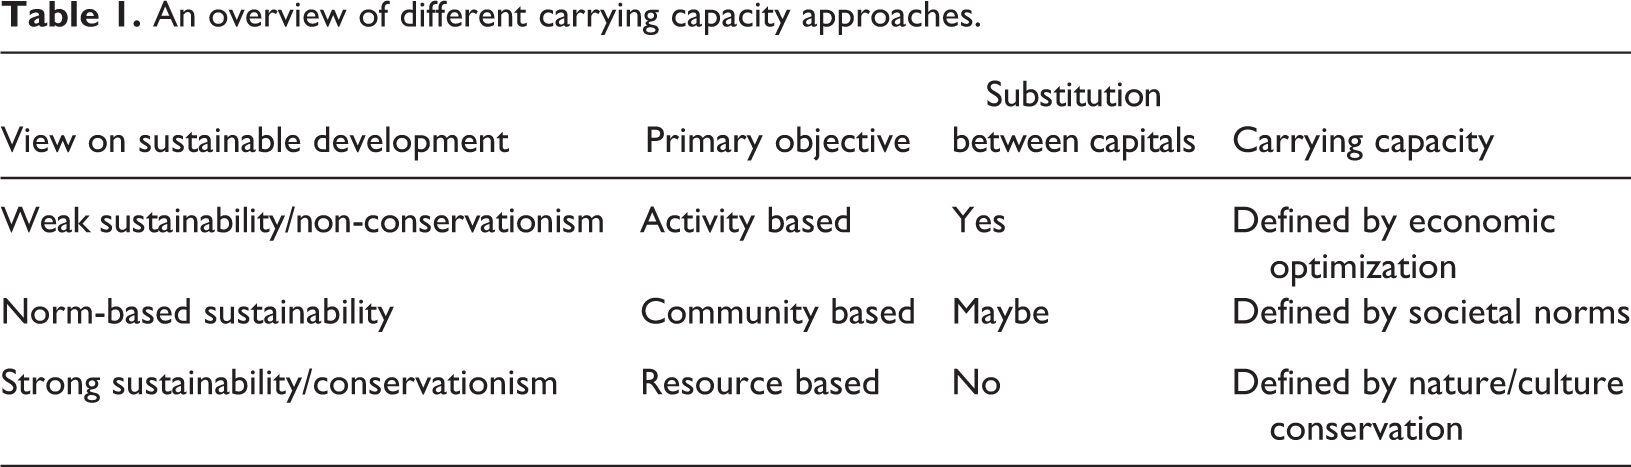
As a result of the psychological and individual aspects that are intrinsic to a state of crowding perception, many contemporary studies have applied a community-based approach to the carrying capacity issue (e.g. Arnberger and Mann, 2008; Manning et al., 2002; Needham et al., 2004; Vaske and Donnelly, 2002). While an activity-based orientation primarily focuses on economic development as a threshold and a resource-based view is based on the idea of strict resource conservation (see Table 1), the community-based approach involves stakeholders in finding an appropriate level of resource use (Burns, 2004; Saarinen, 2006). This often involves the measurement of personal and societal norms as a means to identify acceptable development levels and counters the criticism aimed at a deterministic carrying capacity (see e.g. McCool and Lime, 2001) by recognizing that capacity constraints not only depend on objective measurable variables but are also influenced by changing societal values and perceptions (Saarinen, 2006; Saveriades, 2000; Simón et al., 2004). Normative carrying capacity shows similarity to other planning frameworks, such as limits to acceptable change and visitor impact management, both of which have been advocated as an alternative to resource-based quantification (e.g. Buckley, 1999; Lindberg et al., 1997; McCool and Lime, 2001).
An overview of different carrying capacity approaches.
To date, the normative approach has mostly asked respondents to indicate the state of perceived crowding on an ordinal scale, linking these answers to an affective response (e.g. Manning et al., 2005, 2010; Neuts and Nijkamp, 2012). However, a strong statistical objection remains towards the unification of personal norms measured on ordinal attitudinal scales which do not hold the necessary mathematical characteristics for aggregation and averaging. Therefore, building on the theoretical works of Healy (1994, 2006) and Briassoulis (2002), this article proposes an econometric approach to normative carrying capacity studies. As such, the model fits in the tradition of economic satisfaction models, linking utility received to different states of crowding (Navarro Jurado et al., 2013).
Public space congestion as a personal and societal utility function
The community-based normative approach will be modelled under a number of assumptions: For a given public space in an urban tourist destination, the primary output for its users is the provided utility (U). While place utility stems from different characteristics of the environment (see e.g. Fornara et al., 2010), the model will be developed under ceteris paribus assumptions, solely extracting use-level (n) as a variable characteristic of space. Guided by empirical observations in other studies (e.g. Baker and Wakefield, 2012; Briassoulis, 2002; Healy, 1994; Neuts and Nijkamp, 2012) that suggest the possibility of both under- and overcrowding, marginal utility (dU(n)/dn) is conceptualized as a quadratic function. All users (n) are considered homogeneous in both utility and costs (p), equating average utility to individual utility.
Under these assumptions, total (U(n)), marginal (dU(n)/dn), and average (U(n)/n) utility, and total (TC(n)), marginal (dTC(n)/dn) and average (TC(n)/n) cost of a given space can be written as:


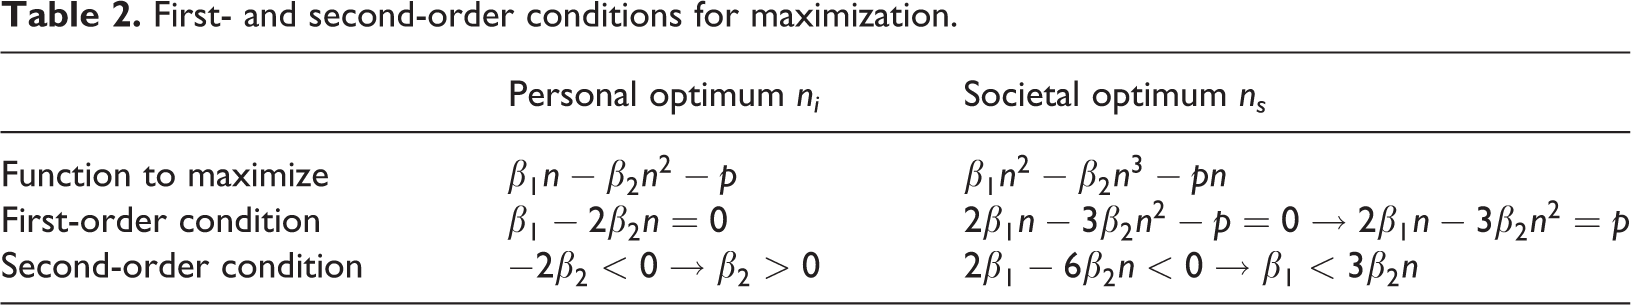
The identification of normative carrying capacity levels then resembles empirical operationalizations of Hardin’s (1968) ‘tragedy of the commons’ (e.g. Baland and Platteau, 2007). Three types of capacity norms are identified: a personal optimal level (ni ), a societal optimal state (ns ) and a personal acceptable level (no ). The personal optimal level is derived by maximizing the average utility, while the societal optimum of space congestion is found by maximizing the difference between total utility and total cost (Briassoulis, 2002; Healy, 1994, 2006). Table 2 gives the first- and second-order conditions to be met in order to classify a solution as optimal. The first-order condition states that the derivative of the profit function has to be zero at the specific use-level, assuring a horizontal tangent at this point. The second-order derivative of this same function must be negative, thereby guaranteeing that the first-order derivative is decreasing at this point and a maximum is reached.
First- and second-order conditions for maximization.
The personal acceptable level, on the other hand, is based on the premise of rational consumption theory. Visitation to a certain space is rational as long as the individual utility – which equals average utility for a homogeneous population – is at least equal to the cost of entry. The maximal acceptable use-level (no ) is found at the intersect of average utility and average cost. This is the use-level that would theoretically be reached under open-access conditions (Baland and Platteau, 2007). Figure 1 graphically summarizes the three identified capacity norms: personal optimum ni , societal optimum ns and personal acceptability threshold no .
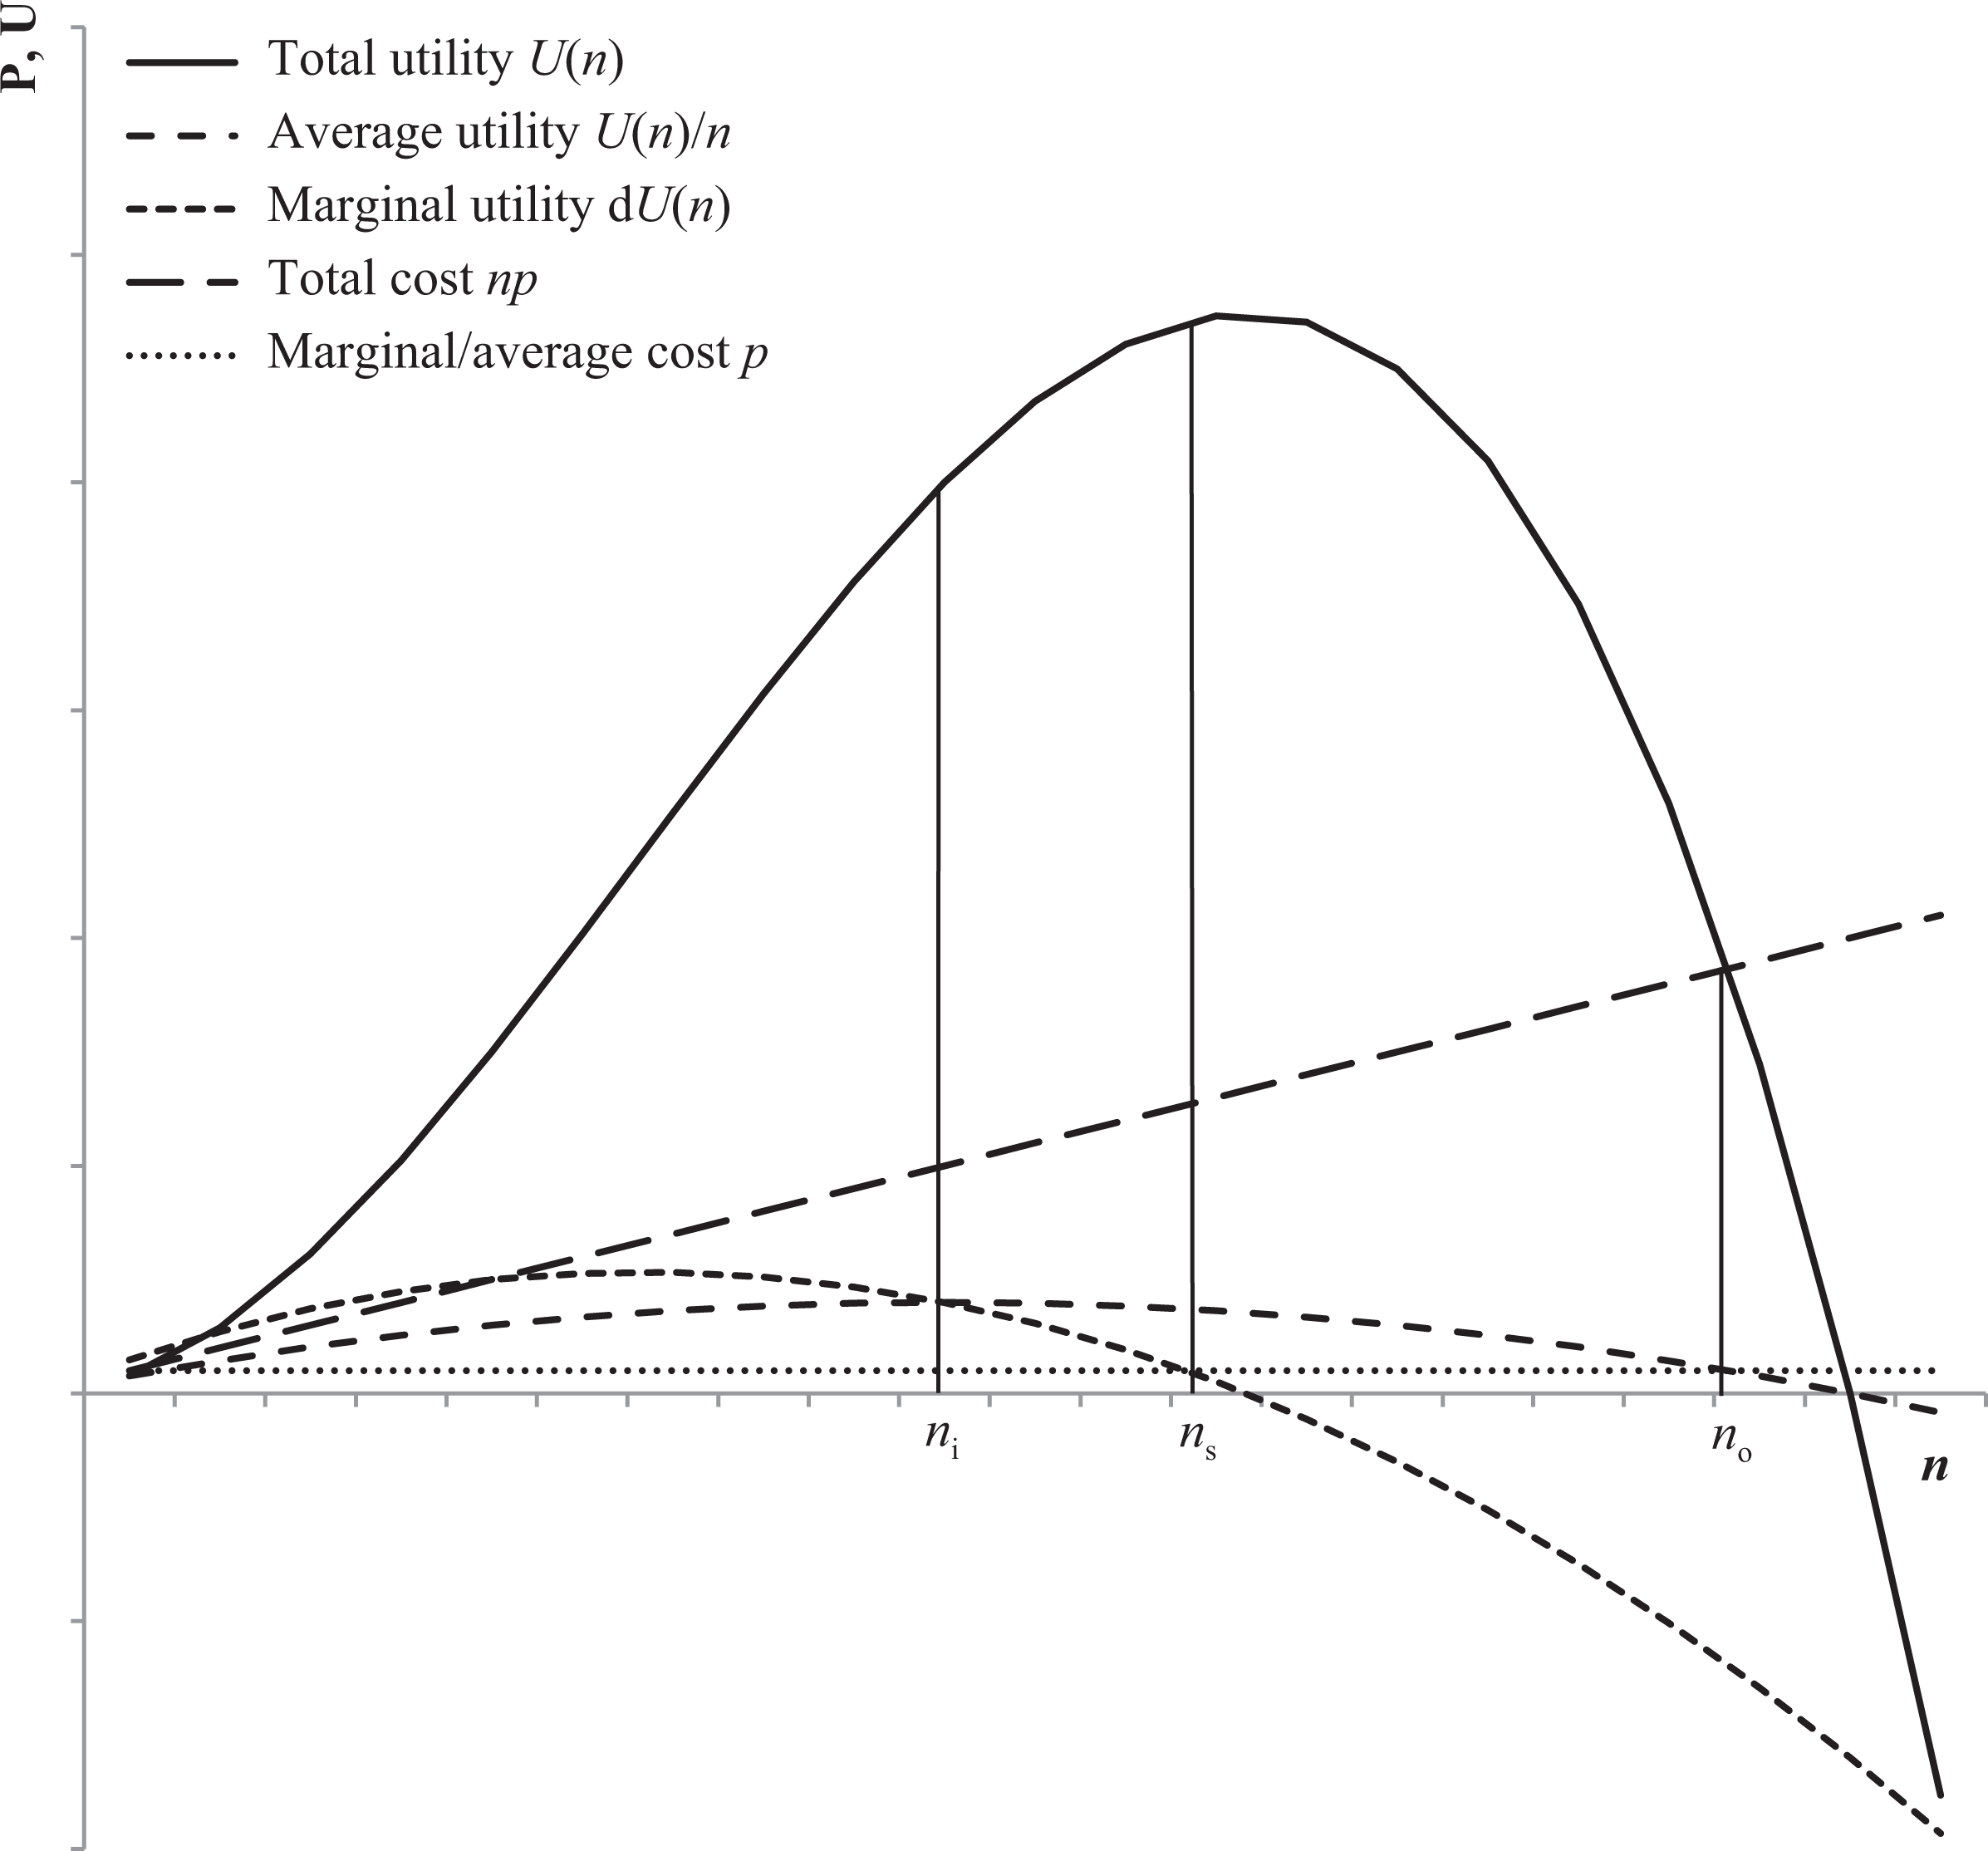
Three types of carrying capacity levels.
The choice for a specific capacity level depends on managerial and societal preferences. If priority is given to maximize access to the specific urban space, no would be the preferred use-level. Conversely, if individual utility is optimized, the related crowding level would be ni . However, both situations can be considered market failures, since these points lie below/above the point where marginal utility intersects marginal cost (ns ).
Study area and methods
Antwerp is the second largest city of Belgium, with approximately 512,000 residents. Thanks to the city’s rich history, cultural offer, business opportunities and shopping and nightlife scene, over 1.7 million overnight stays were generated in 2013. This ranks Antwerp as the third destination in Belgium, behind Brussels and Bruges (FOD Economie, KMO, Middenstand en Energie, 2014). Furthermore, thanks to its connection on the international rail network and its proximity to the Dutch border, national and international day visits take up a significant portion of tourist visitation, estimated at 5 million in 2012. Excursionists and overnight visitors are assessed to generate approximately €0.5 billion in revenue for the local economy (WES, 2012).
Hotels and beds are significantly accumulated in the historic heart of the city with 76.4% of the 161 hotels and 74.5% of the 10,976 beds being located here (Steunpunt Toerisme en Recreatie, 2011). This implies a concentration of overnight visitors in these areas. It can further be assumed that the spread of day visitors will not be substantially dissimilar – on the contrary, Russo (2002) expects a more severe crowding of these groups in the city centre. As of yet, Antwerp is not considered to experience threshold violations though (WES, 2012). So crowding issues are less problematic than is the case for other historic cities in the area, such as Bruges and Amsterdam.
Within the field setting, a specific area was chosen, as shown in Figure 2. This was necessary since the impact of tourist crowding is highly variable, based on time and space. The observations were thus limited to an area of approximately 0.03 km2 in Antwerp. This area runs west of the central railway station, including the important entrance road leading to the historic centre and shopping district De Keyserlei and the main shopping street Meir. Sampling of passers-by in these streets revealed an average of 40% visitors and 10% commuters, indicating the significance of non-local use.
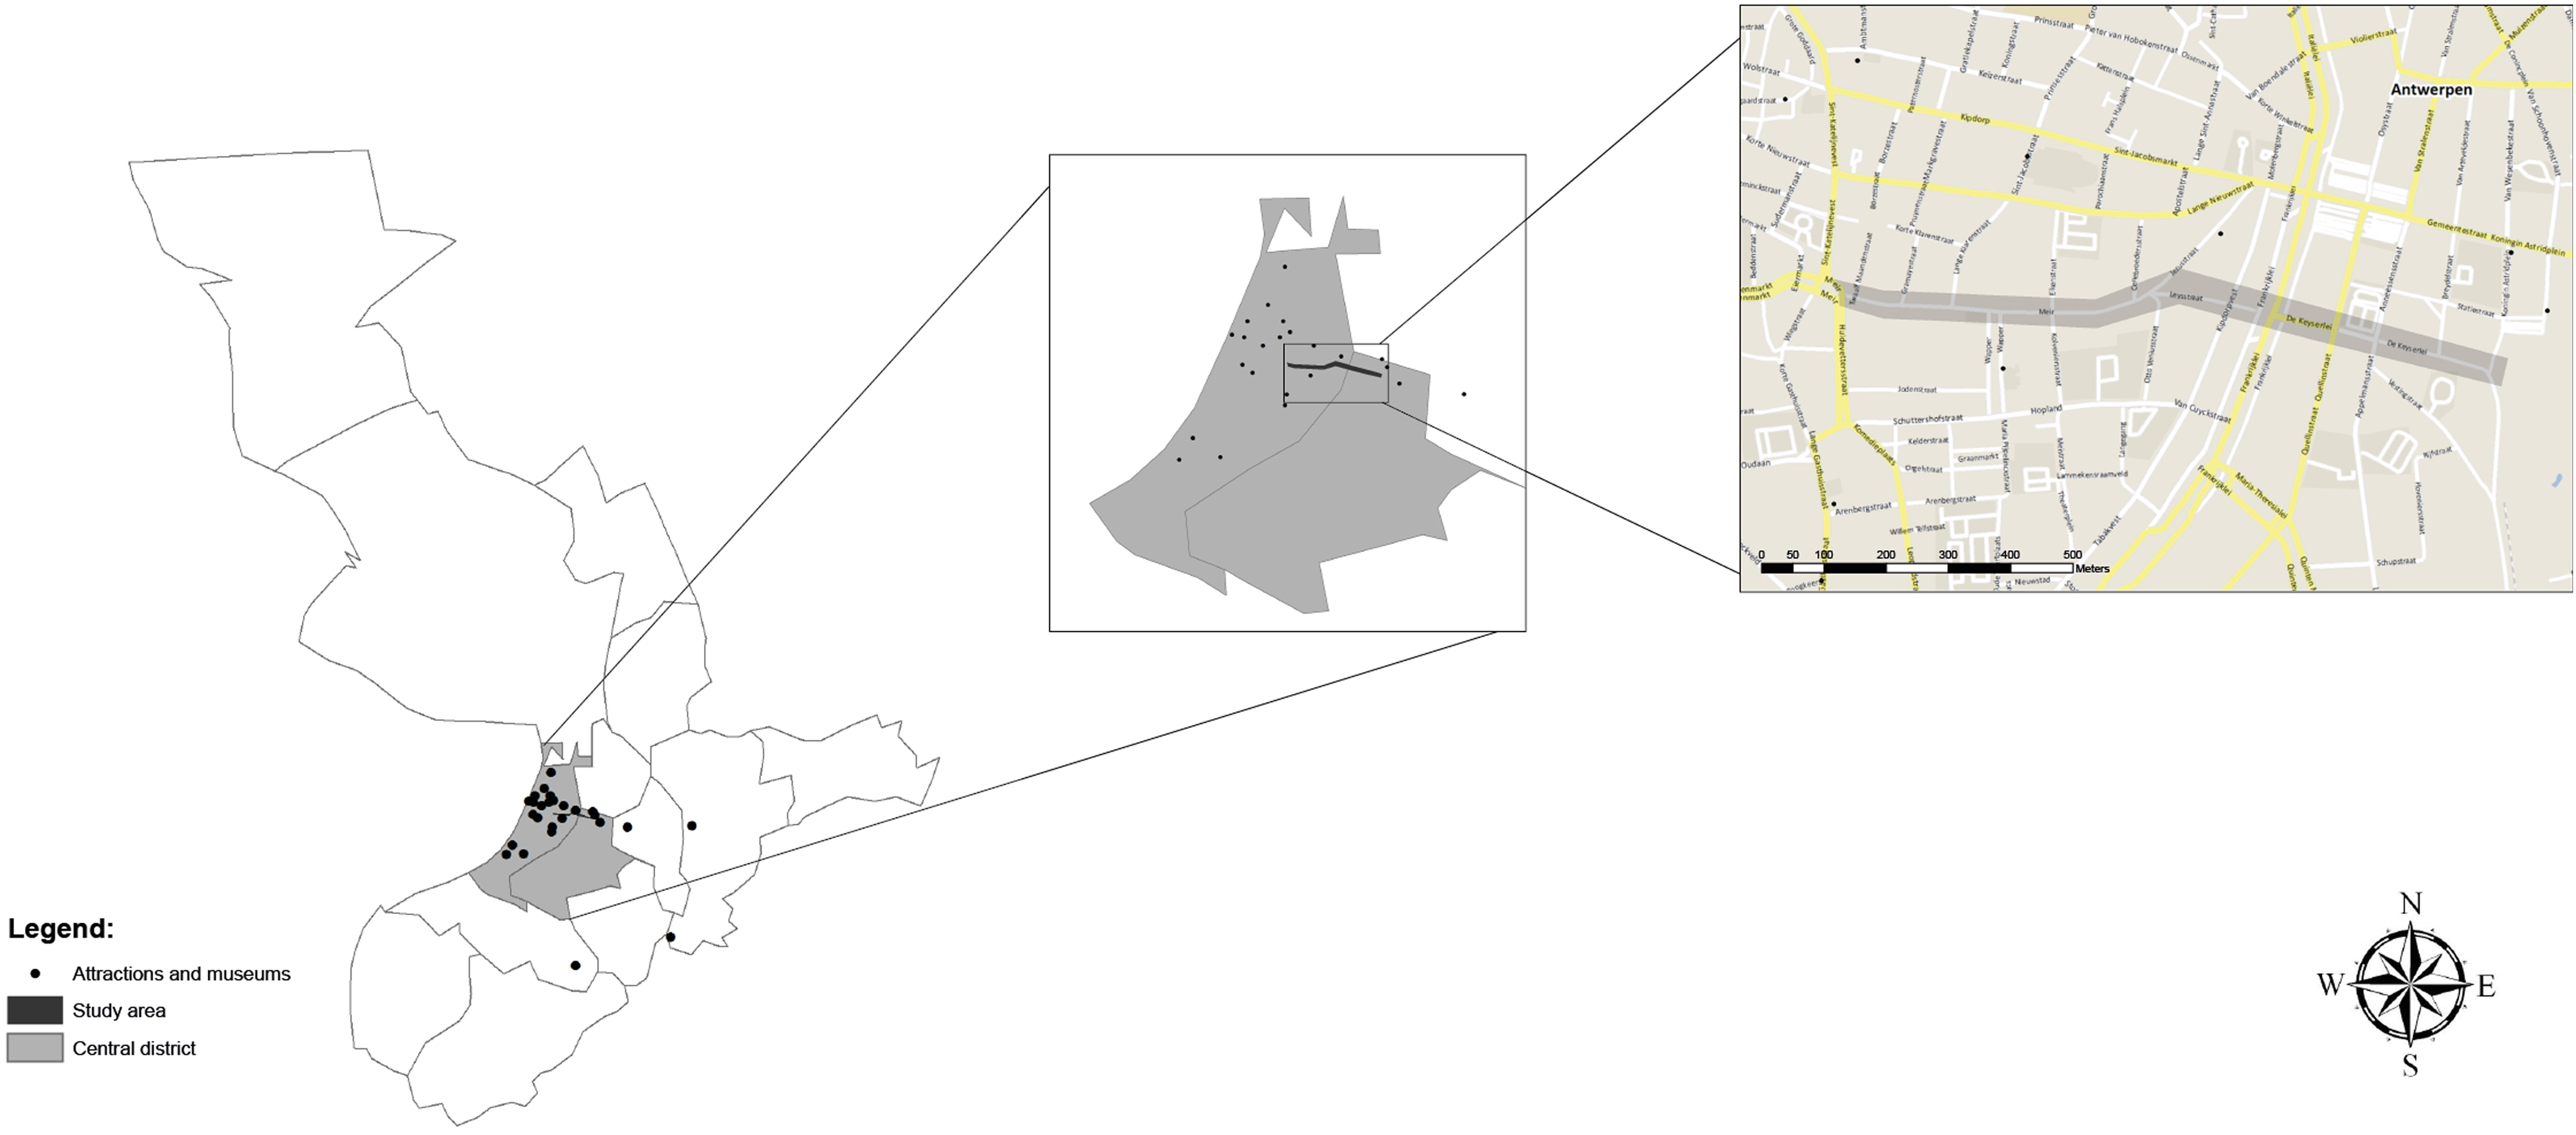
Antwerp study area.
A self-administered internet survey – programmed in LimeSurvey 1.91 – was used in this study, benefiting from the high rate of Internet coverage in Belgium. Stratification subdivided the total sample into three segments, based on distance to the research area (<2 km, 2–4 km, >4 km) since this was considered a relevant variable in crowding perception and valuation. The survey was sent to a total of 4288 Antwerp residents, divided over the above mentioned strata and taking into account a non-response of 85%. A total of 910 surveys were returned (21.2%) during the period January to February 2012, thus reaching a higher return than was expected prior to launching the survey. Table 3 collects some descriptive statistics of the final sample. However, the interpretation of frequencies requires to take the dropout in responses into account, since not all 910 original respondents completed every question.
Descriptive statistics of the sample.
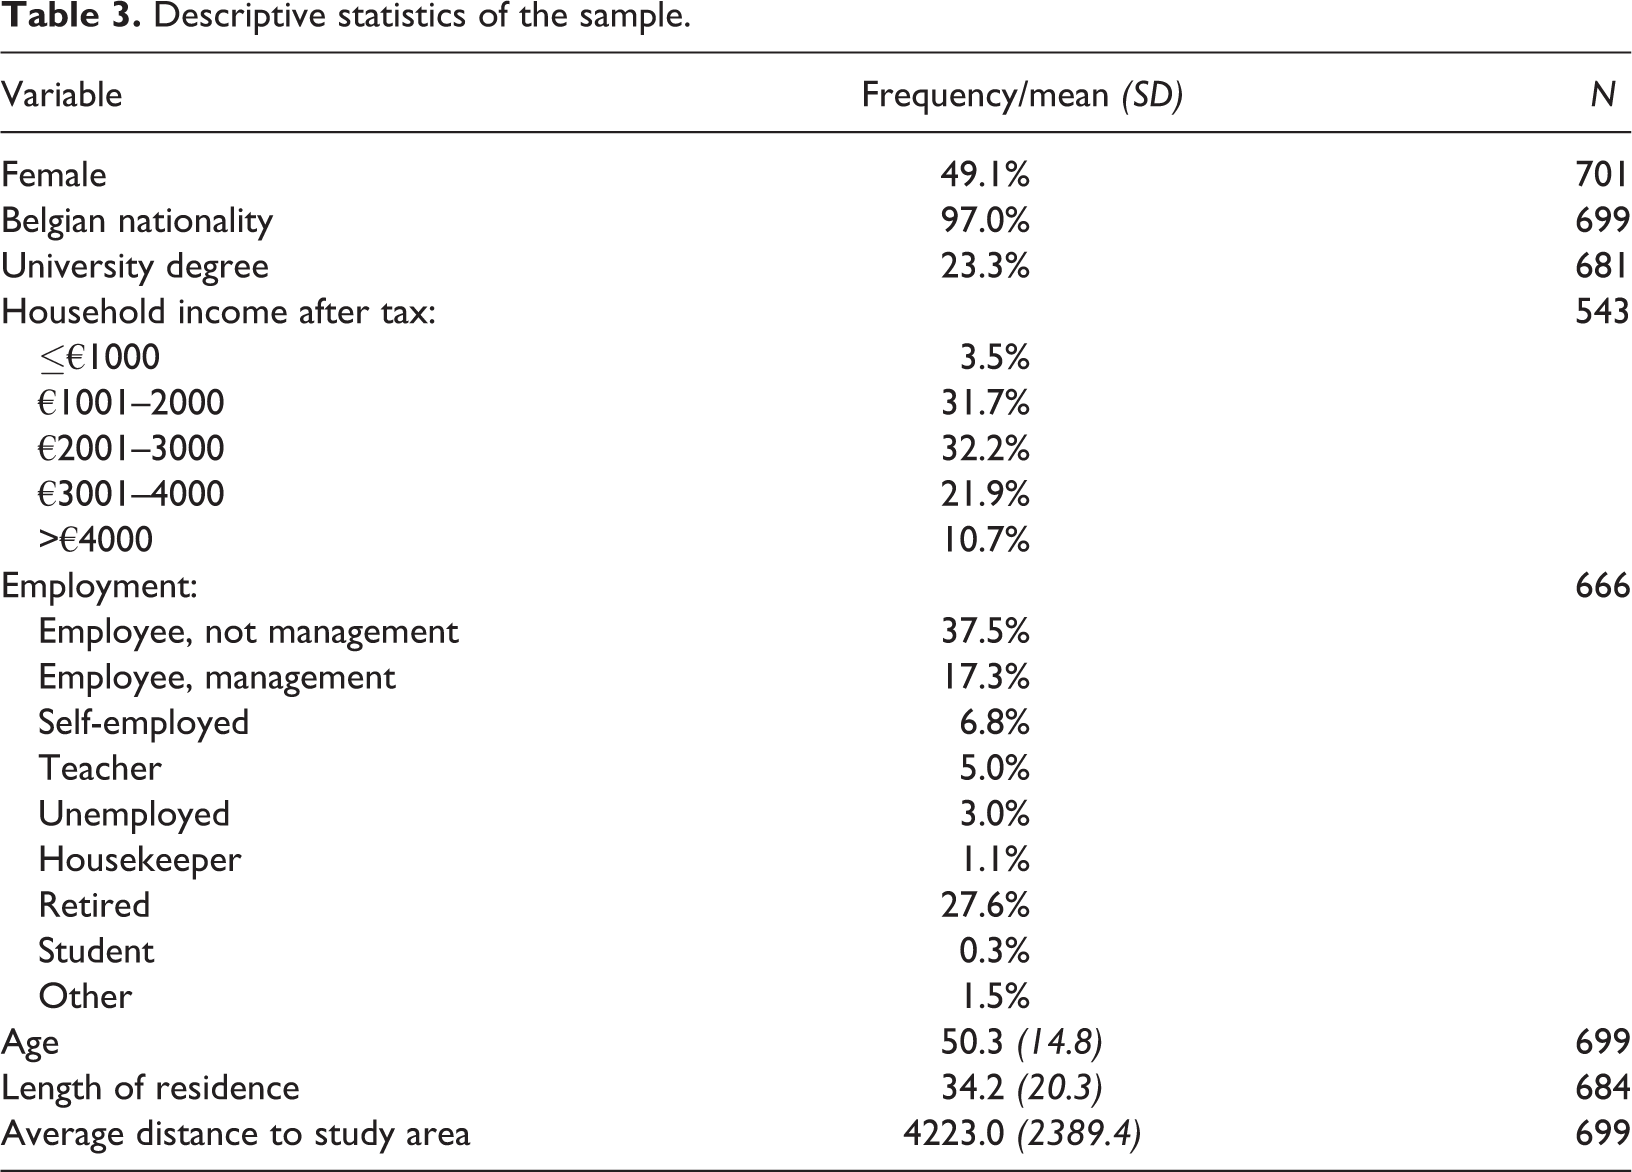
While the number of male and female respondents was almost equal, the sample consists of a very large number of Belgian residents (97.0%). Given that Antwerp counts over 160 different nationalities, foreign nationals are underrepresented in the sample. Similarly, the distribution seems skewed towards higher educated respondents, with 23.3% holding a university degree. Older age categories also seem somewhat overrepresented with 61.5% being 46 or older and a mean age of 50. This is further reflected by the fact that the average length of residence in the city stood at 34 years and 27.6% of sample respondents were already retired. Pensioners were the second-largest employment category behind salaried, non-management employees (37.5%). Both upper and lower income categories are less frequent than the income brackets €1001–2000 (37.7%), €2001–3000 (32.2%) and €3001–4000 (21.9%). Finally, the average distance from the residence to the study area was slightly over 4 km.
Variables in survey instrument
In order to approach crowding norms from an economic perspective and measure the willingness to pay for preferred crowding levels, utility effects need to be monetized. The approach introduced here requires two steps: (a) defining crowding perception under different levels of use-density and (b) inferring willingness to pay for changes in crowding perception. Afterwards real use-levels in the area can then be identified to estimate societal costs of non-optimal levels.
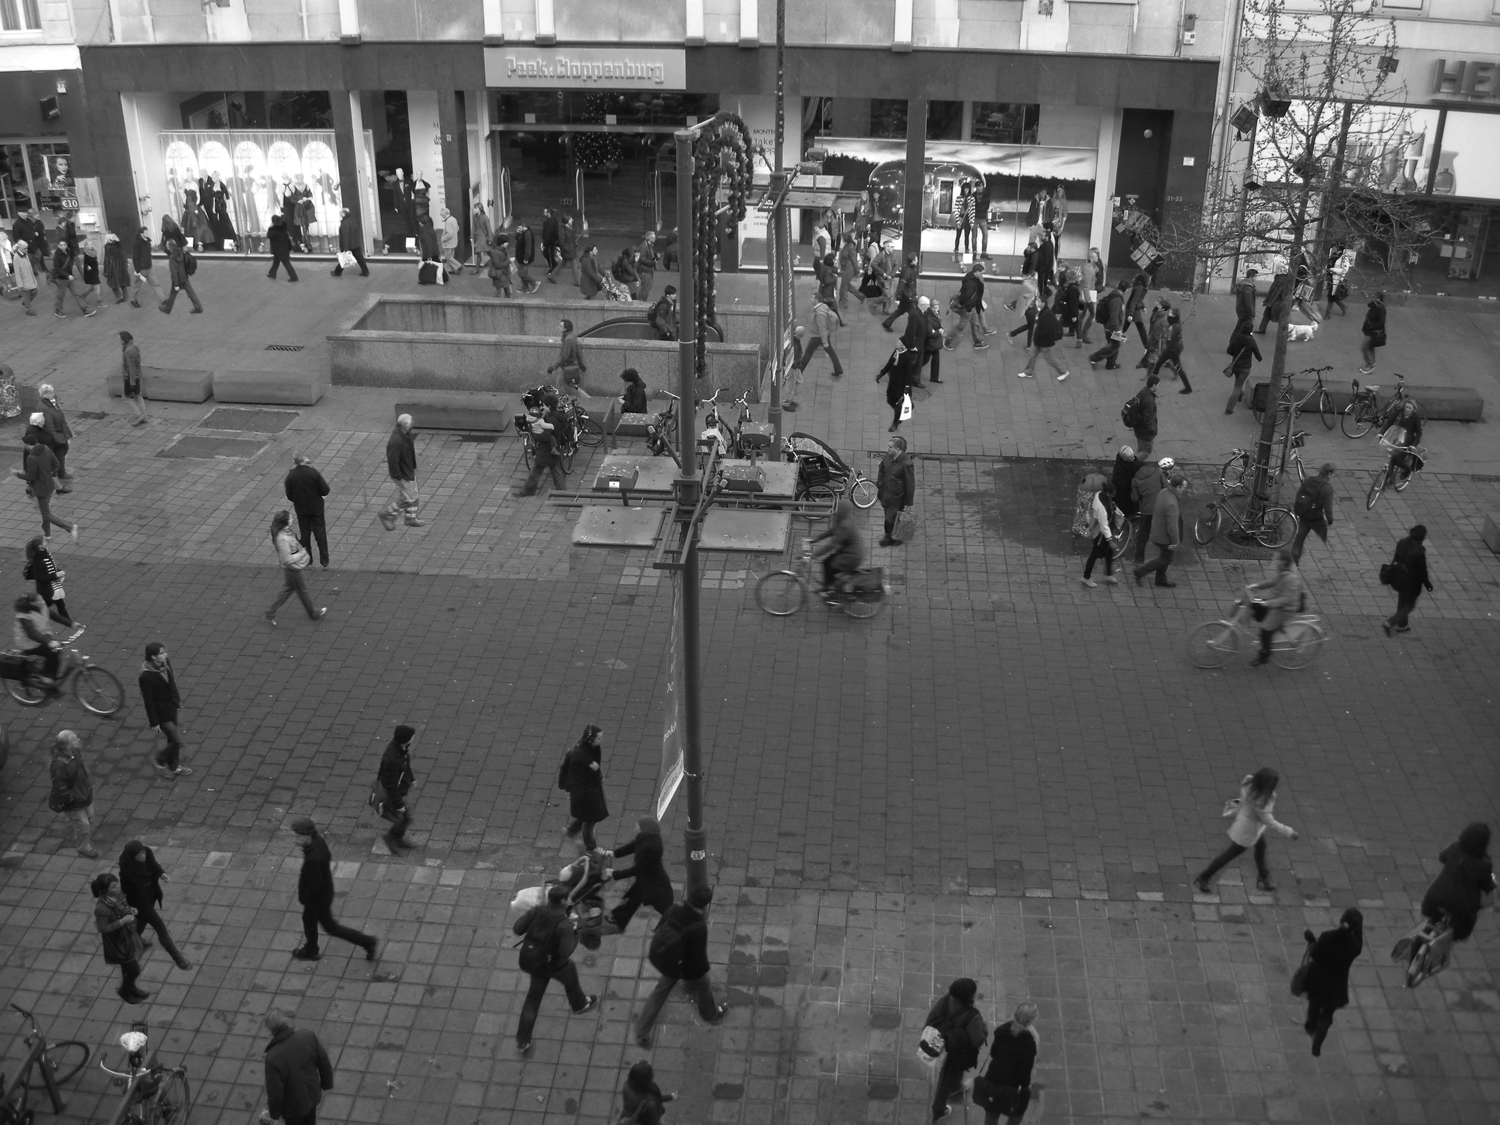
Identification of crowding perception under different situations was based on a photographic method (Bateson and Hui, 1992; Hall and Roggenbuck, 2002). All pictures were taken from a bird’s-eye perspective in order to give respondents a better overview of the presented situation and prevent bias as a result of foreground crowding. Photos were altered with Adobe Photoshop and use-levels ranged from 40 to 400 on a 500 m2 area of the Meir. At each step, an extra 20 people were added. Via an interactive slideshow, respondents were asked to indicate at which photo a higher crowding state became perceptible on a four-level semantic crowding scale – not at all crowded, not crowded, crowded, very crowded (Shelby et al., 1989; Ceurvorst, 2010). Finally, additional questions operationalized both the individual crowding preference and the perceived average crowding level of the area under normal circumstances.
In order to infer willingness to pay, a stated preference choice experiment was used, with sets of binary choices between different hypothetical scenarios (Hanley et al., 1998). This minimizes known biases, such as self-selection, displacement, and on-site cognitive coping mechanisms (Vaske et al., 1980) since non-use is taken into account and hypothetical scenarios – as opposed to actual encounters – identify preferences.
Hanley et al. (2001) advise five steps of study design in order to improve reliability and validity of choice experiments: attribute selection, assignment of attribute levels, choosing an experimental design, constructing choice sets and measuring the preferences in a predefined way. The proposed attributes and their respective levels in Table 4 followed the redevelopment plans for the neighbourhood (see City of Antwerp, 2010). The characteristics inspired by the official plans of the Antwerp city council were street layout of De Keyserlei, bus connections provided on this trajectory, planting of trees and design of sidewalk cafés. The relevance of these attributes was verified by comparing the chosen characteristics with the urban space characteristics that have been found significant in a residential context (see Bonaiuto et al., 1999, 2003, 2006; Fornara et al., 2010; Tu and Lin, 2008).
Attributes and attribute levels (baseline levels in bold).
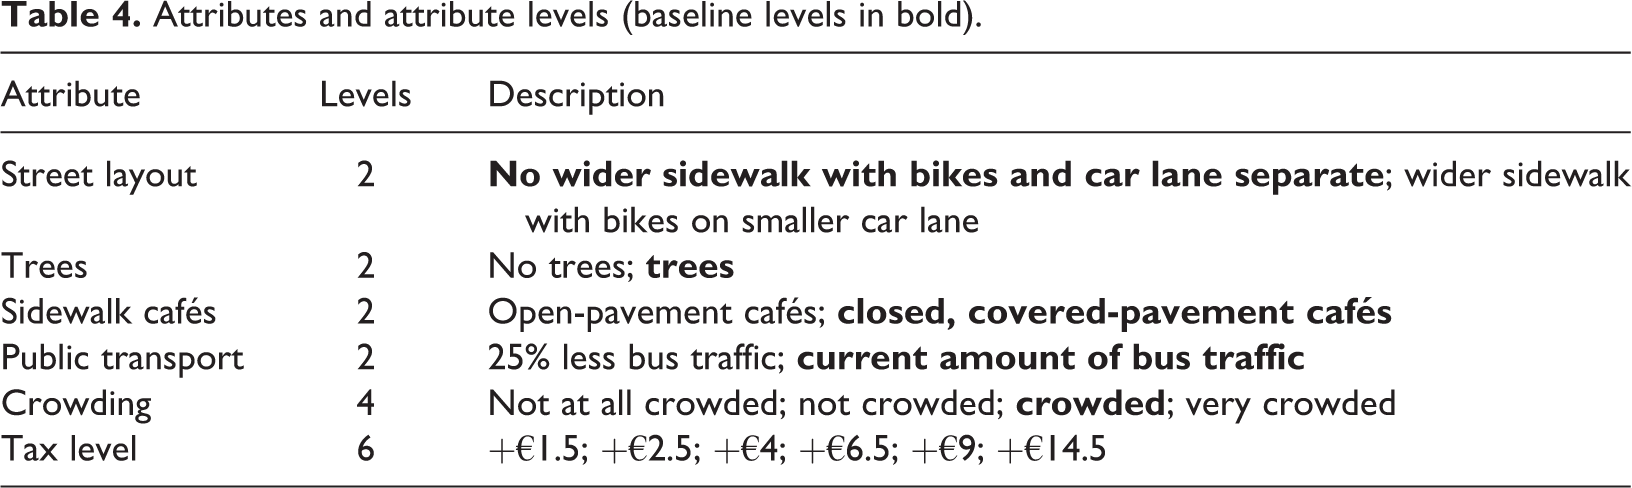
A four-level semantic crowding characteristic was incorporated as a fifth attribute and later transformed into a continuous scale through the information of the photographic method described in supra. Finally, a price vector was included in order to be able to assign willingness to pay values to attribute changes at a later stage (Hanley et al., 2001), applying Weber’s law of just noticeable differences to identify meaningful breaks in tax levels (Mørbak et al., 2010; Rowe et al., 1996).
After the attribute and level selection, the dichotomous scenarios for each choice were created. Since our main interest was with the main interaction effects of crowding and tax level, a fractional factorial design was used (see Hanley et al., 2001). Orthogonal and balanced choice sets were created according to the method described by Street et al. (2005), retaining 24 choice scenarios equally divided over three surveys. A baseline alternative was added to each choice pair in order to allow for a status-quo preference with the attribute levels for the status-quo given in Table 4. In order to ensure validity of welfare measures, tests of monotonicity and stability of choices were included in the design. Within-set monotonicity, which requires that subjects prefer better levels of an attribute to worse levels (Özdemir et al., 2010), was tested by including two dominant choice sets (Johnson and Mathews, 2001). Stability of choices was measured by repeating the first two choice sets at the final stage and comparing these preferences. Consequently, each respondent ultimately received a series of twelve choices, containing an alternative A, an alternative B, and a ‘neither of both’ option.
Preliminary response analysis
Since choice experiments rely on stated preferences and the method itself can be considered quite demanding for the survey respondents, it is important to extract the information under the best possible circumstances. This might include dropping a number of observations when there are reasons to suspect inaccuracies in the form of inconsistent rational choice behaviour and heuristic response behaviour. Inconsistent rational choice behaviour is indicated by the inter-set monotonicity and choice stability tests. In line with Johnson and Mathews (2001) and Özdemir et al. (2010), we consider respondents with more than one mistake to be problematic. Out of the 693 respondents that completed all choice experiments, 0.4% failed both monotonicity tests. The rate of failure on the stability tests was significantly higher with 16.7% of the sample failing both times. The higher error margin for the stability tests is consistent with both learning effects and respondent fatigue (Johnson and Desvousges, 1997; Maddala et al., 2003; Schwappach and Strasmann, 2005).
In order to identify potential heuristic response behaviour, attention was paid to non-trading of respondents and lexicographic behaviour. While non-trading on the part of alternatives A and B only played a very limited role (1.3 and 0.3%) the amount of people who consistently chose the status-quo alternative was significantly higher (8.1%). However, if these choices in fact reflect extreme preferences which hinder trading, the answers should still be considered utility-maximizing (Hess et al., 2010). A post choice experiment question revealed that the majority of respondents who continuously opted-out did this out of disagreement with the payment vehicle (n = 27). On the other hand, the respondents who did not choose other alternatives out of an absence of their preference, budget constraints, a lack of use of the research area, or a preference for the status-quo (n = 14) can be considered utility maximizing individuals. Lexicographic behaviour is noticed in cases where respondents make choices based on one or a small subset of alternatives (van der Pol and Cairns, 2001). A number of hypothesized lexicographic sets were studied (strict dominance of larger sidewalks, green areas, lower crowding levels, higher crowding levels and lower price). Strict dominance of an attribute meant that a respondent was found to always choose the alternative where that specific attribute was present. No dominant patterns emerged from this analysis.
After accounting for inconsistent rational choice behaviour and heuristic responses, the filtered sample consisted of 525 respondents. The characteristics of this sub-sample were compared to the descriptive statistics of the full sample (Table 3) with χ2 and t-tests in order to assure that deletion of respondents would not result in a dropout of lower educated and less affluent respondents. All test statistics indicated non-significant differences between the full sample and the sub-sample, thereby suggesting that the filtered sample should not lead to different parameter estimates. Next, the specification of the utility function with regard to crowding is tested. While conventionally utility is assumed linear, equations (1) to (3) clearly theorized a non-linear utility function. A univariate smoothed scatter plot of the crowding variable was created (Cleveland, 1979; Sennhauser, 2010) in order to ascertain non-linearity of the utility function. As can be seen in Figure 3, the results support the assumption of a quadratic relationship between crowding and utility of space.
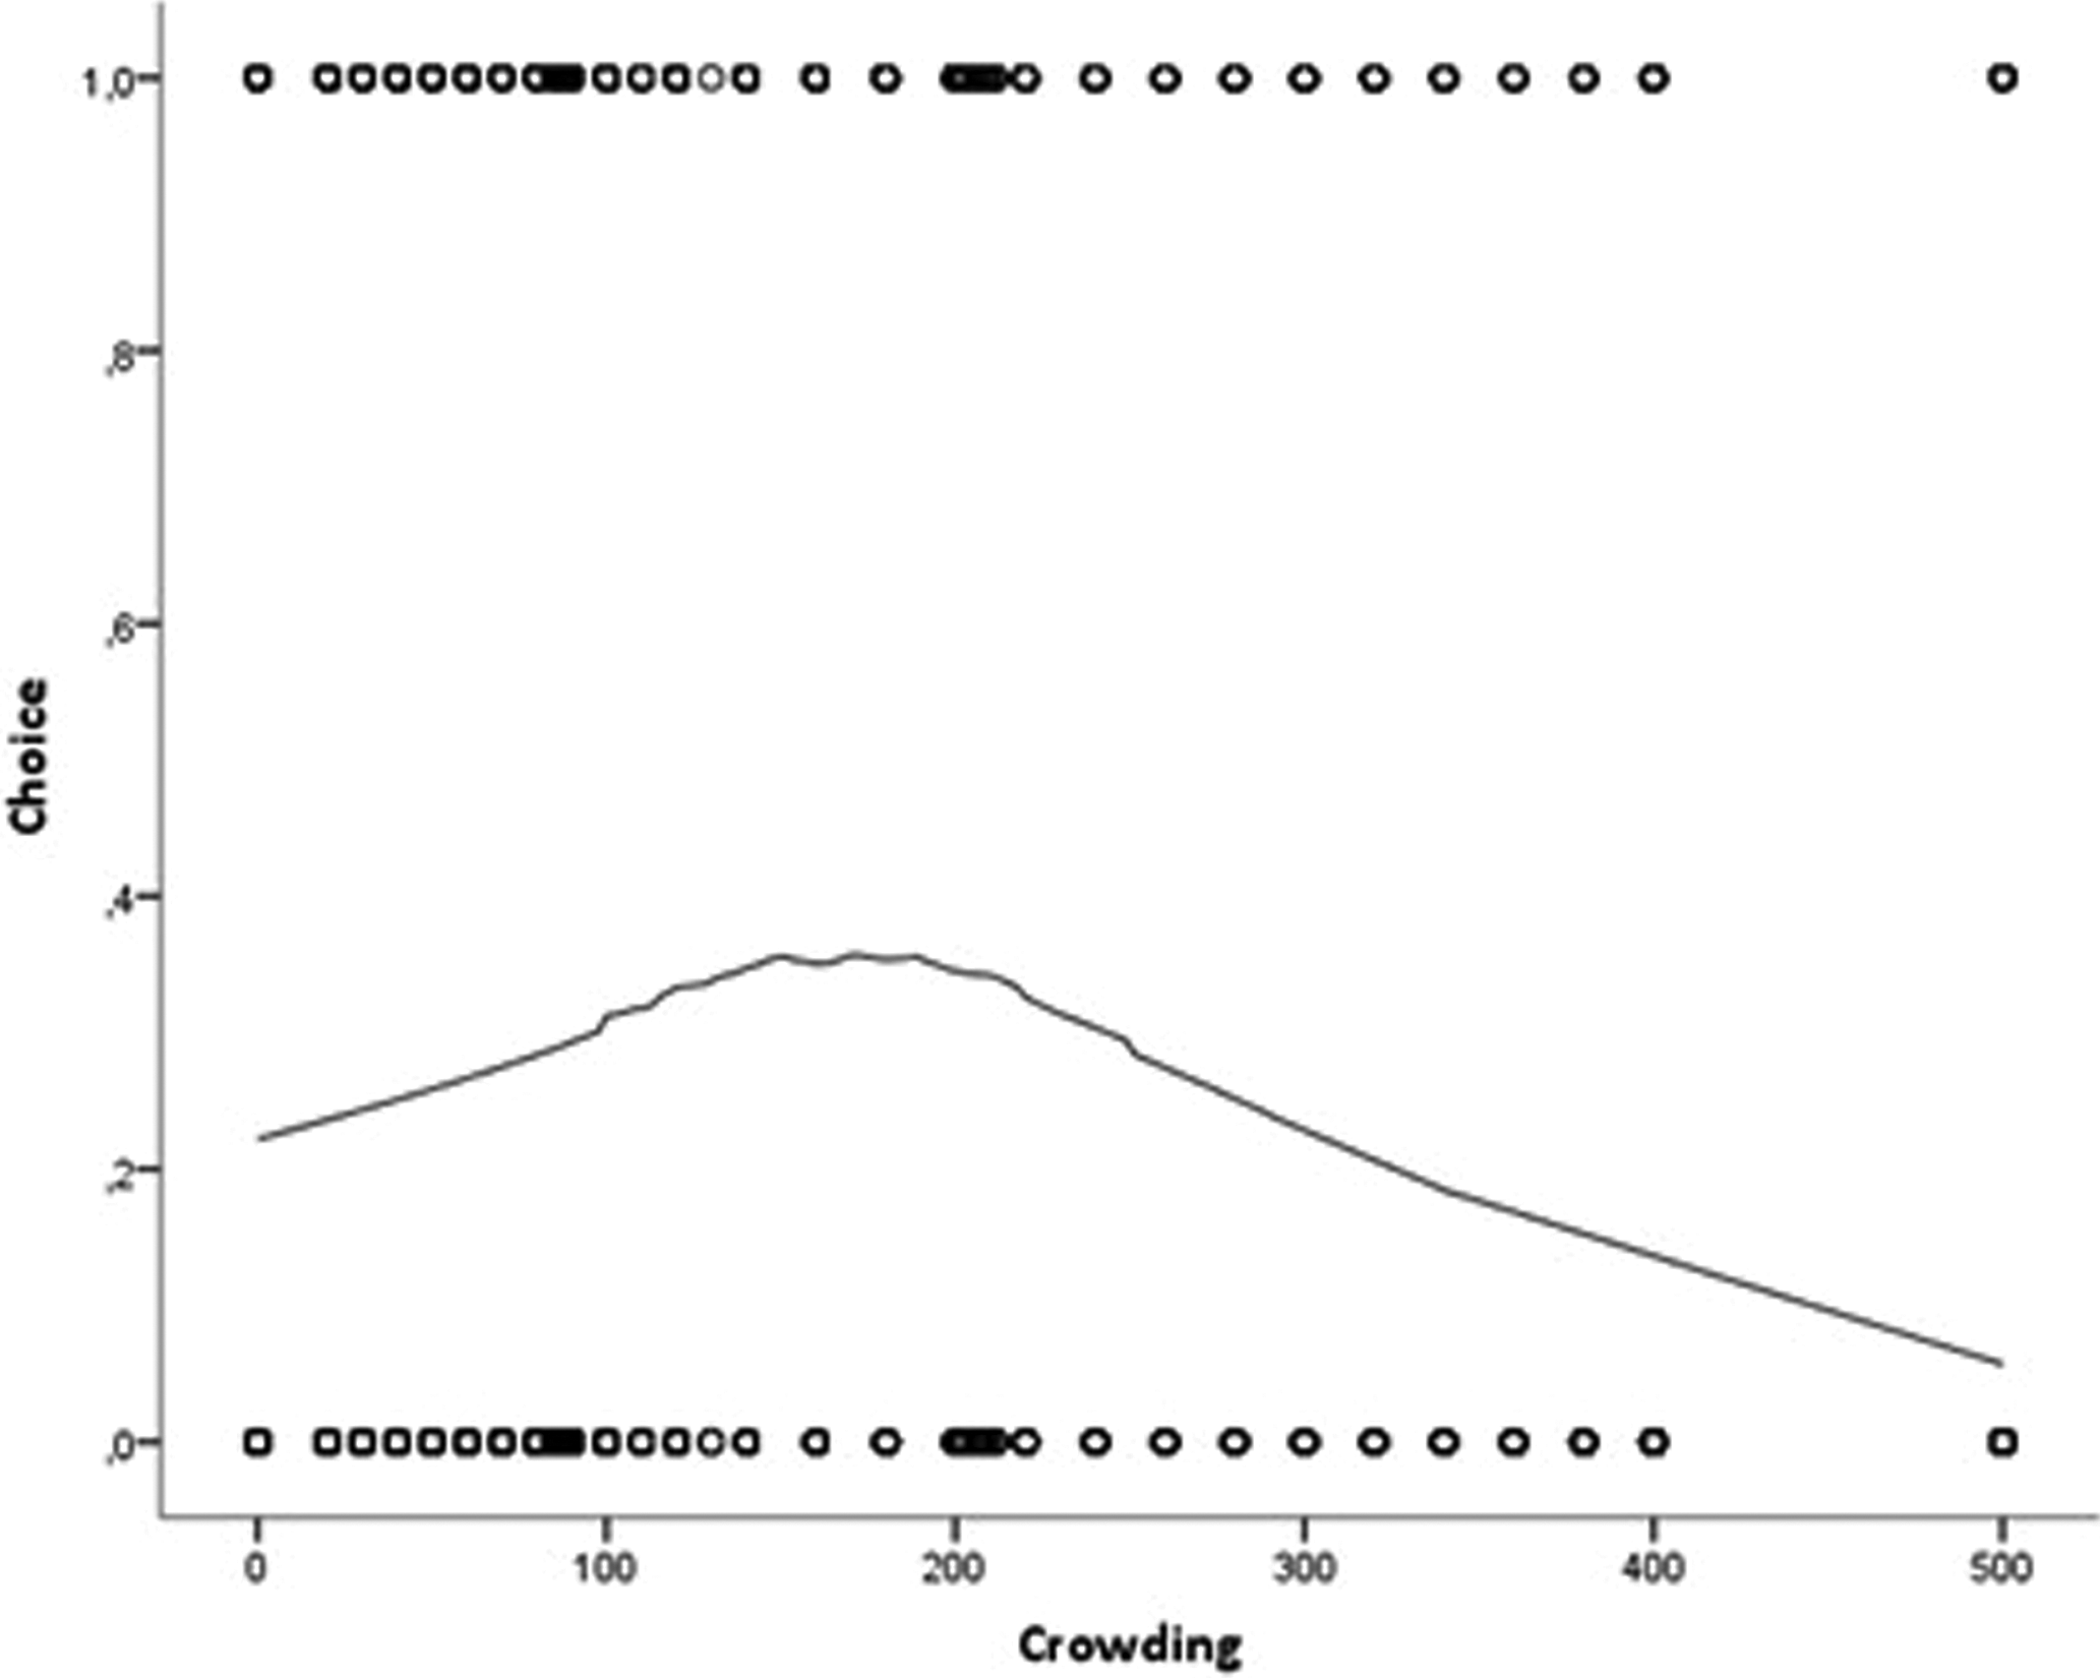
Smoothed scatter plot.
Statistical methodology
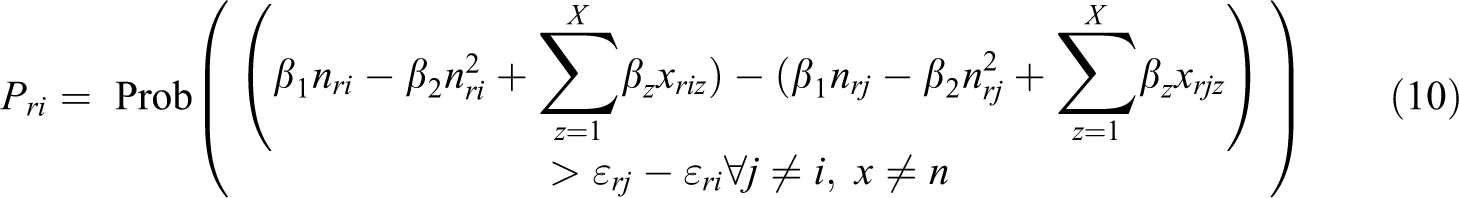
Since the dichotomous choice experiments approach is based on multiple measurements per respondent, specific methods have been developed in order to statistically estimate the attribute coefficients. The common theoretical framework behind the different approaches is the random utility model (Luce, 1959; McFadden, 1980, 1986). As Train (2002) notes, according to random utility theory a decision maker faces a certain number of alternatives, each with a specific level of utility. While the utility is known by the respondent, the researcher can only observe a hierarchy in responses; it is assumed that a respondent r will only choose alternative I, if

with U being the utility associated with each scenario. While this utility is not known, the attribute levels of each scenario (xrj ) and the socio-demographic data of the respondent (sr ) are a given. However, there are also unobservable parts of the utility, which are captured by an error term (εrj ). Therefore, utility can be written as a function V of the attribute levels xri (the deterministic part) and an error term (the random part), giving a probability that a respondent chooses alternative i over alternative j of


Since equation (3) and Figure 3 expect individual utility from crowding levels to be quadratic in nature, equation (9) can be further refined in relation to use-level:
Since values of εrj are unknown, these terms are treated as random as the solution to the aforementioned equation depends on the assumptions made about the error terms (Hanley et al., 1998). In other words, while the interpretative framework is similar for all discrete choice methods, the ultimate statistical solution depends on the choice of the error term distribution (Train, 2002). The conditional logit model assumes that the errors are identically and independently distributed extreme value and are uncorrelated over alternatives. This prerequisite has an effect on the handling of taste variation of respondents. While systematic taste variation (i.e. taste variation which depends entirely on observed characteristics) can be incorporated into the model, random taste variations cannot (Train, 2002). Furthermore, Haynes et al. (1988) show how zero correlation between error components also entails the somewhat stringent assumption of independence from irrelevant alternatives (Hanley et al., 2001). In order to allow for random taste variations and relax the independence of irrelevant alternatives assumption, a mixed logit model can be estimated, splitting the error component into two parts: one part which contains correlations and preference heterogeneity and which can follow a number of distributions (most notably normal, lognormal and triangular), and another part which is solved in the same way as the previous logit model (Hensher and Greene, 2003).
Once the parameters have been estimated, the different attribute levels can be connected to monetary changes by the following equation (Hanemann, 1984):
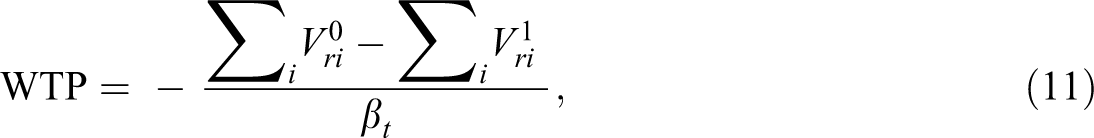
where ßt is the marginal utility of the payment vehicle and V0 ri and V1 ri are two comparative states of the resource (Horne and Petäjistö, 2003).
Coefficient estimates of the mixed logit model
The model was tested with the mlogit package developed by Yves Croissant (see CRAN, 2011) for the R 2.13.2 statistical software package. Since the preliminary Hausman–McFadden test for Independence of Irrelevant Alternatives was statistically significant, the property was rejected, indicating a preference for the mixed logit model with preference heterogeneity. The advantage of a mixed logit model lies in the combination of a number of fixed parameters that take advantage of the closed multinomial logit calculation, and a select group of randomized parameters that incorporate the heterogeneity in the data. Based on the t-statistic test of the standard deviations of a preliminary estimated random model (see Mohammadian et al., 2008; Train, 1998; Wang et al., 2007) only the Alternative Specific Constants and taxation level were kept fixed in the final model. Other variables were randomized around a normal distribution, empirically validated by estimating n+1 conditional models, removing a single individual in every estimation and plotting the difference between these model coefficients and the full model on a kernel density function (Hensher and Greene, 2003).
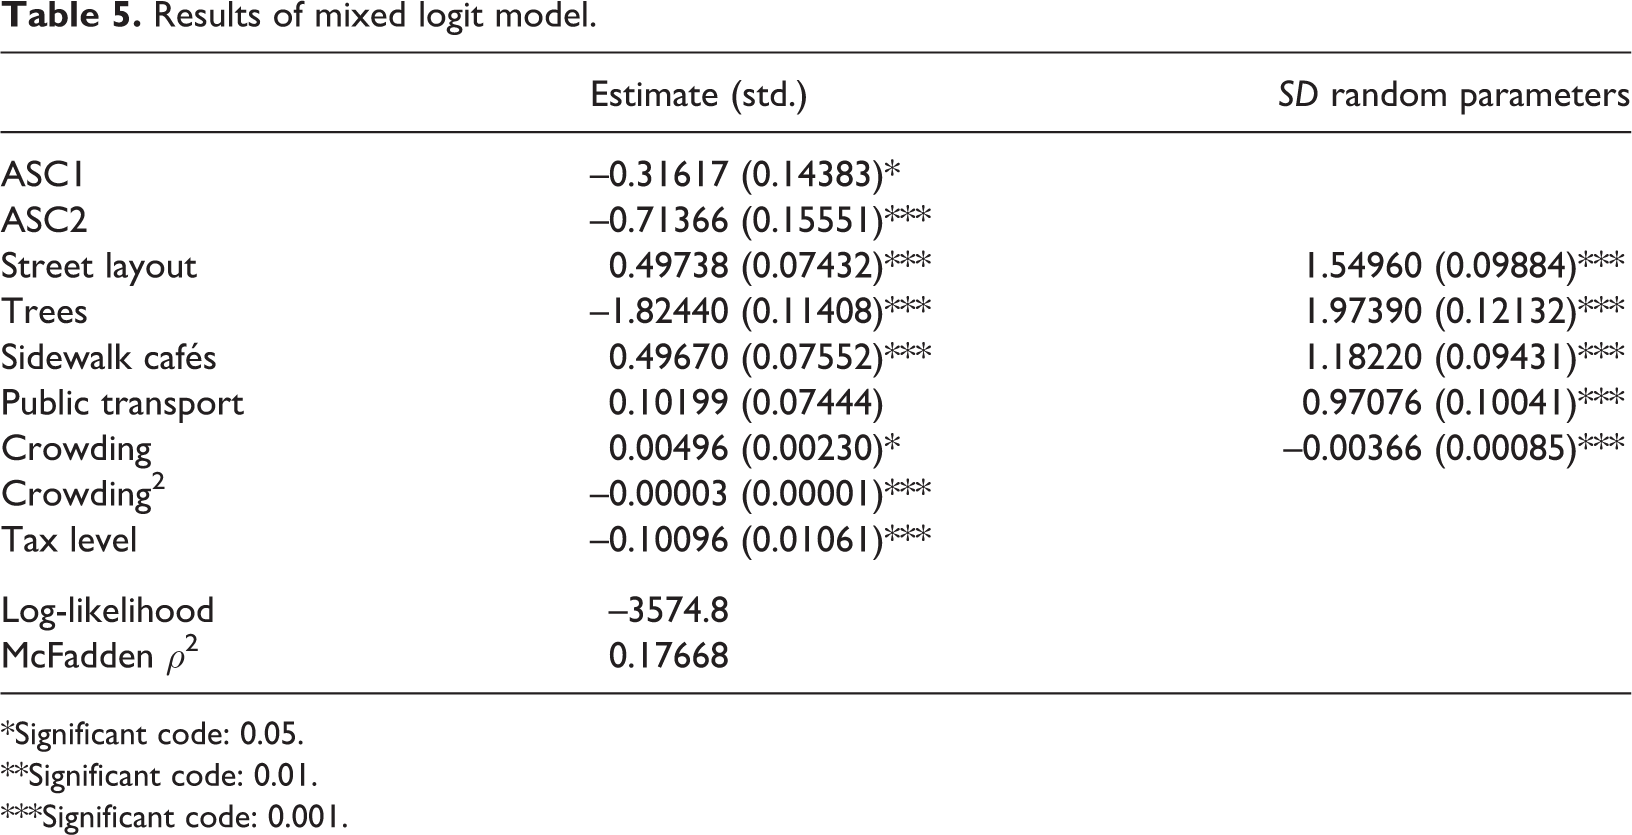
Table 5 shows the parameter estimates of the mixed logit model. Since all random parameter standard deviations are significant, the data support the presence of unobserved heterogeneity between respondents in all of these variables. Positive coefficient values suggest that a change in that specific attribute from the reference level (i.e. the current state of the area) to the alternative level increases utility. Conversely, negative values suggest that a change from the current reference state to an alternative is generally unwanted.
Results of mixed logit model.
*Significant code: 0.05.
**Significant code: 0.01.
***Significant code: 0.001.
The results suggest that only public transportation did not significantly influence the utility of the sample respondents with all other variables being highly significant. Both alternative specific constants are negative, indicative of a status-quo preference. Consistent with what could rationally be expected, the negative coefficient for the tax level indicates that higher taxation will lower utility. Table 5 further indicates a positive influence of wider sidewalks. Thus the redevelopment plans that aim at increasing the width of the pedestrian areas are found to be utility-increasing. Similarly, the new, open design of the sidewalk cafés is preferred over a situation in which the outdoor cafés are closed off by fixed windscreens. Finally, there is a strong preference to include trees in the design, similar to current conditions.
Focussing specifically on the effect of crowding, the results stake a claim for the quadratic function since both the first- and second-order crowding variable are significantly related to the respondent’s utility. While Manning (1999) reports a consistently weak or non-significant relationship between crowding and satisfaction, the applied methodology reveals substantial effects of observed crowding states on place utility of local residents. These divergent results might partly be explained by including non-users and specifically focusing on utility effects of crowding in heritage cities on local residents instead of excursionists/tourists.
Utility effects of crowding levels
In order to interpret the results in the context of societal welfare it is possible to either compare utility effects indirectly via the rate of substitution between two non-monetary attributes, or focus on the direct willingness to pay by translating utility effects into monetary values. As an example of the former, indirect, method, coefficient values of different urban space attributes are compared in order to derive marginal rates of substitution. Applying equation (11) and substituting the tax coefficient for the coefficient regarding vegetation, it can be deduced that while trees are important satisfiers, respondents were willing to trade this aspect for lower crowding levels if use-level exceeded n = 190 (i.e. a density of 0.38 persons/m2) without utility loss. Since respondents clearly value green spaces, this rate of substitution already offers an interpretation of the general importance that is being placed on manageable density levels. Specifically focussing on the tax coefficient of Table 5 and inputting this in equation (11) allows for an easier, direct interpretation in €, deriving personal willingness to pay estimates for different crowding levels. As a result of the quadratic form, results will depend on use-levels. Table 6 provides an overview of change in willingness to pay estimates for different numbers of visitors.
Utility point estimates for different crowding levels (in €).
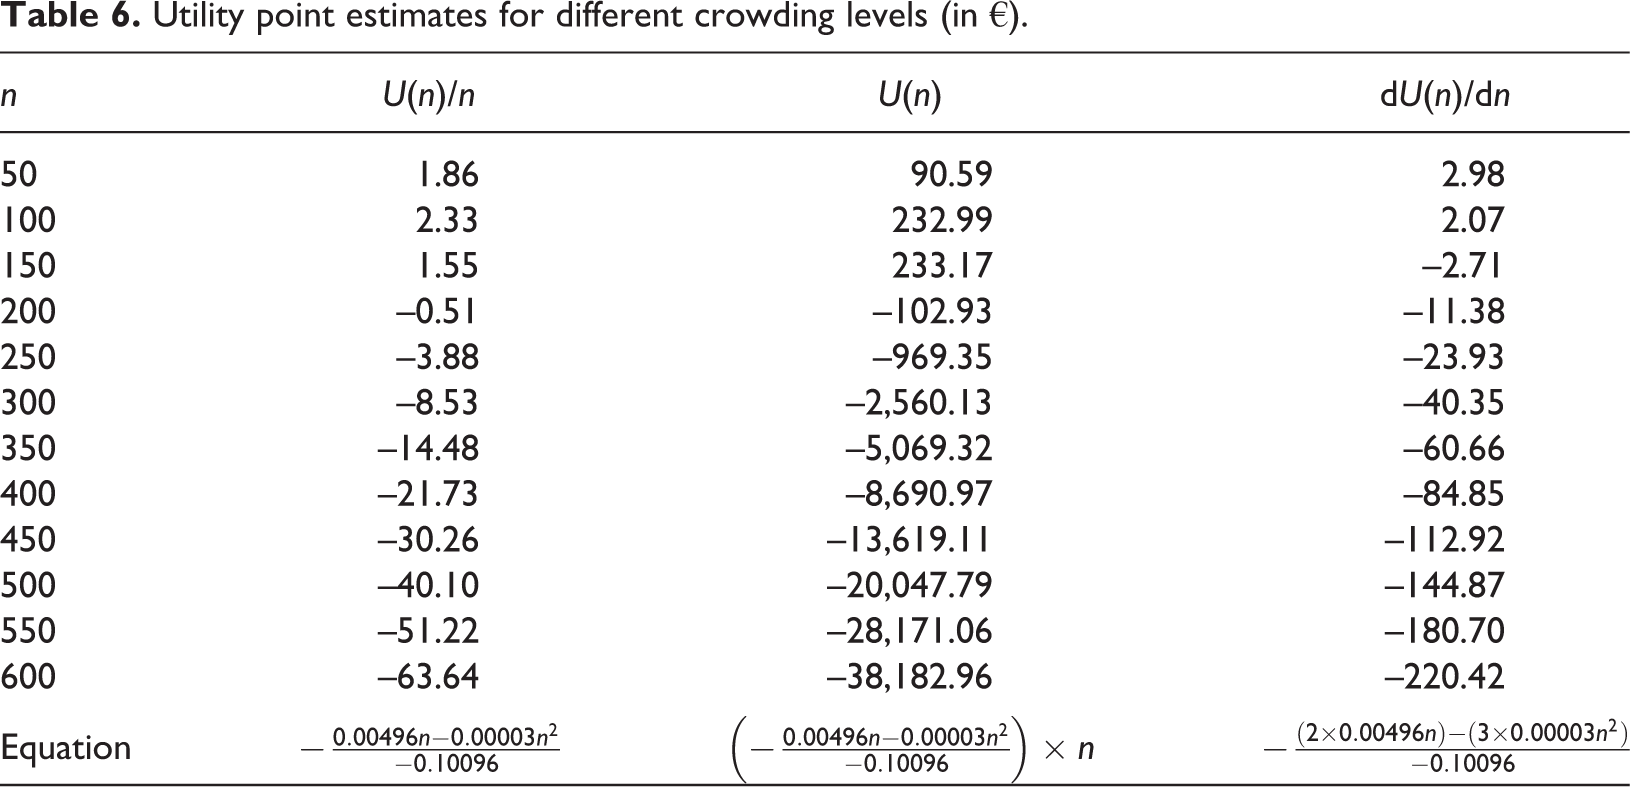
Since the choice experiment approach focuses on individual preferences, the initial coefficient estimates can also be interpreted as the average utility, given homogeneity of users (see Figure 1). The estimated values are proof of the curvilinear nature of crowding with a medium level of crowding being preferred over very high or very low use-levels. By taking the first-order derivative of U(n)/n and solving for zero, the use-level that maximises average utility (ni in Figure 1) is found at n = 95 (see Figure 4) with a per person monetary value of €2.34. From Table 6, it is then possible to infer that a drop in users from 95 to 50 would result in a utility loss of €0.48 per person. On the other hand, a sharp rise in use-level to 600 leads to an average personal utility loss of €65.98 per person. The negative utility values of higher crowding situations seem to agree with Stokols’ (1972) assumption that, in general, crowding is a negative concept.
Approximate optimal crowding level (100 people).
While ni is the optimal level of crowding from a personal point of view, as was discussed before, it is not a societal optimum since the difference between marginal utility and marginal cost is likely still positive at this level of use. Total and marginal place utility can easily be inferred from average utility (as seen in Table 6), the coefficients of the estimated mixed logit model correspondingly serve to identify the optimal societal use-level ns . If all costs are considered sunk costs – since an entrance fee does not have to be paid – the price level can be considered zero and total utility will be highest at the point where marginal utility equals zero: n = 127. Finally, the point where average personal utility becomes zero, coincides with the theoretical open access use-level no , found at a density of 190 people.
These results can be checked for consistency by comparing the optimal personal level ni with the preferred crowding situation measured by the photographic method. The ‘not at all crowded’ state, estimated at 44 people present on the picture, was preferred by 11.2% of respondents. The vast majority (68.2%) favoured the ‘not crowded’ level of approximately 86 persons visualized. A further 18.3% chose a ‘crowded’ level of, on average, 202 people, and the ‘very crowded’ state with 301 individuals was the preferential level for 1.1%. It is clearly noticeable the ‘not crowded’ level preferred by the majority of respondents compares quite well with the individual optimal level ni (n = 86 vs. n = 95), giving further validity to the utility effects found.
While the state of crowding did prove a valid and significant contributor to place utility, the willingness to pay values are rather limited, specifically when low crowding levels are concerned. This might suggest that crowding can mainly be considered a hygiene factor (Herzberg, 1964). The absence of crowding does not influence satisfaction to a large extent, though higher levels of crowding result in significant dissatisfaction. These results are also in line with the idea of loss-aversion and the importance of the point of reference from prospect theory (Kahneman and Tversky, 1979). The theory states that, if ‘crowded’ (n = 202) is seen as a baseline, more severe crowding levels (i.e. incurring a ‘loss’) will have larger utility effects than crowding levels evolving in a positive direction (i.e. receiving a ‘win’).
Crowding norms versus actual use-levels
As could be suspected, higher density levels, at least partly caused by tourism in tourist-historic city centres, could potentially have significant negative societal effects, even in highly developed urban destinations. It then becomes important to actively monitor existing use-levels and comparing these to the normative boundaries set by the resident surveys. In Antwerp, actual use-levels were recorded by camera on a 3-day period from Thursday 24 May 2012 to Saturday 26 May 2012. On average, the preferred crowding level was never reached, with the lowest average count standing at 16 people (±1.9 on a 90% confidence interval) on Thursday at lunchtime and the highest average count being 48 people (±5.8 on a 90% confidence interval) on Saturday afternoon, as shown in Figure 5. Therefore, on average there is still ample capacity left to attract tourists to the study area before crowding would significantly decrease utility to the local population.
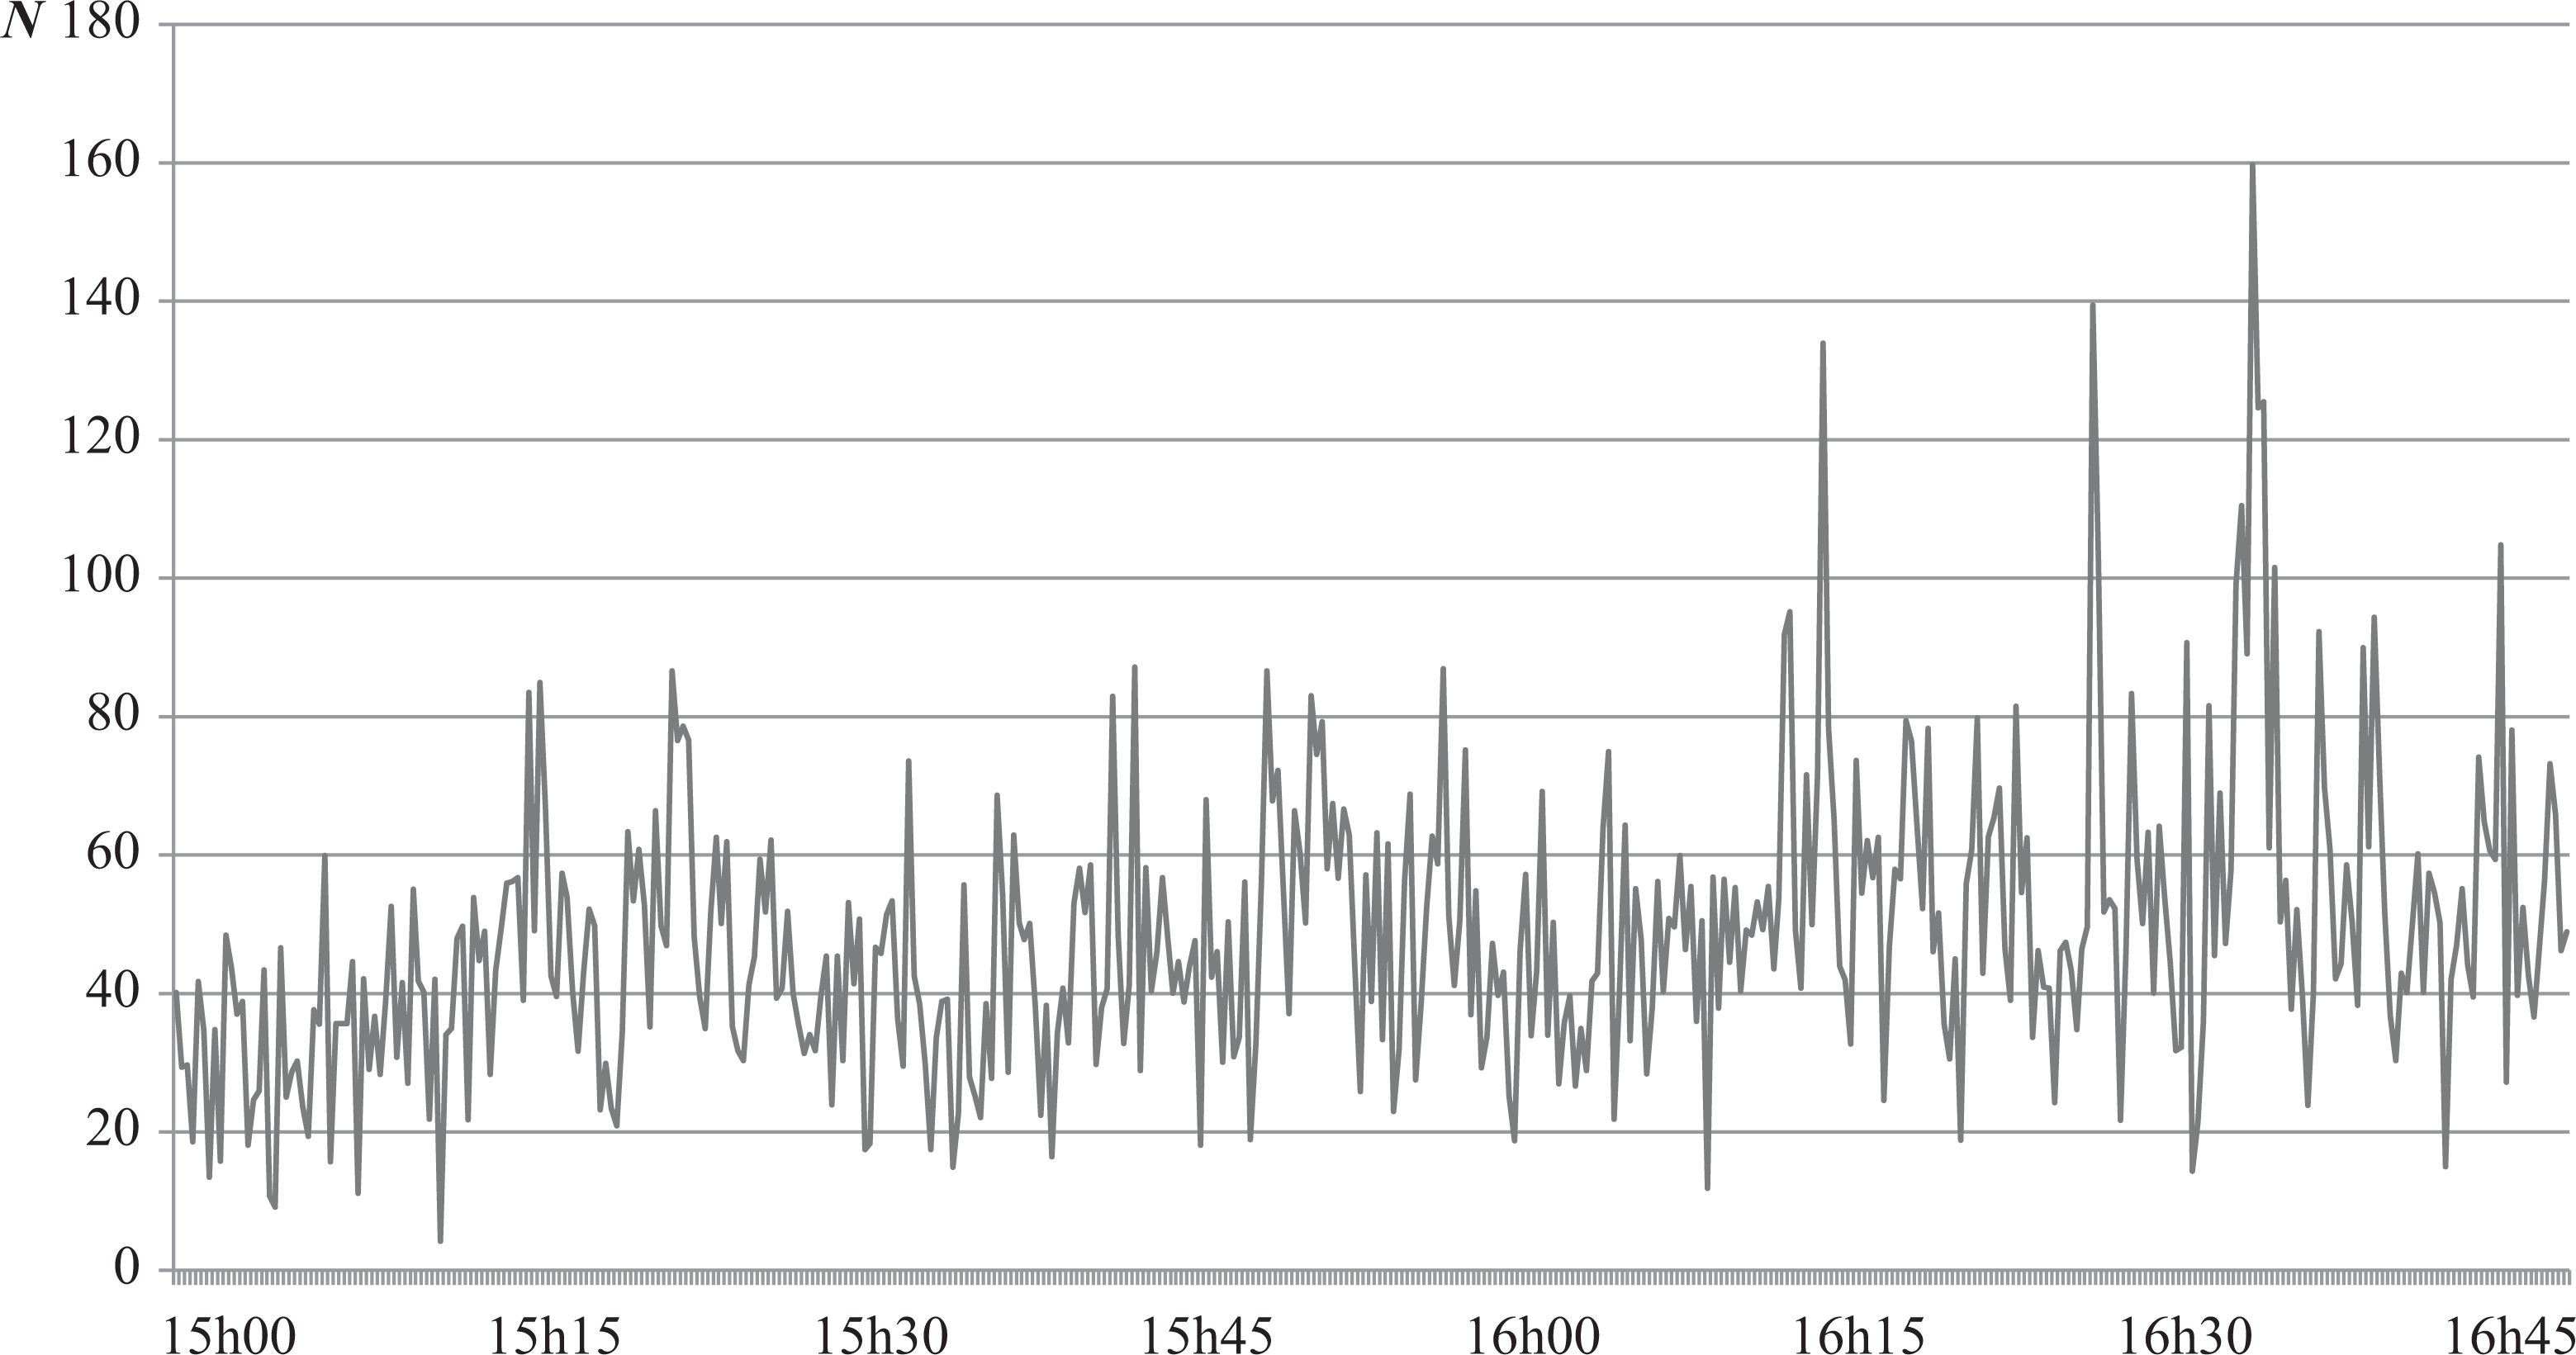
Number of people counted on 26 May 2012 at Meir, Antwerp.
Notwithstanding, use-levels and subsequent crowding effects are both time and place specific. The average use-levels found during the short observation period disguise the fluctuation around the mean. At a number of time points, density did exceed preferred (although never acceptable) crowding norms. Dependent on the time of visitation, crowding could consequently still be experienced by residents. Such an experience could, in turn, lead to adapted future expectations and behavioural consequences (e.g. site avoidance). Therefore even temporal situations of overcrowding might lead to more profound longer-term effects. While as of yet not a concern for Antwerp, in a number of other cities such as Bruges and Venice, tourist crowding has contributed to a ‘natural selection’ of space users and the creation of specific tourist areas within the city (Bryon, 2005; Russo, 2002).
Conclusions
Issues of sustainability are a primary concern in many destinations. While sustainability is most often equated with ecological reproducibility of natural resources, the social fabric of mature urban destinations can likewise be negatively affected by conditions of overcrowding. Developing standards of sustainability requires the identification of limits, or destination carrying capacity (Saarinen, 2006). When social carrying capacity is concerned, these limits are best set through a normative, democratic process. This article proposes an econometric approach in order to identify and quantify a crowding norm in a specific urban area. By keeping other crowding-related variables constant, the specific impact of use-level on place utility could be identified, uncovering personal and societal optima as well as personal acceptability thresholds. The empirical approach supported the theoretical assumption of a quadratic relationship with significant negative externalities of crowding on local residents specifically found for the higher crowding levels.
The results for the specific field study suggest that the sample of Antwerp residents was, in general, averse to levels of high-use density, with disutility effects of up to €65.97 per person for a change in use-level from n = 100 to n = 600. However, an – albeit limited – observation of real numbers of people present revealed that higher levels of crowding were seldom witnessed. The study findings are therefore in line with those of an earlier study which suggest that Antwerp as of yet does not experience threshold violations (WES, 2012). Nevertheless, it is advisable for local government to monitor the evolution in visitation since both overnight and day tourism is growing and it is important to recognise negative impacts at early stages of development in order to proactively manage a destination.
The methodology described in this article offers site managers a tool to empirically determine crowding norms and their relationship with place utility, in order to increase destination sustainability. Local decision makers are advised to regularly gauge crowding preferences from a sample of local residents in areas that might be sensitive to density issues, since crowding norms can also evolve through time. After identifying normative benchmarks through a stated (as described in this article) or revealed preference technique, actual use-levels can be monitored and evaluated. However, carrying capacity violations do not inevitably necessitate a limit on visitor numbers. This study uniquely focussed on use-level as the main element of crowding perception, keeping other influential variables fixed. Other studies have identified different aspects of the crowding experience (e.g. Manning, 1999; Neuts and Nijkamp, 2012), suggesting that interventions in personal or site-specific variables might serve in shifting the utility curve to the right, thus extending the norms to higher crowding levels.
Finally, it is necessary to acknowledge some limitations to the study. Since situational variables other than use-level were kept invariable and crowding is time and place specific, as well as dependent on the sample selection, results can only be interpreted for the given sample and the specific city area. Direct transferability of results is limited to the methodology. This method should now be extended to other city areas (e.g. residential areas as opposed to commercial areas) and other types of users (e.g. tourists instead of residents) for which it can be expected that norms will differ in order to further validate the theory. Another limitation and interesting opportunity for future research is the inclusion of interaction terms in the estimated logit model. While random taste variation in choices was accounted for by the mixed logit model, the inclusion of interaction terms between personal characteristics and crowding levels can help to distinguish between deterministic and random variation in coefficient estimates. As a result, additional insights could be generated through the intermediary effects of non-density variables, such as mode of transport, main reason for visiting the area, or place of residence. This knowledge could potentially serve to extend the transferability of the model results over other study areas.
Footnotes
Acknowledgements
The author would like to thank Professor Dominique Vanneste, Louise Derre and Vicky Steylaerts for valuable comments on an earlier draft of this article, and Jos Pyck for GIS-support.
Declaration of conflicting interests
The author(s) declared no potential conflicts of interest with respect to the research, authorship, and/or publication of this article.
Funding
The author(s) received no financial support for the research, authorship, and/or publication of this article.