
Abstract
The Pictorial Attitude Implicit Association Test (PA–IAT) has recently been proposed as new measure of implicit motives. We report a study that provides the first evidence for the convergent validity of the PA–IAT by showing that the PA–IAT correlates significantly with a standard measure of implicit motives [i.e. the Picture Story Exercise (PSE)]. Discriminant validity of the PA–IAT was verified in the sense that the PA–IAT shared virtually no common variance with explicit motive measures. Our analyses revealed that the PA–IAT and PSE can best be conceived as related but distinct measures. We further showed that the PA–IAT had incremental validity in predicting performance on a memory recall task over and above the PSE. In general, our results confirm that the PA–IAT is a valid measure of implicit motives and can serve as valid alternative to the PSE. Copyright © 2012 John Wiley & Sons, Ltd.
Research on implicit motives has expanded over the last decade. Theory has advanced (e.g. Schultheiss, Patalakh, Rawolle, Liening, & MacInnes, 2011) and new assessment techniques have been developed (e.g. Bernecker & Job, 2010; Slabbinck, De Houwer, & Van Kenhove, 2011). A basic premise behind implicit motive theory is that implicit motives operate outside a person's consciousness. As a result, implicit motives are traditionally assessed indirectly. The most popular indirect measure to assess implicit motives is beyond any doubt the Picture Story Exercise (PSE), a research version of the Thematic Apperception Test (McClelland, Koestner, & Weinberger, 1989). A PSE requires participants to write imaginative stories about four to eight pictures showing people in various social situations. Afterwards, the content of the stories is coded using coding schemes derived from motivational arousal studies (e.g. Winter, 1994).
Even though psychometric qualities of the PSE have regularly been questioned (e.g. Lilienfeld, Wood, & Garb, 2000), many studies have confirmed that the PSE scores can provide a valid and reliable measure of individual differences in implicit motives (Hibbard, 2003; Schultheiss, Liening, & Schad, 2008). Also, many studies have shown that PSE measures of implicit motives provided unique insights in important societal (Hofer et al., 2010), economic (e.g. Langan Fox & Roth, 1995) and political phenomena (e.g. Winter, 2010). Furthermore, a growing body of evidence shows that PSE scores correlate with biological processes such as brain activity and hormonal levels (see Schultheiss, Rösch, Rawolle, Kordik, & Graham, 2010, for an overview). For example, implicit power correlates with testosterone levels and predicts many of the same behaviours that are associated with high levels of testosterone (e.g. risk taking, occupying influential positions,…), suggesting that the implicit power motive represents the psychological manifestation of individual differences in testosterone levels (Stanton & Schultheiss, 2009).
However, at the same time, it is clear that the PSE has also its problems and limitations. First, the PSE requires a labour intensive administrative procedure. Each participant has to write stories about four to eight pictures, and each picture presentation and story writing episode is advised to last about 4–5 minutes. Afterwards, stories have to be content coded by one or two trained coders. An experienced coder needs between 2 and 5 minutes to score one PSE story. All this takes a lot of effort to gather data and to prepare data for analysis (Schultheiss & Pang, 2007). Second, little is known on the implicitness of the PSE measure (De Houwer, Teige–Mocigemba, Spruyt, & Moors, 2009). For example, it is generally assumed that participants are not aware of the psychological attributes that are assessed by the PSE (McClelland et al., 1989), yet empirical evidence to prove this assumption is scarce.
These limitations have stimulated researchers to look for alternatives to the PSE. Attempts to replace the PSE with direct, explicit questionnaire measures failed and in fact, reinforced the premise that implicit and explicit motive measures are measures of distinct constructs (Schultheiss, Yankova, Dirlikov, & Schad, 2009). The search for alternative indirect measures yielded more promising results. A particularly interesting class of indirect measures is the response latency techniques, with the Implicit Association Test (IAT) as most important representative (Greenwald, McGhee, & Schwartz, 1998). Contrary to the PSE scores, IAT scores are not derived from the content of the responses that participants provide but from the speed and accuracy with which participants allocate stimuli (e.g. ‘summer’, ‘wet’, ‘good’, ‘denial’, …) to two pairs of contrasted categories (e.g. ‘positive—negative’ and ‘sunshine—rain’). The basic principle of the IAT is that it should be easier to categorise stimuli when stimuli of related categories are assigned to the same response then when stimuli of unrelated categories share a response. For example, if a participant has a positive attitude toward flowers and a negative attitude toward insects, it should be easier to perform a task that requires a first response for names of flowers and positive words and a second response for names of insects and negative words compared with a task in which the response assignments are reversed (i.e. flower–negative, insect–positive). More generally, the strength of associations between categories is measured by the difference in performance on two tasks that differ in category–response assignments.
Compared with the PSE, the IAT requires a light administrative procedure and results in a nonsymbolic measure on which classical measurement validation procedures can be applied (De Houwer & Moors, 2010). As such, the IAT is less susceptible to many of the critiques raised against the PSE. It is therefore not surprising that motive researchers started to apply the IAT to assess implicit motives (Brunstein & Schmitt, 2004; Sheldon, King, Houser–marko, Osbaldiston, & Gunz, 2007; Slabbinck et al., 2011). Brunstein and Schmitt (2004) were the first to use the IAT instead of the PSE to assess the implicit achievement motivation. After completion of the IAT and self–ratings of achievement motivations, participants completed a mental concentration task, either in presence or absence of achievement–related feedback. In line with the research of Biernat (1989) who established her results by means of the PSE, Brunstein and Schmitt (2004) found that the IAT measure of the achievement motive was not correlated with the self–rating, and that the IAT uniquely predicted performance on the mental concentration task (i.e. behavioural outcome) only when participants received achievement–related feedback. Sheldon et al. (2007) were the first to compare the performance of the IAT with the PSE. In line with Brunstein and Schmitt (2004), they concluded that the PSE and IAT predicted behavioural outcome variables. Yet, they posited that the PSE and IAT predicted different classes of behaviour. According to these authors, the IAT is more suited to predict behaviour in competitive settings (e.g. when one has to choose between two options), whereas the PSE is more appropriate to predict general behavioural trends.
The research presented in this paper builds on the work of Slabbinck et al. (2011) who developed and validated a pictorial attitude variant of the IAT for the assessment of the implicit power motive, need for power. Contrary to Brunstein and Schmitt (2004) and Sheldon et al. (2007), Slabbinck et al. used pictorial instead of verbal stimuli as exemplars of the motive concept and employed affective target categories (i.e. ‘attractive’ versus ‘not attractive’) instead of target categories that represented the self–concept (i.e. ‘I’ versus ‘Others’). According to Slabbinck et al., pictorial stimuli were more suited to assess implicit motives because implicit motives are assumed to be based on pre–verbal experiences (McClelland & Pilon, 1983). Moreover, pictorial stimuli are less susceptible to contextual variations which make them more appropriate to capture stable traits such as implicit motives (Foroni & Bel–Bahar, 2010; Gschwendner, Hofmann, & Schmitt, 2008). They employed affective target categories to further maximise the methodological correspondence with the PSE which is designed to assess primarily the affective aspect of motives (McClelland et al., 1989). In the first two experiments, Slabbinck et al. showed that the Pictorial Attitude IAT (PA–IAT) correlated more highly with other measures of implicit motives than non–pictorial or non–affective variants of the IAT did. Furthermore, the results of the first two experiments indicated that, similar to the PSE, the PA–IAT predicted general behavioural trends. In the third experiment, the validity of the PA–IAT was validated experimentally in a way similar to how traditional content coding measures were validated (see Smith, 1992, for an overview). More specifically, need for power was aroused for half of the participants before the PA–IAT assessment of need for power. After need for power assessment, participants completed a memory recall task. The results showed that the PA–IAT effect was larger in the motive–arousal condition than in the neutral condition and that PA–IAT correlated with performance on the memory recall task only if implicit motives were aroused. One important limitation of the work of Slabbinck et al. (2011) is that they used an adapted version of the Multi Motive Grid (MMG: Sokolowski, Schmalt, Langens, & Puca, 2000) to validate their PA–IAT. The MMG is a semi–quantitative measure that is frequently used for the assessment of implicit motives. To complete the MMG in Slabbinck et al. (2011), participants were exposed to seven pictures that aroused need for power and seven pictures that aroused other implicit motives. Instead of writing stories of the situation depicted on pictures, participants indicated on a 7–point Likert scale to which extend the pictures made them feel good or bad. As such, this semi–quantitative measure combined features of the PSE (i.e. pictorial stimuli) with features of explicit measures (i.e. Likert scale). Schultheiss et al. (2008) showed that such a semi–quantitative measure tends to converge with explicit motive measures and thus fails to capture important aspects of implicit motive measures. Given that the PSE is generally considered as the standard measure of implicit motives, strong conclusions about the validity of the PA–IAT can be reached only after examining the relation between the PA–IAT and PSE measures.
Current Research
The aim of the present research is to explore the convergent, discriminant and incremental validity of the PA–IAT measure vis–à–vis the PSE measure. To accomplish this, we conducted a study in which the power motive of participants was measured with the PA–IAT, the PSE and an explicit measure of need for power. We expected the PA–IAT and PSE measures to correlate significantly because the methodological correspondence between both measures was maximised and because of the preliminary evidence that Slabbinck et al. (2011) provided for the validity of the PA–IAT as a measure of implicit motives. Yet, based on earlier studies that compared different implicit measures of the same construct (e.g. Bosson et al., 2000; Fazio & Olson, 2003), we expected the size of this correlation to be in the medium range at best. This is because need for power is a complex and multifaceted construct of which different measures may tap separate, unrelated components. In addition, implicit measures are less affected by people's self–presentation bias (Bosson et al. 2000; De Houwer et al., 2009). As a result, intercorrelations among implicit measures are more likely only to reflect similarities in the to–be–measured construct, whereas intercorrelations among explicit measures may reflect similarities in self–presentation bias as well as similarities in the to–be–measured construct (Bosson et al., 2000). Next, because implicit and explicit motive measures are measures of distinct constructs (Schultheiss et al., 2009), we did not expect the PSE nor the PA–IAT to correlate with the explicit need for power measure. To examine predictive and incremental validity, we included measures of declarative and non–declarative behaviour. First, based on ample empirical evidence showing that implicit motives predict non–declarative behaviour rather than declarative behaviour, only when need for power was aroused, we expected that both the PSE and PA–IAT measures of need for power would predict non–declarative behaviour, only when need for power was aroused. These predictions are based upon the traditional motive—incentive—behaviour model of motivation (McClelland et al., 1989) and the gatekeeper model (Perugini, Conner, & O'Gorman, 2011; Perugini & Prestwich, 2007). The main idea behind these models is that individual differences in implicit attitudes, personality and motive dispositions predict behaviour only when the underlying construct is aroused. Second, based on Sheldon et al. (2007) who posited that the IAT and PSE are measures of different aspects of implicit motives, one could argue that applying both measurement instruments for the assessment of implicit motives might provide a better insight in one's implicit motives. However, because the PA–IAT differs in several and important ways from the IAT that Sheldon et al. (2007) used, we did not have a priori expectations about the incremental validity of the PA–IAT and PSE.
Design and Participants
All participants completed the PA–IAT, the PSE and an explicit measure of need for power. After the motive measures, participants were exposed to the experimental manipulation in which need for power was aroused for half of the participants. At the end of the experiment, participants performed tasks that probed non–declarative and declarative behaviours.
Because the order of presentation of implicit and explicit measures does not alter their psychometric properties or their intercorrelation (Hofmann, Gawronski, Gschwendner, Le, & Schmitt, 2005; Nosek, Greenwald, & Banaji, 2005), we presented the motive measures in a fixed order. Also, we choose to fix the order of the measures to reduce error variance (Perugini, Richetin, & Zogmaister, 2010) and to limit the large sample size requirements if presentation of all the measures would have been counterbalanced (Karpinski & Steinman, 2006). Note that if the order of the measures should still have an effect on their intercorrelations, it is most likely that explicit measures influence implicit measures rather than in the inverse order (Bosson et al., 2000). Because our focus was on testing the validity of the PA–IAT, we presented this measure first, followed by the PSE and the explicit measure.
We recruited 106 undergraduate university students for participation in our experiment. Students participated for partial fulfilment of additional course requirements. Participants were tested in groups of up to six participants at a time. They were seated in cubicles isolating them from outside views and noises. After controlling for fast responses in the IAT (Greenwald, Nosek, & Banaji, 2003) and missing data, 100 participants (55 women, 45 men) were included in our final sample. Mean age was 20.35 (SD = 0.56). Fifty–one participants were assigned to the power–arousal condition, and forty–nine were assigned to the control condition.
Measures and Materials
Pictorial Attitude Implicit Association Test
For the PA–IAT, we used the same stimuli as proposed by Slabbinck et al. (2011). That is, for the target categories, we employed the labels ‘attractive’ and ‘not attractive’, whereas for the attribute categories, we used ‘power’ versus ‘non–power.’ The stimuli representing the attribute categories featured pictures that represented power situations (e.g. standing man leaning with clenched fists over a conference table) or non–power situations (e.g. kids playing). For the target categories, we used the stimuli ‘nice’, ‘friendly’, ‘pleasant’, ‘great’, ‘lovely’ and ‘decent’ to designate attractive, whereas we included ‘creepy’, ‘unpleasant’, ‘nasty’, ‘unfavourable’, ‘annoying’ and ‘undesired’ to represent not attractive. Like all other tasks, the PA–IAT was programmed and administered using INQUISIT Milliseconds software (2008). We applied the standard IAT procedure (Greenwald et al., 1998) and calculated IAT effects using the improved scoring algorithm proposed by Greenwald et al. (2003). We estimated internal consistency of the IATs by dividing each combined block into two sub–blocks of equal length. The first block comprised the even trials and the second the odd trials. Next, we calculated the IAT effects for each sub–block. The Spearman–Brown coefficients revealed a good split–half reliability (PA–IAT: r = .85).
Picture Story Exercise
For the PSE, participants were asked to write imaginative stories about five pictures: ship captain, woman and men arguing, hooligan attack, men on ship deck and nightclub scene. All these pictures have regularly been used in previous research on power motive (see Schultheiss & Pang, 2007, for an overview and broader description of these pictures). Participants first viewed each picture for 10 seconds and then had up to 5 minutes to write a story. Participants could not proceed to the next picture before 3 minutes had passed. The order of the pictures was randomised across participants. Stories were scored for motivational imagery by two independent scorers using Winter's Manual for Scoring Motive Imagery in Running Text (1994). Imaginative stories were scored on need for power, need for achievement and need for affiliation. Need for power scores were calculated to establish convergent validity between the PSE and PA–IAT measures and need for affiliation and need for achievement scores were calculated to establish the discriminant validity of the PA–IAT measure. Power imagery was scored whenever a character in the story (i) engaged in a strong forceful action which inherently have impact on other people or the world at large; (ii) tried to control or regulate others; (iii) attempted to influence, persuade, convince, make or prove a point; (iv) gave unsolicited help, support or advise; (v) tried to impress others or the world at large; (vi) mentioned (his concern about) his fame, prestige or reputation; and (vii) reacted emotionally to actions of other persons. Need for achievement was scored whenever a character in the stories (i) expressed a standard of excellence by using adjectives that positively evaluate performances; (ii) described goals and performances in ways that suggest positive evaluations, (iii) mentioned victories or competition with others without acts of aggression or power, (iv) expressed disappointment about failure or lack of excellence; or (v) mentioned unique accomplishment. Finally, affiliation imagery was scored whenever a story character (i) showed positive or intimate feelings towards other persons or nations; (ii) expressed sadness about separation or disruption of friendly relationships, or wanted to restore it; (iii) was engaged in affiliative, companionate activities; or (4) performed a friendly, nurturant act.
Before scoring the PSE stories, both scorers attained at least 85% interrater agreement on the calibration material provided by Winter's scoring manual. Interrater reliability between the two scorers was satisfactory for all scored motives (Spearman–Brown coefficient: r > .84). Participants wrote on average 483.77 words (SD = 152.94), containing 5.49 need for power excerpts (SD = 2.26), 3.97 need for affiliation excerpts (SD = 2.32), and 2.01 (SD = 1.67) need for achievement excerpts across the five pictures. Because all motive scores were positively correlated with the length of the written stories, the obtained motives scores were corrected for the story length. For this, we regressed the raw motive scores on story length and used the standardised residuals as motive scores for our analyses.
Explicit measure
Explicit need for power was measured by the dominance and aggression subscales of the Personality Research From (PRF: Jackson, 1984), a self–report inventory of motivational needs. These subscales were chosen for their similarity to the coding categories for need for power. Participants were asked to what extent each statement fitted them. Sample items of the dominance scale and aggression scale were ‘The ability to be a leader is very important to me’ and ‘When I am irritated, I let it be known’, respectively. Both scales consisted of 16 5–point Likert–type items with anchors 1 = ‘Fits not at all’ and 5 = ‘Fits very well’. For both scales, we calculated the individual measures as the mean score of the scale items and high scores indicated a good fit between the trait and the participants. Both scales showed satisfactory internal consistency (PRF dominance: α = .87; M = 3.33; SD = 0.55; PRF aggression: α = .72; M = 3.15; SD = 0.45).
Experimental manipulation
For the experimental manipulation, we used autobiographical narratives. Narrative studies have consistently shown relations between specific implicit motives and the content of the autobiographical narratives (McAdams, 1982; Woike, 2008). Importantly, asking participants to write specific autobiographical narratives has repeatedly been shown to arouse specific motivations (e.g. Slabbinck et al., 2011; Woike, 2008; Woike et al., 2009). Participants were randomly assigned to either a control condition or a power–arousing condition. In the control condition, participants were asked to write down a common, everyday experience, that is, the routine events of a typical day. In the power–arousal condition, participants described as vividly and as detailed as possible a memory of a significant event where they dominated the situation and had control over others.
Non–declarative behaviour
The procedure that served as an input for the non–declarative behaviour measure was a memory recall task that was borrowed from Woike et al. (2009, Study 1). For this task, participants first received a randomised list of 14 pretested neutral words and 14 power–related words. For each given word, they were instructed to write down the first word they spontaneously associated with the displayed word. When this was finished, participants were first asked to recall the displayed words, then the self–generated words and finally the pairs of displayed and self–generated words. Participants could enter their answers one at a time on a computer. After finishing this final part of the experiment, the number of recalled displayed words, the number of recalled self–generated words, and the number of recalled word pairs of self–generated and displayed word pairs were summed up to construct the dependent variables. Power–related words and neutral words were summed up separately. Because the capacity of memory is limited, the nature of recalled words (i.e. neutral vis–à–vis power–related words) is indicative for the processes underlying the memory input. In the condition that was designed to arouse need for power, it was expected that implicit need for power was related to the number of recalled power–related words. No such relation was expected in the neutral experimental condition. Contrary to Slabbinck et al. (2011), we aggregated the number of displayed words, self–generated words and pairs of displayed and self–generated words in one measure for the power–related words and one measure for the neutral words. As an anonymous reviewer pointed out, there is no theoretic ground why we should expect different predictions for self–generated, displayed words, or word pairs in their relation to the PSE vis–à–vis the PA–IAT. Furthermore, separate dependent variables for the displayed, self–generated and word pairs would result in too many tests for significant differences in correlations which would seriously inflate the alpha error.
Declarative behaviour
Finally, task enjoyment was assessed. Because task enjoyment is reflective for the participant's conscious appraisal of how much he or she liked or disliked the task, task enjoyment can be qualified as a measure of declarative behaviour (McClelland et al., 1989). Participants rated the different parts of the memory recall task on how enjoyable they found each part, that is, (i) generating words; (ii) recalling the displayed words; (iii) the self–generated words; and (iv) the pairs of displayed and self–generated words. Answers were administered on 7–point Likert–scales with the anchors 1 = ‘Not enjoyable at all’, through 7=‘Very Enjoyable’. We calculated the individual measures as the mean score of the four scales. Internal consistency of these scales was satisfactory (M = 3.71; SD = 1.26; α = .85).
Results
Associations between motive measures
To examine the relations between the motive measures, we determined the correlations between all motive measures. As shown in Table 1, the PA–IAT and PSE measures of need for power were moderately correlated (r = .31; p < .01). Correlations of the PA–IAT need for power measure with the PSE need for achievement measure, the PSE need for affiliation measure and the explicit need for power measures were not significant (p > .05).
Correlations and descriptives of the motive measures
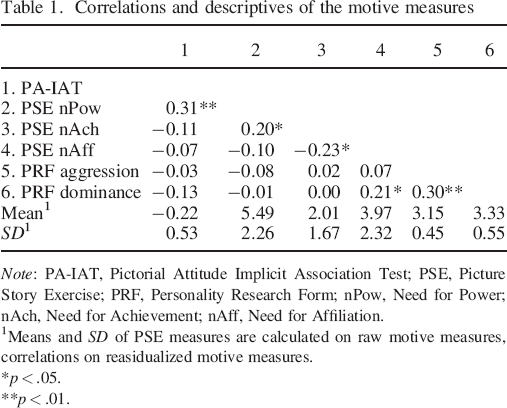
Note: PA–IAT, Pictorial Attitude Implicit Association Test; PSE, Picture Story Exercise; PRF, Personality Research Form; nPow, Need for Power; nAch, Need for Achievement; nAff, Need for Affiliation.
Means and SD of PSE measures are calculated on raw motive measures, correlations on reasidualized motive measures.
p < .05.
p < .01.
Associations with outcome variables
Table 2 presents the zero–order correlations between the motive measures and the number of recalled power–related words and the number of recalled neutral words across the power arousal and neutral condition. In the power–arousal condition, both the PA–IAT and PSE measures of need for power correlated significantly with the number of recalled power words. Fisher r–to–z transformations revealed that this correlation was significantly higher in the power–arousal condition than in the neutral condition for the PA–IAT measure of need for power but not for the PSE measure of need for power. The number of recalled power words was not correlated with any of the PRF measures. The PRF Aggression and PRF dominance measures were negatively and significantly correlated with number of recalled neutral words. The PSE measures of need for affiliation and need for achievement did not correlate with any of the outcome variables across both experimental conditions. Finally, and somewhat surprisingly, the declarative measure, task enjoyment, was only significantly correlated with the PSE measures of need for power and need for affiliation in the neutral condition. Correlations with task enjoyment were not significant in any other condition and for any other motive measure.
Correlations of motive measures with non–declarative and declarative outcome variables across conditions
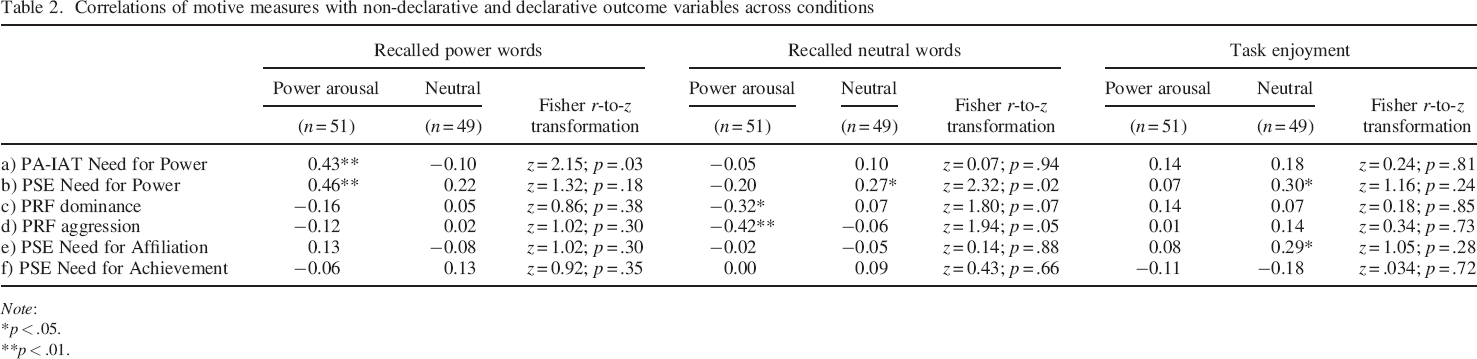
Note:
p < .05.
p < .01.
The results so far, revealed that the PA–IAT and PSE measures of need for power shared a significant amount of variance and were related to similar behavioural outcome variables. However, what is not yet clear is whether the PA–IAT and PSE measures of need for power are interchangeable or complementary to each other. As such, we performed hierarchical regression analyses to determine the unique contribution of the PA–IAT and PSE measures of need for power in predicting behaviour. Because both measures were systematically related to the number of recalled power words only when need for power was aroused, we analysed only the data of the power–arousal condition. In total, we conducted four regressions. In the first regression model, we entered the PA–IAT as single predictor, and in the second regression model, we entered the PSE measure as single predictor. Afterwards, we included both the PA–IAT and PSE measure in the third regression model and compared the incremental fit of the third regression model with the fit of the first and the second model. Finally, in the fourth regression model, we also included the interaction term of the PA–IAT and PSE measure and assessed whether the interaction between the PA–IAT and PSE measure improved model fit (compared with the fit of Model 3). Table 3 contains the standardised regression coefficients of all estimated regression models. Of most interests to understand the interchangeability of the PA–IAT and PSE measures are the changes in model fit. The significance of the changes in Rβ revealed that a model with both the PA–IAT and PSE measures of need for power outperformed the models that comprised only the PA–IAT or PSE measure of need for power. Furthermore, the data indicated that the interaction between the PA–IAT and PSE measures of need for power did not improve model fit for any model, suggesting that the PA–IAT and PSE operate independently of each other.
Standardised regression coefficients of hierarchical regression models predicting the number of recalled power words with implicit need for power measures in the power arousal condition
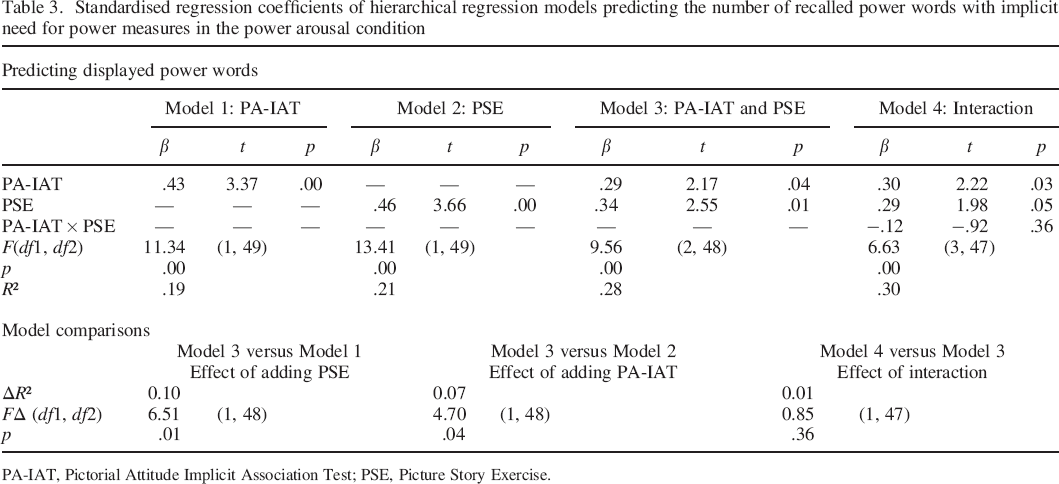
PA–IAT, Pictorial Attitude Implicit Association Test; PSE, Picture Story Exercise.
Discussion
Our results confirmed that the PA–IAT is a valid measure of implicit motives. In line with the findings of Slabbinck et al. (2011), we found that the PA–IAT correlated with performance on a mental recall task only if implicit motives were aroused. As such, our results provided also further support for the gatekeeper model (Perugini et al., 2011, Perugini and Prestwich, 2007) and the motive–incentive–behaviour model of motivation (McClelland et al., 1989). More importantly, our results also go beyond those of Slabbinck et al. (2011) by showing that the PA–IAT correlates with the current standard measure for implicit motives (i.e. PSE). Discriminant validity of the PA–IAT with the PSE measures was evidenced by the fact that the PA–IAT measure of need for power was not correlated with PSE measures of need for achievement and need for affiliation. In addition, discriminant validity of the PA–IAT and PSE measures of need for power compared with the PRF measures was verified in the sense that they shared virtually no common variance with the PRF measures, which in fact confirms the basic premise that implicit and explicit motive measures are measures of distinct constructs (Schultheiss et al., 2009). In sum, the PA–IAT has more in common with the PSE than with the explicit measure. These two measures can best be conceived as distinc, but related measures. Yet, both measures are far from identical.
There are at least three possible reasons for why the PSE and PA–IAT did not fully converge. First, even though the PA–IAT was designed to minimise the methodological differences between the IAT and PSE, it is plain that the measurement procedure from which the PA–IAT score is derived still differs substantially from the procedure from which the PSE score is derived. For example, the PSE is a symbolic measure and infers psychological traits from the content of stories that participants give of pictorial stimuli, whereas the PA–IAT is a nonsymbolic measure that infers psychological traits from the speed with which (pictorial) stimuli can be correctly categorised (De Houwer & Moors, 2010). This and other methodological differences could have attenuated the correlation between both measures. Unfortunately, the current research does not allow us to split method from trait variance. For this, a multitrait–multimethod approach in which multiple motives are measured by both the PA–IAT and the PSE could bring new insights into the relation between different classes of implicit measures.
Second, also procedural factors could have attenuated the correlation between the PA–IAT and PSE. To minimise error variance and to limit the sample size requirements, we fixed the order between the different motive measures. However, we did not do so within the PA–IAT and PSE measures: the order of presentation of the pictures was randomised in the PSE and compatible and incompatible tasks were counterbalanced in the PA–IAT. Counterbalancing could have cancelled out any order effect within each measure but might have attenuated the correlation between the PA–IAT and PSE (Perugini et al., 2010).
Third, the mediocre correlation between the PA–IAT and PSE could indicate that implicit motives are indeed complicated and multifaceted constructs and that the PA–IAT and PSE partially tapped into different components of implicit motives. For example, for the PSE we scored stories on power imagery whenever a character in the story engaged in one of seven predefined actions (see above). This defragmentation of implicit motives into seven different components does not fully correspond with the general, yet comparative approach of motives in the PA–IAT (i.e. categorization of power–related stimuli as attractive versus not attractive). Perhaps, a series of (brief) PA–IATs each aiming at one specific component of power could clarify this and other issues of convergent validity.
It is, however, important to notice that a correlation of 0.31 is mediocre in absolute terms (Cohen & Cohen, 1983) but can be considered as large when compared with other reported correlations among various implicit measures. For example, Bosson et al. (2000) observed null relations among a variety of implicit measures of self–esteem. Also Fazio and Olson (2003) concluded in their review of implicit measures that low correlations among implicit measures are a prevalent finding in the literature on implicit measures.
The present study demonstrated that the PA–IAT had incremental validity in predicting performance on the mental recall task over and above the PSE. Even though the PSE was significantly related to the number of recalled power words, adding the PA–IAT to the model improved the model fit significantly (and vice versa). However, one could argue that the incremental validity of the PA–IAT and PSE is perhaps too limited to justify the administration of both measures. Instead, given the advantages of the PA–IAT in terms of ease of application, one could opt to apply only the PA–IAT, certainly for single–motive measurements.
The present study yielded also some unexpected results. None of these involved the PA–IAT that is central to our paper. Nevertheless, because they might point to interesting caveats in our understanding of (measures of) implicit motives, we now discuss the potential implications of each of these findings. First, in general and as expected, we found little overlap between implicit and explicit motive measures. The only exception to this pattern was the PRF dominance measure that showed a positive correlation with the PSE need for affiliation measure. To the best of our knowledge, a significant positive correlation between PRF need for power and PSE need for affiliation has not yet been found in previous research. Yet, studies that applied alternative motive measures have already reported significant and positive correlations among need for affiliation and need for power measures (e.g. King, 1995; Sokolowski et al., 2000) or among implicit motives and qualitatively different explicit motives (e.g. King, 1995; Pang & Schultheiss, 2005). A speculative explanation for this relation would be that some participants who perceive themselves as powerful, persuasive and decisive exert power not because they like having impact on others but just to obtain friendship in return for their powerful acts (e.g. providing unsolicited help or acting as a hero in order to be accepted by others). Further research on this issue could thus deepen our understanding of the relations among implicit and explicit motives.
Second, neither implicit nor explicit measures of need for power were correlated with task enjoyment when need for power was aroused. Because task enjoyment reflects the conscious appraisal of how much the participant liked working on the task, the measure of task enjoyment is an indicator of deliberate behaviour and should therefore be related to explicit motive measures but not to implicit motive measures (McClelland et al., 1989). The absence of a correlation between the implicit need for power measures and task enjoyment is in line with this idea. However, the lack of correlation among the explicit need for power measures and task enjoyment was unexpected. Perhaps the PRF dominance and aggression measures were unrelated to task enjoyment because the recall task did not provide a clear power motive incentive. Inclusion of a norm with which participants could compare their performance (e.g. the average number of recalled words by other participants) or the inclusion of a public high–score list on which participants could post their performance (e.g., Schultheiss & Brunstein, 1999) might make the task more enjoyable for power motivated participants which on its turn, might result in a positive correlation between task enjoyment and the explicit need for power measure.
Third, we also found a significant effect of PSE need for power and PSE need for affiliation on task enjoyment in the neutral condition. This seems to contradict the idea that motives need to be activated in order to influence behaviour. A post hoc explanation of this finding is that motives were activated in the neutral condition, not by task instructions but by the mere presence of others during the experiment (i.e. the experimenter and/or other participants) which might have triggered processes of impression management (Puntoni & Tavassoli, 2007). In this view, it is likely that participants high in need for power or high in need for affiliation exaggerated their responses to explicit questions (Paulhus & John, 1998). Power motivated people would do so in order to leave a good impression, whereas affiliation motivated people would do so in order to please the experimenter and to obtain approval (Paulhus & John, 1998). Of course, this interpretation is entirely post hoc and should thus be treated with caution until new data are available.
Finally, we found also unexpected correlations between recollection of neutral words and PRF dominance (r = −.32) and aggression measures (r = −.43) in the power–arousal condition. According to Woike, McLeod, and Goggin (2003), explicit motives are linked to general and self–descriptive knowledge, whereas implicit motives are linked to specific and emotional knowledge. This could explain why (PRF) indicators of explicit need for power are negatively linked to the recollection of neutral words (i.e. non self–descriptive and specific knowledge) after power arousal: power arousal might have directed someone's attention to self–descriptive, specific and emotional cues. Obviously, further study is needed to confirm and to explain this interesting phenomenon.
Our studies also have some limitations. First, our criterion focused on the relation between the implicit power motive and memory processes. As such, our criterion measure investigated cognitive processes that direct behaviour rather than actual behaviour. Our findings show that the PA–IAT is useful for the functional analysis of how implicit motives influence behaviour, but it still needs to be investigated whether the (need for power) PA–IAT is also able to predict actual motive relevant behaviour such as making the first move in a prisoner dilemma game (Terhune, 1968), or the attentional orientation to dominant and submissive facial expressions (Schultheiss and Hale, 2006). Hopefully, this research encourages other researchers to use the PA–IAT for the assessment of implicit motives so that its validity can be developed over multiple studies with multiple criteria and diverse samples. Second, so far, the PA–IAT has been applied only to assess need for power. It still needs to be examined whether the PA–IAT could be a useful measurement instrument for studying need for achievement and need for affiliation.
To conclude, this research provided additional evidence that the PA–IAT is a valid measure of implicit motives. Given its practical advantages, we hope that the PA–IAT will help achieve a better assessment of implicit motives and will yield a superior understanding of the functioning and the effects of implicit motivational processes.
Footnotes
Acknowledgements
We highly appreciate the suggestions provided by three anonymous reviewers, as well as the associate editor, Manfred Schmitt. We wish to thank Oliver Schultheiss and Joyce Pang for their assistance in selecting the pictures we used for the PSE. We also thank Eline Leen and Nick Callebaut for scoring the PSE stories.