
Abstract
Personality–outcome associations, typically represented using the Big Five personality domains, are ubiquitous, but often weak and possibly driven by the constituents of these domains. We hypothesized that representing the associations using personality questionnaire items (as markers for personality nuances) could increase prediction strength. Using the National Child Development Study (N = 8719), we predicted 40 diverse outcomes from both the Big Five domains and their 50 items. Models were trained (using penalized regression) and applied for prediction in independent sample partitions (with 100 permutations). Item models tended to out–predict Big Five models (explaining on average 30% more variance), regardless of outcomes’ independently rated breadth versus behavioural specificity. Moreover, the predictive power of Big Five domains per se was at least partly inflated by the unique variance of their constituent items, especially for generally more predictable outcomes. Removing the Big Five variance from items marginally reduced their predictive power. These findings are consistent with the possibility that the associations of personality with outcomes often pertain to (potentially large numbers of) specific behavioural, cognitive, affective, and motivational characteristics represented by single questionnaire items rather than to the broader (underlying) traits that these items are ostensibly indicators of. This may also have implications for personality–based interventions. Copyright © 2018 European Association of Personality Psychology
Introduction
Among the central questions of personality research are associations of personality characteristics with life outcomes, defined as phenomena that could potentially be influenced by personality (Mõttus, 2016). From an applied perspective, understanding these associations may allow for the identification of people at risk of negative life outcomes, such as unemployment or diabetes, and for the discovery of potentially modifiable risk factors related to these outcomes (e.g. specific academic difficulties or health–related lifestyle aspects). From a psychological–theoretical point of view, delineating these associations allows for understanding where, to what extent, and perhaps even how personality may play out in people's lives. We argue that achieving these aims can benefit from the most accurate possible description of how personality is associated with outcomes, even if this means very nuanced patterns of associations—in which case, this very realization is telling.
Most commonly, personality–outcome associations are represented using the five broad domains of the five–factor model (McCrae & John, 1992) or the Big Five (Goldberg, 1990): conscientiousness, extraversion, agreeableness, neuroticism, and openness. Based on this representation, the associations are ubiquitous. However, we argue, they tend to be relatively weak and are often unspecific, such that even very different outcomes are related to similar trait combinations. One potential way to improve the accuracy and specificity of the associations may be to investigate them using a larger set of narrower, more specific personality traits than the Big Five. Although personality facets (e.g. McCrae & Costa, 2010; Soto & John, 2017) can be useful for this, recent work suggests that even single–personality questionnaire items contain unique information that may be lost in aggregation (e.g. Mõttus, Kandler, Bleidorn, Riemann, & McCrae, 2017; Mõttus et al., in press). In this study, therefore, we explore the usefulness of single questionnaire items as personality markers (analogous to genetic markers in molecular genetics research) in accounting for the variance in 40 outcomes representing individual differences in a variety of life domains. Specifically, we focus on items’ predictive accuracy for these outcomes in comparison with the Big Five traits and address the possibility that Big Five–outcome associations tend to be at least partly driven by the items that happen to be included in them rather than (only) by the latent traits purportedly underlying the Big Five scores.
Representing Personality–Outcome Associations Using Domains, Facets, and Items
Domains
The Big Five personality domains are robustly associated with a wide range of broad life outcomes, such as physical and mental health (e.g. Goodwin & Friedman, 2006) or success in education, career, and relationships (e.g. Damian, Su, Shanahan, Trautwein, & Roberts, 2015; Poropat, 2009; Roberts, Kuncel, Shiner, Caspi, & Goldberg, 2007). In addition, several of the domains are linked to more specific outcomes, such as drinking or smoking (Malouff, Thorsteinsson, Rooke, & Schutte, 2007; Malouff, Thorsteinsson, & Schutte, 2006), relationship satisfaction (Malouff, Thorsteinsson, Schutte, Bhullar, & Rooke, 2010), volunteering (Carlo, Okun, Knight, & de Guzman, 2005), exercising (Rhodes & Smith, 2006), or voting choices (Vecchione et al., 2011). Although ubiquitous, the associations are often modest in strength, with most effect sizes (r) well below .30 and often even below .20 or .10 (especially in larger samples). And because the Big Five traits are intercorrelated, the unique associations are often smaller still (e.g. Laidra, Pullmann, & Allik, 2007). Of course, individual effect sizes are expected to be modest in psychology—and they are generally small (Richard, Bond, & Stokes–Zoota, 2003)—because any behavioural phenomenon is likely to be linked with a huge number of causal factors. There is nothing inherently wrong with small effects. However, we argue that personality–outcome associations may often be at least somewhat stronger than can be estimated by means of the Big Five domains and that quantifying the full magnitude of these associations when and where they are, in fact, stronger than is observed based on the Big Five can be useful for advancing our understanding of how personality intersects with life outcomes.
Also, while the Big Five domains do relate to a wide range of broad and narrow life outcomes, the associations are often rather unspecific. Positive outcomes such as higher educational level and income, relationship quality, lack of antisocial behaviour, healthy lifestyle, or longevity tend to be associated with low neuroticism on one side and high conscientiousness and agreeableness on the other, and they often share smaller links with high extraversion and/or openness (Damian et al., 2015; Graham et al., 2017; Jones, Miller, & Lynam, 2011; Malouff et al., 2010; Mõttus et al., 2012). The opposite pattern tends to characterize negative outcomes. Because this pattern corresponds to the social desirability of the Big Five domains (Allik et al., 2010), it suggests that the domains may be to a substantial extent associated with the general valence in outcomes rather than with their specific aspects—the aspects that make even similarly valenced outcomes distinct. To the extent that this applies, it limits the informativeness of the associations beyond suggesting that, perhaps accurately, positive things hang together.
Facets
Albeit far less frequently, personality–outcome associations have also been investigated at narrower levels of the personality hierarchy. Each Big Five domain, for instance, has been suggested to be made up of six facets (e.g. McCrae & Costa, 2010), although this particular facet model is not necessarily based on empirical work (McCrae & Costa, 2008) and there exist alternative facet models for the Big Five domains (e.g. Soto & John, 2017). Besides contributing to the domain particular facets are intended to measure, they also capture unique variance that is not shared with other facets of the same domain and that corresponds to distinct aetiological mechanisms (e.g. Jang, McCrae, Angleitner, Riemann, & Livesley, 1998). This facet–specific variance is also associated with life outcomes, and therefore including facets into prediction models of these outcomes can increase their predictive power (e.g. Anglim & Grant, 2016; Christiansen & Robie, 2011; Paunonen & Ashton, 2001).
In addition, facet–outcome links are likely to be more specific than those based on the Big Five domains. Therefore, using facets can entail not only more accurate but also more diverse representations of personality–outcome associations. For example, both body mass index (BMI) and aggressiveness have small positive associations with neuroticism, but the two outcomes differ substantially in their links with neuroticism facets; for the former, the association only pertains to the impulsivity facet, whereas the latter has the strongest link with the angry hostility facet (Jones et al., 2011; Sutin, Ferrucci, Zonderman, & Terracciano, 2011). When this applies, arguably, personality–outcome associations should be interpreted at the level of facets and not be generalized to domains at all (Mõttus, 2016).
Personality–outcome associations from nuances (items)
Facets may not be the most specific personality characteristics. Recently, McCrae (2015) suggested that the hierarchy of personality traits extends even below facets, to narrow personality characteristics that he called nuances. Because of a lack of proper classification, nuances have thus far been operationalized as individual personality questionnaire items. Nuances contain unique variance that is not shared with Big Five domains and their facets and tend to have trait–like properties of cross–rater agreement (Mõttus, Kandler, et al., 2017; Mõttus, McCrae, Allik, & Realo, 2014; Mõttus et al., in press), stability over time, and a non–zero level of heritability (Mõttus et al., in press; Mõttus, Kandler, et al., 2017). Also, nuances often display varying gender differences and age trends from the domains and facets that they are intended to be indicators of (Mõttus et al., 2015; Mõttus et al., in press). Some of this unique variance is filtered out when items are aggregated into domain and facet scores, but it may be useful for outcome prediction.
For example, BMI is associated with the unique variance of items related to overeating (Vainik, Mõttus, Allik, Esko, & Realo, 2015) and giving up on self–improvement programmes (Mõttus, Kandler, et al., 2017), among a range of other items, and such associations tend to replicate across samples from different countries (Mõttus et al., in press). Likewise, items’ residual variance (after adjusting for the variance of the Big Five traits and their facets) has meaningful associations with people's interests in various life domains (Mõttus, Kandler, et al., 2017). For other outcomes, nuance–specific variance may appear less relevant: Mõttus, Kandler, et al. (2017) found that item residuals were not significantly correlated with life satisfaction after Bonferroni correction for the number of correlations they had investigated.
In fact, there may be systematic regularities in where items’ unique variance provides incremental predictive value. It has been suggested that for optimal prediction, predictors and outcomes should be matched in terms of their breadth (Asendorpf et al., 2016; Wittmann, 1988). If so, items should be better predictors of more specific outcomes (if outcome–relevant items have been included in the personality measure) whereas composite traits that aggregate multiple behavioural, affective, and cognitive tendencies should out–predict items for broader outcomes that also aggregate the cumulative results of multiple behaviours, thoughts, and feelings (Mõttus, Kandler, et al., 2017).
On the other hand, a finding that items’ unique variance does not significantly correlate with an outcome in a given sample (Mõttus, Kandler, et al., 2017) does not necessarily mean that it does not relate to the outcome at all. For instance, residuals of some items may well be associated with life satisfaction, but their individual effect sizes may be too small to reach significance, especially when stringent significance criteria (adjusted for large numbers of associations being tested) and not very large samples are used. Cumulatively, however, outcome prediction models including a number of questionnaire items may predict outcomes better than the Big Five domains even when individual links between the items’ unique variance and outcomes are weak. We appreciate that this reasoning may seem surprising to some readers, especially given the currently widely prevalent concerns around replicability—one has to be mindful of the dangers of over–fitting models to data, either accidentally or deliberately (Yarkoni & Westfall, 2017). But rest assured, we take this danger very seriously. In order to illustrate our thinking, it may help to draw a parallel with molecular genetics.
A parallel with molecular genetics
Geneticists have come to realize that complex phenotypes tend to be linked to hundreds or thousands of genetic variants each conferring only a tiny effect, rather than to a few genetic variants with strong effects that can be easily detected; this is known as the fourth law of behaviour genetics (Chabris, Lee, Cesarini, Benjamin, & Laibson, 2015). Such phenotypes—that is, most if not all phenomena personality psychologists are striving to learn about—are called polygenic. To study the individually small but potentially numerous genetic effects, researchers atheoretically link millions of genetic markers, single–nucleotide polymorphisms (SNPs) designating allelic variations in specific regions of the genome, to a given phenotype, a method known as genome–wide association studies (GWAS; Hirschhorn & Daly, 2005). Given large enough samples (which means tens of thousands of participants or even more), predictive models built on the basis of the GWAS results can often explain substantial amounts of variance in complex phenotypes such as intelligence (Davies et al., 2015), schizophrenia (Lee et al., 2012), BMI (Locke et al., 2015), or educational attainment (Okbay et al., 2016), even when applied to independent samples of people. Such models can be used to create polygenic scores: individuals’ estimated genetic propensities for a given phenotype, derived by summing weighted allelic counts across large numbers of SNPs, with the weights taken from a GWAS carried out in independent samples (for a detailed yet accessible explanation, see Plomin & von Stumm, 2018). In addition to simply allowing for phenotypic prediction from genomic information, GWAS have also started to unravel the multifaceted biological aetiology of complex phenotypes such as BMI (Locke et al., 2015), depression (Major Depressive Disorder Working Group of the PGC, Wray, & Sullivan, 2017), or intelligence (Hill, Davies, McIntosh, Gale, & Deary, 2017).
Importantly, including even very small effects of the genetic markers that, individually, are not statistically significantly associated with the phenotypes—and an overwhelming majority of them are not—typically contributes to the amount of variance explained by polygenic scores (Dudbridge, 2013). For example, SNP–intelligence associations (from a GWAS meta–analysis based on up to about 280 000 people in total) with p–values of up to .26 contributed to the prediction of observed intelligence in four independent samples (Savage et al., 2017). This means that even tiny and, by conventional criteria, non–significant effects are often in fact real effects in that they contribute to the predictive signal. Realizing this is important not only because it allows for more accurate predictive models but also because this tells geneticists something very important about the very nature of the genetic aetiology of complex phenotypes: genetically, they are so multiply determined that singling out any one—or even dozens or hundreds—genetic variant(s) as the gene(s) for any one phenotype may often not make much sense. For an accessible account of recent progress in GWAS and polygenic scoring research and its major implications for understanding behavioural phenomena (with intelligence as the focal trait), readers are referred to Plomin and von Stumm (2018).
Analogously, just as complex phenotypes are highly polygenic, we suggest that complex outcomes may turn out to be polynuanced. In other words, their associations with personality variations may be driven by a large number of specific personality characteristics in addition to, or perhaps sometimes even instead of, a small number of broad ‘underlying’ constructs that composite personality traits ought to represent. To address this possibility, questionnaire items could be used as personality markers of (yet unknown) nuances. What is more, full sets of items could be atheoretically linked to outcomes in questionnaire–wide association studies (the term can be traced to Weiss, Gale, Batty, & Deary, 2013, although their rationale for and procedures of questionnaire–wide association studies differed from ours). If and when outcomes turn out to be polynuanced, this will have implications for both prediction per se and, more generally, for our understanding of how personality intersects with phenomena outside the personality domain. As for prediction, this could suggest that optimal models should be built based on large numbers of narrow personality characteristics (nuances). Such predictions could be called polynuance scores, analogous to polygenic scores. Polynuance scores are also similar to empirically constructed personality scales such as those of the Minnesota Multiphasic Personality Inventory (Hathaway & McKinley, 1940) and the California Personality Inventory (Gough, 1975), with the difference that polynuance scores comprise weighted (by regression coefficients) contributions of items, whereas this is not necessarily the case for scores of empirically constructed personality scales. Such polynuance scores could be used wherever personality characteristics are used for prediction—for example, for selecting best candidates based on predicted future performance or identification of people at future risk for certain negative outcomes—but they would provide higher predictive value than predictions based on domains and perhaps also facets. As for understanding, in addition to singling out specific aspects of personality that are linked with particular outcomes, investigating the sheer numbers of such links may be informative regarding how personality and outcomes tend to intersect (e.g. how polynuanced they tend to be). Furthermore, if outcomes are indeed correlated with ranges of nuances, this may also increase the likelihood that different outcomes correspond to a more varied set of personality profiles than the all–positive–goes–together pattern that often emerges when the Big Five domains are used. If so, there would be more to personality in relation to outcomes than a desirable personality tagging along with other desirable characteristics.
Let us be clear: we are not postulating that all outcomes are necessarily polynuanced—they may well not be at all, or only some of them may be. But we do suggest that this is an entirely realistic possibility with potentially broad implications and that it is therefore something worthwhile exploring. To exactly this end, we systematically compared the degrees to which item–based models could predict a range of outcomes compared with the degrees to which the outcomes could be predicted from the Big Five domains. We also explored the possibility that the Big Five–outcome associations may be driven by the items that had been included in the domain scores.
Methodological considerations
Adding more predictors to a model tends to increase the amount of variance the model can explain in the sample where the model is fitted, but such a model might perform poorly when applied to a different sample of the same population: this is known as model over–fitting (e.g. Chapman, Weiss, & Duberstein, 2016; Yarkoni & Westfall, 2017). Therefore, item–based models may tend to out–predict domain–based models for purely statistical reasons. In order to mitigate this danger, geneticists (and all adopters of machine learning principles) often create (train) the prediction models in one sample and apply (cross–validate) them in independent samples. Personality researchers could also do this. In fact, the training and cross–validation samples do not necessarily have to be independent in the sense that they are collected by different researchers and/or at different times/sites. A single, sufficiently large sample can be split into two independent partitions, one for model training and the other for validation, and this procedure could be repeated multiple times, which yields a distribution for the parameter of interest such as the amount of variance in an outcome the model can account for in independent groups of people.
In order to increase the likelihood of a model performing well in cross–validation, it is advisable to ensure that its parameters (e.g. regression coefficients) are estimated as well as possible in the training sample. When large numbers of intercorrelated predictors are included in a model, traditional least square or maximum likelihood regressions may struggle to produce coefficients that yield optimal predictions in independent samples because they are tailored to the idiosyncrasies of the particular sample (i.e. over–fit) and because of possible multi–collinearity among predictors. Increasing the sample size helps with the former, but not the latter. Therefore, it may be useful to employ regularized regression approaches such as ridge (Hoerl & Kennard, 1970), least absolute shrinkage and selection operator (LASSO) or elastic net (Tibshirani, 1996; Zou & Hastie, 2005) for training models. These regression methods are designed to deal with large numbers of intercorrelated predictors and yield more parsimonious (compared to more traditional, non–regularized approaches) models that are less prone to over–fitting to start with. Specifically, these approaches penalize regression coefficients by shrinking them towards zero, because this counteracts the natural tendency of regression models to produce inflated (over–fit) coefficients (Yarkoni & Westfall, 2017). Of course, it is important not to over–penalize the coefficients: as a simple rule, the optimal penalization is one that maximizes a model's performance in cross–validation. With regularized regression approaches combined with cross–validation, prediction models can be based on from a few to tens or hundreds (in fact, even thousands) of intercorrelated predictors (domains, facets, or items).
The present study
In order to illustrate the ideas discussed above, we employed a large British adult sample (N ∼ 8700) who had completed a 50–item Big Five personality questionnaire (Goldberg, 1999). Specifically, we predicted 40 outcomes reflecting a variety of life domains from the Big Five personality domains and then from the 50 items used to define the domain scores. Using such a wide range of outcomes yielded a generalizable pattern of findings, but it also allowed us to investigate systematic variations among outcomes in their predictability. Specifically, we examined whether differences between domains and items in the prediction of outcomes would track with the breadth of these outcomes as rated by independent judges. The use of a large sample allowed for training models with tens of predictors and validating them in independent and yet sufficiently large subsamples. However, the use of a personality measure with only 50 items, many of which were similar or almost entirely overlapping in content (e.g., ‘I seldom feel blue’ and ‘I often feel blue’), 1 meant that the prediction models could sample markers for only a limited set of nuances from the yet–unknown population of all possible outcome–relevant nuances. Therefore, we had to consider the extent to which items would out–predict domains as the lower–bound estimate of such a tendency. Most associations were longitudinal over about 5 years, which somewhat reduced the risk that personality ratings were ‘contaminated’ by outcomes, or the other way around.
Materials and Methods
Participants
This project used data from the National Child Development Study (NCDS), an ongoing longitudinal study of 17 634 individuals born in a specific week in March 1958 in Great Britain, and of a further 929 individuals born in the same week abroad who immigrated to Great Britain before age 16 (Plewis, Calderwood, Hawkes, & Nathan, 2004). To date, a wide range of variables reflecting different aspects of the cohort members’ lives have been measured in nine separate sweeps, at ages 7, 11, 16, 23, 33, 41/42, 46/47, 50/51, and 55. Here, data collected in Sweep 8 (2008/2009, age 50/51) and Sweep 9 (2013/2014, age 55) were used (University of London. Institute of Education. Centre for Longitudinal Studies, 2012, 2014, 2015). Data in Sweep 8 were collected in a 55–minute face–to–face interview, as well as using a self–completion questionnaire posted to participants prior to the interview (Brown, Elliott, Hancock, Shepherd, & Dodgeon, 2012). Data in Sweep 9 were collected by first inviting cohort members to participate online and subsequently contacting non–respondents via telephone (Brown & Hancock, 2015).
Measures
Predictors
Personality data were collected as part of the Sweep 8 self–completion questionnaire, using the 50 items from the International Personality Item Pool (IPIP; Goldberg, 1999), measuring Goldberg's (1992) markers for the Big Five (10 items for each trait). The items were answered on a 5–point Likert–type rating scale from very inaccurate to very accurate. Of the 9790 respondents in Sweep 8, self–completion questionnaire data were available for 8787. However, only the 8719 participants (4519 female) who had completed more than 80% of IPIP items were included in this study. After median replacement of 1326 missing item responses, individuals’ item scores pertaining to each domain were averaged to calculate scores on the Big Five personality traits. There were no extreme cases of multicollinearity (r > .80) between any items. Correlations between the Big Five domains ranged from .06 to .38 in magnitude (median = .24).
Outcome measures
Variables collected in Sweeps 8 and 9 were screened as possible outcome candidates. For 7621 (3999 women) of the 8719 participants in this study, data from both Sweeps 8 and 9 were available. For the remaining 1098 (520 women) individuals, data were only available from Sweep 8. Most outcome candidates were selected based on previous literature and a theoretical rationale that they could be related to personality. A few outcomes, such as ‘partner's age’, ‘attending concerts or theatre’, and ‘eating out’ were included for purely exploratory purposes. During the outcome selection process, outcomes that were answered on an ordinal, interval, or continuous scale were given preference over binary ones. Similarly, where available, preference was given to outcomes measured in Sweep 9 over those measured in Sweep 8 to avoid criterion contamination, whereby an outcome measured concurrently with personality may have affected personality ratings or the other way around. For instance, how often one currently sees friends may influence extraversion ratings. Only five of the selected outcomes were based on data collected in Sweep 8. All 40 outcomes are shown in Table S1 of the Supporting Information (available from https://osf.io/2efnr), alongside the names of the original NCDS variables and a record of any changes made to these variables. The variables can also be seen in Table 1 of the main text. For detailed descriptions of how NCDS variables were measured, including exact wordings of interview or questionnaire items, see the NCDS documentation (Brown et al., 2012; Brown & Hancock, 2015).
Explained variance (R2) from item and domain models
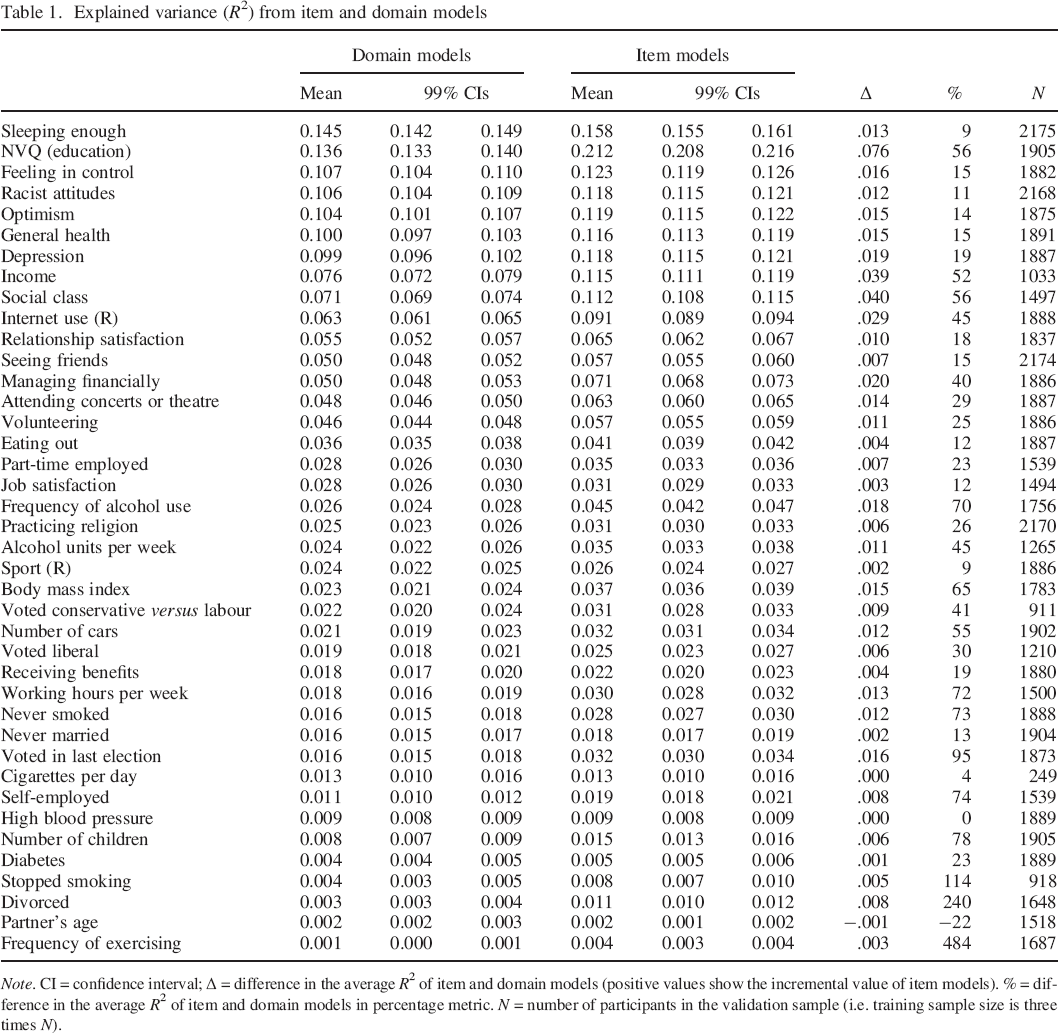
Note. CI = confidence interval; Δ = difference in the average R2 of item and domain models (positive values show the incremental value of item models). % = difference in the average R2 of item and domain models in percentage metric. N = number of participants in the validation sample (i.e. training sample size is three times N).
Thirteen of the outcomes were derived from the original NCDS variables, either by creating binary variables from categorical variables with more than two levels or by combining two NCDS variables supposedly measuring the same outcome into a single variable (see Table S1). The remaining 27 outcomes were directly based on a closely corresponding NCDS variable. However, in many cases, minor changes were made to the variables (see Table S1). For 16 variables, the original coding of the NCDS variable was reversed in order to make the interpretation of personality–outcome relations more intuitive. For instance, the coding of the outcome ‘volunteering’ that originally ranged from (1) at least once a week to (4) never was reversed in order for higher values to correspond to volunteering more frequently. Following screening for outliers and normality, extreme values for a few cases were either excluded or capped at a certain value for the outcomes ‘income’, ‘body mass index’, and ‘working hours per week’. In addition, three variables, ‘alcohol units per week’, ‘income’, and ‘body mass index’, were log10–transformed to make their distributions more normal. Table S1 also provides information on the outcomes’ measurement levels, and the coding of response options for binary and ordinal outcomes after any changes had been made. In total, 13 outcomes were binary and modelled using logistic regression. The remaining 27 outcomes had either been measured on interval or continuous scales (seven outcomes) or on ordinal scales with at least four levels (20 outcomes); 23 of these variables were fairly normally distributed and modelled using the Gaussian distribution, whereas four variables—‘sport (R)’, ‘volunteering’, ‘internet use (R)’, and ‘number of children’—were heavily skewed towards smaller values and were thus treated as having a Poisson distribution when building outcome prediction models. This is the reason why for ‘sport (R)’ and ‘internet use (R)’ the original NCDS coding was not reversed, meaning that higher variable values correspond to using the Internet less and doing less sport [the label (R) is included to remind the reader of this counterintuitive coding].
Outcome breadth versus specificity
In order to be able to test the hypothesis that items tend to confer more incremental predictive value for narrower outcomes, we asked 19 individuals (aged between 19 and 30 years; 12 had no formal connection with psychology, and the rest were either former or current students or had otherwise some experience of psychological research) to rate each of the 40 outcomes in terms of their breadth versus (behavioural) specificity. The raters were presented with the following instruction: ‘Below is a list of variables that researchers may use to characterize individual differences in behavior, attitudes, socioeconomic performance, health, and so forth. To what extent does each of these variables represent a relatively specific type of behavior? At the other end of the spectrum, the variables may represent broad life outcomes, reflecting the contributions of multiple types of specific behaviors that could happen over longer periods of time. Please rate each variable on this dimension of specific behaviors versus broad life outcomes’. The outcomes were rated on a 5–point Likert scale, with endpoints marked as specific behavior (1) and broad life outcome (5). Across the 40 outcomes and 19 raters, the intraclass correlation of single raters was .18, whereas the intraclass correlation of average ratings was .81 (calculated using the psych package; Revelle, 2017). For each outcome, we averaged the ratings of the 19 raters.
Statistical analyses
The selection of NCDS variables as outcome candidates, outcome creation from these via recoding, initial checks for outliers and normality, and deletion of extreme values and log10 transformations as described above were carried out in SPSS, Version 21. All subsequent analyses were carried out using R 3.4.2 (R Development Core Team, 2016).
Model building and outcome prediction
In order to avoid overestimating models’ predictive strength due to over–fitting, the sample was split into a training sample (three–fourths) and a validation sample (one–fourth). We chose to use a notably larger proportion of participants for model training, because the larger the training samples, the more precise models tend to be and thereby the higher the predictive accuracy in the validation samples they generally allow for (for a parallel in GWAS and polygenic scoring, see Cesarini & Visscher, 2017). Prediction models were fitted in the training sample, from which regression weights were obtained and then applied in the validation sample for outcome prediction. Squared correlations between predicted values and observed values were used as estimates of model prediction strength. The process of model training and outcome prediction was repeated 100 times in random splits of the sample.
Prediction models for each outcome were built using a penalized regression, which shrinks regression coefficients towards zero by imposing a penalty on their combined size. Penalized regression can be employed when the number of potential predictors in a model is high, such as in GWAS (Waldmann, Mészáros, Gredler, Fuerst, & Sölkner, 2013), and when the predictors have high intercorrelations. Two widely used forms of penalized regression are ridge (Hoerl & Kennard, 1970) and LASSO (Tibshirani, 1996). Ridge regression applies a penalty to regression coefficients that depends on the sum of the squares of these coefficients, whereas the LASSO penalty depends on the sum of the absolute values of these coefficients. Both approaches have limitations. Ridge regression tends not to increase model parsimony as it rarely shrinks regression coefficients to zero. In contrast, LASSO leads to sparser (with more zero coefficients) and thereby more parsimonious and readily interpretable models, but it has a downside of often randomly selecting one out of many correlated predictors, setting coefficients for others to zero (ridge regression tends to shrink coefficients for correlated predictors towards each other; Waldmann et al., 2013; Friedman, Hastie, & Tibshirani, 2010). This means that LASSO solutions are not unique. We thus employed the elastic net penalty (Zou & Hastie, 2005), which combines both ridge and LASSO penalties, mitigating limitations associated with each of them alone (e.g. Chapman et al., 2016). Elastic net tends to yield parsimonious models (due to the LASSO penalty), in which groups of correlated predictors are treated in the same way (due to the ridge penalty), all either being included or excluded from the model (Waldmann et al., 2013; Zou & Hastie, 2005). We modelled binary outcomes using the binomial link (logistic regression), outcomes with a Poisson distribution using the Poisson link, and the remainder of outcomes using the Gaussian link. The optimal regularization parameter lambda (λ) was obtained using 10–fold cross–validation within the training sample such that it minimized cross–validated error across the folds. 2 These procedures were carried out by the glmnet package for R (Friedman et al., 2010).
Adjustment
We did not control for age as all participants were born in the same week, but we adjusted for gender by including it as a covariate into the prediction models built in the training samples (we did not residualize the outcomes for gender outright because not all of them were continuous). When obtaining predicted values in the validation samples, the regression weight of the gender covariate was set to zero, in order to obtain predictions only from personality while having regression coefficients for personality variables that controlled for potentially spurious sex effects. This was done to avoid inflating what would be interpreted as personality's predictive share in the outcomes.
All R scripts are publicly available at http://osf.io/z9pr2. NCDS data are available from the UK Data Service, University of Essex (http://www.ukdataservice.ac.uk).
Results
Model calibration
We carried out a simulation to test the degree to which our procedure of training models in one partition of the sample using the elastic net penalty and validating them in another partition would guard against more complex (item–based) models out–predicting more economical (domain–based) models for purely statistical reasons (e.g. over–fitting). We simulated data similar to our empirical data (N = 9000; 50 items grouped into five traits; 40 outcomes), but with a particular underlying structure: five latent traits [Ν(μ = 0, σ2 = 1)] contributed to 50 observed variables [10 for each latent trait; Ν(μ = 0, σ2 = 1)] and any number between one and five of them could also contribute towards the outcome variables [Ν(μ = 0, σ2 = 1)]. The factor loadings of items on their latent traits were in a realistic range, varying from about just under .40 to just over .70 (they ranged from .35 to .76 in our real data), and the contributions of latent traits towards the outcomes varied from close to zero to potentially about .60 (mostly <.20, very rarely >.40). We then applied the same procedure on these simulated data that would be applied on the empirical data (comparing the predictive accuracy of ‘items’ and the five ‘domain’ scores they would make up), with a focus on the degrees to which item–based and domain–based models predicted the outcomes. We repeated the procedure 100 times. The simulation R code is available at https://osf.io/2fnqm.
In most cases (83%), domain models out–predicted item models (as per underlying data–generating model), with the average predictive accuracy of item–based models being about 96% of the accuracy of domain models (1% and 99% quantiles of the ratio of item model predictive power to domain model predictive power were 0.80 and 1.02, respectively). Therefore, if personality–outcome associations were indeed driven by the purported latent traits that the item composites were designed to measure, our statistical procedure was likely to correctly show that domains out–predicted items. By implication, this meant that when item models would out–predict domain models in real data, it would tend to correctly indicate that the associations were at least in part driven by the unique characteristics that the items reflect. Thus, the procedures employed in this study were likely to effectively guard against more complex models out–predicting more economical ones for artefactual reasons.
Predictive strength of item and domain models
On average, approximately two–thirds of IPIP items and four to five Big Five domains were included in item and domain models, respectively (i.e. had non–zero elastic net regression coefficients, which are given the Table S2 of the Supporting Information; https://osf.io/8sjyr). Table 1 shows the mean variance explained (R2) in each outcome by item and domain models across 100 replications; we also report the 99% confidence intervals (CI) for these average estimates, calculated based on their variance across the 100 replications.
Domain models for 33 outcomes and item models for 35 out of the 40 outcomes predicted more than 1% of variance (R2 > .01). Mean variance explained by domain and item models varied considerably across the outcomes and was highest for outcomes such as ‘sleeping enough’, ‘NVQ (education)’, ‘feeling in control’, ‘racist attitudes’, ‘optimism’, and ‘general health’ (R2 > .10). Among the outcomes, the least predictable from personality characteristics were ‘frequency of exercising’, ‘partner's age’, ‘divorced’, ‘stopped smoking’, ‘diabetes’, ‘number of children’, and ‘high blood pressure’ (R2 < .01 for domains). On average, across all outcomes, item models explained 5.45% of variance, while domain models explained 4.18% (medians were lower, 3.36% and 2.46%, respectively, indicating a positive skew). In other words, the average item–level prediction exceeded that of domain–level prediction by about 30%.
For 37 outcomes, item models tended to out–predict domain models; for 33 of these, the 99% confidence intervals of average item–level and domain–level predictions did not overlap. For three outcomes (‘cigarettes per day’, ‘high blood pressure’, and ‘partner's age’), the predictions were roughly similar in magnitude (difference in R2 < .001). Although these outcomes were among the least predictable from personality characteristics in the first place, generally, the ratio of the strengths of item model and domain model predictions was not significantly linked with prediction strength of either domain or item models, suggesting that, as a general tendency, items were stronger predictors for outcomes regardless of the overall degree to which these could be predicted from personality.
When only considering the 33 outcomes for which domain models on average predicted more than 1% of variance (R2 > .01) in order to avoid including inflated estimates where the outcome was not predicted very much at all, the prediction improvement of item over domain models ranged from 3.58% (‘cigarettes per day’) to 94.75% (‘voted in last election’). For these 33 outcomes, a paired Wilcoxon signed rank test showed the difference in variance explained between item and domain models to be significantly different from zero (p = 2.33 * 10−10). These results stand in stark contrast with the simulation results presented above, suggesting that personality trait–outcome associations cannot be fully accounted for by the (underlying) Big Five domains.
The breadth of outcomes
We correlated the outcomes’ average breadth ratings, given by the 19 raters, to the degrees to which they were predicted by either domains or items, and the difference and ratio between the two kinds of predictions (r–to–z transformed Columns 2 and 5 of Table 1 or the ratio between them). None of the correlations was sizeable (Spearman's ρ = −.09 to 0). For example, among the outcomes most strongly out–predicted by the item models were specific behaviours referring to attending cultural events, using the Internet, or consuming alcohol as well as broad outcomes, such as educational qualification, income, or BMI. This suggests that the variability among the 40 outcomes in their behavioural specificity versus breadth had little to do with how well they could be predicted from either items or domains, or with the degree to which items conferred incremental predictive value over domains. Items tended to out–predict domains regardless of the breadth of what was predicted.
Domain–level predictions were at least in part driven by nuances
The typical predictive advantage of item models over domain models was arguably only moderate (about 30%). But it is important to realize that this observed advantage was unlikely to have entirely accurately revealed the degree to which the nuances captured by the items tended to predict the outcomes on top of, or rather than, the latent traits purported to underlie the domain scores. This is because the predictive value of nuances was always included in the domain scores, likely inflating the predictive value of the domain scores compared with what it would have been without these nuances included. In other words, the Big Five domains per se, independently of any particular items that happened to be included in their operationalization (but could not have been included, had the test constructors chosen alternative items that were equally reflective of the domains but with different unique outcome associations), could have done worse in the prediction. This reasoning is of course based on the assumption that the underlying traits that the Big Five scales are supposed to measure exist independently of how particular questionnaires approximate them—but this is a de facto standard assumption in personality research anyway (Mõttus, 2016).
In order to address this possibility, the predictive power of item models should be compared with domains operationalized independently of these particular items (e.g. by using another questionnaire with items that measure only the domains and not nuances). We did not have such data, and we doubt that anyone has. However, as a post hoc analysis, we could remove a few items that most strongly predicted each outcome from the Big Five scales and re–estimate their predictive power after this (R code available from https://osf.io/bce2h). Assuming that the underlying traits that the domain scores were designed to approximate indeed exist independently of the particular items aggregated into them (Mõttus, 2016), the reduced scores should have measured the same underlying traits as full scores, possibly barring a small drop in measurement reliability. Therefore, if the associations were driven by the purported latent traits, their predictive value should have dropped minimally when a few items were removed. 3
For each outcome, therefore, we compared the predictive power of the model based on 50 items with that of five Big Five domain models, with domain scores calculated based on either 49, 48, 47, 46, or 45 items in total; that is, one to five of the most predictive items were removed from domain scores, regardless of which domain they fell into. As above, the models were trained and validated in independent samples, and the procedure was repeated 100 times in random sample splits for training and validation, respectively. Dropping only the most predictive item (identified using elastic net regression, as above) from the domain score this item initially happened to belong to reduced the average (across the 40 outcomes and 100 permutations for each) predictive power of domain models by about 6%, whereas also removing the second, third, fourth, and fifth most predictive items from the domain scores these items happened to belong to reduced the average predictive power of domain models by about 11%, 14%, 16%, and 19%, respectively. In most cases, removing the five most predictive items left the shortest scale (i.e., scale from which the most items had been removed) with eight items instead of 10, but for five outcomes up to three and for two outcomes up to four items out of 10 were removed from what would become the shortest scale. For reference, when we removed five randomly chosen items from among the 50 items making up the five domains, average amounts of variance accounted for by domain models only decreased by about 1%.
Assuming that domain models with the five most predictive items removed from the domains (i.e. leaving them based on 45 items instead of 50) constituted at least a somewhat fairer comparison for item models than domain models with the most predictive items included in their variance (because the scores still measured the same domains, regardless of whether they contained 8 or 10 items), the average predictive power of item models (R2 = .0545) was about 61% higher than the average predictive power of the domain models based on fewer items (R2 = .0335). Of course, this could also be an underestimate, because other (than the ‘top–five’) nuances uniquely predictive of some outcomes were still included in the domain scores and potentially still inflated the estimated predictive power of domains per se.
Specifically, Figure 1 shows the average predictive value of both domain and item models when up to 10 (i.e. 20%) most predictive items were removed from them (for 30 of 40 outcomes, the shortest scale retained six or more items; for eight outcomes, the shortest scale retained five items, and for two outcomes, only three or four items were retained in the shortest scale; note, however, that outcomes were mostly predicted by four or five scales and most scales contained more items than the shortest scale). In the figure, the predictive values are grouped into quartiles according to the degree to which models based on 50 items predicted the outcomes (i.e. the top quartile represents the average predictive value of the 10 outcomes most accurately predicted from personality characteristics, which roughly corresponds to the top 10 rows of Table 1). Both item and domain models tended to lose some of their predictive power as ever more items were removed, and this tendency was fairly similar regardless of the degree to which the outcomes had been predicted in the first place (across the four quartiles, removing 10 items decreased the average predictive value of domain models by 26% to 34%; the average across all 40 outcomes was 31%). However, while the predictive advantage of item–level models did not pertain to a few ‘top nuances’ for the most predictable outcomes (in the top quartile, the predictive advantage of items was 27% with all items included, and it was still 21% with top 10 items excluded), in outcomes where the overall amount of variance accounted for by personality was smaller, this seemed to be the case. For example, for the least predictable outcomes, removing only a few of the most predictive items resulted in domain models being on par or even outperforming item models. This tendency suggests that the more predictable from personality characteristics an outcome was, the more this prediction was driven by nuances. These findings indicate that domain–level predictions are often likely to be at least in part driven by the nuances that happen to be included in them.
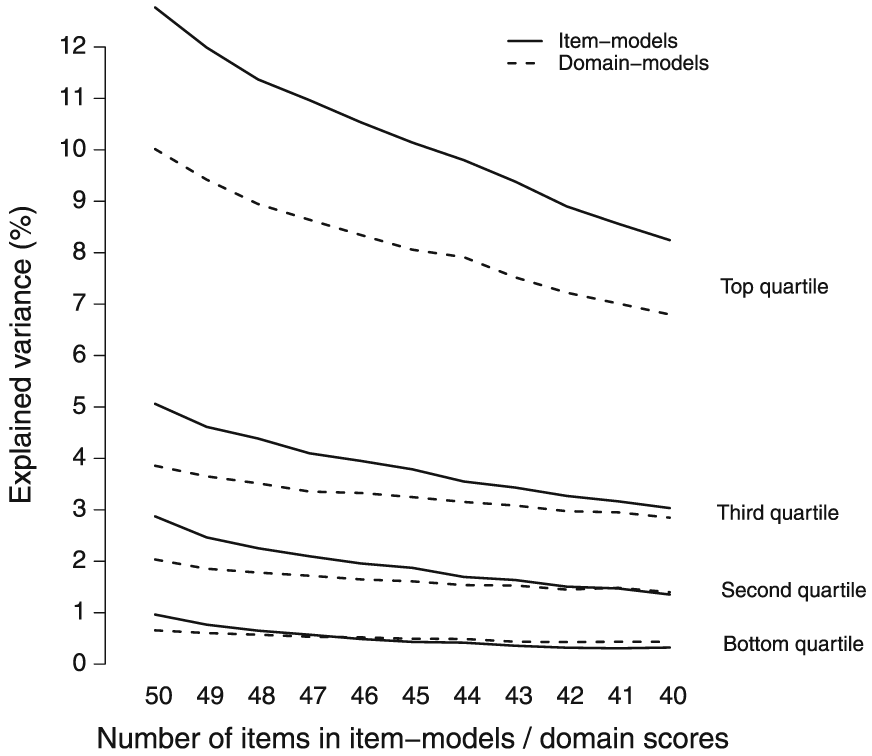
The predictive power of item and domain models based on 50 to 40 items (with most predictive items iteratively removed). Outcomes are grouped based on the degree to which they were predicted by 50–item models.
Item–level predictions were mostly not driven by domains
In order to estimate the extent to which item–level predictions were driven by their common variance, ostensibly reflecting underlying domains, we carried out another post hoc analysis. Specifically, we reran the item–level predictions (as above, training models on 75% of the sample and validating the models in the remainder of the sample and repeating this procedure 100 times) using the residual variance of items (Mõttus et al., in press; Mõttus, Kandler, et al., 2017). Specifically, items were regressed on the scores of all five domain scores using linear regression, and the residuals were saved (the item being residualized was removed from its intended domain score at the time to avoid regressing the item on itself). The item residuals tended to correlate highly with item scores before residualizing, with r = .69 to .94 (M = 0.83).
On average, the models based on item residuals explained 5.11% of variance in the 40 outcomes, and for 33 of them, the percentage exceeded 1%. Therefore, removing the domain variance from items only attenuated their average predictive value by about 6%, and the average item residual model still out–predicted the average domain model by about 22%. This result reinforces the notion that much of the predictive value of personality for outcomes tends to stem from the characteristics that are aggregated into traits rather than whatever underlying causal entities the aggregates (items’ common variance) are purported to approximate.
Discussion
We explored the usefulness of personality questionnaire items as personality markers (in a way analogous to genetic markers, SNPs) for representing personality–outcome associations. We found that prediction models based on questionnaire items (similar to prediction models built from GWAS data in genetics) accounted for a non–zero share of variance in most outcomes. In fact, the item models mostly showed greater prediction strength than models built from Big Five domains, with an average of 30% more variance explained. We also made a case that this percentage likely underestimated the degree to which the unique variance in items was predictive of outcomes on top of, or even rather than, the traits purportedly underlying the Big Five domains. This is because the domain–level predictions were inflated by the unique variance of the items included in them, and items that had been residualized for the domains predicted the outcomes only slightly worse than items that included the domain variance. Furthermore, we found that the degree of the incremental predictive value of items over domains did not depend on the breadth (versus behaviour specificity) of the outcome.
These findings were based on a large sample of more than 8700 participants, mostly longitudinal associations, and a wide range of diverse outcomes. Moreover, we used rigorous statistical procedures that guarded against model over–fitting, as shown by the simulation. Importantly, unlike most studies that link psychological constructs with outcomes by fitting statistical models and estimating the performance of these models in the same sample(s), in this study, outcomes were predicted from models that had been trained in independent people. This means that we quantified genuine predictive power rather than just correlations. Collectively, the findings suggest that particular personality–outcome links often pertain to specific personality characteristics rather than the broad Big Five traits these characteristics are ostensibly only indicators of.
Personality links are pervasive, although often expectedly weak in magnitude
The present findings reinforce the conclusion that the associations of personality characteristics with life outcomes are ubiquitous (Ozer & Benet–Martínez, 2006; Roberts et al., 2007). Even though the selection of outcomes was not entirely random in this study, we can hypothesize that most markers of individuals’ socio–economic success, health, or social behaviour can, to some extent, be predicted from personality characteristics included in omnibus personality models. Of course, this does not mean that the links are necessarily reflective of causal contributions of personality to these outcomes (Mõttus, 2016; Mõttus, Marioni, & Deary, 2017), but sometimes they may be—patterns of behaviour can have consequences.
However, the effect sizes were generally weak, with on average slightly over 4% of variance being predicted from the five Big Five scores and about 5.5% from their 50 items. This has several mutually non–exclusive explanations. One possibility is that the tendency for low effect sizes is an accurate reflection of reality: anything that people differ in is likely to have a myriad of causes—many of them possibly idiosyncratic—and personality differences at any single point may constitute only a fraction of them. Another possibility is that the 50–item measure used in this study covered only a small sample of potentially relevant personality characteristics, as either domains or nuances. It is only too likely that the prediction models—especially item–level models—could have performed much better had a more comprehensive measure been used; we will also discuss this issue below. A third explanation for the relatively modest effect sizes is that they resulted from out–sample predictions and were little, if at all, upwardly biased by over–fitting—unlike most results reported in the literature (Yarkoni & Westfall, 2017). And yet it should be noted that nearly a quarter of outcomes did share over 10% of their variance with 50 item–level personality characteristics.
What do the findings tell us about how personality intersects with outcomes?
We expected personality characteristics, especially the broad Big Five traits, to be stronger predictors of broad life outcomes that aggregate the accumulating consequences of a wide range of behaviours, thoughts, feelings, and aspirations (Asendorpf et al., 2016; Wittmann, 1988), as opposed to more specific behavioural outcomes. This would have been consistent with the possibility of there being broadly acting underlying personality traits casting their non–specific influences through narrower characteristics (nuances) whose (unique) relevancy only depends on specific outcomes. Although the nuances would then be aetiologically more proximal to the outcomes and might therefore have stronger links with them, it is unlikely that personality questionnaires, especially short inventories such as the 50–item IPIP, cover the nuances specifically relevant for each and every outcome. For the most part, then, the nuances reflected in test items would serve as mere indicators (measurement devices) of the broader underlying traits. But this did not appear to be the case: the degree to which outcomes were predicted from personality did not track their breadth/specificity, and items tended to out–predict domains for broad and specific outcomes alike.
But could it be that the items’ incremental predictive validity results from item–outcome overlap (Mõttus, 2016; Mõttus, Marioni, & Deary, 2017)? This was unlikely for the present findings. For example, among the outcomes for which items made the biggest incremental contribution (in relative increase terms) were voting, being self–employed, time spent working, smoking, alcohol use, BMI, educational qualification, occupational social class, number of cars owned, income, and Internet use, but none of the IPIP items made any reference to them. Indeed, for most outcomes, it is hard to see how they would be more obviously connected with any individual IPIP item than with any Big Five domain. And yet items were collectively more strongly linked with the outcomes than the domains, even if the domain–related variance had been removed from the items. Moreover, the more outcomes were incrementally predicted by items, the less likely this was driven by only a few items. For example, for the 10 most predictable outcomes, even after dropping the 10 most predictive items, item models tended to out–predict domain models by nearly the same ratio than the models with all items included.
A plausible interpretation of these results is that the associations of personality and outcomes do not generally pertain to the ostensible underlying traits. Instead, outcomes may be highly polynuanced—linked with a wide range of specific personality characteristics—such as phenotypes are generally polygenic (Chabris et al., 2015). If so, personality trait scores are correlated with outcomes because questionnaire items sample from among the nuances that are either directly linked with the outcomes themselves or linked with other nuances that are relevant for the outcomes. The latter possibility of indirect associations between items and outcomes contributing to predictive power recasts the idea that genetic markers (SNPs) can be linked with phenotypes not only because they represent genetic variants directly relevant for the phenotype but also because they are in linkage disequilibrium with the directly relevant variants (i.e. serve as proxies). In the personality context, such ‘linkage’ may arise from direct causal associations among the nuances or their links with overlapping motivational characteristics (Cramer et al., 2012; Wood, Gardner, & Harms, 2015), among other reasons.
To the extent that this scenario applies, because personality test items constitute samples of markers of potentially outcome–relevant nuances, aggregating them into broad traits almost inevitably filters out some of the outcome–relevant information—which is exactly what the present results tended to show. The present findings do not only point to where in the (descriptive) personality trait hierarchy the outcome–relevant ingredients may lay but also reinforce the concept of nuances as potentially useful descriptive—and maybe even explanatory—units of personality (McCrae, 2015; Mõttus et al., in press; Mõttus, Kandler, et al., 2017).
But why do we aggregate in the first place?
Specific personality characteristics (tendencies for specific behaviours, feelings, cognitions, and motivations), as reflected in single items, are typically aggregated into composite scales in order to increase the reliability of measurements, in order to allow for more parsimonious models, and because it is hoped that the aggregates reflect some underlying, aetiologically homogeneous and causally potent properties of the human mind. What has been proposed in this article may not seem in lockstep with these aspirations. So?
Indeed, the ratio of measurement error to substantive (non–error) variance is larger in single items than in aggregate trait scores, which could limit the value of item–based analyses. However, this is primarily a problem for studies based on small samples where model parameter estimates are less stable and aggregation of observations per person helps to increase their reliability. In sufficiently large samples, such as the one used in this study, parameter estimates are more stable even with lower reliability of single measurements, as the aggregation of observations across persons compensates the low reliability of single measurements (Goldberg, 1993). But even with smaller samples (N ∼ 1000) than used here, parameter estimates pertaining to single items (e.g. age or gender differences, or associations with outcomes such as BMI) tend to be consistent across studies and must therefore be reasonably reliable (Mõttus et al., in press).
Likewise, item–based models for predicting outcomes are apparently less parsimonious than those based on higher–order traits, simply because there are more items than their aggregates. Generally, science strives for simplicity and parsimony, ceteris paribus. But it is exactly this latter clause—all else being equal—that is important here. First, if and when items do allow for outcome predictions that are more accurate, it might appear that reliance on what appears as less parsimonious at face value has some benefits. It has been argued that it is exactly prediction that psychology should strive for, rather than grossly simplified explanatory models with commensurately low practical value for describing what is going on in the real world (Yarkoni & Westfall, 2017). Second, relying on composites for, say, causal explanations requires the composites to have an appropriate ontology: they need to reflect something real about individuals rather than just being summaries of psychological ‘stuff’ (Mõttus, 2016). If the composites were just convenient summaries of items, it would still be the items that have to carry the explanatory weight in the end, and we might just as well represent the associations using these (cf. Wood et al., 2015). Doing so would not mean doing away with personality as all the information pertaining to composite traits—and some more—would be retained, even though modelled differently.
Again, we may rely on a parallel with genetics. The realization that the genetic architecture of complex phenotypes is so complex that it does not lend itself for a priori hypothesizing is exactly what has finally allowed geneticists to predict phenotypic variance from genome–based observations (see Plomin & von Stumm, 2018). That is, it is exactly suppressing the strive for apparent parsimony that has been useful—because reality cannot always be represented parsimoniously. In a way, of course, realizing and accepting that things are complicated (e.g. polygenic or polynuanced) can allow for the emergence of new, higher–order principles that focus less on which specific elements of a complicated system are interlinked but look for some general organizational principles of the system.
It could be argued that domain–level predictions are particularly useful because they allow for generalized explanation. For example, an observed correlation between conscientiousness and longevity can be explained by a variety of behaviours that conceptually fall under this domain (e.g. being mindful about one's health and able to resist urges to behave in unhealthy ways, adhering to medical advice and treatment), regardless of whether these have been directly captured in particular questionnaires. However, to the extent that personality–outcome associations are actually not driven by domains such as conscientiousness but the specific characteristics that happen to be captured by the questionnaires or somehow in ‘linkage’ with them, such generalizations may be particularly dangerous—they would need to be tested rather than assumed. Knowing the patterns of correlations (or ‘linkage’) among these characteristics (the basis for domains) can guide our hypothesizing as to which characteristics could be relevant in addition to those that have been directly measured and linked with any given outcome. But we do not necessarily need domains per se to explain the associations.
But it is also important to realize that identifying item–level (or nuance–level, by inference) associations does not preclude aggregation. For example, outcomes could then be predicted from polynuance scores, which are weighted aggregates of items (weights being the associations of the items with the outcomes), exactly as phenotypic variance is being predicted from polygenic scores, which are weighted aggregates of genetic markers (Plomin & von Stumm, 2018). In addition to the prediction of outcomes for which the polynuance scores were initially created, other outcomes could be predicted, or associations between polynuance scores created for different outcomes could be calculated. This would allow exploring the extents to which different outcomes either correspond to different personality profiles or are independent with respect to their personality–related mechanisms. Again, this recasts an extremely useful concept in genetics, genetic correlation (e.g. Neale & Maes, 1996), which quantifies the extent to which different phenotypes are linked with overlapping genetic variance. Geneticists study patterns of genetic correlations among phenotypes to learn about their genetic aetiology (e.g. Bulik–Sullivan et al., 2015; Plomin & von Stumm, 2018), and personality psychologists could study patterns of ‘personality correlations’ (e.g. correlations between polynuances scores for different outcomes) to learn more about how personality relates to outcomes. These patterns may inform us on some of the general principles regarding how personality intersects with phenomena outside the personality domain.
What do the findings tell us about personality traits?
As recently outlined by Baumert et al. (2017), one of the most important questions regarding the aetiology of personality traits—defined as correlated patterns of behaviour, thinking, and feeling—is whether each of them corresponds to a shared set of processes (amounting to a latent common cause) exclusive to this particular trait (‘correspondence’) or whether they arise from more complex interaction processes among some more basic components of personality (‘emergence’). It is possible to think that these basic components represent what we have termed as personality nuances. To the extent that the former scenario applies and the Big Five domains approximate the shared processes constituting latent causes of particular traits, one could expect personality–outcome associations to be mostly driven by the domains. To the extent that behaviour, thinking, and feeling coalesce into what appear as traits because of more widespread interactions among them, there is less reason to think that the personality–outcome association should be driven by the traits per se, because the behaviours, thoughts, and feelings that give rise to them are causally autonomous and they are not exclusively aligned with any one trait alone. If so, the present findings may be more in line with the ‘emergence’ explanation of traits, although not directly supportive of it.
Implications for behavioural interventions
Findings that personality traits are linked with a range of positive and negative life outcomes have lead researchers to consider the possibility of intervening on relevant personality traits to obtain desirable changes in these outcomes. For example, Jokela et al. (2013) discuss the possible effect of increasing conscientiousness on improving life expectancy. When and to the extent that personality–outcome associations are driven by nuances rather than broadly acting underlying trait domains, potential interventions aiming to change outcomes by changing personality ought to first identify the most relevant nuances for these outcomes and then specifically target these. On the one hand, this could be easier than targeting domains, which would be a more attractive course of action if the associations were driven by domains per se. For example, changing a habit is likely to be easier than changing the whole collection of behaviours, thoughts, feelings, and motivations that conscientiousness encompasses. On the other hand, if the number of relevant nuances is large, selecting the best targets may be complicated. Nevertheless, our findings suggest that personality–based interventions may generally be more successful when focusing on more specific behavioural, cognitive, affective, and motivational tendencies.
Limitations and future directions
Probably the biggest limitation of this study is that the 50–item Big Five questionnaire, IPIP, is likely to cover only a very limited set of nuances. Not only is the sheer number of items small, but these items also tend to overlap in their content, for example, ‘I seldom feel blue’ and ‘I often feel blue’ or ‘I have a vivid imagination’ and ‘I do not have a good imagination’. As a result, the potential benefits associated with item model prediction may be much more substantial when more comprehensive personality measures are used. Moreover, future studies should go beyond a preconceived and contrived construct space. Specifically, most existing personality questionnaires are explicitly designed to include sets of items that each measure one of the Big Five domains and nothing else. Within these sets, items are selected to maximize their common variance in order to ensure questionnaires’ internal consistency—that is, items are designed to overlap in content. Consequently, by design, most personality questionnaires are likely to measure only limited sets of nuances, even when they include large numbers of items. In addition to using a range of existing questionnaires, future research should investigate whether outcome prediction can be further enhanced by deliberately selecting a diverse range of items and covering as broad a range of nuances as possible. To do so, more nuances should be identified, for instance, by subjecting data from large personality item pools to clustering procedures (Condon, Roney, & Revelle, 2017).
As item–level analyses appear to confer substantial additional predictive value, reliably detecting this will require large samples—another lesson we can learn from genetics. It is a common practice in GWAS studies to aggregate samples, often using harmonized or linked measures of the outcomes (Davies et al., 2015; Hill et al., 2017). Also, GWAS studies are often making their findings publicly available to facilitate collaborative efforts (e.g. the LD Hub; http://ldsc.broadinstitute.org). Similarly, personality researchers should begin publishing item–level raw data and outcomes, as this will facilitate the identification of item–level associations and predicting outcomes across multiple studies. For example, what we did across subsamples could be done across studies. At least, item–level association profiles should be published, so that they can be recycled (e.g. for predicting not–yet–measured outcomes) or meta–analysed in other studies (e.g. Mõttus et al., in press).
Here, if only implicitly, we have treated outcomes as dependent variables—something to which personality may potentially contribute to. Of course, what we conceptualize as personality may often partly result from variability in the outcomes such as educational qualification or occupational level, or they may spuriously correlate due to shared causal factors such as polygenic influences (Turkheimer, Pettersson, & Horn, 2014; Mõttus, Realo, Vainik, Allik, & Esko, 2017). However, regardless of the direction of the causality between personality and outcomes, representing their associations as accurately as possible is likely to contribute to a better understanding of them. Also, we should note that most associations were longitudinal in this study, with personality being measured about 5 years before outcomes: in some cases, this may have diminished the probability of outcomes (e.g. ‘sleeping enough’) ‘leaking’ into personality ratings.
Conclusion
We report that predictive models based on 50 items, treated as markers of personality nuances, tend to explain more variance in a wide range of outcomes than models based on the Big Five domains. On average, the predictive advantage was an admittedly modest 1.3%. Should anyone care? We think that there are reasons to heed these findings. First, although the difference between more parsimonious domain–level models and more complex item–level models is not large in absolute terms—most effect sizes are small to start with and probably for a good reason—outcomes are multiply determined. Therefore, the relative difference is more substantial: moving from domain to item models confers a 30% increase in the amount of variance accounted for in outcomes. Second, this is likely to be a lower–bound estimate of the incremental value of item models, given that the instrument used in this study was short and limited in item content, and it was deliberately designed to measure the Big Five traits and nothing else. With more comprehensive item pools, the incremental predictive value of item models will probably be larger. Third, our analyses lend credit to the hypothesis that personality–outcome associations, even if they are modelled using more parsimonious domains, are driven by the specific personality characteristics that individual items are markers of, either directly or by means of being in ‘linkage’ with the directly relevant characteristics. Therefore, even if and when domains do allow for a reasonable prediction of outcomes, they may often not be useful as explanatory units for the associations. In order to move from correlations towards explanations, item models may turn out to be more helpful in the end. To the extent that causal contributions from personality to outcomes are plausible at all, we now have evidence that outcomes may be highly polycausal (polynuanced) and that this is especially plausible for outcomes that are more strongly linked with personality. These findings alone are informative. In conclusion, where sample sizes are large enough, future personality research could routinely build prediction models from items, in addition to domain–based models. Importantly, this comes at no additional cost in terms of data collection. Ultimately, more accurate descriptions can help with more realistic explanations.
Acknowledgements
The analyses in this work are based on data from the National Child Development Study (NCDS). The authors are grateful to the Centre for Longitudinal Studies (CLS), UCL Institute of Education for the use of these data, and to the UK Data Service for making them available. However, neither CLS nor the UK Data Service bears any responsibility for the analysis or interpretation of these data.
Supporting info item
Supporting info item, per2147-sup-0001-PER_Open_Practices_Disclosure_Form_PER_2147 - Successful Explanations Start with Accurate Descriptions: Questionnaire Items as Personality Markers for More Accurate Predictions
Supporting info item, per2147-sup-0001-PER_Open_Practices_Disclosure_Form_PER_2147 for Successful Explanations Start with Accurate Descriptions: Questionnaire Items as Personality Markers for More Accurate Predictions by Seeboth Anne, Mõttus René and Kandler Christian in European Journal of Personality
Footnotes
Notes
References
Supplementary Material
Please find the following supplemental material available below.
For Open Access articles published under a Creative Commons License, all supplemental material carries the same license as the article it is associated with.
For non-Open Access articles published, all supplemental material carries a non-exclusive license, and permission requests for re-use of supplemental material or any part of supplemental material shall be sent directly to the copyright owner as specified in the copyright notice associated with the article.