
Abstract
In this work, copper ferroalloys (CFAs) with various Fe contents (5, 10 and 30 wt-%) were fabricated via the mechanical alloying and vacuum sintering method, followed by hot and cold rolling. Microstructure, mechanical, electrical and magnetic properties were investigated using scanning electron microscopy (SEM), X-Ray diffraction (XRD), tensile testing, four-point probe, vibration sample magnetometer and dc BH circuit tracer, respectively. The CFAs with homogenous and fine in-situ Fe particles prepared by powder metallurgy showed better performance compared with previously reported conventional casting. After annealing at 400°C, the cold-rolled CFA with 30 wt-% Fe had the tensile strength of 621 MPa, the electrical conductivity of 50.2% IACS, magnetic saturation strength (Ms) of 60.39 emu g−1 and coercivity (Hc) of 98.2 Oe, achieving a good combination of mechanical and functional properties. Relations between the microstructure and mechanical and functional properties are discussed in detail.
Introduction
Copper ferroalloys (CFAs) have attracted a lot of interest due to their high strength and electrical conductivity, outstanding magnetic properties and electromagnetic shielding [1–4]. They have many applications in electronics, machinery and transportation, such as magnetic recording storage elements, shielding wires, cable jackets, new motor coils and smartphone accessories. Thus, they have been a subject of research in materials science for many years.
However, the mixing enthalpy between Cu and Fe is positive, resulting in an immiscible region of the metastable liquid phase in the phase diagram. This miscibility gap was first observed by Nakagawa [5]. When the homogeneous melt of this system is cooled and enters the liquid-phase immiscible zone, it will decompose into two mutually immiscible liquid phases. In traditional casting processing, the homogeneous melt tends to form a structure with severe segregation due to low cooling rates of about 102 K sec−1. Meanwhile, the Fe particles are coarse and dendritic, which makes CFAs produced by casting be apt to crack during plastic deformation. To solve this problem, many researchers have studied CFAs through various methods. Jeong et al. [6,7] controlled the shape and size of Fe by adding a small amount of Si element. Fine and spherical Fe phase was formed when 2 wt-% Si was added, and the yield strength was 35% higher than without Si. Li et al. [8] studied the microstructure and properties of Cu-10Fe-3Ag original composites. The addition of Ag can refine the primary Fe weaving crystals under cold working conditions. The tensile strength was 230 MPa, which was higher than the Cu-10Fe composites, and the electrical conductivity was about 4% IACS. The above work demonstrated that the distribution and size of Fe particles in CFAs were improved in the casting process, along with the physical properties. Nevertheless, the mechanical and functional performance of CFAs by casting is far from satisfying, especially for CFAs with more than 10 wt-% Fe, due to inherent immiscibility during casting.
It is well known that powder metallurgy (PM) technology is an effective way to minimise the segregation of alloy components, eliminate coarse and uneven cast structure, which is an advanced process for preparing high-performance materials. Wang et al. [9] prepared Cu-15 wt-% Fe alloy by gas atomisation pre-alloy powders and spark plasma sintering (SPS), and subsequent cold working. The results show that the tensile strength was 1216 MPa, and the electrical conductivity was 47.6% IACS when the total deformation strain was 6. The study of Kim et al. [10–12] shows that the electrical conductivity and magnetic properties of CFAs increased with the decrease of the size of gas atomisation alloy powders. When the powders particle size was less than 24 μm, the electrical conductivity of CFA 30 was 20.1% IACS, the magnetic saturation strength (Ms) was 57 emu g−1, and the coercivity (Hc) was 256 Oe. Jerman et al. [13] prepared a precursor body by powder metallurgy and obtained a Cu-Fe alloy with excellent properties through deformation and heat treatment. Current studies of PM CFAs have mainly focused on gas atomisation alloy powders and SPS processing. However, atomised spherical powders have the disadvantages of poor formability and solid–liquid phase transition, and the preparation efficiency is severely limited by the SPS process. Furthermore, the systematic study of the relationship between the microstructure, mechanical, electrical and magnetic properties of Cu-Fe alloys produced by PM is still lacking, which have important research value in electromagnetic shielding materials related to communication base stations and electronic devices.
In this study, PM CFAs were prepared by mechanical alloying, cold isostatic pressing, vacuum sintering and subsequent rolling deformation, with no solid–liquid phase transition. This route can be used to prepare large-size samples with the complex shape at a low cost. The results showed that CFAs with fine and uniform in-situ Fe particles were achieved and their comprehensive performance was superior to traditional methods and previous research reports. The relationship between microstructure and mechanical and functional properties was discussed. It can provide relatively complete basic data for industrial production.
Experimental procedure
Commercially available electrolytic Cu powders (99.5%, D50 = 10 μm) and carbonyl Fe powders (99.5%, D50 < 10 μm) were used as raw materials. The powders were then sealed in a stainless steel jar under an argon atmosphere with a ball-to-powders ratio of 10:1, and the powders were ball milled for 16 h at room temperature using a GN-2 high-energy vibration ball mill. 1 wt-% stearic acid was added as a process control agent to prevent powders from sticking to the tank during ball milling. To avoid oxidation of raw powders before transfer to stainless steel jars, the raw materials were stored in a glove box filled with high purity argon gas and the powders loading was completed in this box. The composite powders after ball milling were annealed at 500°C for 1 h to improve their formability. After that, cold isostatic pressing (CIP) at 200 MPa was conducted to obtain a green body with 100 × 100 × 12 mm dimensions. The sintering process was performed at 1000°C for 2 h in a vacuum sintering furnace (10−2 Pa, HTS-1500) at 5°C min−1 heating rate. Pure titanium powders as oxygen absorbents were placed around the green samples but not in contact with each other during sintering. The sintered block sample was 3 mm thick after hot rolling at 800°C, and then cold-rolled into 0.5 mm thickness. Herein, ϵ was introduced to represent the strain in the rolling process, ϵ = ln (h0/h), where ϵ is the strain, h0 and h are the initial and final thickness of the sample, respectively. Finally, the cold-rolled samples were annealed at 400°C and 600°C for 1 h, respectively. The preparation process is shown in Figure 1.
Schematics of the CFAs fabrication process.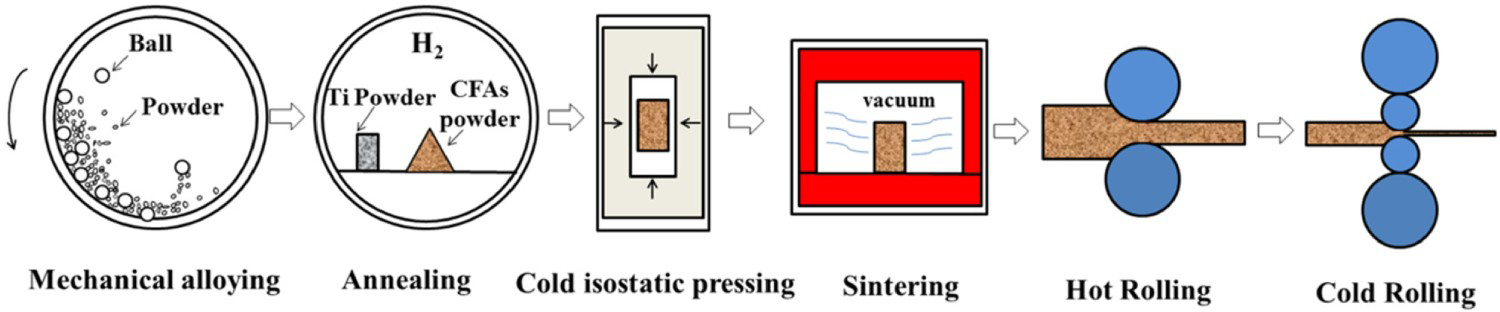
The density was measured according to Archimedes’ principle. Phase identification was evaluated by X-ray diffraction (XRD, TTRIII) with Cu Kα radiation at a scanning rate of 5° min−1, 40 kV and 30 mA. The microstructure and composition of CFAs were analysed by field emission scanning electron microscope (FESEM, Zeiss Supra 55), energy dispersive spectra (EDS) and transmission electron microscopy (TEM, FEI Tecnai G2-F20). Room temperature tensile tests were conducted using a YHS-216W-200N electronic universal testing machine, according to the ASTM E8. Electrical conductivity was measured by using a four-point probe at room temperature. The results were expressed in units of ‘% IACS’ calculated by comparison with the electrical conductivity of an International Annealed Copper Standard. The magnetic performance test was carried out by the Lakeshore-7400s vibration sample magnetometer with a maximum applied magnetic field of 15,000 Oe. The measurement accuracy of the magnetic saturation strength (Ms) was 5 × 10⁻⁷ emu, and the coercivity (Hc) was measured by a dc BH circuit tracer with an accuracy of 10−2 Oe. After testing, the samples were weighed using a precision balance with an accuracy of 0.0001 g.
Powders characterisation
The SEM micrographs of raw powders are shown in Figure 2. Figure 2(a) shows the electrolytic Cu powders with an irregular shape and an average particle size of about 10 μm. Figure 2(b) shows the carbonyl Fe powders, with spherical shape and the particle size less than 10 μm. Figure 2(c) shows the mechanically alloyed composite powders with a flake shape and a size of fewer than 10 μm. Figure 3 shows the X-ray diffraction patterns of the ball-milled CFAs (containing 5, 10 and 30 wt-% Fe, marked by CFA 5, CFA 10 and CFA 30, respectively) composite powders before and after annealing. All diffraction reflections in the spectra are attributed to body-centred cubic (bcc) α-Fe and face-centred cubic (fcc) Cu phases. No reflections of other intermetallic compounds were found. The reflections positions of the Fe and Cu phases did not change with different composition, indicating that the crystal structure remained stable. The composite powders of CFA 5 and CFA 10 had only diffraction reflections of Cu, and CFA 30 had a tiny hump of Fe (110) in addition to Cu after ball milling. After annealing, (110), (200) and (211) Fe diffraction reflections appeared, and their intensity got stronger with increased Fe content. In addition, Cu (200) reflection position after annealing was shifted to a larger angle, and the diffraction reflection became narrower. This indicated that the Fe in CFA 5 and CFA 10 had been completely dissolved in Cu, while CFA 30 still had a small amount of undissolved Fe after ball milling, which was consistent with previous reports on the mechanical alloying of Cu-Fe alloys [14–17]. According to the Cu-Fe phase diagram, the equilibrium solubility of Cu and Fe at room temperature is close to zero, but mechanical alloying can extend the equilibrium solubility limit to form a supersaturated solid solution [18]. Because the atomic radii of Fe and Cu are very close (1.26 and 1.28 Å, respectively), and their electronegativity is also comparable, it is easy to form a substitutional solid solution, causing a certain degree of lattice distortion because of the repulsion induced from the positive enthalpy between Cu and Fe. After annealing, the Fe element precipitated from the Cu matrix, which resulted in the occurrence of Fe diffraction reflections and the slight shift of Cu narrower diffraction reflections to larger angles.
SEM images of raw material powders: (a) electrolytic Cu powder; (b) carbonyl Fe powder and (c) mechanically alloyed composite powder. XRD patterns of CFAs before and after annealing: (a) 20–90°; (b) 44–52°.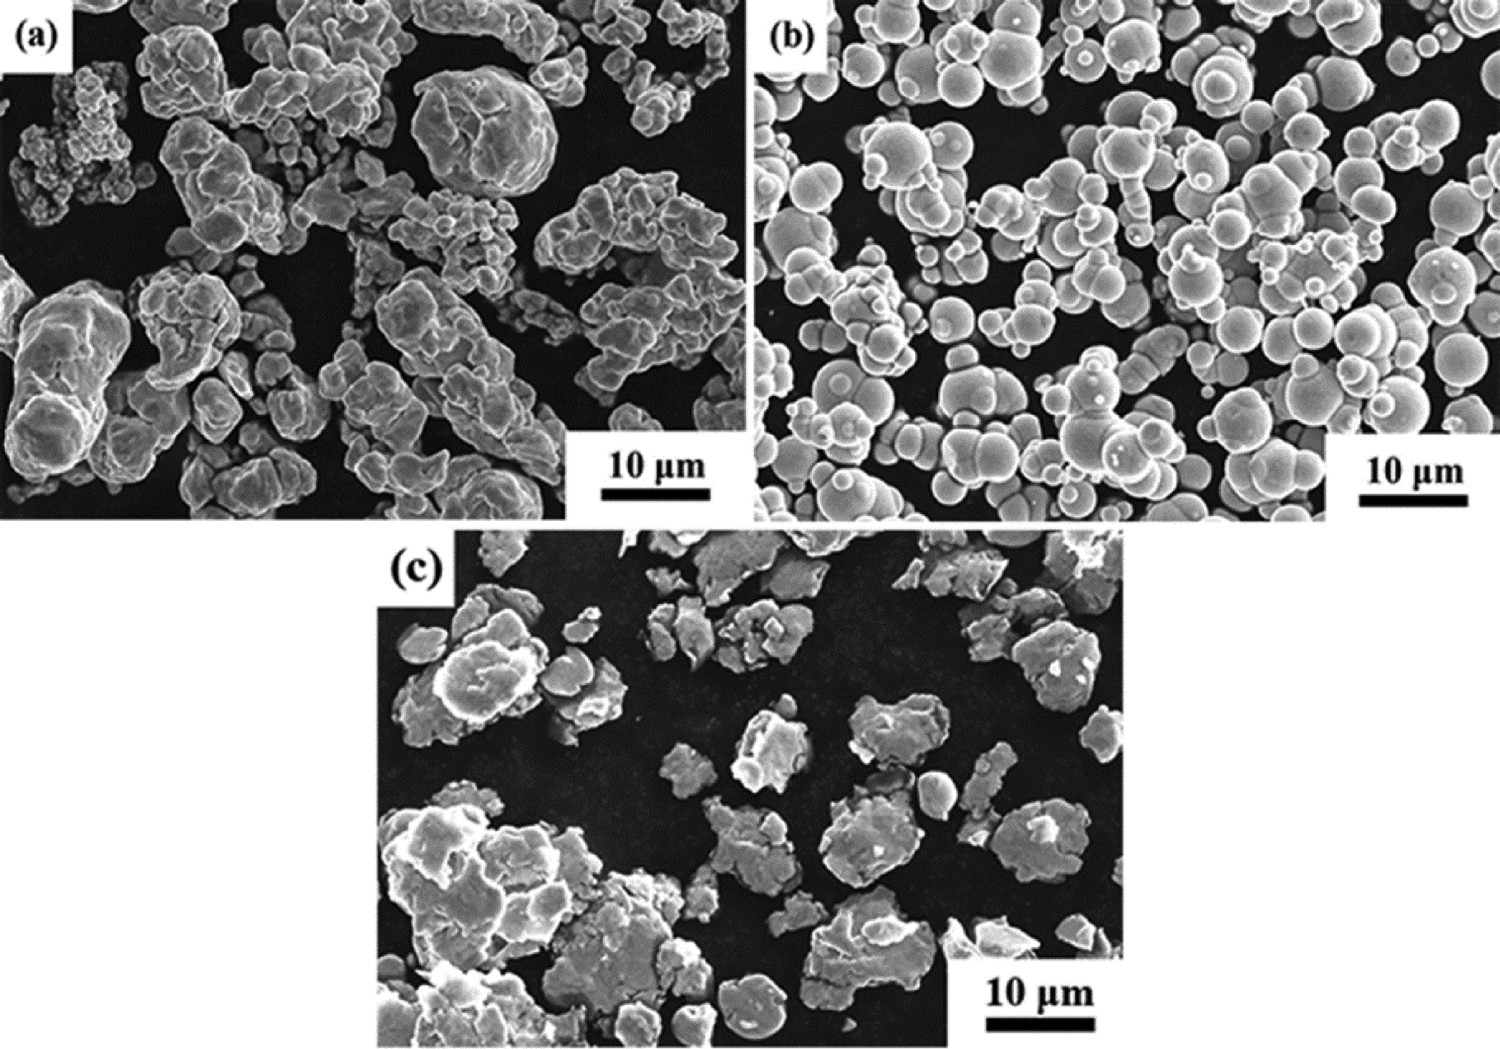
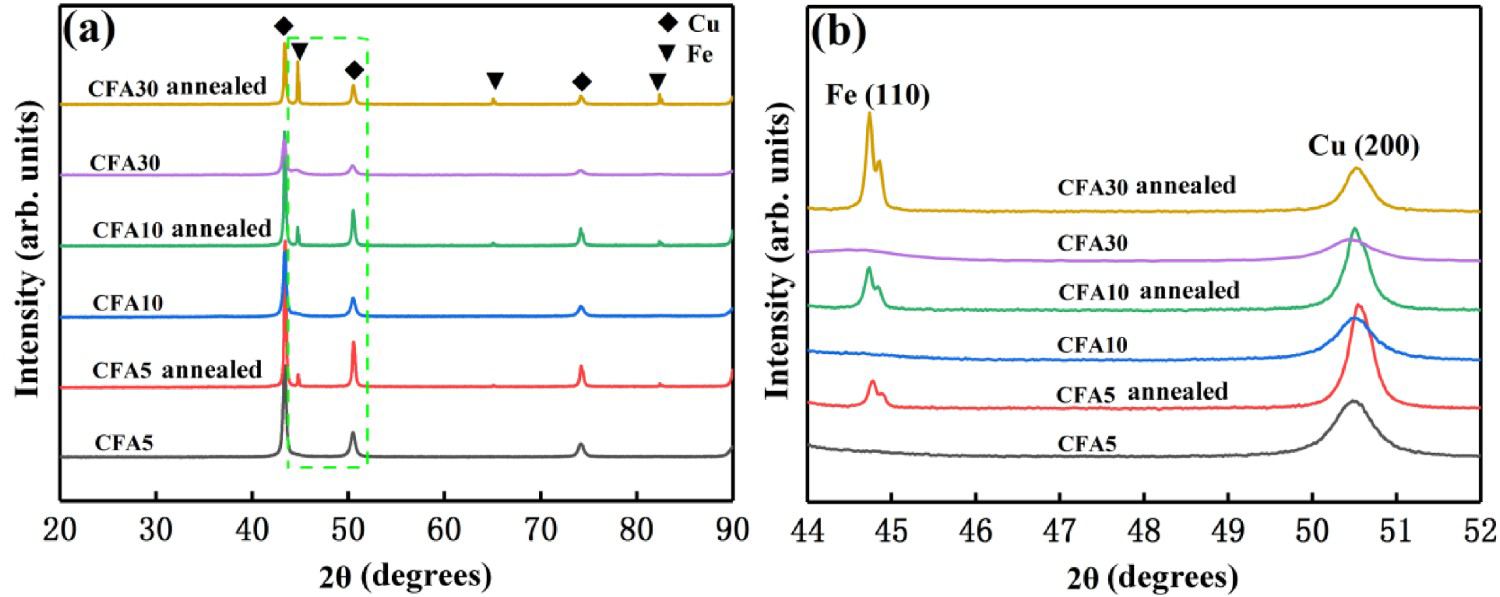
Figure 4 is the EDS mapping spectrum of the cross-section of the CFA 10 and CFA 30 composite powders after mechanical alloying. The element distribution profile showed that Cu and Fe overlapped well, and the distribution was uniform, without obvious segregation. This indicated that Fe was uniformly dissolved in Cu after ball milling, which was consistent with the XRD results.
EDS mapping of the CFAs composite powders cross-section after mechanical alloying: (a) CFA 10; (b) CFA 30.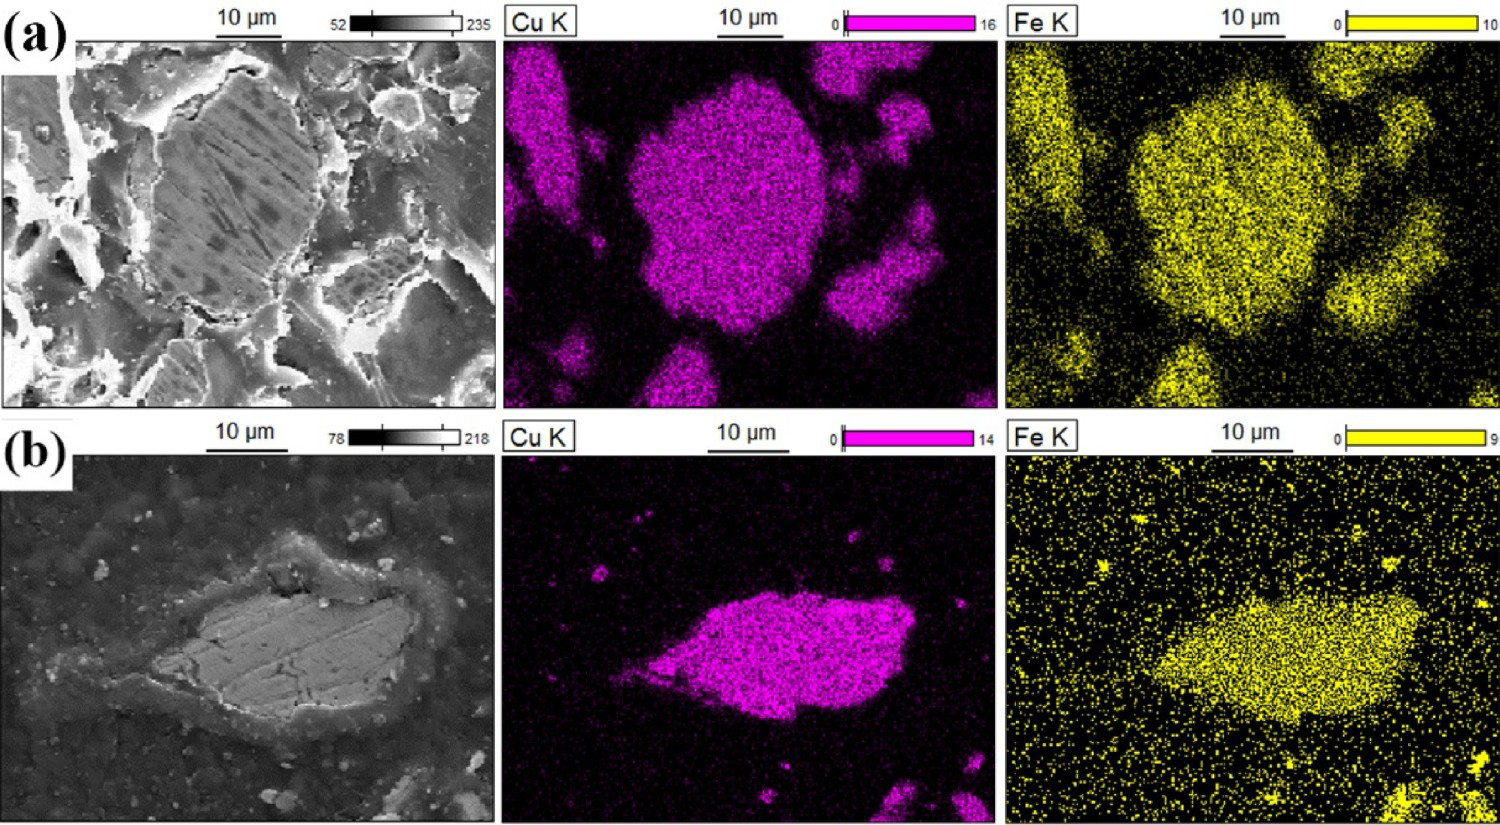
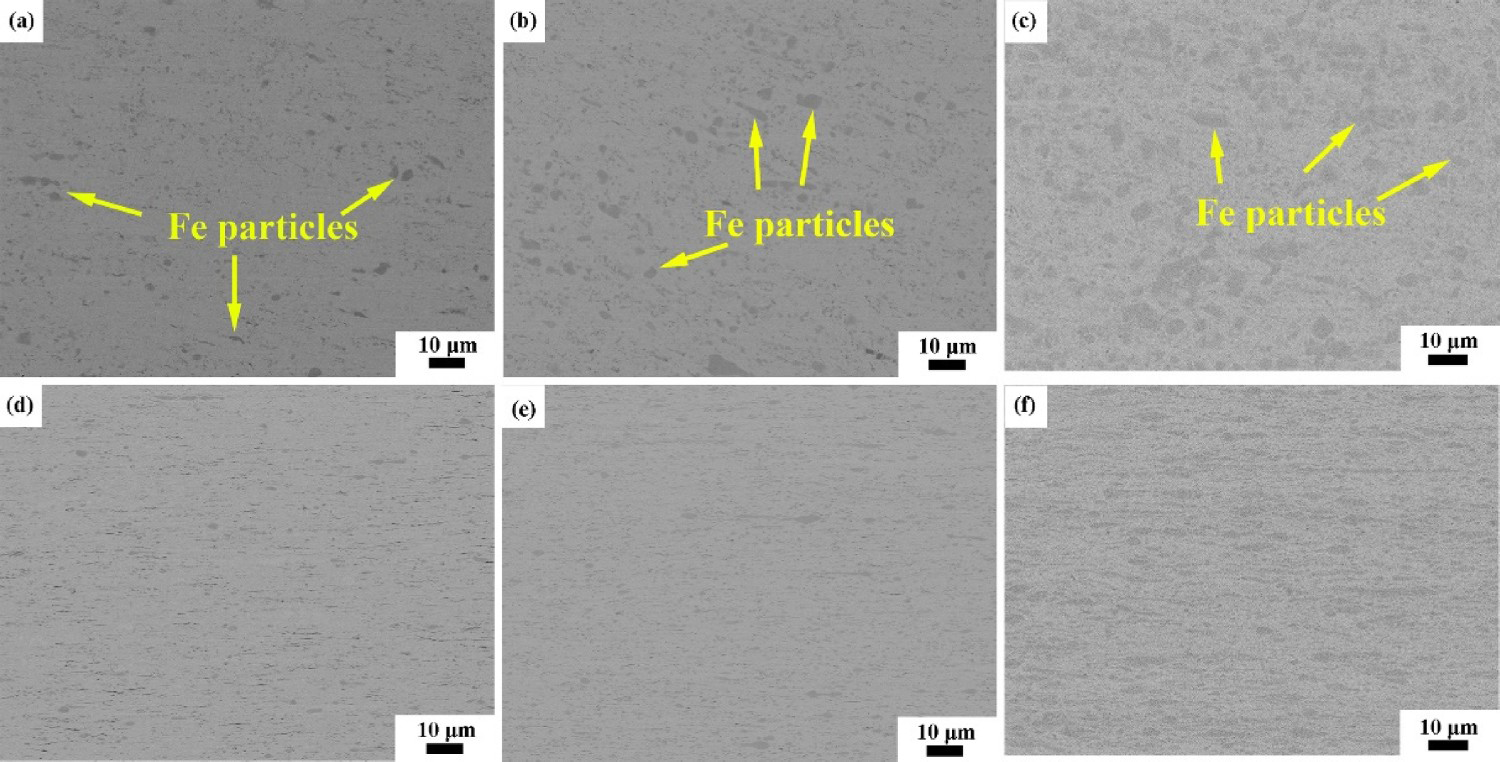
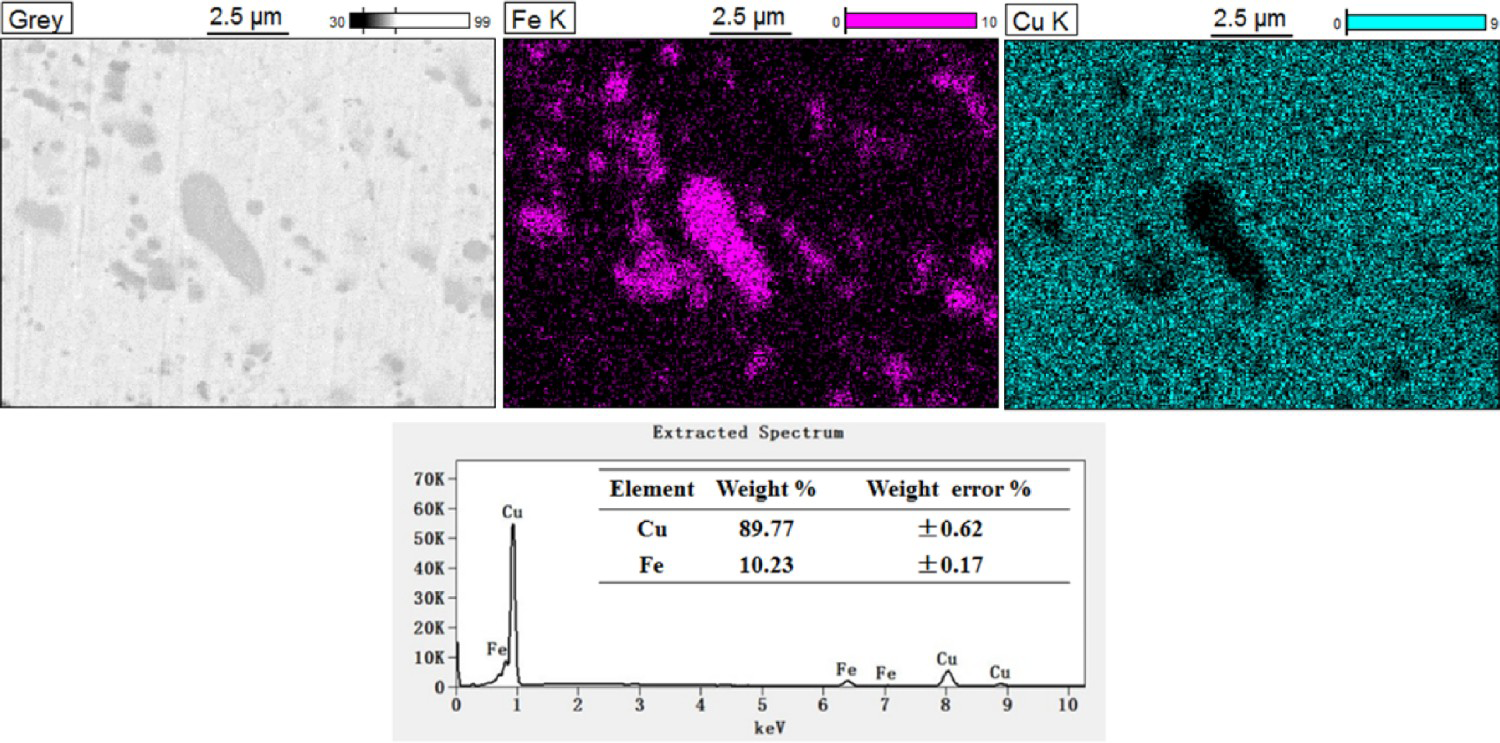
Figures 5 and 6 are SEM images of cross-sections and longitudinal sections of CFAs with different Fe contents after hot rolling and cold rolling, respectively. As shown in Figure 5, CFAs have achieved densification after the large deformation (ϵ = 1.2) during hot rolling, and the density of CFA 5, CFA 10 and CFA 30 have reached 95.5%, 97.2% and 98.3%, respectively. The reason for the lack of complete densification is that there may be some oxides and pores in the sample which hinder the densification process and are difficult to weld in hot rolling. This is beneficial to the subsequent cold rolling process, which can not only alleviate the internal stress of rolling, but also hinder the propagation of microcracks. The dark grey and irregular area related to the Fe-rich phase, and the bright white area is related to the Cu-rich phase. Figure 7 shows the element distribution profile and the element energy spectra of the EDS mapping in the longitudinal section of CFA 10 after cold rolling. It could be seen that the Cu phase was surrounded by the Fe phase, which proved that the grey particles were Fe particles and the bright white area was the Cu matrix. The measurement result of Fe content was about 10.23 wt-%, which proved the advantages of controllable structure and composition, uniform structure and no segregation in the PM process. The number of pores reduced with increased Fe content after rolling. The Fe particles had an irregular shape in the transverse direction and were distributed in a strip shape in the longitudinal direction due to deformation and elongation. The deformation of the particles was not uniform. Some Fe particles were more elongated in the rolling direction, and the length and width were relatively large. Others still maintained a small aspect ratio, and the pores were also elongated in the rolling direction due to deformation, which induced large cracks along the rolling direction. After cold rolling, the pores were further reduced, and the relative density of CFA 5, CFA 10 and CFA 30 reached 98.8%, 99.2% and 99.6%, respectively. The cross-section of Fe particles was irregular and randomly oriented. The Fe particles need to be compatible with the matrix during deformation to adapt to the strain of the matrix, resulting in an irregular shape. A similar phenomenon has been reported by Biselli [19]. The longitudinal section of Fe particles was elongated in a strip shape along the rolling direction, and partly lenticular due to the uneven deformation. After cold rolling, the thickness difference between the Fe particles in the longitudinal section was very significant, and the spacing between the particles decreased, showing obvious orientation distribution characteristics. The microstructure of the deformed CFAs was similar to previously reported deformed structures of Cu-Fe alloys [19–21]. Raabe et al. [22] pointed out that only when the amount of deformation was large, the secondary phase fibres with small size and uniform distribution could be formed.
SEM images of hot rolled CFAs: (a), (b) and (c) transverse section; (d), (e) and (f) longitudinal section; (a) and (d) CFA 5; (b) and (e) CFA 10; (c) and (f) CFA 30. SEM images of cold rolled CFAs: (a), (b) and (c) transverse section; (d), (e) and (f) longitudinal section; (a) and (d) CFA 5; (b) and (e) CFA 10; (c) and (f) CFA 30. EDS maps of the longitudinal section of CFA 10 after cold rolling.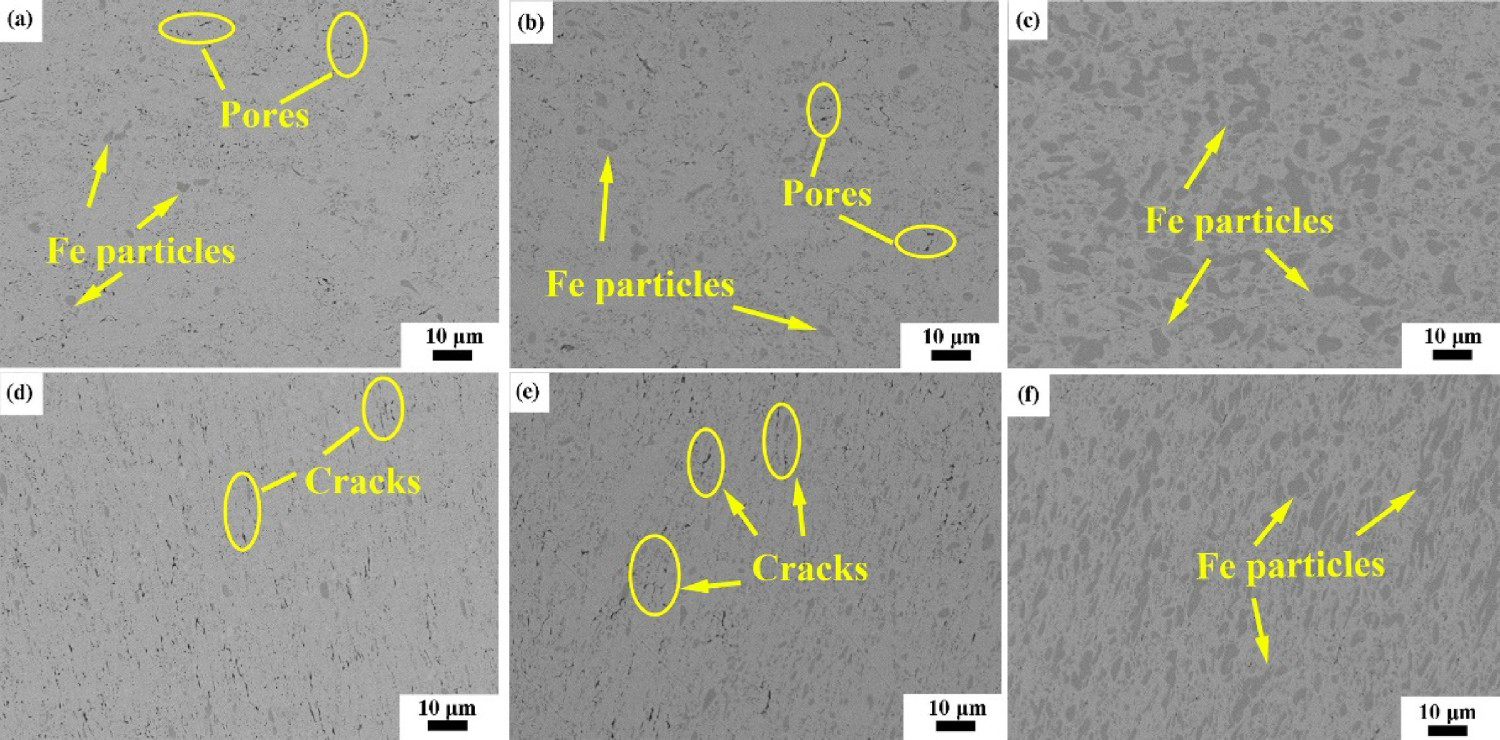
During rolling the microstructure of Cu-Fe alloy evolved as during typical deformation process of isotropic polycrystalline materials. When the material was deformed, the internal pores were compressed and welded, while some unwelded areas may be stretched to form micro-cracks. Meantime, the number of pores will be greatly reduced, increasing the relative density. During the deformation process, the Fe particles first rotated to the optimal orientation that was easy to be deformed. When the stress acting on the particles was large enough to reach the yield stress, the Fe particles will plastically deform and stretch in a stripe distribution along the rolling direction. When the stripe thickness was larger, the particle spacing was smaller, and the deformation tendency was related to the original particle size [19]. It can be observed from the cold-rolled longitudinal section SEM image of CFA 30 that the thickness of the lenticular Fe particles varies along the axis direction, which might be due to the uneven thickness of the original particles. The required stress was lower and therefore more prone to plastic deformation. The parts of the Fe particles were thinner in the central region, and local ‘necking’ occurs during the deformation process. When the stress acting on the region was large enough, it would break into two independent particles, resulting in the refinement of Fe particles. The generation of ‘necking’ helped the Fe particles and the copper matrix to be compatible with each other during the deformation process and maintain continuity with the two phases.
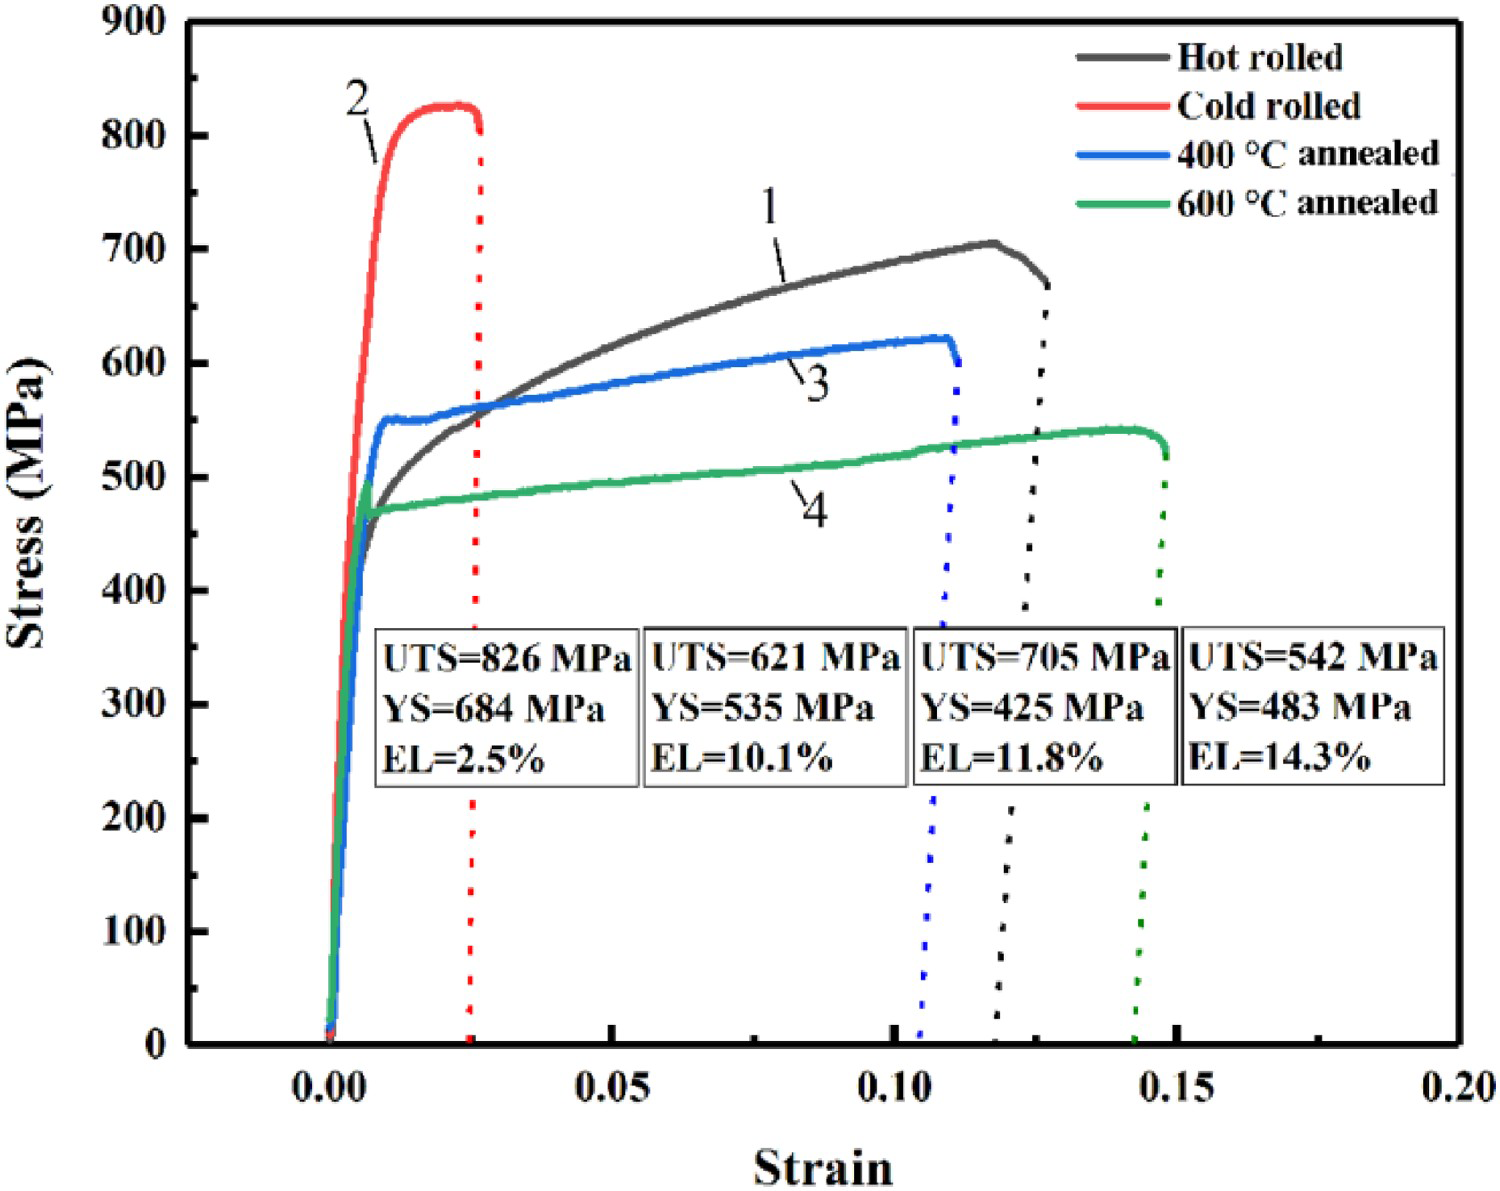
Figure 8 shows the bar chart of mechanical properties of CFAs with different Fe content after cold rolling followed by 400°C annealing. The ultimate tensile strength (UTS) increases and the elongation (EL) decreases with Fe content. When the content of Fe was 30 wt-%, the UTS was 621 MPa and the yield strength (YS) was 535 MPa, which is 169% and 339% higher than pure Cu, respectively. Figure 9 shows the true stress–strain curves of the CFA 30 alloy as hot rolled, cold rolled and annealed. After cold rolling the tensile strength was as high as 826 MPa, and the elongation was 2.5%. After annealing at 400°C, the tensile strength decreased to 621 MPa, and the elongation increased to 11%. After annealing at 600°C, the tensile strength decreased to 542 MPa, and the elongation increased to 14.3%.
Ultimate tensile strength (UTS), yield strength (YS) and elongation (EL) of cold-rolled pure copper and CFAs with different Fe content after 400°C annealing. Stress-strain curves of CFA 30 in different states: (1) Hot rolled; (2) Cold rolled; (3) 400°C annealing; (4) 600°C annealing.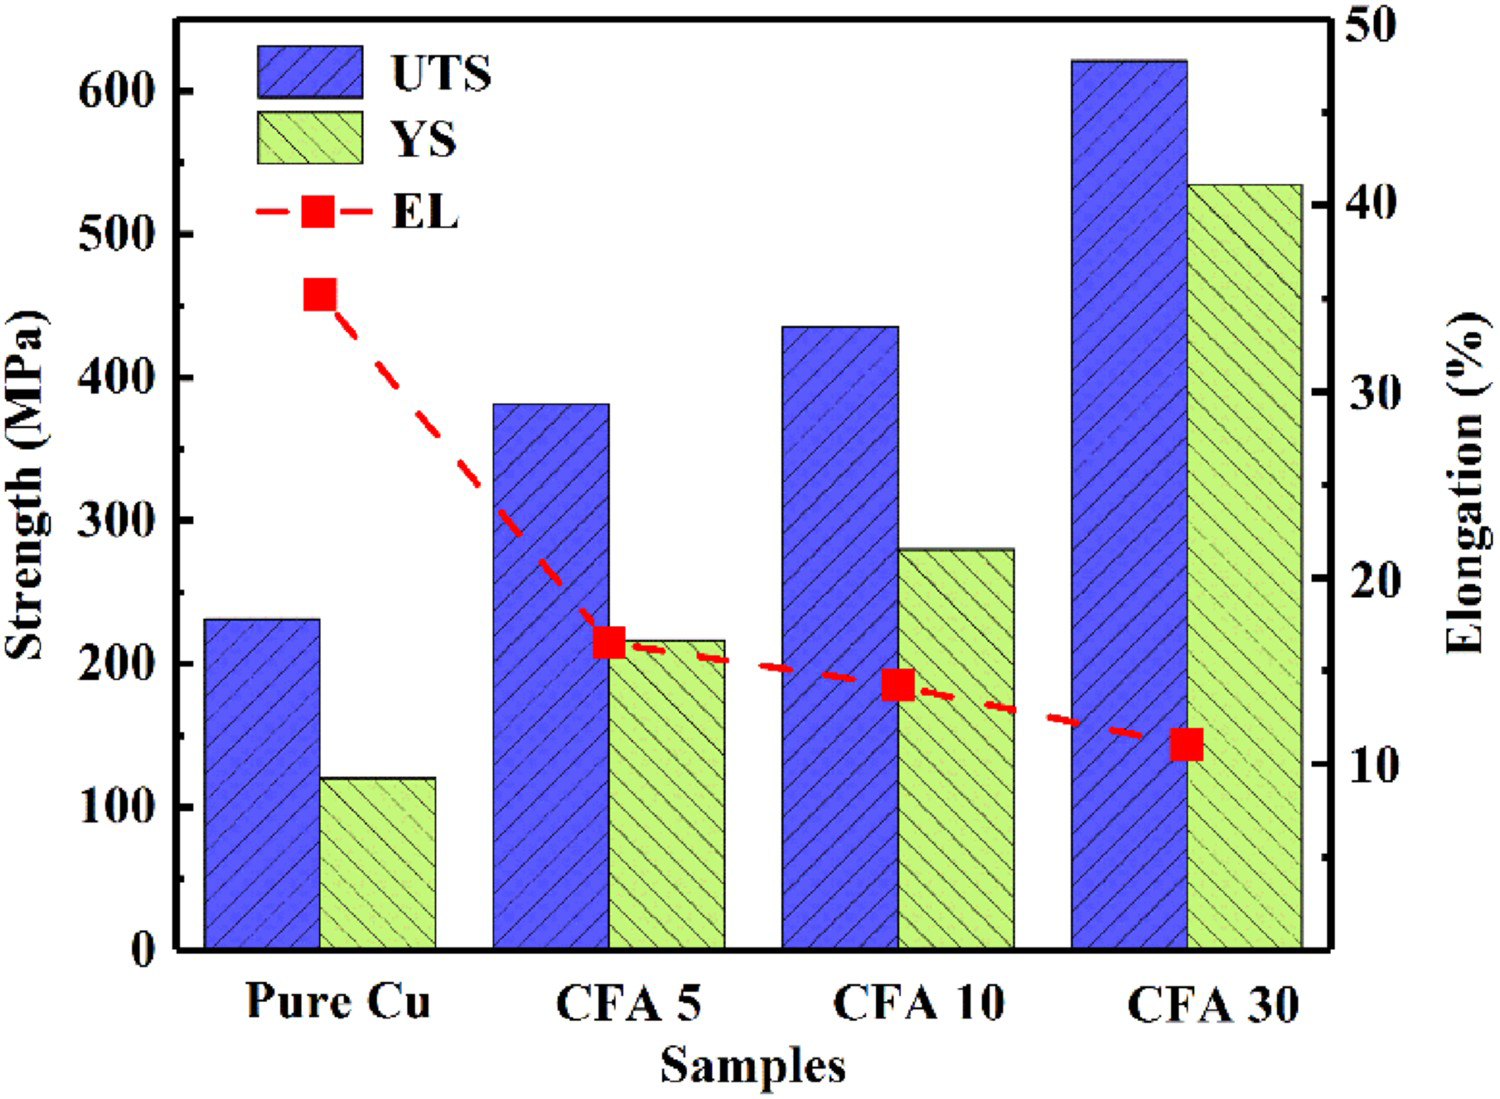
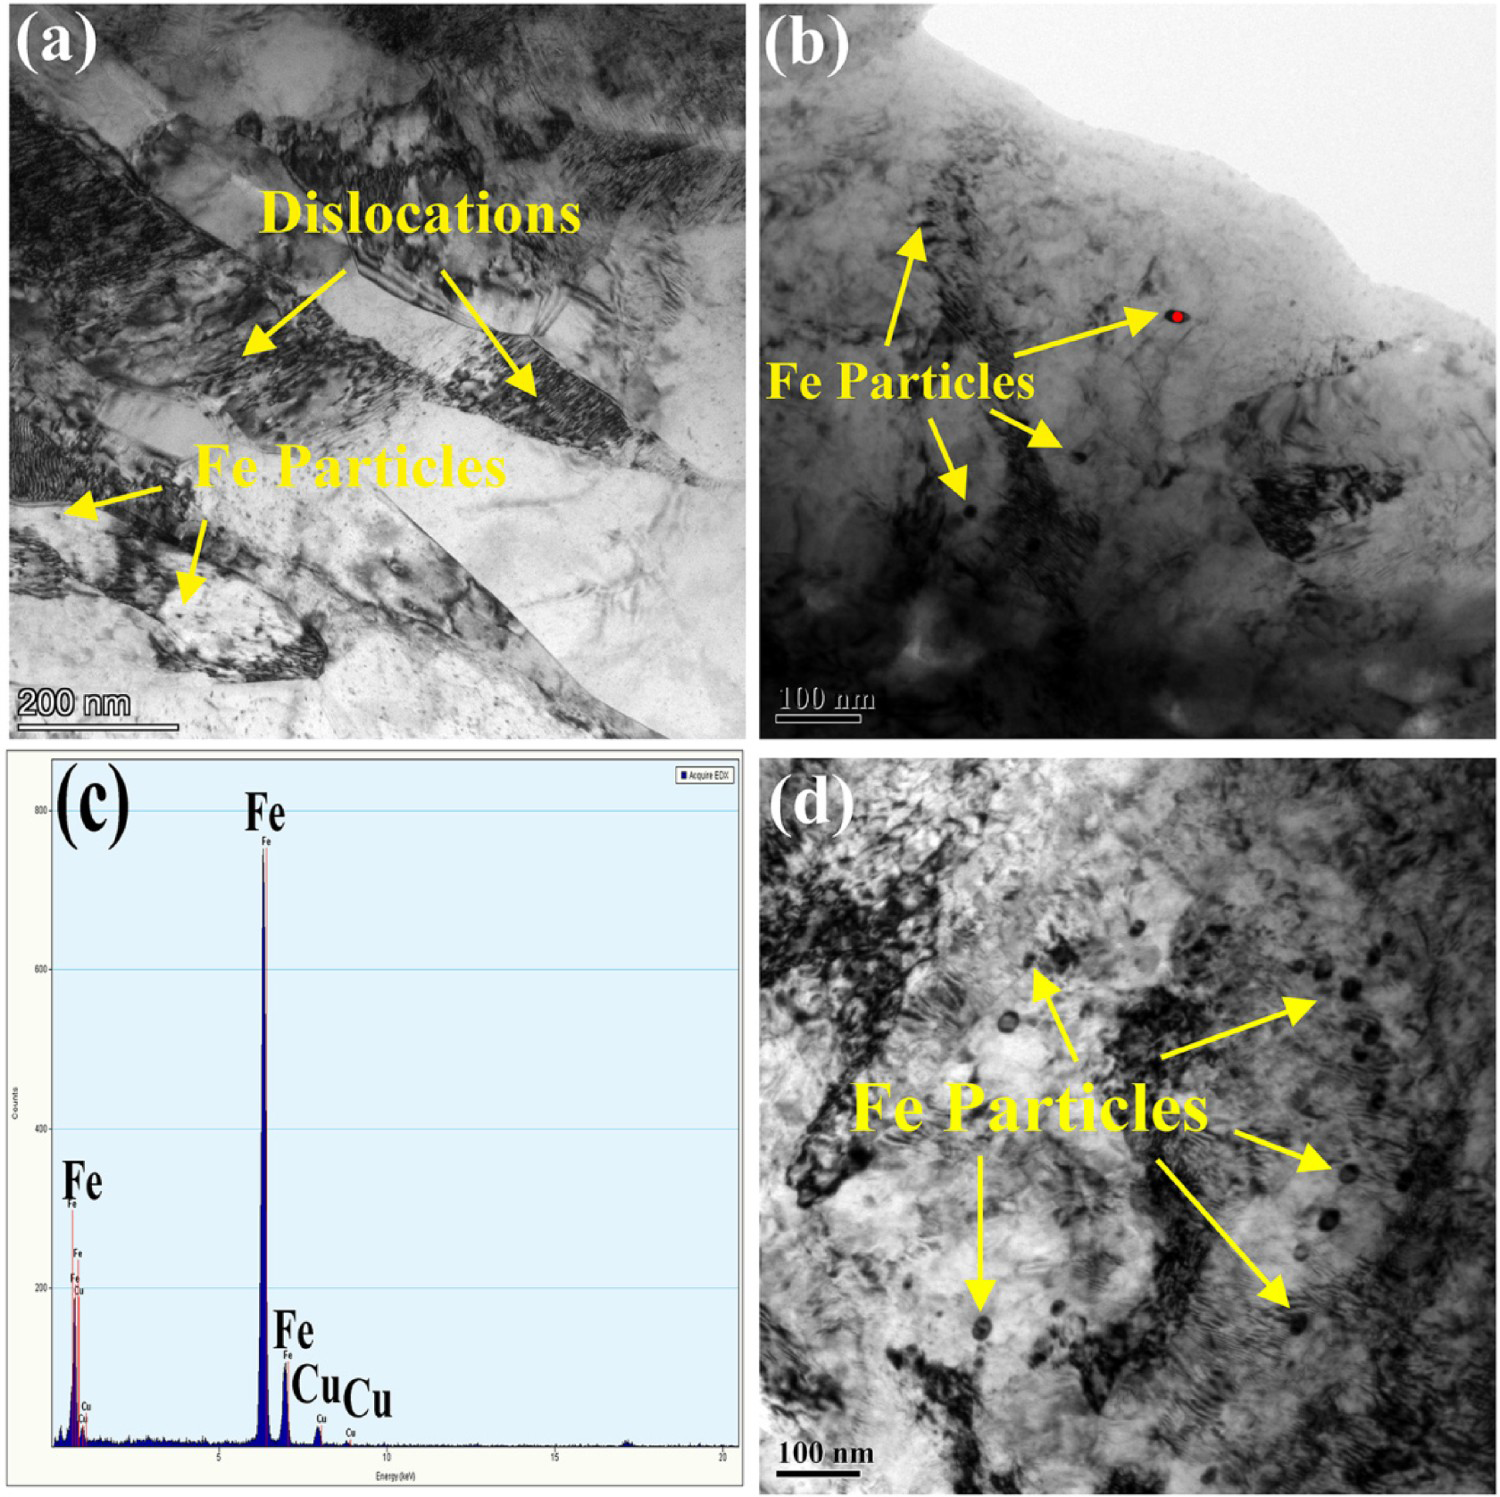
According to previous research results, Fe particles size, phase interface, grain size and the accumulation of dislocations during the rolling process were the main strengthening mechanisms of CFAs. Annealing promoted the coarsening of Fe particles, the precipitation of Fe particles, the recovery and recrystallisation of Cu matrix, which led to grain growth and the change of phase interface and dislocation as the fundamental reasons for the decrease of mechanical properties [23–25]. In this work, TEM analysis of CFA 30 cold-rolled and annealed at 400 °C was conducted, as shown in Figure 9. Figure 9(a,b) are TEM images of cold-rolled CFA 30 in the longitudinal section, in which many dislocations and dislocation cells (marked by yellow arrows) can be observed due to cold deformation. In addition, the grains were elongated along the rolling direction. In the meantime, a small amount of Fe particles in the size of ∼20 nm was found in the copper matrix. The EDS results in Figure 9(c) confirmed that the black particles were Fe. Figure 9(d) shows the TEM image of the cold-rolled CFA 30 after 400°C annealing in the longitudinal section. Many nano-sized Fe particles can be observed in Figure 9(d), and most of them were distributed in the dislocation network. This is due to the fact that after annealing, abundant nano-sized Fe particles precipitated at the defects of the copper matrix, and simultaneously the dislocation density decreased. The above reasons led to the change of mechanical properties and electrical conductivity, which will be discussed below.
After the large plastic deformation during cold rolling, the Fe particles were elongated into stripe distribution, which increased the dislocation density and phase boundaries, maintained the strain hardening level and high-density stripe interface, and finally obtained higher strength [26]. After annealing at 400°C, the matrix recovered and recrystallised, fine Fe particles precipitated, dislocation density decreased, internal stress caused by lattice distortion was released, and the strain hardening effect was partially eliminated. At the same time, the Fe stripe changed through longitudinal splitting, crushing and spheroidisation, and the particles became thicker [27]. These were the reasons for the decrease in strength. When annealed at a higher temperature at 600°C, more Fe particles precipitated from the matrix, and the spheroidisation of the stripe, the significant decrease of dislocation density and the complete elimination of internal stress greatly reduced the interfacial density and interfacial strengthening level, so the strength of the alloy was further reduced.
Fracture surfaces of the tensile samples were observed in detail by SEM, and the fracture morphology of CFAs in different states is shown in Figure 11. Many dimples of different sizes, shapes and depths were observed in all figures, and there were Fe particles in the pits of the dimples, showing typical ductile fracture characteristics. The large dimple size was ∼2 μm and the small dimple size was ∼200 nm, which was consistent with the stripe size and spacing observed by SEM. The dimple size obviously increased after annealing, which was due to the growth of Fe particles. The fracture morphology and stripe size reflected the morphology of the Fe stripe from another point of view.
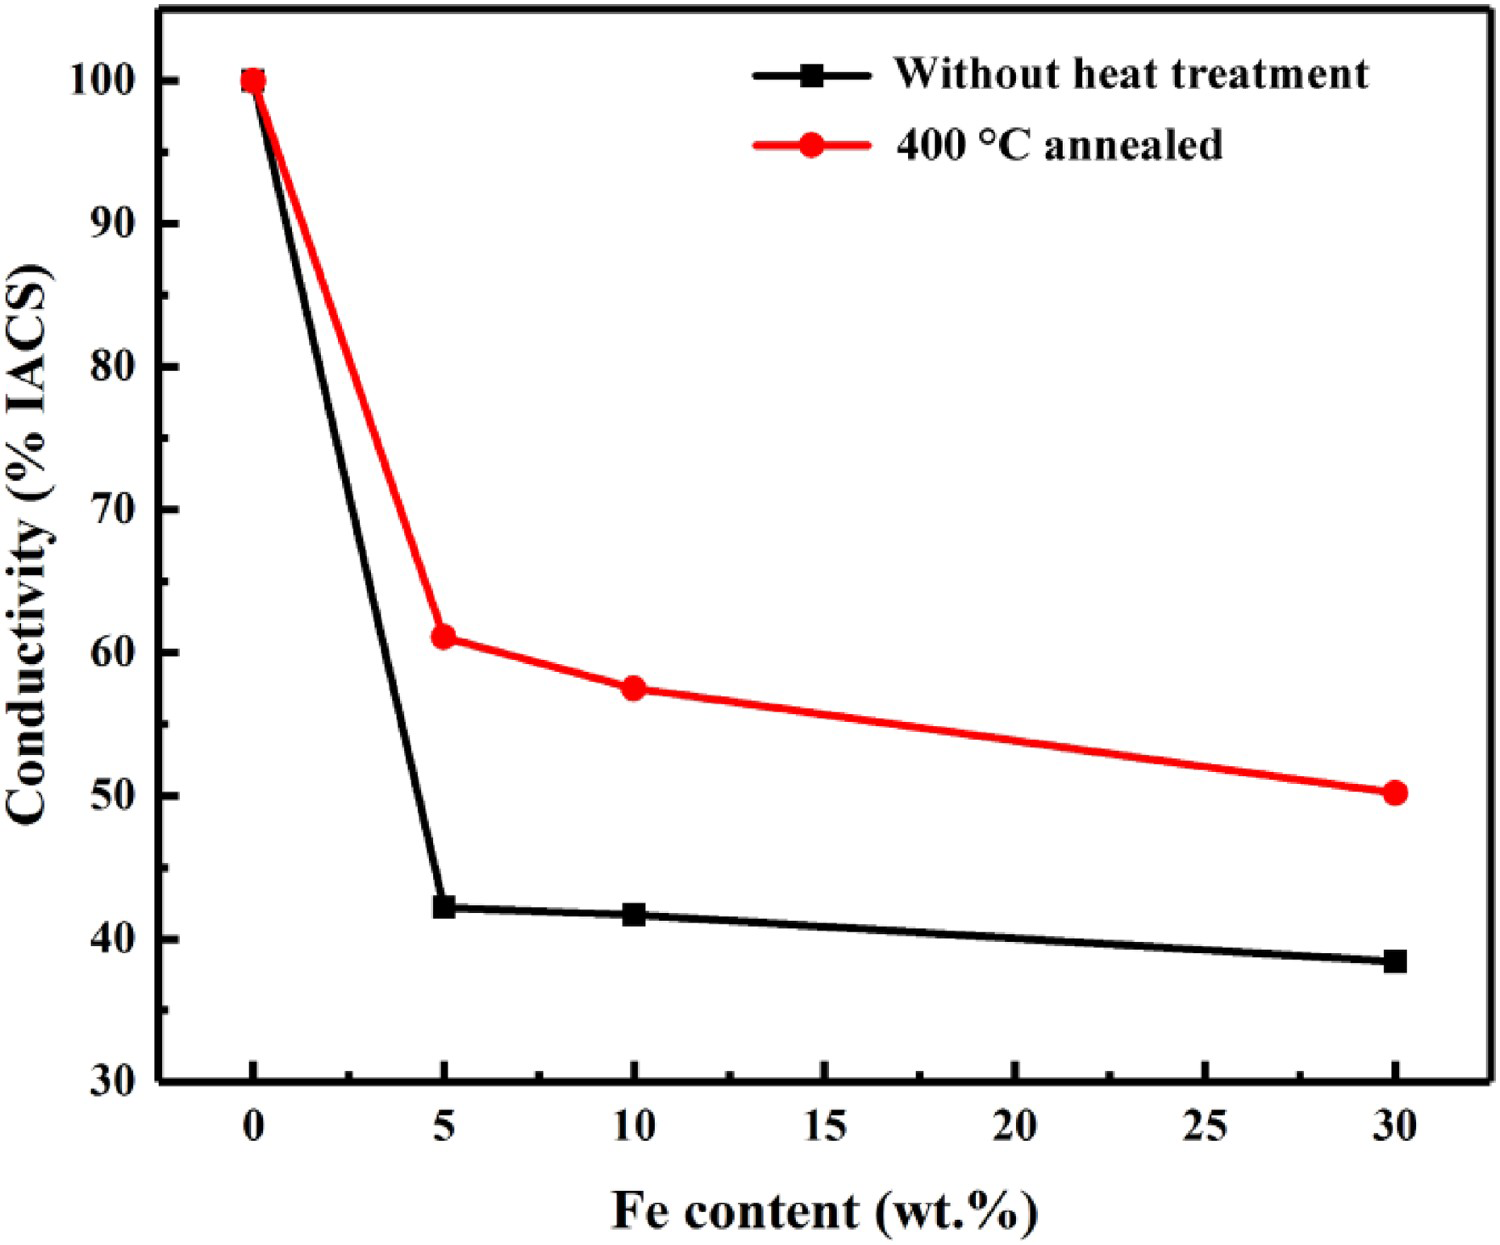
Figure 10 shows the change of electrical conductivity of cold-rolled CFAs before and after heat treatment. Before heat treatment, the electrical conductivity of CFA 5, CFA 10 and CFA 30 was 43.2% IACS, 42.7% IACS and 38.4% IACS, respectively. The electrical conductivity increased to 61.1% IACS, 57.5% IACS and 50.2% IACS after annealing at 400°C, respectively. Even if the conductivity of CFA is lower than pure Cu, it can meet the requirements of electromagnetic shielding applications. The broadband electromagnetic shielding effect of CFA can be achieved by adding magnetic iron to reduce the electrical conductivity of copper. The resistivity of the alloys mainly came from phonon scattering, interface scattering, impurity scattering and dislocation scattering, which can be expressed by the following formula [28]:
TEM results of CFA 30 cold-rolled and after annealing at 400°C: (a) and (b) TEM images of cold-rolled CFA 30 in the longitudinal section; (c) EDS results of the marked particles; (d) TEM images of CFA 30 after annealing at 400°C in the longitudinal section.

Saturation magnetisation
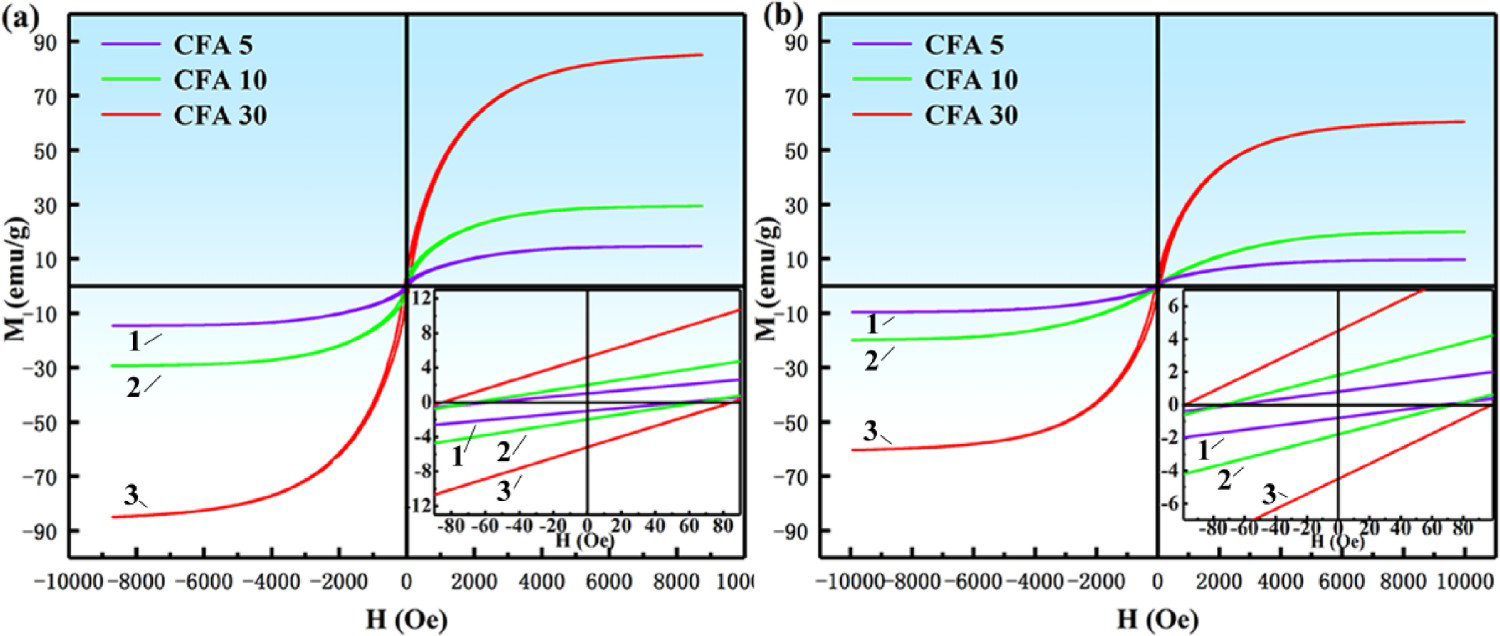
Figure 11 shows the hysteresis loop of cold-rolled CFAs with different Fe content before and after annealing. It can be observed that all prepared alloys exhibit soft magnetic behaviour characteristics with narrow hysteresis loops. Magnetic saturation strength (Ms) was attained when all the magnetic moments are aligned along some common direction resulting in the largest value of the magnetisation. Before and after annealing, as the Fe contents increased in the Cu matrix, the magnetic saturation strength (Ms) of the alloy increased. Although the present preparation route of CFAs is different from previous studies, it was also found that the Ms of CFAs increased with the Fe content, consistent with the results of previous studies [31,32]. Before annealing, the Ms of CFA 5, CFA 10 and CFA 30 was 14.76, 29.30 and 84.79 emu g−1, respectively. After annealing, the Ms of CFA 5, CFA 10 and CFA 30 is 9.7, 19.91 and 60.39 emu g−1, respectively. This demonstrated that annealing the CFAs resulted in a corresponding decrease in the magnetic saturation strength.
SEM micrographs of tensile fracture surface of CFA 30 in different states: (a) Hot rolled; (b) Cold rolled; (c) 400°C annealed; (d) 600°C annealed.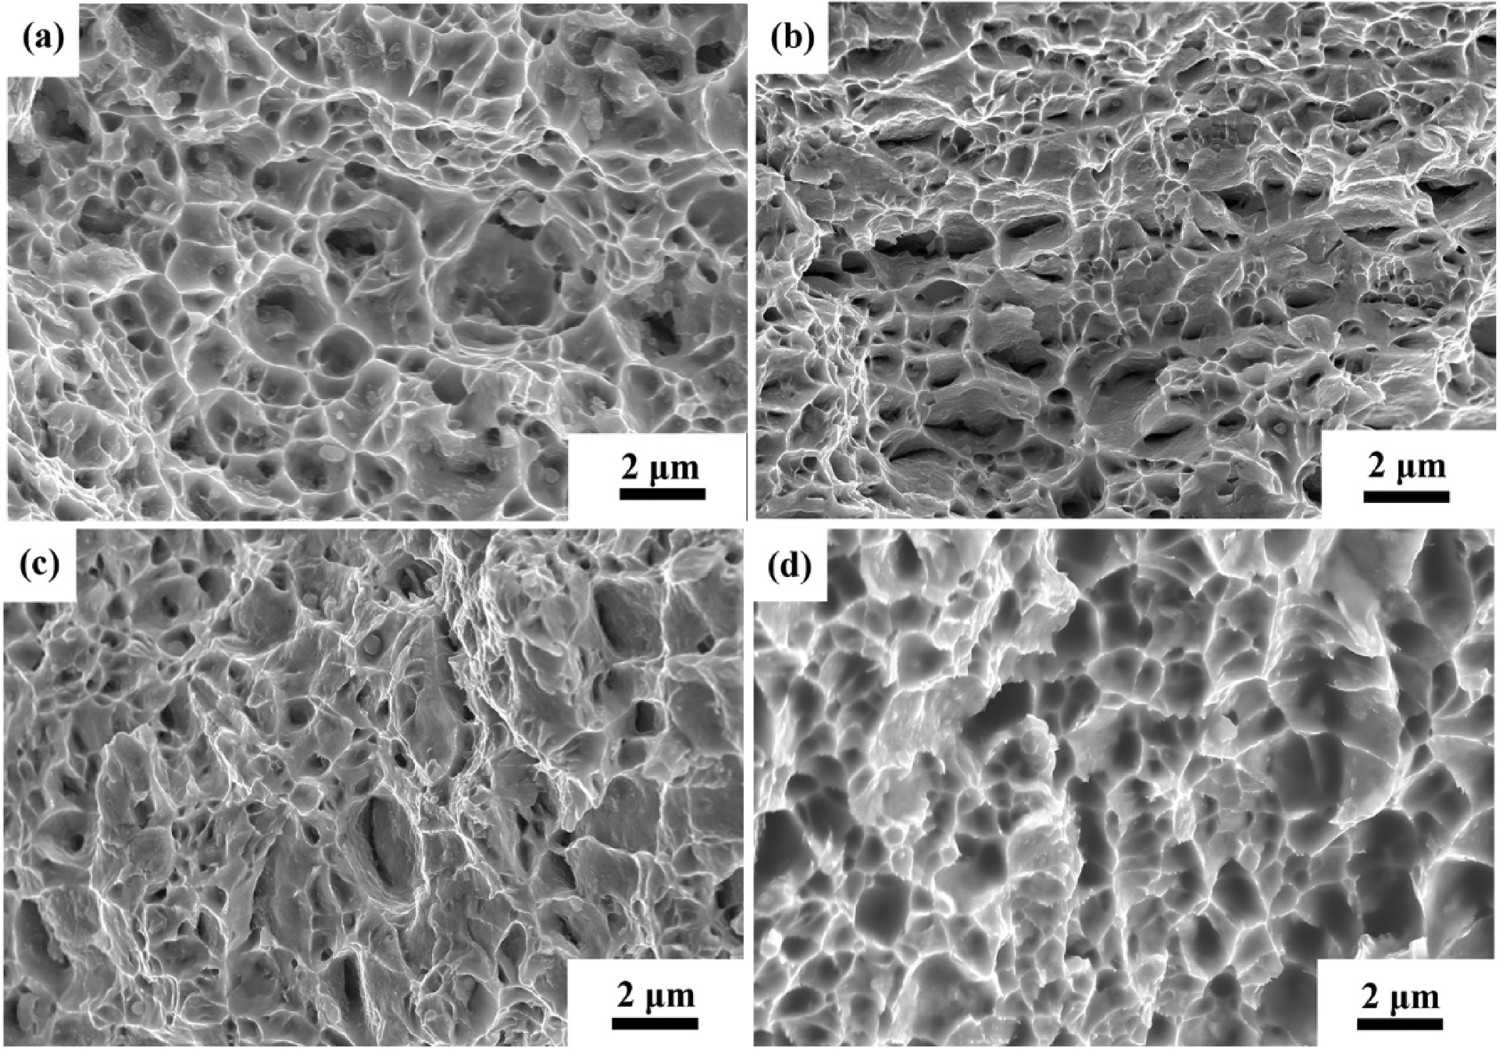
Sumiyama et al. [33] reported that for the Cu-Fe alloy prepared by mechanical alloying, when the Cu content was higher than 65% critical value, the formation of fcc-Cu supersaturated solid solution led to the paramagnetism, while the increase of Fe content brought about the change to ferromagnetism. In this study, Fe existed in the form of the bcc phase due to no solid–liquid phase transition in the preparation process, which can also be obtained from the XRD results. The binary phase diagram of Cu-Fe shows that Cu and Fe are almost insoluble at room temperature equilibrium. Due to mechanical alloying and subsequent rolling deformation, a supersaturated solid solution of Cu may be formed in the cold-rolled CFAs. In the rolling process specifically, the large deformation not only caused the two phases to be stretched but also changed the phase composition and formed a supersaturated solid solution. This has been reported many times in the research of Raabe et al. [34]. Bcc Fe existed in the Cu matrix as a single-phase or solid solution in Cu. Each Fe atom in the alloy had a complete magnetic moment, and the Fe atoms were paired with each other, distributed in the Cu matrix, and each particle was ferromagnetic, forming multiple magnetic domains. In this study, because the content of Fe dissolved in fcc Cu was relatively small (<35%), the fcc Cu phase shows paramagnetism, and the contribution to saturation magnetisation (Ms) in CFAs mainly came from the Fe phase particles distributed in the Cu matrix. Therefore, it was not difficult to understand the phenomenon that the Ms was improved with increased Fe content. In addition, it is noted that the Ms of CFAs decreased after annealing. This was contrary to what Liu et al. reported [35]. This is because the Ms of an alloy depends not only on the number of ferromagnetic magnetic domains, but also on the crystal defects (such as dislocations and phase boundaries) in the material and the size, shape and orientation distribution of the magnetic domains. After low-temperature annealing, fine Fe particles precipitated from the Cu matrix, and the size of elongated Fe particles during cold rolling changed through longitudinal splitting, break-up and spheroidisation, and the particles became thicker [27,36]. Therefore, we believe that because the precipitation kinetics of Fe was too slow, the mass fraction of fine ferromagnetic Fe particles was very small, which had little effect on Ms. On the contrary, the Fe stripe distributed in the Cu matrix was coarsened and the phase interface increased, which weakened the orientation distribution of magnetic domains, resulting in the decrease of the overall Ms. In order to better understand the change of Ms, we tried to make theoretical calculations for the annealed CFAs as an example.
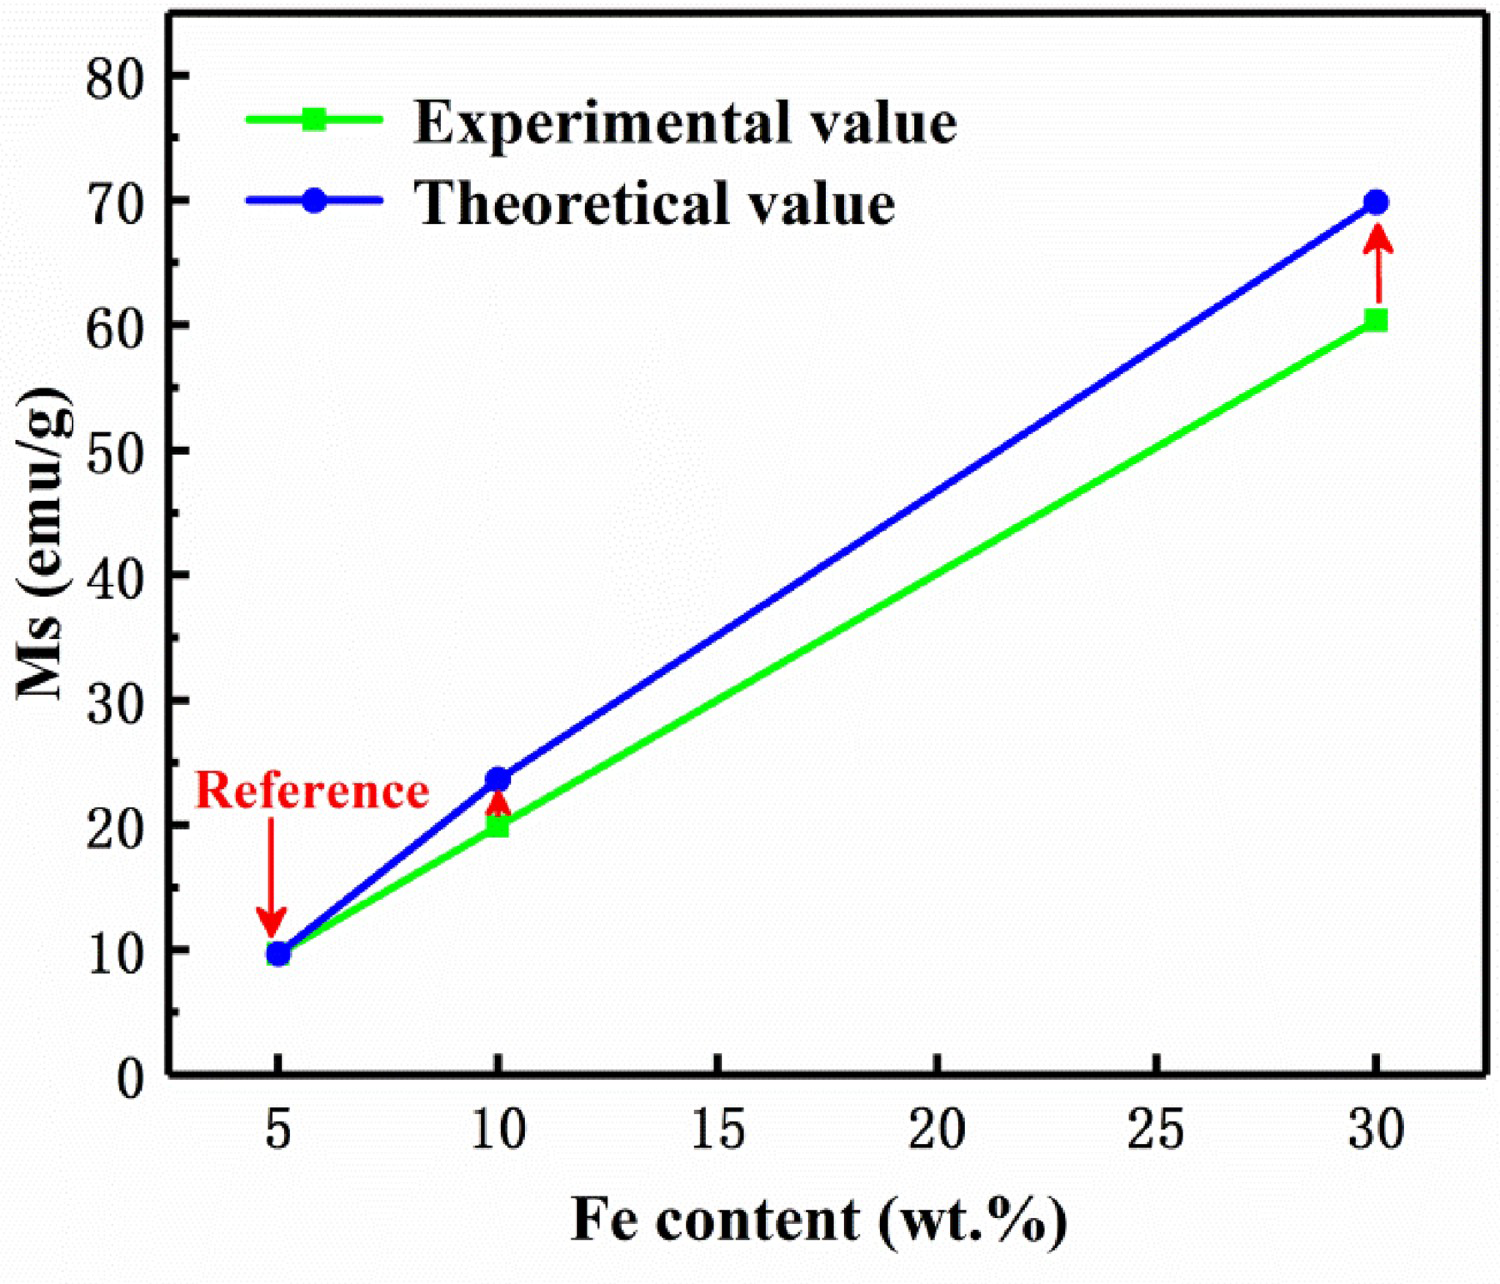
The phase content of ferromagnetic bcc-Fe in the alloy can be estimated from XRD results. Because Ms mainly came from bcc-Fe, the Ms of CFAs increased linearly with the Fe content as:
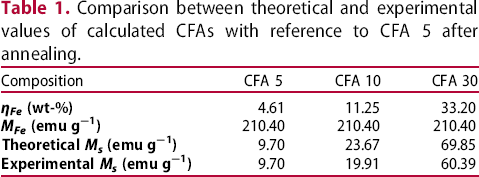
Effect of annealing on the conductivity of cold-rolled CFAs with different Fe content. Hysteresis loop curves of different Fe contents before and after annealing of cold rolled CFAs: (a) Before annealing; (b) After annealing. Here, the number, 1, 2 and 3, is on behalf of the hysteresis loop curve of CFA 5, CFA 10 and CFA 30, respectively. Theoretical and calculated values of magnetic saturation intensity of annealed CFAs. Comparison between theoretical and experimental values of calculated CFAs with reference to CFA 5 after annealing.
 is the theoretical value of saturation magnetisation,
 is the theoretical calculated value of the bcc Fe mass fraction.
 is the saturation magnetisation per unit mass of primary bcc Fe. Taking the saturation magnetisation of CFA 5 as the reference value, the theoretical saturation magnetisation values for CFA 10 and CFA 30 can be obtained by calculation as 23.67 and 69.85 emu g−1, respectively. The calculation results are listed in Table 1. It can be seen from Figures 12–14 that the calculated theoretical value was higher than the experimental value, and the difference increased with the Fe content. This may be caused by the factors such as the orientation of Fe particles, the phase interface, the morphology and the existence of holes in the alloys. Deformation led to defects and distortion of microstructure, which might also lead to the decrease of saturation magnetisation. A better understanding of the mechanism affecting the magnetic behaviour of samples requires more accurate research, which will be discussed in our next work.
Coercivity (Hc) is also one of the important parameters of magnetic materials. From the results of the magnetic hysteresis loop, the coercivity increased with the increase of Fe content and after annealing. Before heat treatment, the coercivity of CFA 5, CFA 10 and CFA 30 was 56.3, 65.6 and 85.1 Oe, respectively. After annealing at 400°C, the coercivity correspondingly increased to 66.4, 73.5 and 98.2 Oe. The coercivity came from the irreversible magnetisation process, so the factors that affected the irreversible magnetisation process, such as magnetic anisotropy, impurities, pores, dislocations and other defects will affect the coercivity, which is a structure-sensitive parameter [37,38]. In this experiment, Fe particles were ferromagnetic, and each particle was the single domain. The magnetic moment increased with the number of Fe particles, which led to the increased magnetic anisotropy energy, and the greater the block to the reverse magnetisation process, the stronger magnetic field was needed for magnetisation reversal. Additionally, the phase interface increased with the Fe content, resulting in greater structural distortion. In the process of the domain wall displacement or rotational magnetisation, these phase interfaces and distortions hindered the domain wall displacement, and dislocations would also bring about the increase of spin pinning position, which were the reasons for the increased coercivity [10].
After annealing, the Cu matrix and Fe phase would precipitate fine Fe and Cu particles, respectively, along with the growth of Fe phase particles and stress relief. The non-ferromagnetic Cu precipitated from the Fe-rich phase had a strong pinning effect on the domain wall displacement or rotational magnetisation process, which hindered the domain wall displacement and led to the increase of coercivity after annealing. Compared with the pinning effect of precipitates, the growth of Fe phase particles and the reduction of stress removal were not the main influencing factors [35].
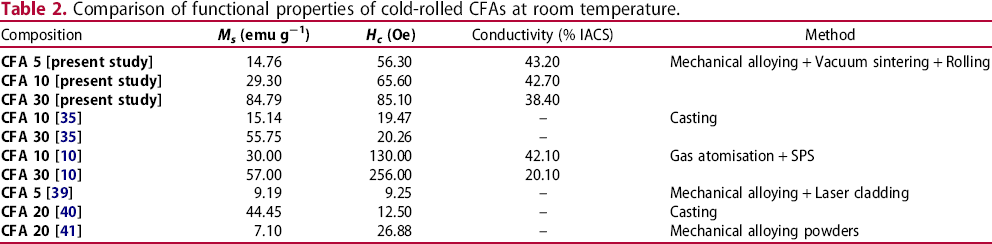
Comparison of functional properties of cold-rolled CFAs at room temperature.
Comparison of functional properties of cold-rolled CFAs at room temperature.
To summarise, in this study, mechanical alloying and vacuum sintering, followed by hot and cold rolling processes were used to prepare dense CFAs with different Fe content. It proves that the Fe uniformly dissolves in Cu by mechanical alloying, and transforms into a supersaturated solid solution. Subsequently, the highly dispersed fine Fe particles are precipitated during annealing and sintering. Fe particles were elongated after rolling, and the orientation became more obvious with Fe content. After annealing, the precipitation of Fe and the spheroidisation of Fe particles reduced the mechanical and magnetic properties, but the electrical conductivity was significantly improved, and the effect of microstructure on mechanical and physical properties was considered. After annealing at 400°C, CFA 30 had a tensile strength of 621 MPa, electrical conductivity of 50.2% IACS, magnetic saturation strength (Ms) 60.39 emu g−1, coercivity (Hc) 98.2 Oe, had good comprehensive mechanical and physical properties for good application prospects in the electromagnetic field.
Footnotes
Acknowledgements
This work was supported by the State Key Lab of Advanced Metals and Materials of China (2019-Z10), the National Natural Science Foundation of China (61905159), and the Fundamental Research Funds for the Central Universities (FRF-GF-19-012AZ).
Author contributions
Chenzeng Zhang Methodology, Validation, Investigation, Resources, Writing – original draft, Visualisation. Cunguang Chen: Conceptualisation, Methodology, Validation, Writing – review and editing, Supervision, Funding acquisition. Lina Huang, Tianxing Lu and Pei Li Resources, Formal analysis, Data curation.
Data availability
The raw/processed data required to reproduce these findings cannot be shared at this time as the data also forms part of an ongoing study.
Disclosure statement
No potential conflict of interest was reported by the author(s).