
Abstract
This study aims to compare the flow patterns and in-cavity pressures obtained experimentally and numerically for different conditions. Four feedstocks based on 17-4PH stainless steel powder were fully characterised and implemented as material laws in an Autodesk Moldflow package before to obtain numerical simulations that were then validated using real-scale injections. The flow patterns obtained numerically for the different flat bar mold geometries were in good agreement with the experimental flow patterns, showing an almost perfect fit, whereas for the flow patterns of the complex mold geometry, there were some minor discrepancies. The simulated pressure profiles obtained for different mold geometries, feedstock temperatures, mold temperatures and solid loadings were in good agreement with the experimental pressure profiles in terms of trend and pressure values, with maximum relative differences varying from 30 to 64% depending on particular feedstocks and process parameters.
Keywords
Introduction
Powder injection molding (PIM) is a manufacturing process used to produce metallic or ceramic components exhibiting complex geometries and precise dimensions at a relatively low cost [1]. PIM involves four basic steps, during which the powder is firstly (1) mixed with a molten polymeric binder to form a homogenous feedstock that is then (2) injected into a mold cavity before being (3) debound to completely remove the binder and finally (4) sintered to obtain a final dense component [2,3]. High-pressure powder injection molding (HPIM) and low-pressure powder injection molding (LPIM) are the two declinations of the PIM technology. In HPIM, high-viscosity feedstocks (>100 Pa·s) formulated from high-viscosity wax/polymer-based binders are injected into a mold cavity using a high pressure typically varying from 20 to 200 MPa [4]. In LPIM, low-viscosity feedstocks (<100 Pa·s) formulated from low-viscosity wax-based binders are injected at pressures that are generally lower than 1 MPa [5,6]. The low pressure required in the LPIM process means the size of the injection machines can be smaller, just like the overall mold dimensions. The result is increased design flexibility and a decrease in fabrication costs [7]. However, the technology readiness level of the LPIM process remains relatively low, especially for metallic-based feedstocks, whose molding behaviours were mainly studied for high-viscosity HPIM mixtures, using experimental and numerical approaches. In this context, the mold filling behaviour was successfully simulated to optimise the process conditions and minimise or avoid the formation of defects such as voids, sinks, jetting, welding lines, warpage and cracks [8]. To perform PIM simulations, feedstock properties, including physical, thermal and rheological properties have traditionally been experimentally measured and then implemented as material laws in simulation packages such as Moldflow, Sigmasoft, PIMsolver and Modlex3D in order to investigate the melt front velocity, filling time, segregation and pressure during an injection [9,10].
Tseng et al. [11] used Moldex3D to predict black lines caused by powder-binder phase separation occurring during the injection stage. The suspension balance model provided in the software was able to numerically predict this defect in the vicinity of the gate observed experimentally. Using the same simulation package combined with an experimental validation, Bandiwadekar [12] predicted the mold filling behaviour of a high-viscosity lead-zirconate-titanate feedstock that was used to reduce the development time required for the fabrication of piezoelectric sensors. Atre et al. [13] used PIMSolver to study the effect of several input parameters on pressure, temperature and flow responses (i.e. output parameters) during the mold filling of a stainless steel feedstock. A sensitivity analysis confirmed that the output parameters related to the flow were affected by the process parameters and geometry conditions, while the output parameters related to pressure and temperature were sensitive to the same input parameters, in addition to the feedstock properties. Using the same metallic-based feedstock and the same simulation package, Ahn et al. [14] confirmed one year later that the filling, packing and cooling stages could be accurately simulated when rheological characteristics such as the yield stress and apparent slip phenomena were taken into account by the model. Similarly, Liu et al. [15] implemented the wall-slip effect in an ANSYS package to increase the accuracy of the pressure gradient numerically predicted for a high-viscosity ceramic-based feedstock. Similarly, Sanetrnik et al. [16] recently confirmed with an HPIM metallic-based feedstock that the wall-slip effect appears to increase as the particle size and sphericity increase. Mulser et al. [17] experimentally validated the numerical simulation results obtained with SIGMASOFT during a co-injection of two different stainless steel high-viscosity feedstocks before concluding that the feedstock temperature and packing pressure drive the formation of the contact interface between the two materials. In two different studies, Lenz et al. [18,19] used Moldflow to identify the critical parameters affecting a ceramic-based HPIM feedstock during the injection stage. They demonstrated that the feedstock melting point is the most important parameter affecting the injection pressure, the clamping force, the shear stress, the sink mark depth, the flow front temperature and the volumetric shrinkage.
Although numerical tools are routinely used to predict the behaviour of HPIM powder-binder mixtures, only a few studies have considered the simulation of the LPIM injection process. To the best of the authors’ knowledge, all these studies were performed using the Moldflow package, with the first simulations realised by Zhang and Lin [20] to better understand the impact of injection parameters during the fabrication of a complex shape ceramic ferrule from a wax-based feedstock containing no backbone polymer. About 10 years later, Sardarian et al. confirmed the powerful capacity of the same Moldflow package by simulating the mold filling [21], jetting [22] and pressure distribution [23] for a low-viscosity alumina feedstock. These simulation results showed that the jetting length increases with an increase in injection pressure and temperature. Recently, Yavari and Khorsand [24] used the same package to confirm that the segregation and imbalance filling phenomena occurring during the injection of an LPIM silicon-carbide feedstock were more severe for thin-wall components. Using an LPIM stainless steel feedstock, Ben Trad et al. [25] predicted the injected length, the melt front velocity and the filling times, which were validated with experimental results. In that study, the absence of segregation captured by Moldflow was also confirmed by thermogravimetric measurements. The same simulation package was used to study the injection flow and occurrence of defects for two titanium-based feedstocks injected into two different intricate mold cavities [26,27]. The study demonstrated that the melt front location and filling completion predicted by the numerical model at different short shots were in good agreement with experimental observations. An experimental validation of very low-pressure values simulated from an LPIM feedstock was performed for the first time by Azzouni et al. [28] in two simple shape 2D mold cavities. However, an in-situ validation of the pressure values developed within more complex shape mold cavities was never confirmed for such low-viscosity ceramic- or metallic-based feedstocks. The present study aims to demonstrate the ability of the Moldflow package to predict the in-cavity pressure during the injection stage of LPIM metallic feedstocks for more complex 2D mold cavities.
Methodology
Feedstock preparation
One water-atomised 17-4PH stainless steel powder (Epson Atmix Corporation, Japan) and one gas-atomised 17-PH stainless steel powder (Sandvik Osprey, United Kingdom) were mixed with a wax-based binder to formulate a total of four feedstocks using solid loadings varying from 60 to 65 vol. %. The particle shape and particle size distribution of these dry powders were assessed using a scanning electron microscope (Hitachi 3600, secondary electrons detector) and a laser diffraction particle analyser (LS 13320 Beckman Coulter), respectively. As reported in Figure 1(a), water atomisation exhibits a blend of spherical and ligamental particles with an average particle size of 11.8 µm, while gas atomisation produces spherical shapes with a similar average particle size of 11.3 µm (Figure 1(b)). The powder characteristics extracted from Figure 1(c,d) are reported in Table 1.
SEM observations and particle size distributions of 17-4PH dry powders produced by (a) and (c) water atomisation, and (b) and (d) gas atomisation. 17-4 PH powder characteristics.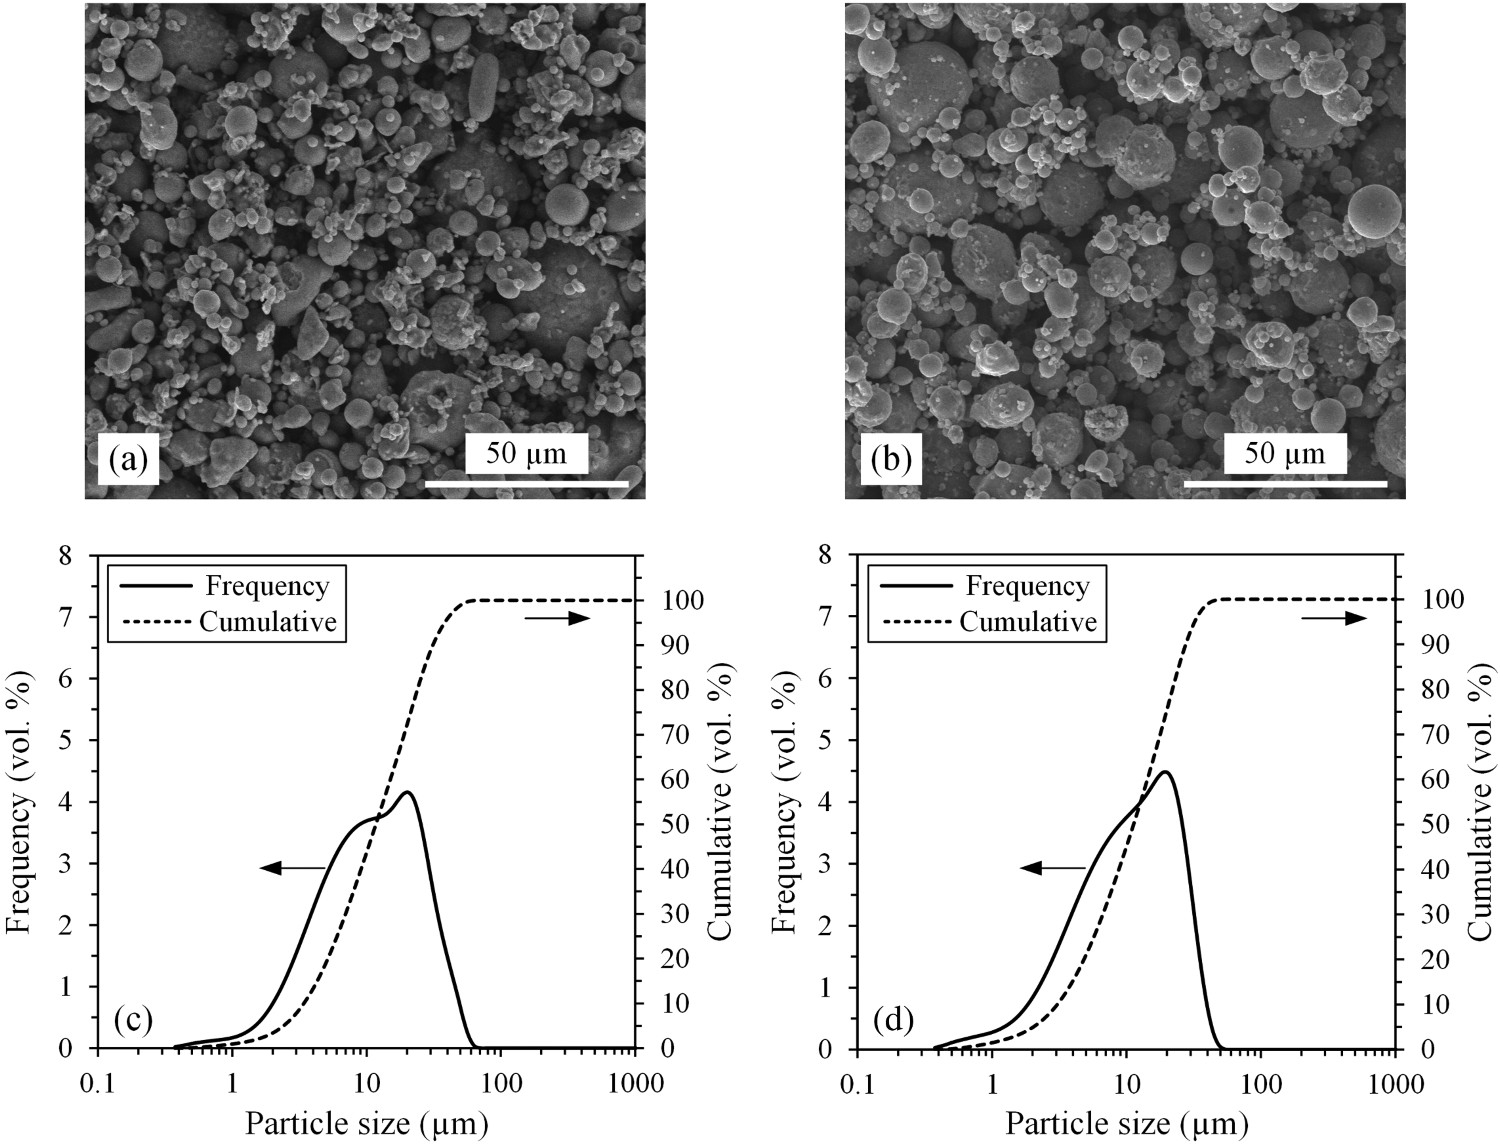

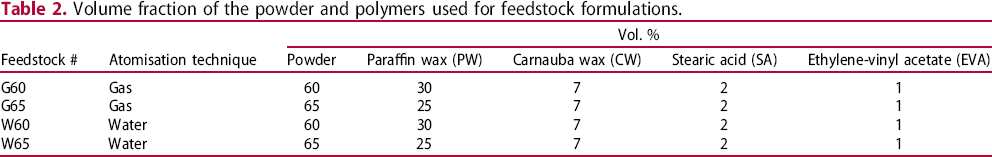
Volume fraction of the powder and polymers used for feedstock formulations.
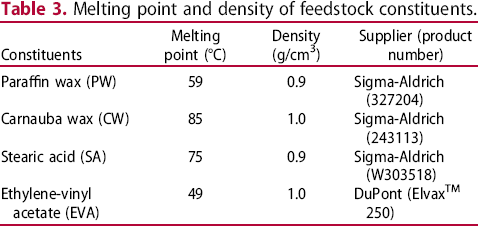
Melting point and density of feedstock constituents.
The feedstock properties required for the numerical simulations were the density, the melt viscosity, the specific heat capacity and the thermal conductivity. The critical solid loadings (CSL) for the water-atomised powder lot were assessed from the pycnometer density profiles reported in Figure 2(a). A CSL of about 66 vol. % was determined according to the criterion where the measured density diverged by 0.025 g/cm3 (dashed line) from the theoretical density (continuous line). Each feedstock density was measured three times using different samples to obtain an average value and a standard deviation as low as ∼0.003 g/cm3 (not shown in Figure 2(a), since the error bars are smaller than the marks). In this work, two solid loadings were set at 60 and 65 vol. %, i.e. below the critical value, to guarantee the fluidity of the feedstocks in all mold cavities, with the feedstocks G60 and W60, and to represent the typical high powder contents used in metal injection molding (MIM), with the feedstocks G65 and W65. The DSC thermograms presented in Figure 2(b) were used to determine the feedstock transition temperature obtained from the cooling stage. The feedstocks’ specific heat (Cp) according to the temperature presented in Figure 2(c) was obtained using three experimental DSC thermograms obtained with the feedstocks, a standard material (i.e. sapphire) and an empty pan, according to the ASTM-E1269 standard test method [32]. The feedstocks’ thermal conductivity (k) reported in Figure 2(c) was measured according to the transient line-source technique described in the ASTM-D5930 standard test method [33].
Physical and thermal properties of feedstocks: (a) feedstock density according to solid loading, (b) DSC thermograms used to determine the transition temperature, (c) specific heat capacity and (d) thermal conductivity of the feedstock measured at different temperatures (W60 and W65: feedstock containing 60 or 65 vol. % of water-atomised powder; and G60 and G65: feedstock containing 60 or 65 vol. % of gas-atomised powder).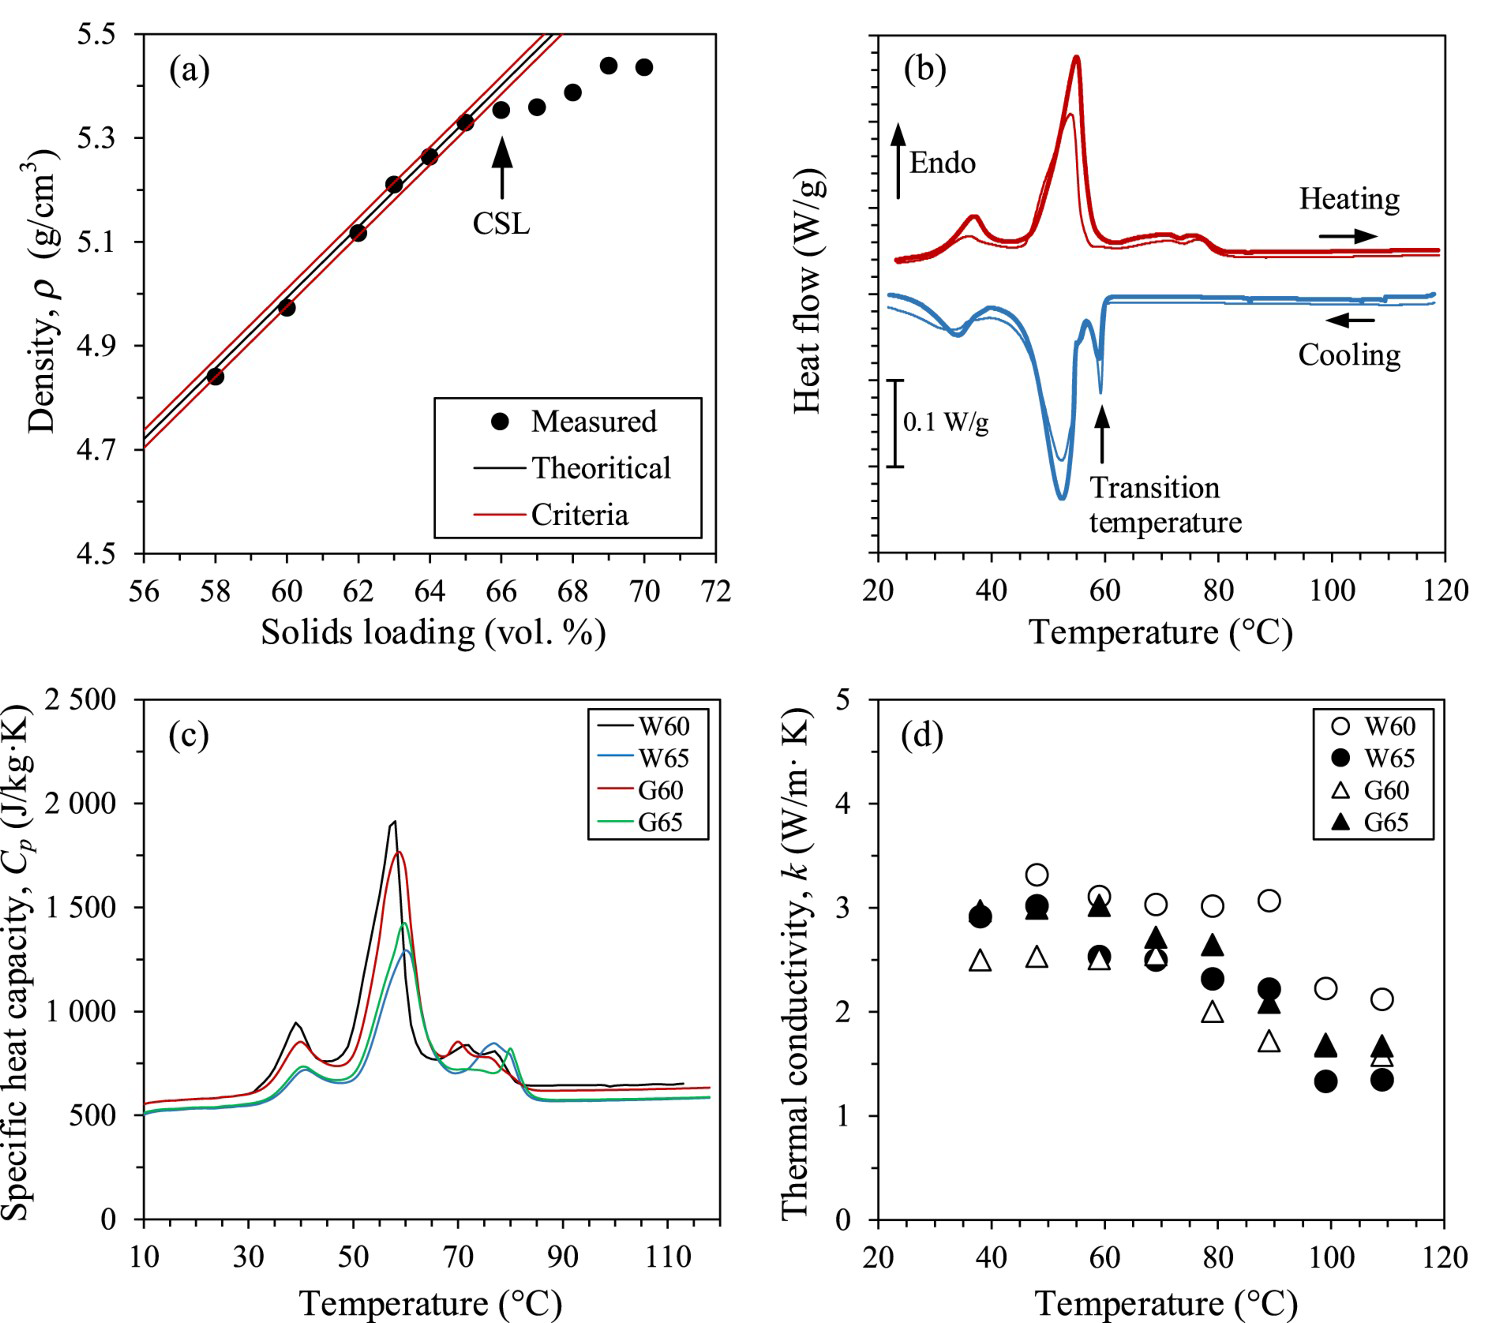
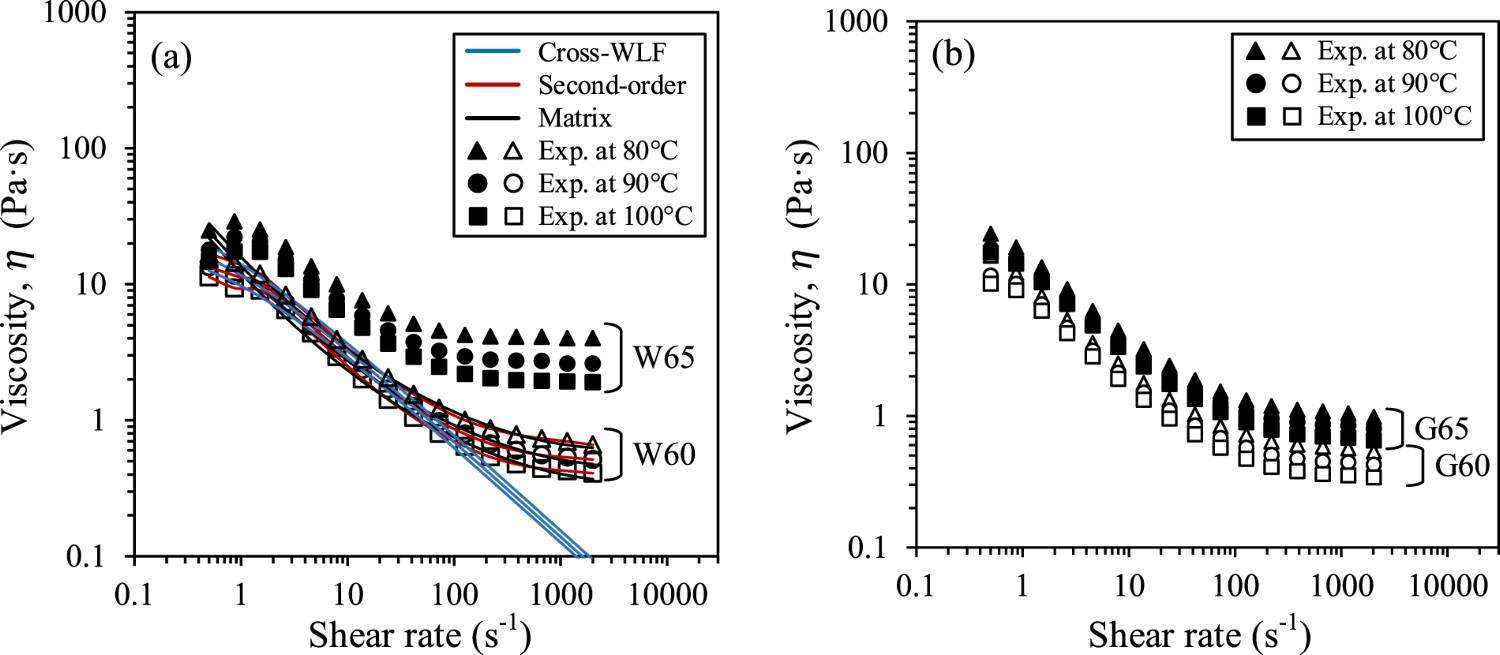
The feedstock viscosity profiles reported in Figure 3 were measured with a rotational rheometer (Anton Paar MCR 302, using rotational test), using a cup/cylinder configuration (CC-17) placed into a Peltier temperature-controlled measuring system (C-PTD 200). Molten feedstock was poured into the rheometer cup and then tested at shear deformation rates ranging from 0.5 to 3500 s−1 under constant temperature conditions varying from 80°C to 100°C. The viscosity profiles were obtained by repeating each condition three times to calculate the average viscosity profiles following the procedure described in [34]. The experimental viscosity profiles were fitted using the Cross-WLF viscosity model, a second-order mathematical fitting and a matrix interpolation approach. A superposition of these three models on experimental data was shown only for the W60 feedstock for visual clarity (Figure 3(a)). The Cross-WLF viscosity model is generally used when the viscosity remains constant at low shear rates, while exhibiting a significant decrease at high shear rates, while for its part, the second-order fitting is generally used when the feedstock viscosity decreases meaningfully at low shear rates and stabilises as a Newtonian-like plateau at high shear rates. In Moldflow, the matrix interpolation approach is used when the last two models are not able to adequately fit the experimental data. The Cross-WLF and the second-order viscosity models are defined respectively as:
Viscosity profiles with superimposed Cross-WLF, second-order, and matrix models for (a) water atomised powders, and gas atomised powders containing 60 or 65 vol. % of powder. Data-fitted coefficients used in Cross-WLF and second-order viscosity models.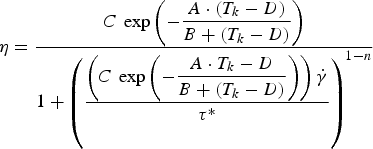

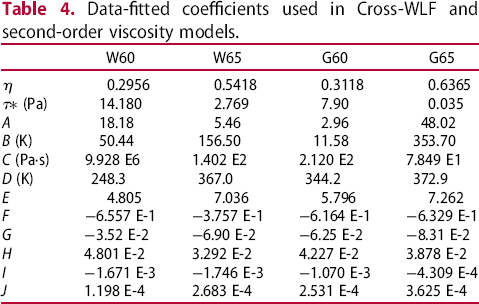
Numerical simulations of the injection stage were performed using Moldflow Synergy 2019 (Autodesk Inc.) for the four mold cavities presented in Figure 4(a–d). The three simple rectangular parts presented in Figure 4(a–c) (molds #1 to #3) were selected to study the flow patterns and pressure profiles at constant thickness (3 mm). Their cavity volumes ranged from 15.3 to 19.2 cm3. The fourth mold (mold #4), illustrated in Figure 4(d), was identified to study the flow behaviour within a more complex shape part, especially around as-MIM features such as small holes, intricate internal cavities and thin walls (2.5 mm in this case). Note that the rectangular molds are equipped with a buffer zone (indicated in Figure 4(a)) to change the shape and direction of the feedstock coming from the injection press, and simultaneously manage, out of the part, the shear stress variations that may produce powder segregation and thus stabilise the flow pattern at the entry of the part. The CAD models were meshed using the 3D tetrahedral elements illustrated in Figure 4(a) and the mesh sensitivity analysis performed on the mold #1 (Figure 4(e)) confirmed that a mesh size of about 0.5 mm provides an adequate accuracy in injection pressure, while not compromising the computational time required for simulations. The mold cavities contain between 1.5 and 3.1 million elements, depending on the model's shape.
(a–d) 3D view of the four mold cavities with an example of superimposed tetrahedral finite element mesh (dimensions in mm), and (e) evolution of the pressure at the gate and simulation time according to the mesh size.
In the Moldflow package, the Cross-WLF model, the second-order fitting and the matrix linear interpolation approach are the three methods used to implement the material law related to the feedstock viscosity. As shown in Figure 3(a), the Cross-WLF and second-order viscosity models are not well-adapted to capture the zero-shear viscosity at low shear rates, continued decrease in viscosity at moderate shear rates, and the quasi-Newtonian behaviour seen at high shear rates for the low-viscosity feedstock used in this study. In fact, the Cross-WLF and second-order viscosity models generate respectively a maximum relative difference of 89% and 92% with the experimental data. Therefore, the experimental viscosity profiles obtained at different temperatures were grouped, ordered and implemented in Moldflow as the matrix viscosity model. Using this third rheological model, the viscosity was determined and managed by the simulation package from the measured data obtained at specific temperatures and shear rates, as well as via interpolations between data points and extrapolation outside the data point range. The feedstock density (ρ) and its thermal properties (i.e. Cp and k presented in Figure 2(c,d)) were implemented in Moldflow as a scalar and two material law matrices, respectively. Finally, two other important thermal parameters, namely, the transition temperature and mold-melt heat transfer coefficient, were assessed and implemented in Moldflow. For semi-crystalline or amorphous binders, the transition temperature corresponds respectively to the crystallisation peak or the inflection point of the DSC heat flow curve, both obtained during the second cooling stage. Since no glass transition was observed on DSC thermograms obtained in this project, the transition temperature was set to 62°C, i.e. the first crystallisation peak representing the temperature at which the melt-to-solid transition occurs [35]. Based on a value proposed by Ilinca et al. [36], and to better reflect the heat transfer occurring between the mold interface and such feedstocks, the mold-melt heat transfer coefficient (HTC) for the filling phase was set to 100,000 W/m2·°C as MIM feedstocks exhibit much higher thermal conductivities as compared to polymers using a default value of about 5000 W/m2·°C [37,38]. The numerically obtained flow pattern and pressure were validated with real-scale injections performed with the laboratory injection press described in [29] and equipped with the instrumented molds illustrated in Figure 5(a–c). The molten feedstock was injected into the steel mold cavities to produce different short shot conditions (flow patterns) and complete injections (injection pressure measurements), using the process parameters provided in Table 5. A speed ramp of about 300 mm/s2 was used in the experiments to accelerate the feedstocks during the injections, and was reproduced in the numerical simulations. The 2D mold cavities were equipped with a Series PR-25Y piezo-resistive pressure sensor designed by Keller AG Druckmesstechnik (with a maximum pressure of 1000 kPa±2.5 kPa). The pressure sensor was plugged into an NI USB-6212 acquisition card (National Instrument Corp.) and pressure measurements were recorded using a LabVIEW script.
Exploded view of the mold (a) #1: constant flat bar, (b) #2: flat bar with fillet (c) #3: flat dogbone bar, (d) #4: complex shape. Process parameters used for the numerical simulations and real-scale injections.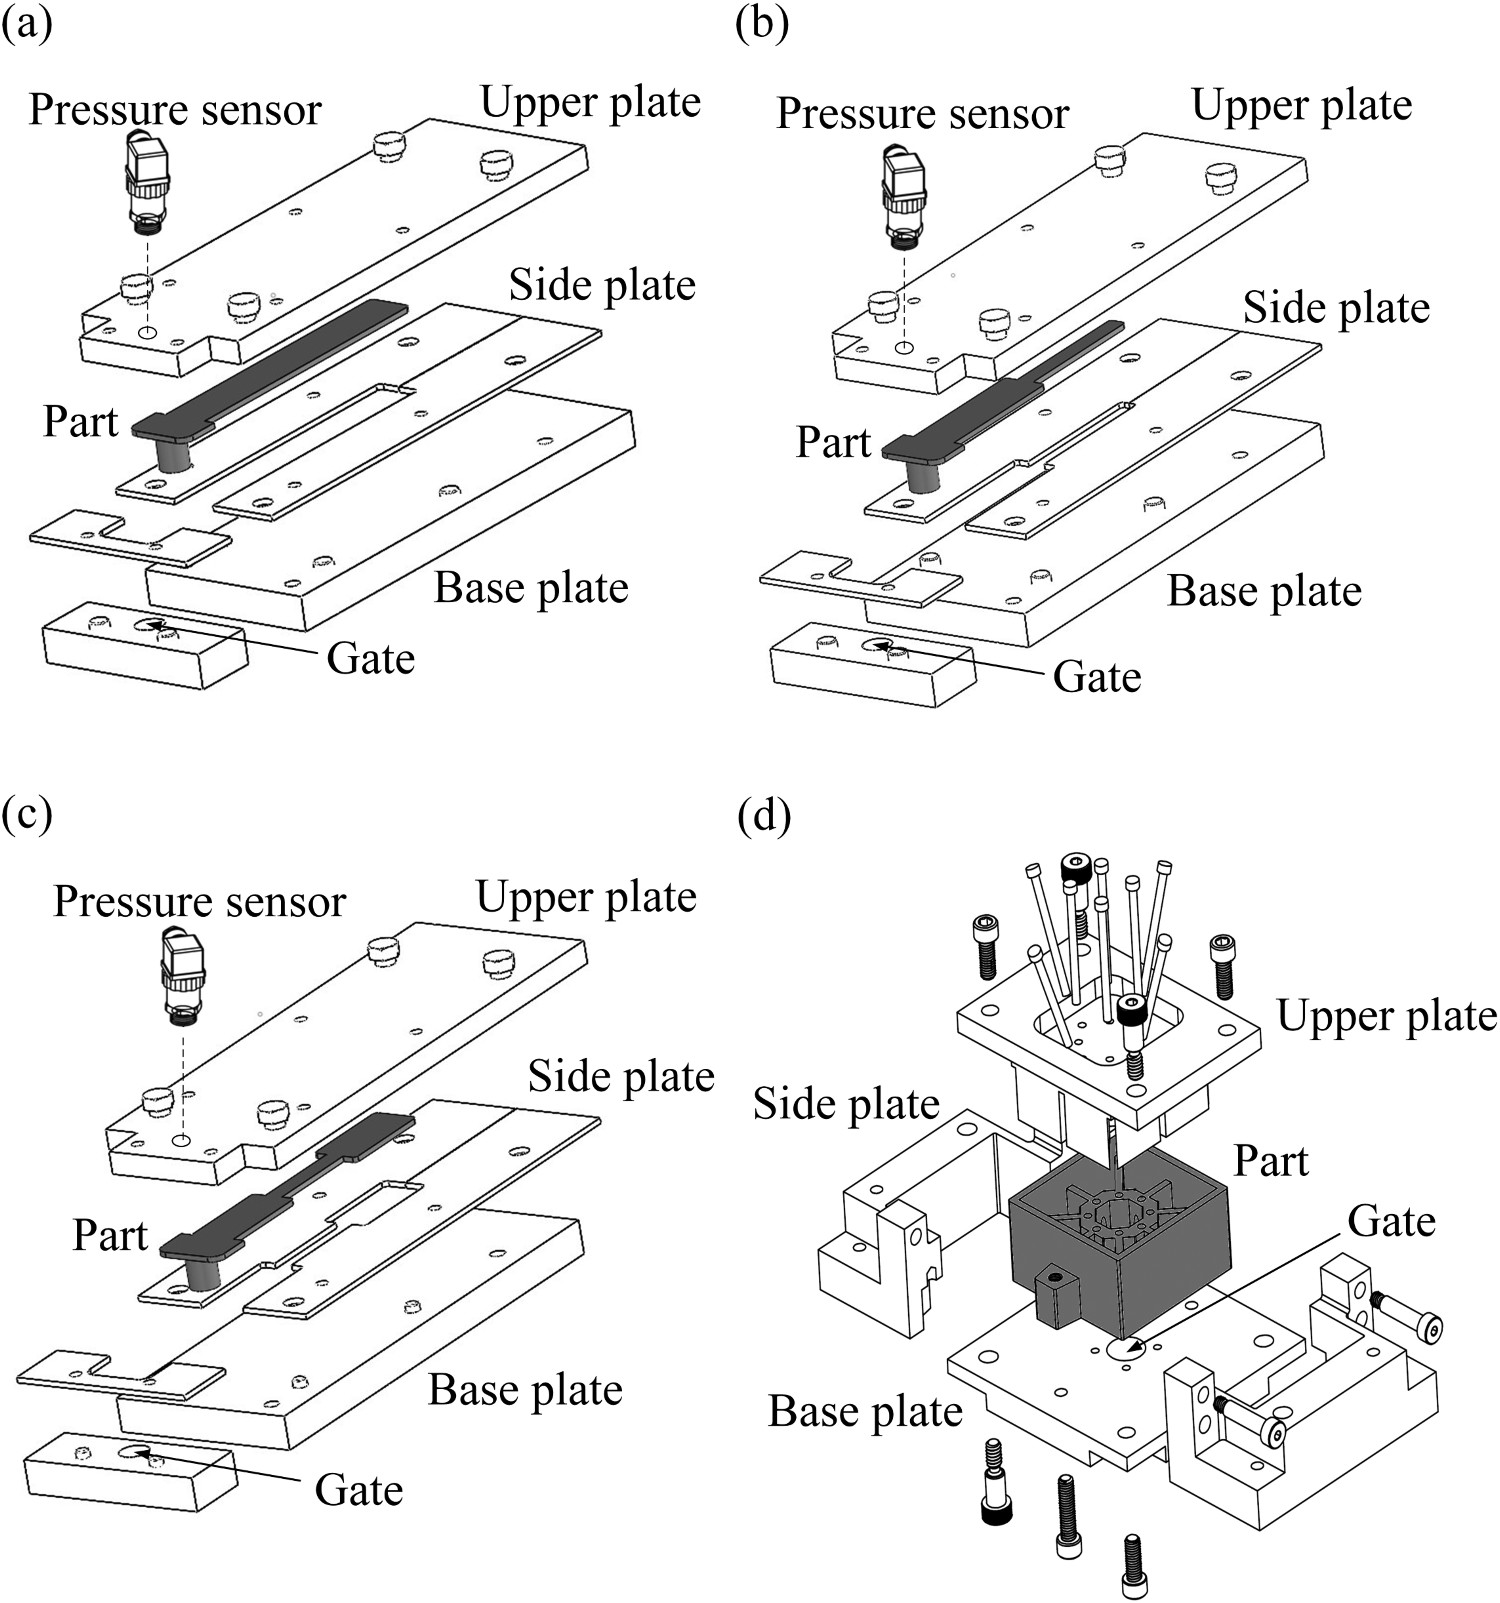
Influence of mold geometry on flow patterns and pressure
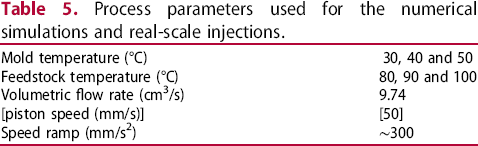
A qualitative and quantitative comparison between the experimental and simulated flow patterns and injection pressures is presented in Figure 6 for the three rectangular mold cavities (molds #1 to #3). The influence of mold geometry on these two output parameters was assessed for the feedstock W60 using a constant feedstock temperature (90°C), mold temperature (40°C) and flow rate (9.74 cm3/s). During injections at constant volumetric flow rates, the position of the flow fronts measured at different short shots (Figure 6(a–c)) was controlled by the shape of the mold cavities (i.e. a given volume filled after a certain injection time). With a constant volumetric flow rate, the injection time required to completely fill the rectangular molds #1, #2 and #3 was 2.1, 1.6 and 1.7 s, respectively. Short shots corresponding to 30%, 60% and 90% mold filling stages were experimentally produced for the three different mold cavities. As presented in Figure 6(a–c), the obtained short shots are in good agreement with the injected lengths and flow patterns predicted numerically via Moldflow for these three specific mold filling stages. Furthermore, the absence of visual defects at the surface of the short shot injections confirms that the volumetric flow rate used in this work is suitable for use in all mold geometries to avoid early solidification or jetting phenomena in feedstocks, which may occur at volumetric flow rates that are too low or too high, respectively. The progressive colour gradient obtained by numerical simulations (Figure 6(a–c)) also predicted a uniform filling exhibiting no solidification or jetting occurring during the injections. The experimental pressures developed in the three different mold cavities were measured using a pressure sensor located at the top of the injection gates, as illustrated in Figure 5(a–c). Following short shot injections, the pressure sensor mounted flush with the mold surfaces left a circular imprint on the bottom of the green parts for molds #1–3 (Figure 6(a–c)). The experimental and simulated pressure profiles for a complete filling of the three molds are presented in Figure 6(d–f), where the pressure profiles are divided into two zones namely: (1) the gate filling and (2) the mold filling.
Simulated and experimental (a-c) flow patterns and (d-f) pressure profiles for the molds #1-3 (feedstock W60 injected in constant mold's thickness = 3 mm, feedstock temperature = 90°C, mold temperature = 40°C and flow rate = 9.74 cm3/s). Hollow arrows represent changes in the molds’ cross-sections.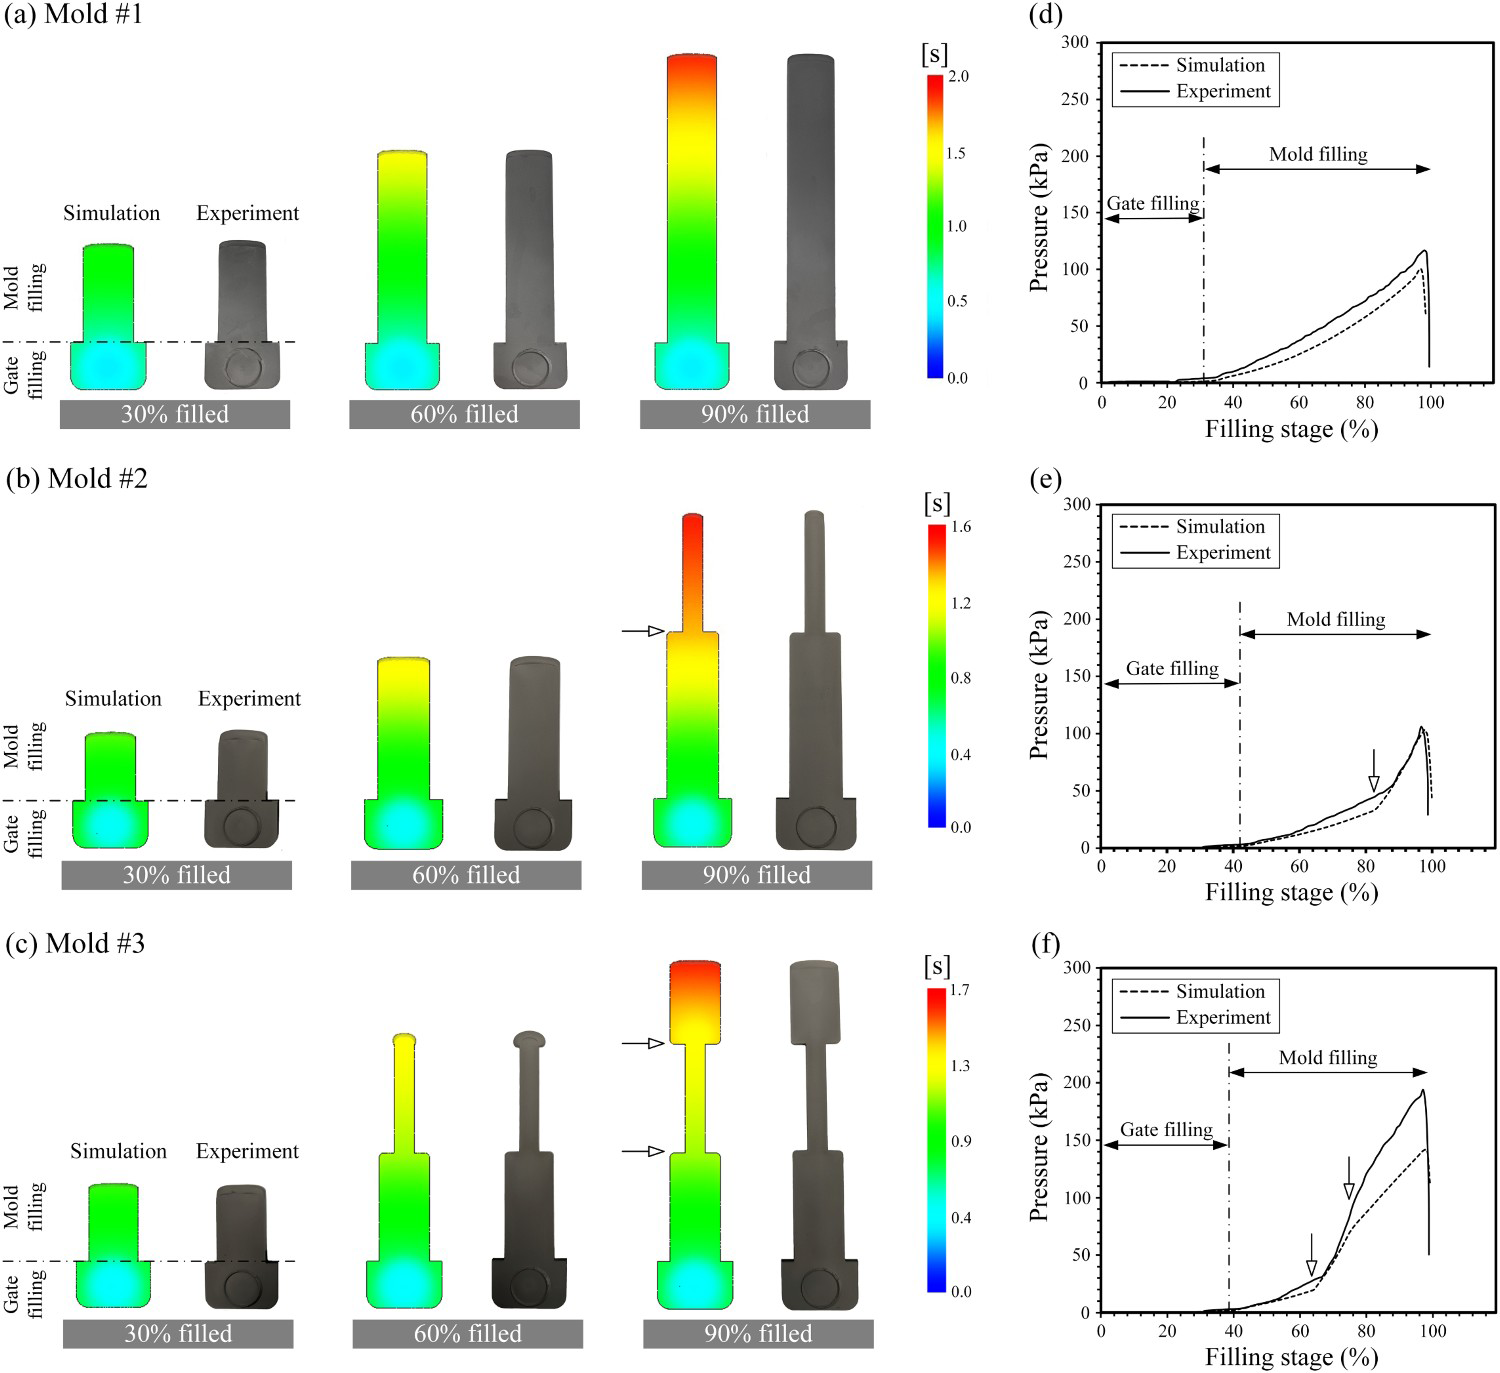
For all mold cavities, the gate filling zone corresponds to the vertical cylinder (visible in Figure 5) and the larger rectangular section in-plane with the rectangular cavities (visible in Figure 6(a–c)). The pressure recorded by the sensor in this zone remains at zero since the feedstock is not in contact with the sensor located at the top of this gate filling zone (Figure 6(d–f)). The mold filling zone corresponds to the main rectangular cavities, as presented in Figure 6(a–c). As the molds’ cross-sections are reduced as compared to the gate filling zone, the feedstock confined within the gate filling zone comes in contact with the pressure sensor to record a continuous increase in injection pressure during the filling stage of a constant mold cavity (Figure 6(d)) to overcome the internal friction experienced by the molten feedstock. The changes in cross-section of the mold cavities #2 and 3 correspond to the slope variations of the pressure profiles reported in Figure 6(e,f), and are highlighted by the hollow arrows. In the mold filling zone, the pressure drop at the end of the filling stages corresponds to the piston deceleration implemented experimentally to avoid overpressure on the sensor. The simulated pressure profiles for molds #1–3 are in good agreement with the experimental pressure profiles in terms of trends and pressure values (P), with a maximum relative difference (
The influence of the feedstock temperature (Tfeedstock) and mold temperature (Tmold) on the flow patterns and injection pressures was studied for the feedstock W60 and mold #3. The three feedstock temperatures and mold temperatures reported in Table 5 were used to obtain the simulated and experimental flow patterns at the 90% filling stage under various process conditions. When varying Tfeedstock between 80 and 100°C, Tmold was kept constant at 40°C and, when varying Tmold between 30 and 50°C, Tfeedstock was maintained at 90°C to obtain the resulting flow patterns and pressure profiles. Since all the injections were performed at a constant volumetric flow rate (9.74 cm3/s), the injected lengths are similar, regardless of the feedstock temperatures or the mold temperatures and a typical injected pattern, from the simulation and experiment, is presented in Figure 7(a). Indeed, this injection approach (described in detail in [38]) controls the injection flow using a constant stroke plunger for which the feedstock properties (e.g. the viscosity typically influenced by the feedstock or mold temperatures) have no impact on its injection length for a given injection time. This result was properly captured by the numerical model, as the injected lengths and filling times are identical.
Simulated and experimental (a) typical flow patterns at 90% filling stage for Tfeedstock = 100°C and Tmold = 40°C, and (b,c) pressure profiles obtained for different Tfeedstock and Tmold. (W60 feedstock injected in mold #3 using constant thickness = 3 mm, and flow rate = 9.74 cm3/s).
The pressure profiles experimentally recorded and numerically predicted during complete injections are presented in Figure 7(b,c) for different feedstock and mold temperatures. Similarly to the previous results obtained with the dogbone shape (mold #3), the pressure profiles exhibit an S shape (i.e. changes in slope) corresponding to different part filling stages that can be divided into four (4) segments superimposed on Figure 7(b), which are related to the top view of the injected part in Figure 7(a). The segment #1 represents the gate filling stage (about 39% of the cavity filled), while the segments #2–4 for this constant mold thickness denote the first large cross-section, the small cross-section and the second large cross-section representing 25%, 11% and 25% of the cavity filled, respectively. As expected during injections at a constant volumetric flow rate, a change in Tfeedstock and/or Tmold produces a variation in the injection pressure, where an increase in one or the two process parameters produces a decrease in the injection pressure, as shown in Figure 7(b,c). This is generally explained by a decrease in feedstock viscosity with an increase in temperature (mixture as well as mold), where an increase in feedstock temperature from 80°C to 100°C produces a decrease in feedstock viscosity of about 1–0.6 Pa·s (values extracted in a typical shear rate range of 100–500 s−1 in Figure 3), ultimately resulting in a decrease in the injection pressure from 300 to 120 kPa for this specific mold cavity. The pressure profiles obtained experimentally (solid lines in Figure 7(b,c)) confirm that the numerical model (dashed lines in Figure 7(b,c)) was able to adequately capture the influence of Tfeedstock and Tmold on the injection pressure, with a maximum relative difference of 39%. Using these typical injection parameters, the maximum overall injection pressure varying from 100 to 300 kPa remains significantly lower than the well-accepted value of 1 MPa reported to be used in the LPIM process. It is worth noting that this pressure is about 20–600 times lower than that used in the conventional high-pressure PIM process and represents an interesting opportunity to reduce the size of injection machines as well as the overall size of the molds, and finally, the cost of parts.
The influence of the feedstock properties on the flow patterns and injection pressures was studied for the four feedstocks, W60, W65, G60 and G65, formulated from two different powder atomisation techniques and two solid loadings (60 and 65 vol. % of powder). Similarly to previous results, the flow patterns and the injection time were not influenced by the feedstock properties as the injections were performed at a constant volumetric flow rate of 9.74 cm3/s, and are therefore not presented.
The pressure profiles measured for a complete mold filling are presented in Figure 8(a,b) for the four different feedstocks (G60, G65, W60 and W65). In general, the simulated pressure profiles are in good agreement with the experimental pressure profiles in terms of overall shape of the curves and pressure values obtained at different filling stages, with a maximum relative difference of 64% obtained with the feedstock G65. For the gas-atomised powder-based feedstocks, G60 and G65, an increase of 5 vol. % in powder content produces an increase in maximum pressure of 146 kPa, whereas for the water-atomised powder-based feedstocks, W60 and W65, the same solid loading increase produces a fourfold increase in the maximum pressure. This increase in injection pressure with an increase in the solid loading or decrease in powder sphericity is expected. On the one hand, it is worth noting that the feedstocks formulated at the same low solid loading of 60 vol. % (i.e. feedstocks W60 and G60) required similar injection pressures (with a maximum reached around 150 kPa), regardless of the powder shape. On the other hand, the feedstock W65 required a maximum pressure about three times higher than that of the feedstock G65. As anticipated by the rheological results (Figure 3(a)), the similar viscosity and similar low injection pressure of feedstocks W60 and G60 can be explained by the binder-rich zones and large interparticle spaces filled with binder (i.e. mixtures exhibiting a solid loading relatively far from the CSL), reducing the particle interactions, and thus the impact of particle characteristics. For feedstocks close to the CSL, the significant difference in viscosity values and injection pressures obtained for the feedstocks W65 and G65 confirm that these mixtures are probably more sensitive and driven by particle-to-particle interactions where a slight decrease in powder sphericity produces a significant increase in feedstock viscosity. In all cases, a LPIM injection at high solid loading using typical process parameters produces a low injection pressure (<1 MPa). Note that a strong correlation was also observed between the simulated injection pressure and the shear stress obtained at the surface of the mold. Since the injections were performed using a constant volumetric flow rate, a local shear deformation rate is imposed to the different feedstock parcels, thus generating different levels of shear stress within the part that should be proportional to the injection pressure required to ensure this constant volumetric flow rate. Although this comparison remains delicate, the shear stress patterns obtained numerically at 1.2 s (i.e. at 50% of the part filling corresponding to 70% of the mold ‘part + gate’ filling) were compared to the injection pressures calculated for the feedstocks W65 and G65 (Figure 8(c,d)). As expected, the increase in maximum shear stress developed at the mold surface for the feedstock W65 ( Simulated and experimental pressure profiles for (a) water-atomised and (b) gas-atomised powder-based feedstocks for complete filling, and simulated shear stress at the surface obtained at an injection time of 1.2 s for the feedstock (c) W65 and (d) G65 (injected in mold #3 using constant thickness = 3 mm, feedstock temperature = 90°C, mold temperature = 40°C and flow rate = 9.74 cm3/s).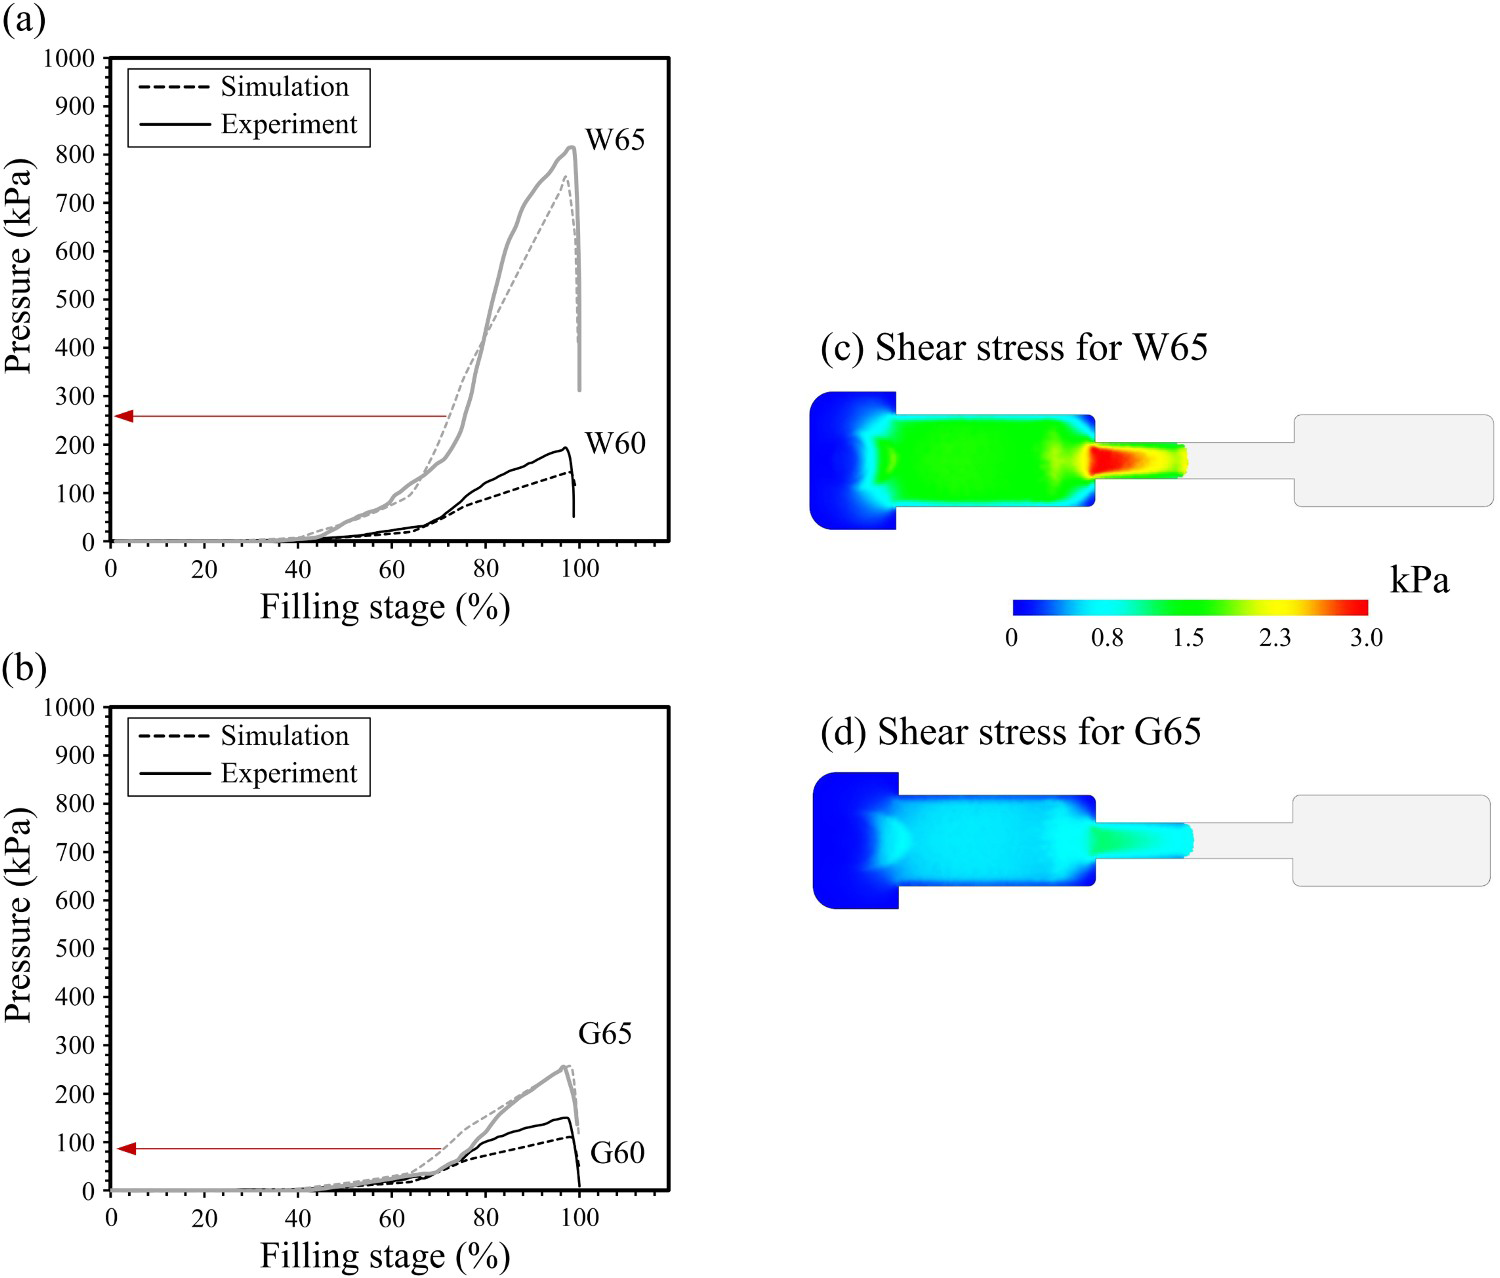
The capability of Moldflow to predict the mold filling behaviour within a complex geometry (mold #4) is illustrated in Figure 9 for different filling stages (30%, 60%, 90% and 100%). Experimental and numerical injections were carried out for the feedstock W60 using a constant feedstock temperature (90°C), mold temperature (40°C) and flow rate (9.74 cm3/s). Since the gate is located at the centre of the base (visible in Figure 5(d)), only part of the base (1) and the central core (2) are filled with feedstock after a 30% filling, as presented in Figure 9(a). For this filling stage, the simulation is similar to the real-scale injection in terms of flow pattern. At the 60% filling stage (Figure 9(b)), the base (1) and the central core (2) are completely filled, while the struts (3a and 3b), the lugs (4) and the walls (5) are partially filled with feedstock. For the second filling stage, the experimental and simulated short shots differ, with a lower volume of the base (1) and the lugs (4) filled and a higher volume the walls (5) filled for the experimental short shot than for the simulated one. For the experimental short shot, the flow front in the struts (3a) is slightly more vertical than the simulated short shot. Along with the local temperature gradient almost unavoidable in the experimental setup, this filling level not correctly predicted by the model can be attributed by the wall slip phenomenon that was not adequately adjusted in Moldflow.
Numerical and experimental flow patterns for mold #4 from 30 to 100% filling stage. Numbers (1) to (5) indicate the base, the central core, the transversal struts, the diagonal struts, the threaded lugs and the walls, respectively (feedstock W60, feedstock temperature = 90°C, mold temperature = 40°C and flow rate = 9.74 cm3/s).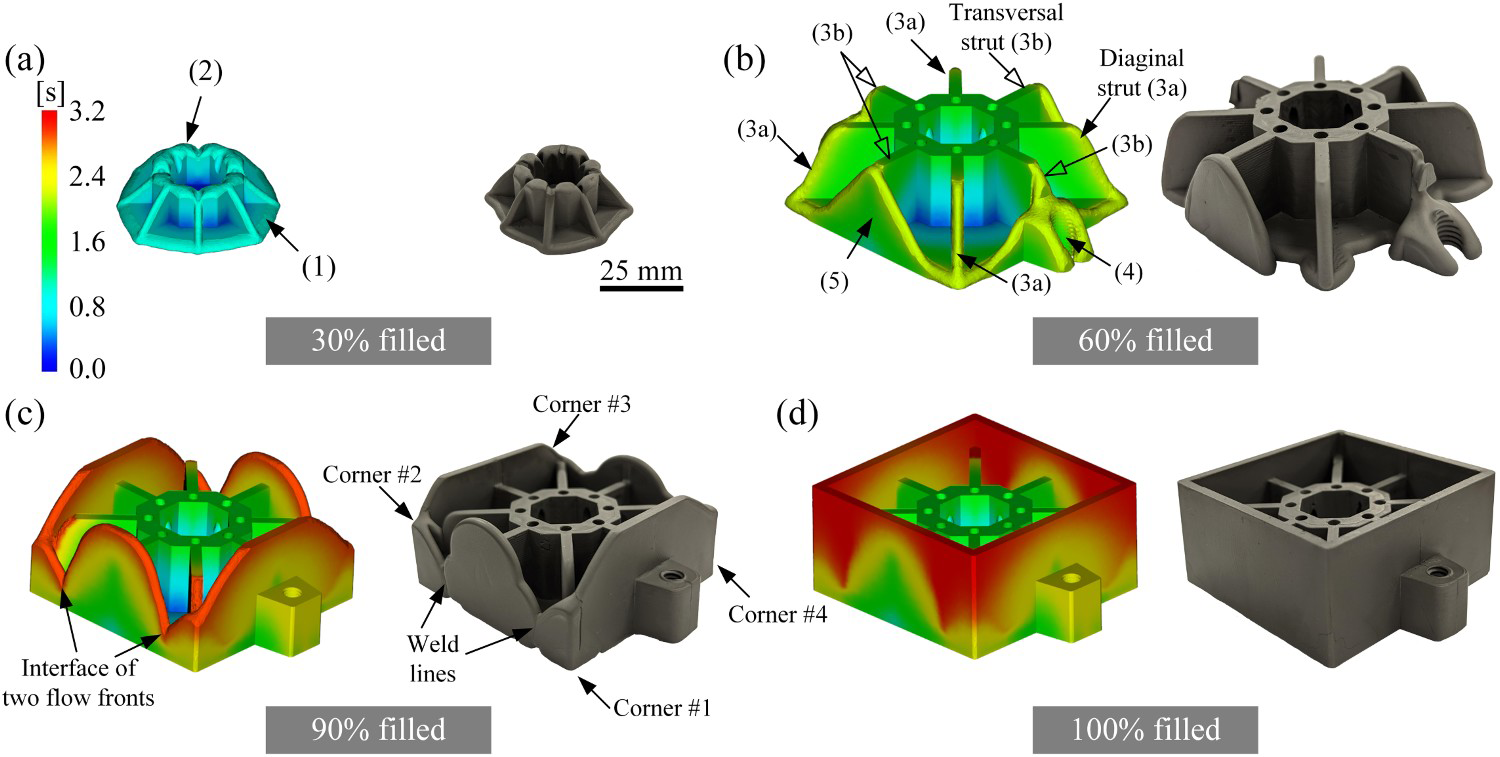
At the 90% filling stage (Figure 9(c)), the base (1), the central core (2) and the lugs (4) are completely filled, while the remaining 10% is contained in the diagonal struts (3a) and the four external walls (5). The experimental and simulated short shots exhibit similar filling patterns in the four corners at the junction of the diagonal sluts (3a) and walls (5). For this third filling stage, it is interesting to note that the position of the weld lines seen on the experimental result was correctly predicted by the model where such kind of molding defect generally occurs at the interfaces of two flow fronts and when the thermal transfer promote solidification. Finally, the absence of weld lines in Figure 9(d) suggests that the temperature inside the mold as well as the injection rate appear to be sufficient to maintain the feedstock in a liquid state until the part is completely filled. At the end of the mold filling, the complete mold filling predicted by the numerical model was confirmed with the real-scale injection where no incomplete filling was observed. The maximum injection pressure of about 16 kPa obtained numerically confirms that the LPIM approach can be used to shape this intricate metallic part.
The potential to simulate the flow behaviour within molds of different shape complexities and to predict the injection pressure of LPIM metallic-based feedstocks during the injection stage was investigated using the Autodesk Moldflow Insight 2019 commercial software. Four different stainless steel-based feedstocks were formulated from two different powders (water- or gas-atomised) at two solid loadings (60 and 65 vol. % of powder), and characterised to obtain the melting point, specific volume, viscosity, specific heat and thermal conductivity before being implemented in the simulation models. The simulated injected lengths and pressure profiles were validated with real-scale injections at various mold geometries, feedstock temperatures, mold temperatures and feedstock properties. The analysis of the results led to three important conclusions:
Regardless of the complexity of the mold (rectangular shape vs. complex shape), the flow patterns predicted by the numerical model were in good agreement with the experimental observations since the injections were carried out at a constant volumetric flow rate (i.e. were not influenced by the feedstock properties or process parameters, except for the injection speed). Furthermore, the numerical model was able to accurately predict the pressure values for the molds #1 & #2, i.e. the two simplest molds used in this work, exhibiting constant or a single variation in the cross-section. However, a maximum relative difference of 64% between simulations and experiments was seen for the dogbone mold #3, which exhibited two variations in the cross-section. The simulated flow patterns and pressure profiles obtained for the dogbone mold when varying the feedstock temperature, the mold temperature and feedstock properties were in good agreement with the experimental results. For a high solid loading (65 vol. % of powder), the powder morphology (water- vs. gas-atomised) had a significant influence on the injection pressure, where the model was able to capture the higher injection pressure required as the powder sphericity decreased. Using an adequate feedstock characterisation, the numerical model was able to adequately predict the flow patterns and injected pressures. This work confirms that further investigations are required to better understand the influence of the powder morphology on the injection pressure, especially for the LPIM process. Finally, the influence of the flow behaviour should be further investigated to capture rheological phenomena such as yield stress and wall slip to increase the accuracy of the simulation model.
Footnotes
Disclosure statement
No potential conflict of interest was reported by the author(s).