
Abstract
Owing to its processing freedom, additive manufacturing has emerged as a promising material processing method for Fe–Si alloys. In this process, the melt pool fused by selective laser undergoes rapid cooling, which results in non-equilibrium solidifications. Therefore, it is essential to systematically investigate the relationship between process parameters, microstructure and magnetic properties of the Fe–Si alloys manufactured by the L-PBF process. However, the conventional experimental approaches require time-consuming and costly procedures and a great deal of trial and error. In this regard, an efficient and cost-effective tool is needed to investigate the effect of process parameters on the microstructure and magnetic properties under a wide range of process conditions. In this study, the processing parameter correlations were conducted based on the statistical methods using the design of experiments. Through this method, the effect of process parameters on various properties, including relative density, coercivity and saturation magnetisation, was systematically investigated.
Keywords
Introduction
Recently, while electric vehicles have made significant progress owing to their potential to deal with the issue of greenhouse gas emissions, there is still a pressing need for more efficient and reliable electric motors that can provide sufficient power while reducing energy consumption [1]. Soft magnetic materials are one of the critical components of electric motors, which determine the operating efficiency and performance of electric motors for converting electrical energy into mechanical energy. The properties of soft magnetic materials, such as magnetic permeability, coercivity, electrical resistance and iron loss, are essential factors in determining the efficiency and performance of motors [2–4]. In particular, recently, as a significant amount of energy is dissipated owing to iron losses during periodic magnetisation and demagnetisation, there have been many efforts to reduce iron loss attributed to two primary sources: hysteresis losses and eddy-current losses. According to the previous report, the hysteresis losses are related to the magnetic properties of the soft magnetic materials.
On the other hand, eddy-current losses are strongly affected by geometric factors in device configuration as well as the electrical properties of materials [5–7]. Fe–Si alloys have been commercially suitable soft magnetic materials owing to their excellent electromagnetic properties, including high magnetic permeability and electrical resistivity, which contribute to decreasing the iron losses of electric motors. Fe–Si alloys have been used for a soft magnetic core by laminating thin sheets (0.1–0.5 mm thick) with insulation layers to minimise iron losses. However, the traditional manufacturing process has encountered a technical limit in reducing the thickness of the Fe–Si sheet. As a result, there is a limit to reducing iron losses.
Moreover, as the Si contents exceed 4 wt-%, Fe–Si alloys become too brittle to be roll-processed or stamped for the production of thin sheets using the traditional manufacturing process [1,8]. Although there have been reports on rapid solidification technology to overcome the brittleness of high silicon contents Fe–Si alloys, manufacturing net-shaped parts using these powders has still been difficult by the traditional manufacturing process [1,9]. Therefore, exploring and developing a novel manufacturing process for soft magnetic alloys is necessary.
To overcome these limitations, additive manufacturing (AM) has emerged as a promising material processing method for Fe–Si alloys owing to its processing freedom, which allows the manufacturing of complex designed parts at once without traditional dies, molds, milling and machining processes [3,5]. Furthermore, additive manufacturing of Fe–Si alloys can reduce iron losses by using high Si alloy contents and net shaping for geometric effect regardless of their mechanical properties. Laser powder bed fusion (L-PBF) is one of the AM technology that metal parts by fused layer by layer using a high-density laser beam. In this process, the melt pool fused by selective laser undergoes rapid cooling (103-106 K/s), which results in non-equilibrium solidifications [10–12]. Therefore, it is essential to systematically investigate the relationship between process parameters, microstructure and magnetic properties of the Fe–Si alloys manufactured by the L-PBF process. Although a few reports investigate the effect of process parameters on the microstructure and magnetic properties, the previous reports were carried out under limited process conditions (e.g. low silicon contents of less than 3 wt-% and confined process parameters) [2,12–15].
Therefore, it has still required further exploration under a wide range of process conditions and the effect of process parameters on the microstructure and magnetic properties. In addition, the conventional experimental approaches require time-consuming and costly procedures and much trial and error to achieve the abovementioned goal. In this regard, an efficient and cost-effective tool is needed to investigate the effect of process parameters on the microstructure and magnetic properties under a wide range of process conditions. A design of experiment (DoE) is a statistical methodology that can be applied for various purposes, including extracting major effective parameters, determining the effect of a single parameter, efficient experimental planning and optimising parameters. In particular, the combination of screening, experimental design and surface response using DoE can lay out the shortest route for investigating the effect of process parameters and optimal conditions [16,17]. However, despite these advantages, there has yet to be a report on the DoE to achieve the above purpose for high silicon-content Fe–Si alloys manufactured by the L-PBF process.
This work was focused on investigating in detail the correlation between process parameters, the microstructure and the magnetic properties of as-built Fe–Si alloys, which are manufactured under a wide range of conditions using the Fe–Si alloy powder with a high silicon content of 4.5 wt-%. Moreover, the design of experiment (DoE) technique was used to reduce the time and effort associated with manufacturing and analyse the effect of input parameters on the output variables, which determined the main effective parameter and the operating process window based on the statistical analyses [18–21]. After that, the microstructure and properties were systematically explained in detail from the viewpoint of the effects of the process parameters using various analysis tools.
Experimental details
In this study, Fe–4.5 wt-% Si alloy powder was purchased from MK Co., LTD, Gyeonggi-do, Republic of Korea, and used as feedstock powder without any purification for laser powder bed fusion. The morphology of raw material, as shown in Figure 1(a), exhibits an isotropic spherical shape consistent with the typical morphology of the particles prepared by the atomisation process. In addition, the average particle size was measured to be 21.82 mm, as presented in Figure 1(b). The EDS analysis measured the chemical composition, and the silicon contents in the raw materials were confirmed to be 4.69 wt-% (Figure 1(c)).
(a) FE-SEM image, (b) graph showing particle size distribution and (c) EDS results showing the chemical composition of the raw material.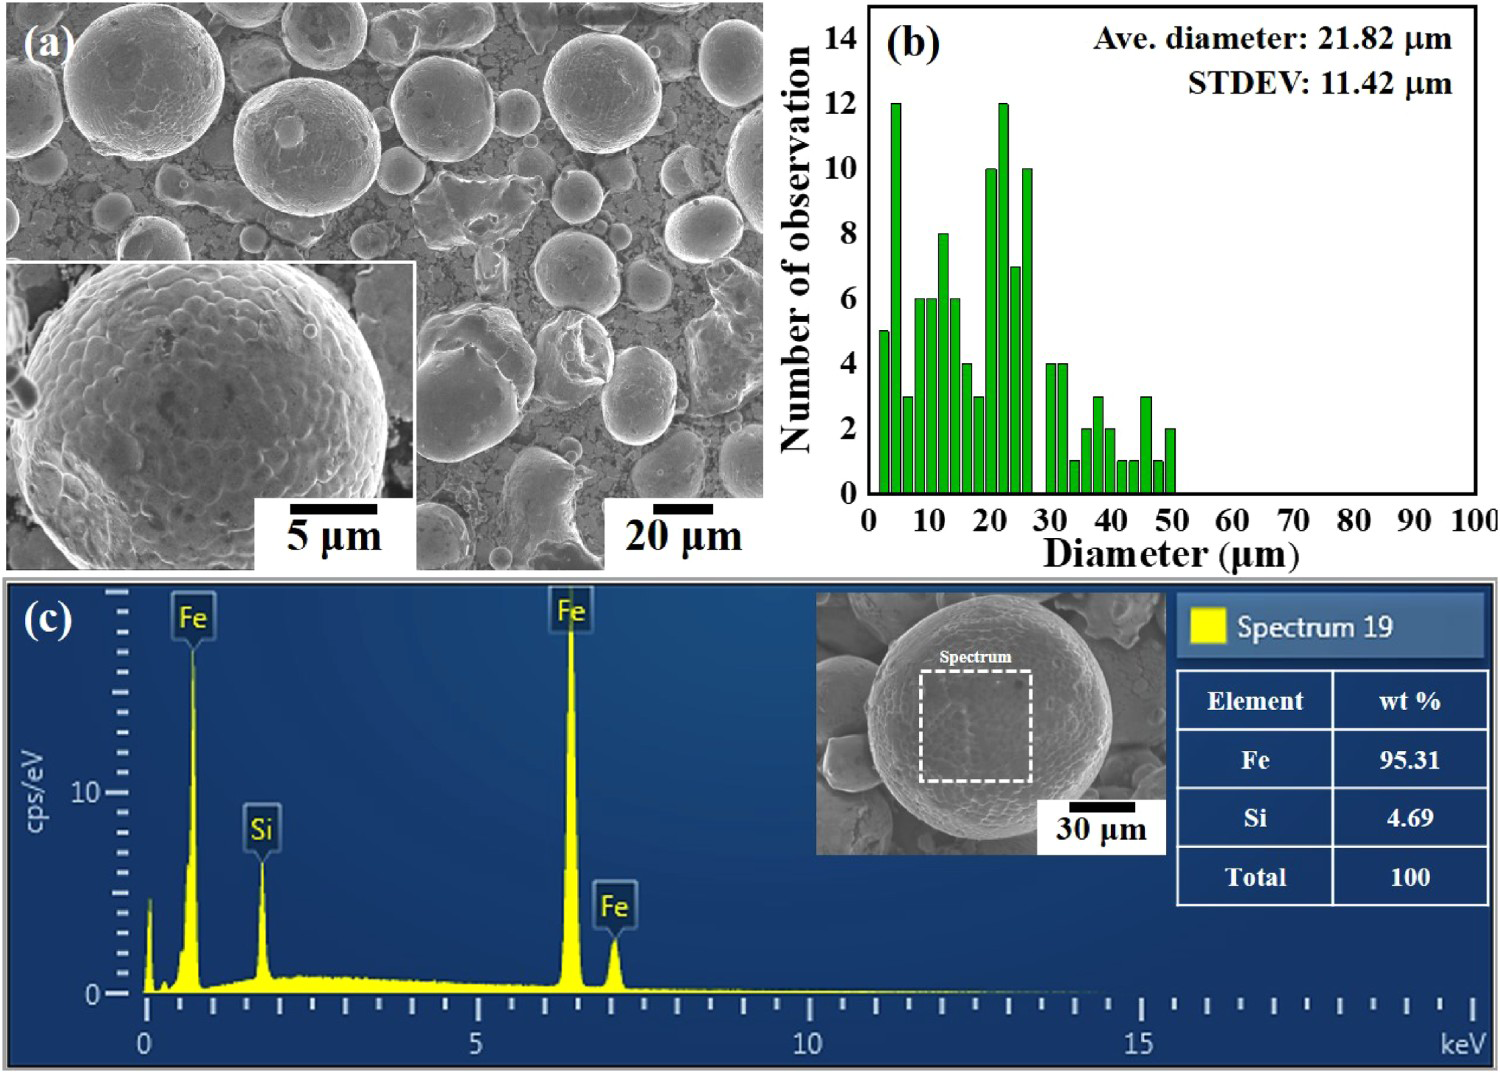
A series of cubic specimens with 5 mm × 5 mm × 6 mm were manufactured using a laser powder bed fusion machine (GE Concept Laser M2 Series 3, GE Additive, Germany) equipped with a 1070 nm laser. In this process, the L-PBF process was conducted under a nitrogen atmosphere, with the residual oxygen content kept below 0.2%. Moreover, each layer was scanned using a bidirectional exposure strategy with a scan vector rotated by 67o. In all of the experiments, the laser spot size was fixed to 100 mm, and the temperature of the building platform was maintained at room temperature.
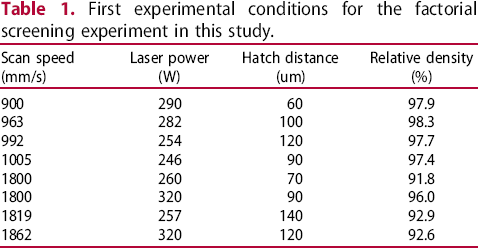
First experimental conditions for the factorial screening experiment in this study.
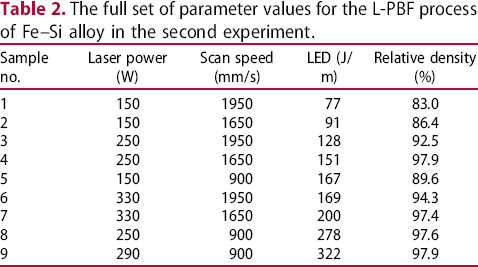
The full set of parameter values for the L-PBF process of Fe–Si alloy in the second experiment.
The crystal structure of the raw material and specimen were analysed using an X-ray diffractometer (XRD, X'Pert Powder, Malvern Panalytical, Almelo, Netherlands) with Cu Kα source. The XRD patterns were obtained between 10o and 90o of 2θ with a scanning rate of 4o min−1. The microstructure of both the XY and XZ planes of specimens was investigated using an optical microscope (OM) and a field-emission scanning electron microscope (FE-SEM, Hitachi SU5000, Hitachi, Japan) after grinding, polishing and etching process (1% nital solution, 8–13 min). The average particle size and size distribution of raw materials were measured using image analysis software (Image J), in which over 100 particles were manually selected from the pre-obtained FE-SEM micrographs. EDS analysis (X-MAX, Oxford Instrumental) confirmed the composition of raw materials. The chemical states were analysed using X-ray photoelectron spectroscopy (XPS, K-Alpha+, Thermo Fisher Scientific, USA). The specimens’ crystallographic orientations and grain size were examined by electron back-scattered diffraction (EBSD, Velocity Super EBSD camera series, Metek EDAX, USA) equipped on the FE-SEM, and step size was set at 1.60 μm. The residual stress inside the specimen was verified using the Kernal Average Misorientation (KAM) value acquired from EBSD data. The magnetic properties of the specimen manufactured by L-PBF were evaluated by a vibrating sample magnetometer (VSM, Lakeshore Learning Materials, 7410, USA) under an external magnetic field with a range of −10,000 G to 10,000 G at room temperature.
The screening experiment was conducted under the first experiment conditions (Table 1) to determine the critical factors affecting the L-PBF sample's relative density. Figure 2(a) shows the Pareto chart plotted by Minitab based on the t-statistics that test the null hypothesis that the effect of the factor is zero [2,22]. This result reveals that the scan speed (factor A), the laser power (factor B) and the interaction between all factors are statically significant on the relative density of L-PBF samples because the respective bars cross the reference line ∼2. On the other hand, hatch distance (factor C) does not cross the reference line, indicating that it is not significant for the relative density [23]. The diagram of the main effect of the parameters, exhibited in Figure 2(b), shows that the scan speed is inversely proportional to the relative density of L-PBF samples. However, the laser power is directly proportional to the relative density. Moreover, from each slope, these results reveal that the effect of the scan speed is larger than that of the laser power for the relative density. Therefore, scan speed and laser power were selected as input parameters for the experimental design step, and three levels, including maximum, mean and minimum conditions, were selected for each factor (Table 2).
(a) The Pareto chart generated by Minitab of the standardised effect of all process parameters on the relative density (α = 0.5) and (b) The diagram showing the main effect of the process parameter on relative density.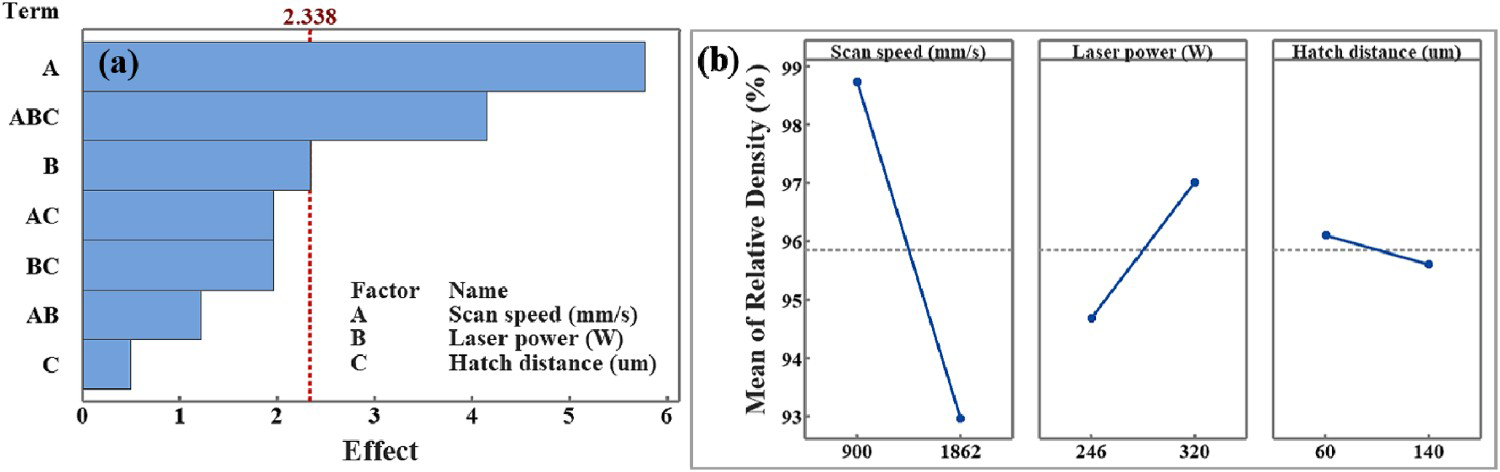
As exhibited in Table 2, L-PBF samples manufactured in the second experiment show the non-linear relationship between LED and relative density. Therefore, the microstructures of all specimens were investigated in detail. Figure 3 shows the optical micrographs of the XY planes and the XZ planes manufactured in the second experiment. In the XY planes, the L-PBF samples manufactured in low LED (no. 1 and no. 2) show defective microstructure, including macrocracks, large pores with an irregular shape (keyhole pore), and tiny spherical pores (gas pore) [24,25]. As the LED increases to 151 J/m, the PBF samples (no. 3 and no. 4) show explicit microstructure without these defects. However, the L-PBF samples manufactured in higher LED (nos. 5–9) show defective microstructures that include a lot of tiny spherical pores. These results can be explained by the cooling behaviour in the melt pool according to the input LED. In general, under the exposure of the ray, a recessed keyhole is formed owing to the recoil pressure of the metal vapour and a small degree of the Marangoni effect. In this situation, owing to the molten metal circulation, the keyhole's entrance has a relatively lower temperature than the bulk molten metal, increasing the surface tension than that of the bulk region. As a result, the entrance of the keyhole is closed owing to a high surface tension, and the gas inside the keyhole cannot escape owing to the high cooling rate of low LED input and solidifies as it is, forming an irregularly shaped keyhole pore.
(a,b) Optical micrographs and (c,d) FE-SEM images of all L-PBF samples: (a,c) the XY planes and (b,d) the XZ planes.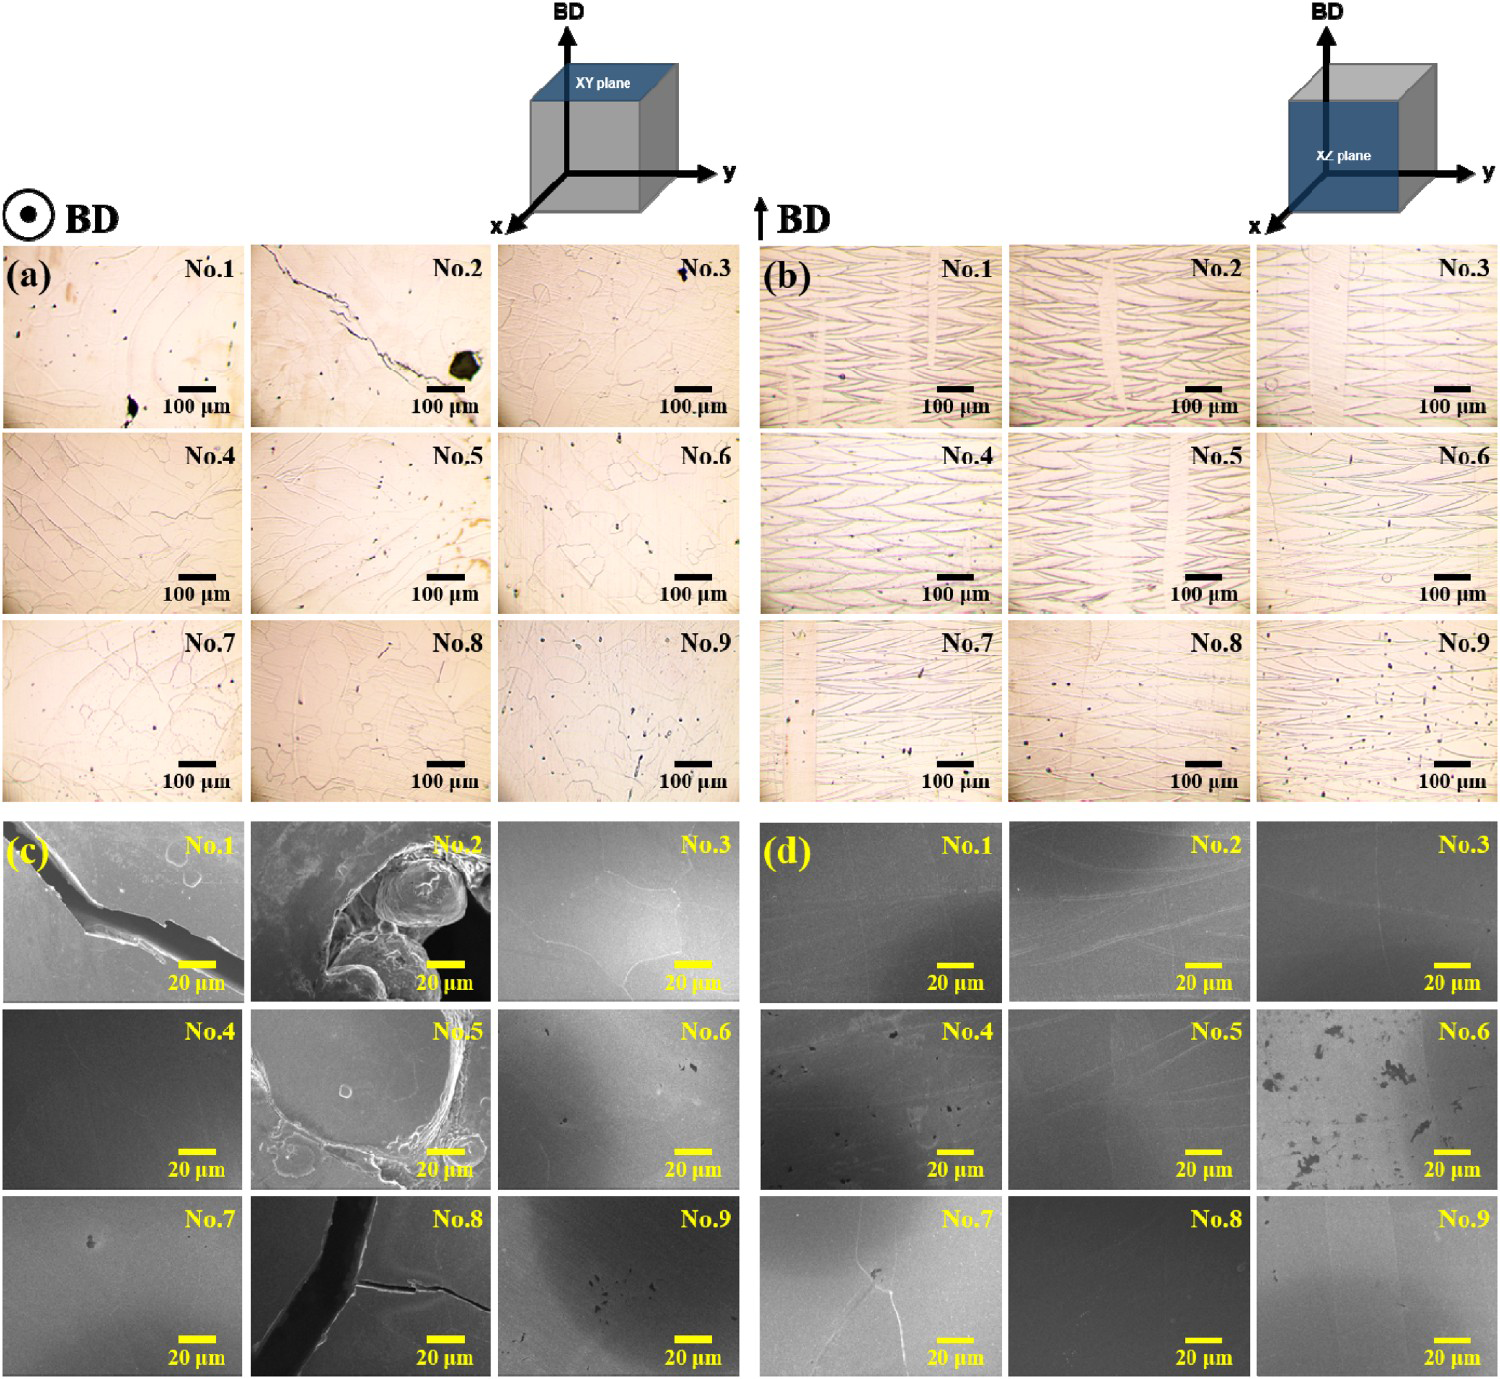
On the other hand, metallurgical pores are defined as spherical pores formed by capturing inside the melt pool despite the slow cooling rate owing to the high LED [24–26]. The OM images of the cross-sectional planes (XZ plane parallel to building direction), presented in Figure 3(b), show a tendency similar to the XY plane, which increases tiny spherical pores as the LED increases. The FE-SEM images in Figure 3(c,d) show the similar behaviour of microstructures in both XY and XZ planes with the increase in LED. Microcracks were observed in FE-SEM images of L-PBF samples manufactured in high LED owing to the complex thermal history.
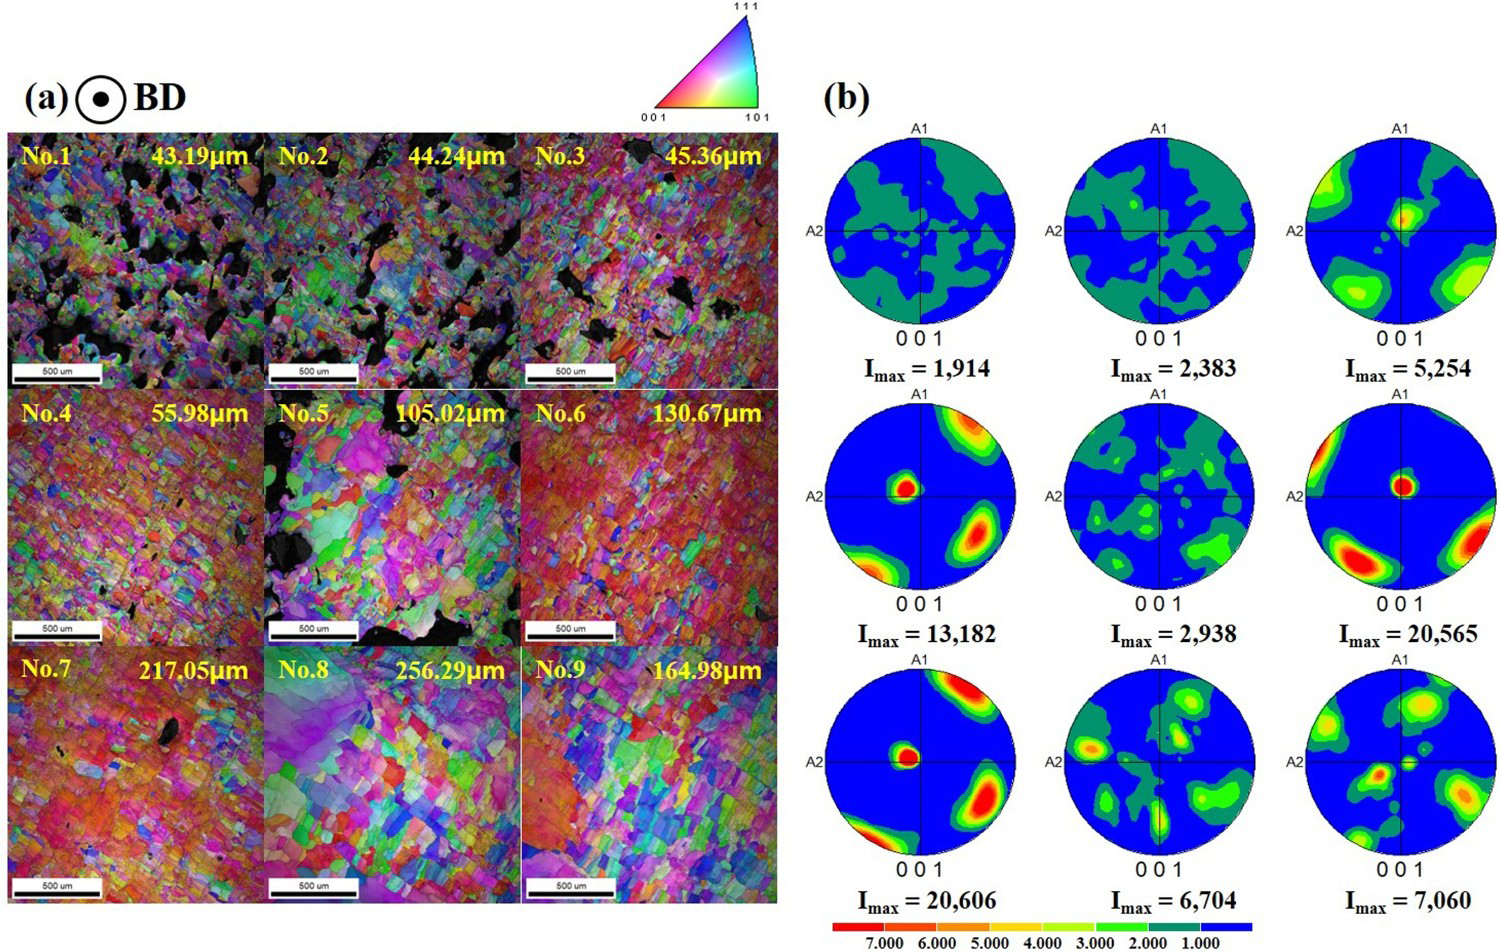
The EBSD analysis was conducted to investigate crystallographic texture and orientation in the microstructure. Figure 4 shows IPF maps and pole figures obtained by EBSD analysis of the XZ plane of as-built Fe–Si specimens. As presented in Figure 4(a), the columnar grains in Fe–Si specimens manufactured in LED over 100 J/m are observed in the IPF maps of the XZ plane parallel to the building direction. Moreover, the larger the LED, the larger and elongated grains are observed. However, the equiaxed structure is observed in the microstructure of the as-built Fe–Si specimen using a 322 J/m of LED. The pole figures of all specimens in Figure 4(b) show the different crystallographic textures of <001> depending on the LED. In these results, the maximum texture intensity is dependent on the LED. The pole figure of the samples manufactured using LED of 169 J/m showed the highest maximum texture intensity and then decreased with higher LEDs. These differences in texture can be explained by the melt pool dimension, which is determined by the LED [27]. Since the temperature gradient is quickly dissipated according to the building direction, Fe–Si alloys with cubic structure easily grow to follow the heat dissipation path, resulting in the crystallographic texture oriented into <001> direction [12–14]. However, in low energy, the raw materials are insufficiently melted owing to low energy input, deteriorating the crystallographic texture development. On the other hand, in high LED, the larger and dipper melt pool is formed owing to the excessive high energy input. In this situation, the heat in the melt pool is radially dissipated from the middle of the melt pool, deteriorating the ordering of crystal grains during the solidification process because the growth occurs along the heat dissipation path [27]. A similar effect of the process parameters on the crystallographic texture is observed in the IPF map and pole figure of the XY plane, as shown in Figure 5.
(a) IPF maps and (b) pole figure of the XZ planes of all samples manufactured in this study. (a) IPF maps and (b) pole figures of the XY planes of all samples manufactured in this study.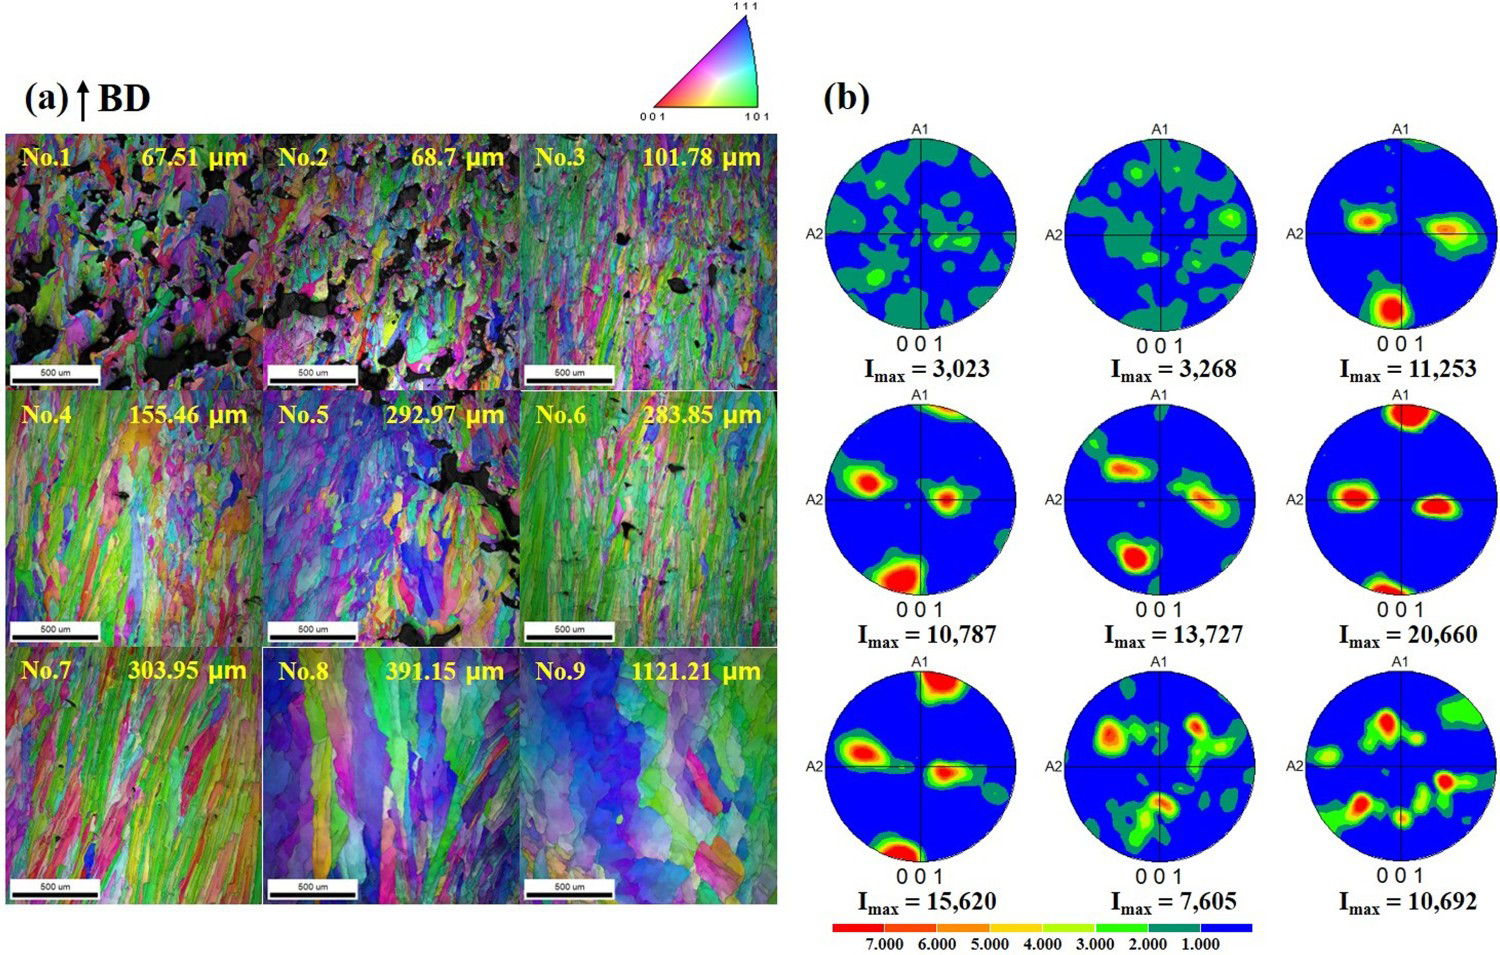
In a non-equilibrium cooling process such as an L-PBF process, the complex residual stress is generally produced in the microstructure, which deteriorates the coercivity of soft magnetic materials [28]. Therefore, the effect of parameters on residual stress was investigated by the Kernel Average Misorientation (KAM) method. Figure 6 shows the KAM distribution of both XY and XZ planes of the L-PBF samples. This map's blue colour represents the regions with the lowest misorientation and residual stress. In contrast, green represents regions with relatively high misorientation and residual stress [29]. In these results, the KAM maps of the specimens (no. 8 and no. 9) manufactured with high LED shows the broad blue regions with the lowest residual stress. On the other hand, the KAM maps of the specimens manufactured with low LED exhibit broad green-coloured regions, indicating the high residual stress in these specimens. The crystal structure and phase of all specimens were confirmed by both XRD analysis and phase map obtained from EBSD analysis. Figure 7(a) shows that only the α-ferrite phase is confirmed in all L-PBF samples through phase maps. In contrast, from the XRD patterns in Figure 7(b), it is observed that all of the specimens were slightly oxidised during the L-PBF process. The XPS core level spectra of the as-built sample (no. 7) on Fe, Si and O elements, shown in Figure 7(c–e), clearly exhibited peaks assigned to oxidised species, including Fe2+, Fe3+ and Si4+ [30,31]. Moreover, these oxidised species were consistent with the oxidation numbers of the Fe7SiO10 phase, which were observed in XRD patterns.
The Kernel Average Misorientation (KAM) map of (a) the XZ and (b) the XY planes of samples manufactured in this study. (a) Phase maps obtained EBSD analysis and (b) XRD patterns of all samples manufactured by the second experiment. (c–e) X-ray photoelectron spectra of the as-built Fe–Si alloys (sample no. 7): (c) Fe 2p, (d) Si 2p and (e) O 1s.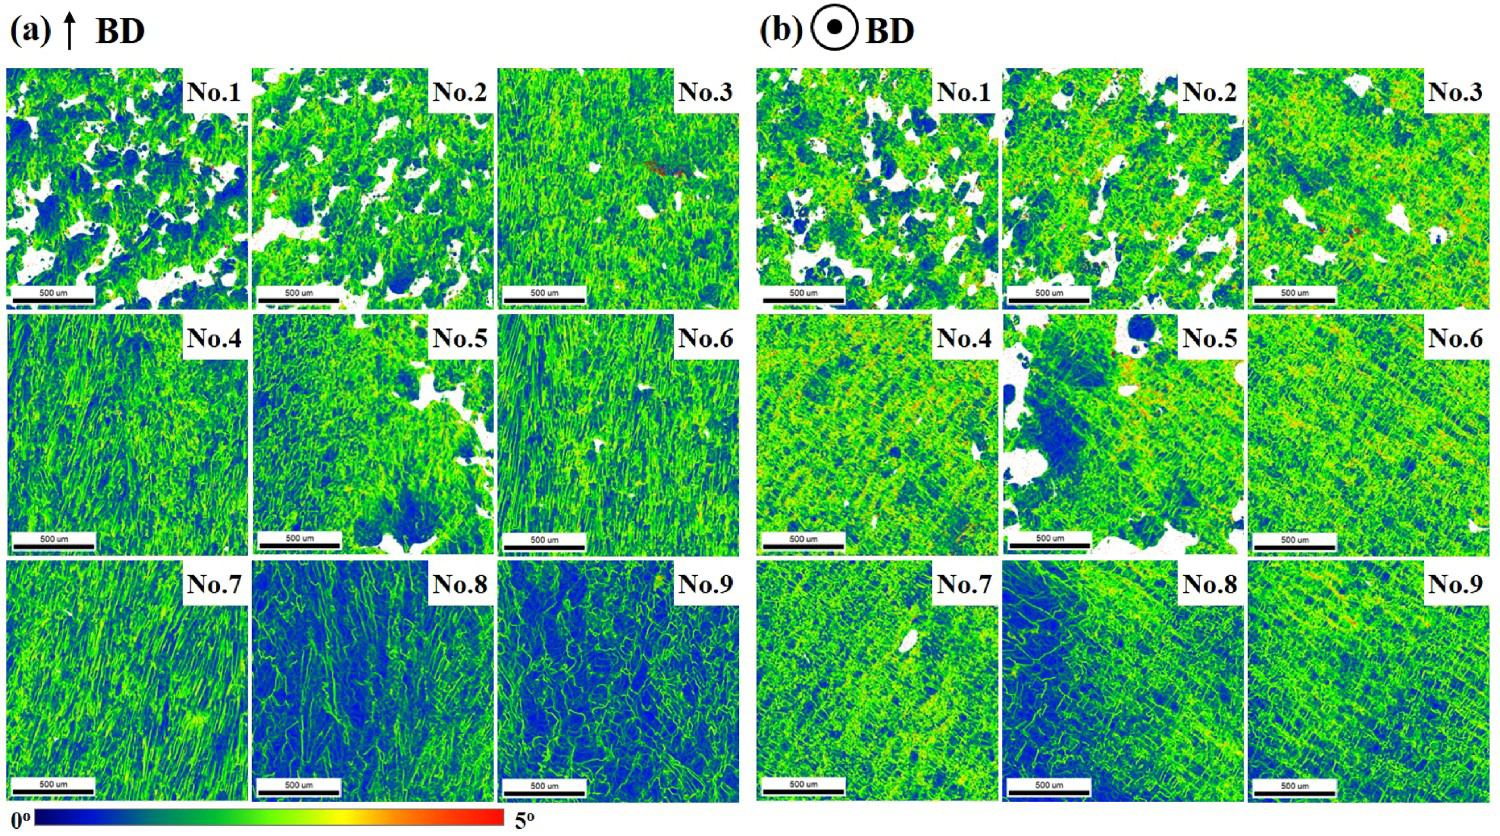
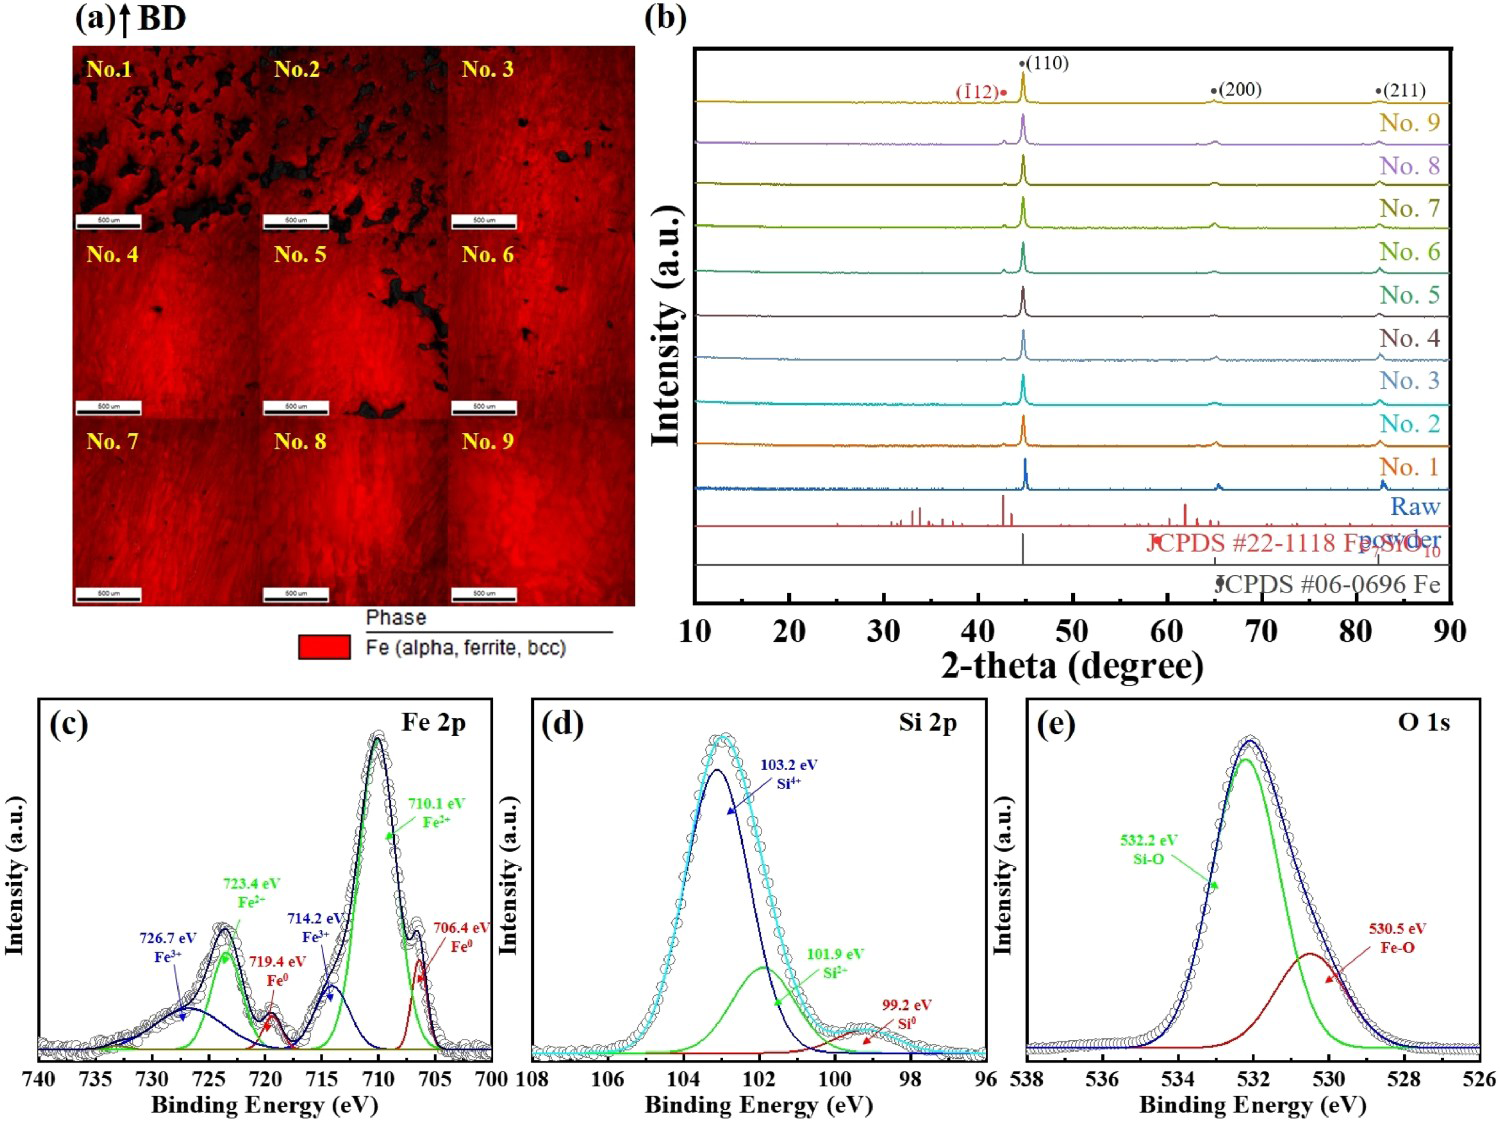
Figure 8(a–c) shows the hysteresis curves of the raw materials and as-built samples manufactured under different process conditions and the enlargement part of the magnetisation curve in the high and low magnetic fields. The hysteresis curves indicate the soft magnetic character of both raw powder and as-built samples. However, all as-built samples exhibit a lower saturation magnetisation than raw material, attributed to the oxide phase, as confirmed by the XRD patterns in Figure 7(b). In addition, the as-built sample manufactured in the highest LED condition presents the lowest saturation magnetisation compared with other samples with similar relative densities. In the previous literature, relative density is crucial in determining the saturation magnetisations of as-built L-PBF samples. However, as LED increases up to 128 J/m, the saturation magnetisation of the as-built sample increases, and then the saturation magnetisation decreases as LED over 128 J/m. These results indicate the non-linear relationship between relative density and Ms. According to the previous reports, this phenomenon can be explained by substituting Fe atoms and non-magnetic Si atoms under the excessive-high energy input, reducing the saturation magnetisation. On the other hand, the coercivity shows a transversely proportional relationship with the LED, which is consistent with the previous reports [14,15]. The hardness of as-built samples was investigated and presented in Figure 8(d). Although the samples with high density (nos. 4, 6, 7 and 9) showed high hardness, it was observed that there was an unclear relationship among process parameters, grain size and hardness. These results indicate that it is necessary to further study the correlation among process parameters, microstructure and mechanical properties.
(a) hysteresis loop and of the initial powder and as-built samples. (b,c) the enlargement part in the (b) high magnetic field regions and (c) the low magnetic field region. (d) Hardness of as-built samples with the different processing parameters.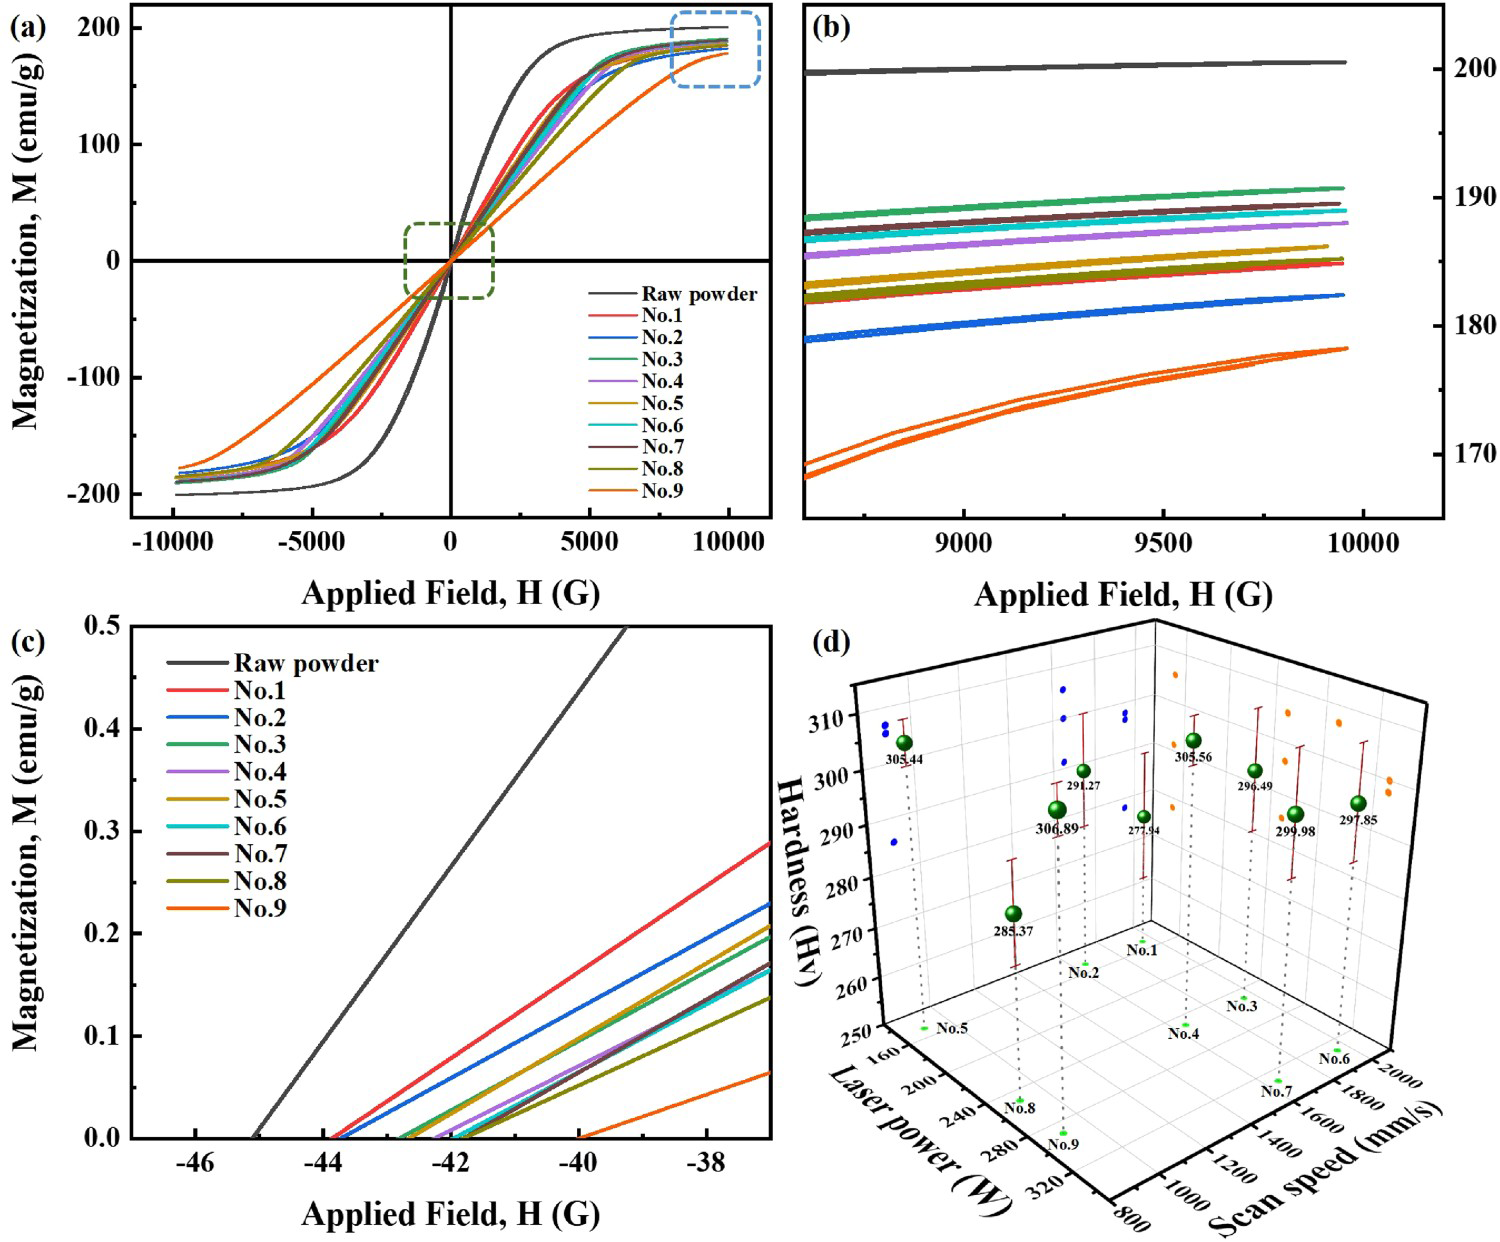
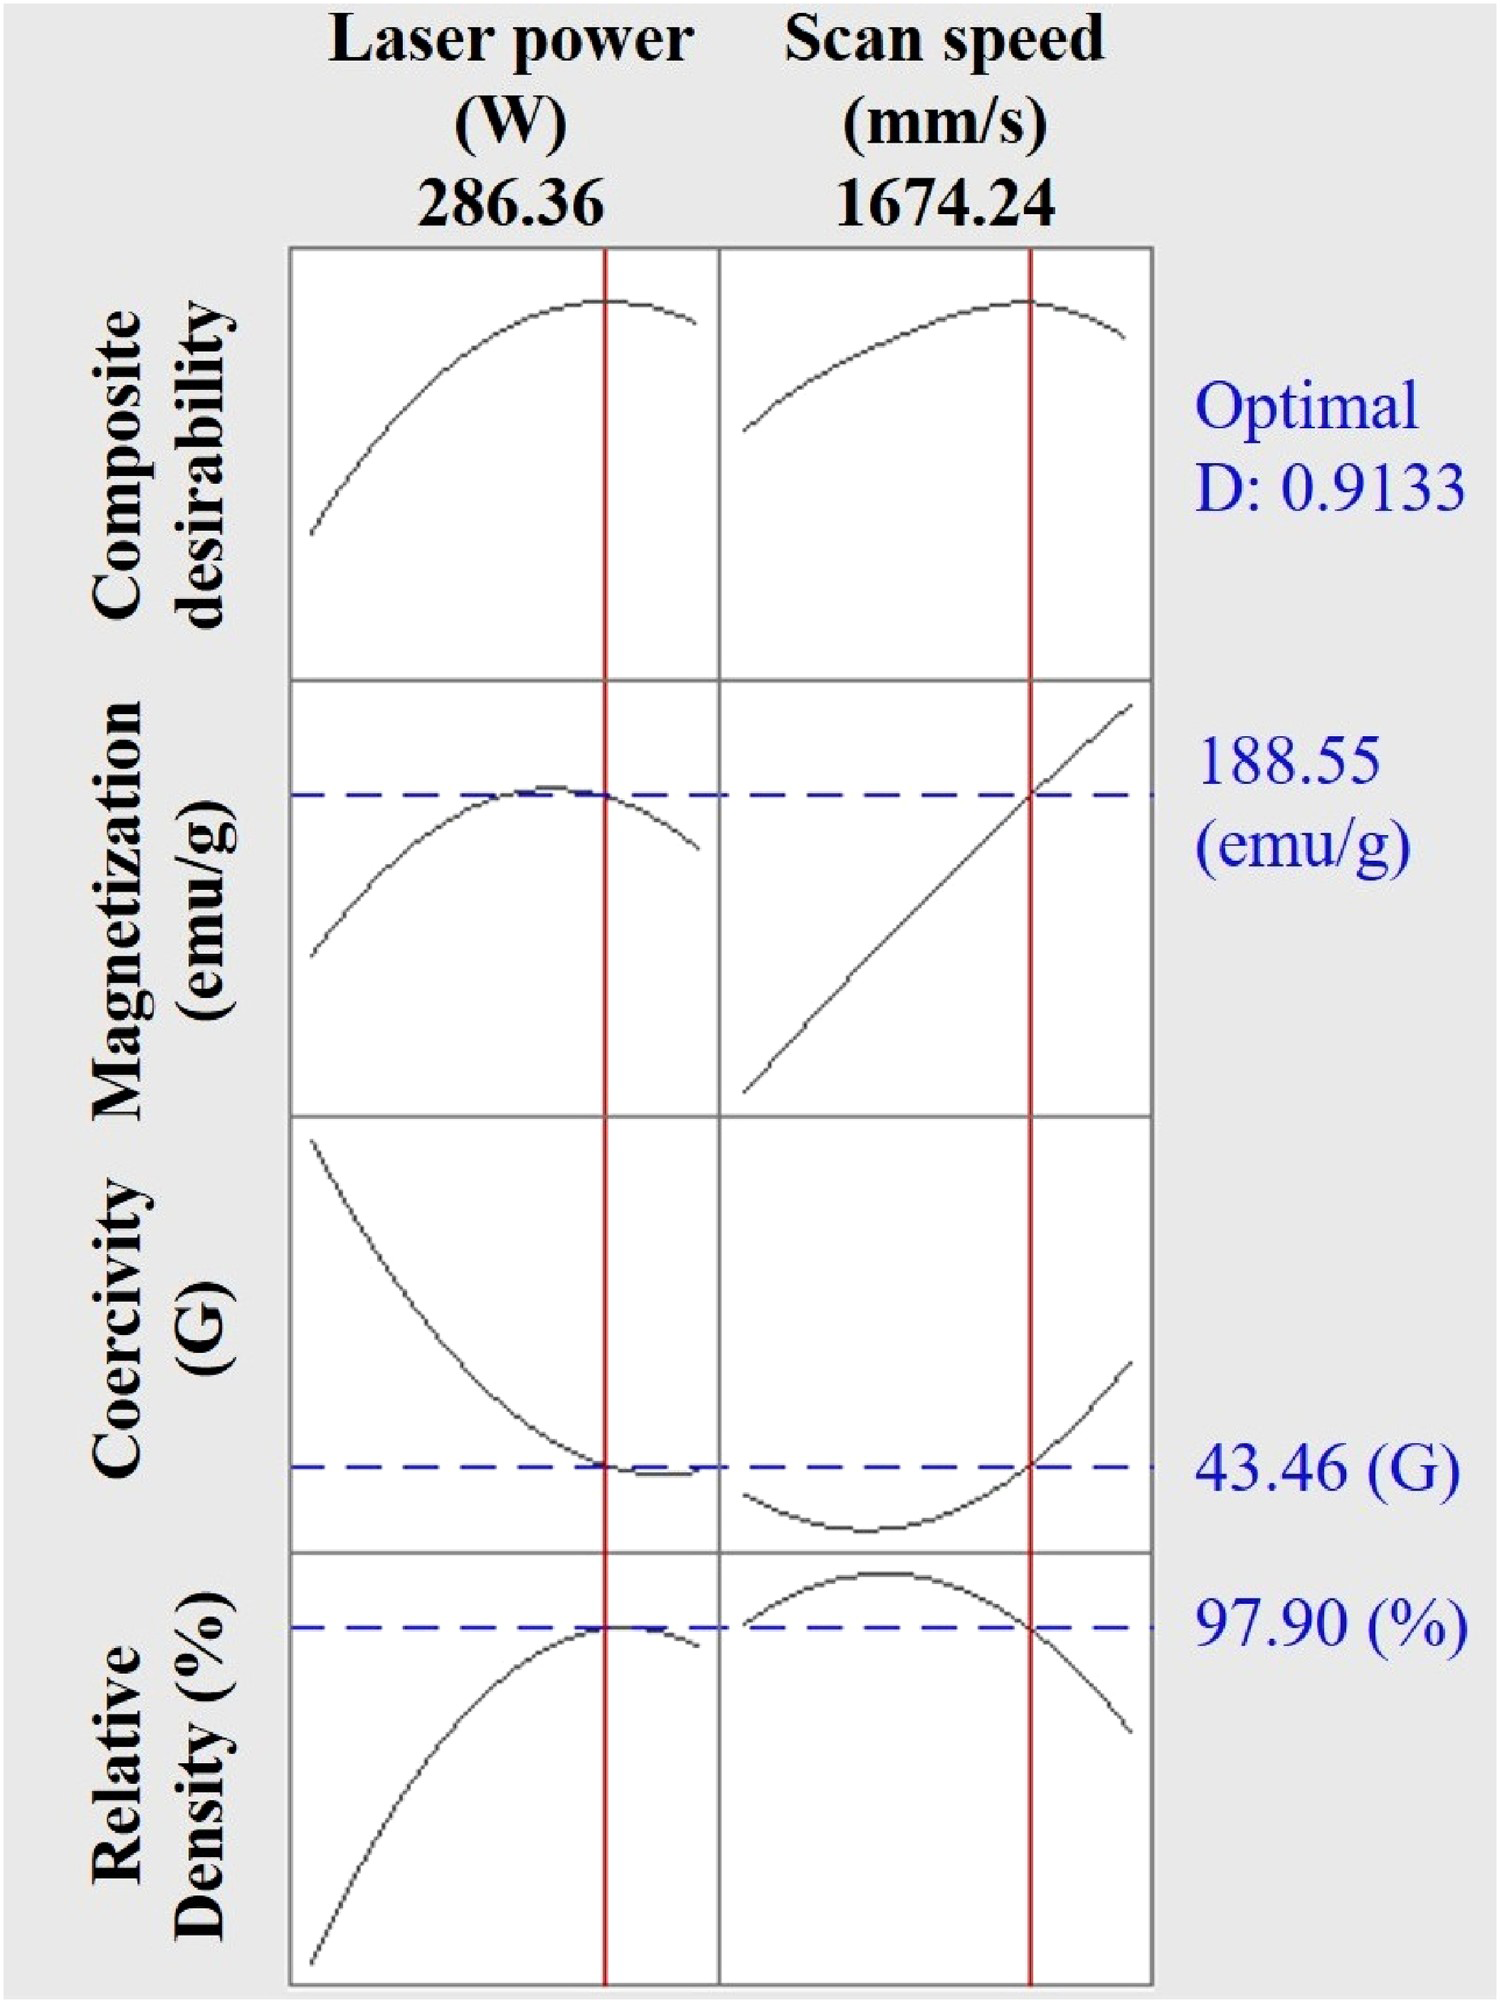
This study focused on an efficient and effective investigation of the correlation between process parameters, microstructure and magnetic properties of L-PBF samples using DoE. Among various DoE methodologies, the response surface methodology is an efficient way to estimate the interactions between factors and output results and optimise the process parameters using a limited amount of experimental data [16]. Figure 9 presents 3D response surface plots showing the relationship between process parameters (i.e. laser power and scan speed) and various output values, respectively. As shown in Figure 9, the relative density and the saturation magnetisation show the paraboloid relationship with both process parameters. On the other hand, the coercivity exhibits the inversed paraboloid relationship with both process parameters. The optimal process parameters calculated from the response surface analysis, shown in Figure 10, are the laser power of 286.36 W and a scan speed of 1674.24 mm s−1, which is able to maximise both relative density and saturation magnetisation and minimise the coercivity.
The 3D response surface plot on (a) the relative density, (b) coercivity and (c) saturation magnetisation. The optimised process parameters and predicted results calculated by response surface analysis.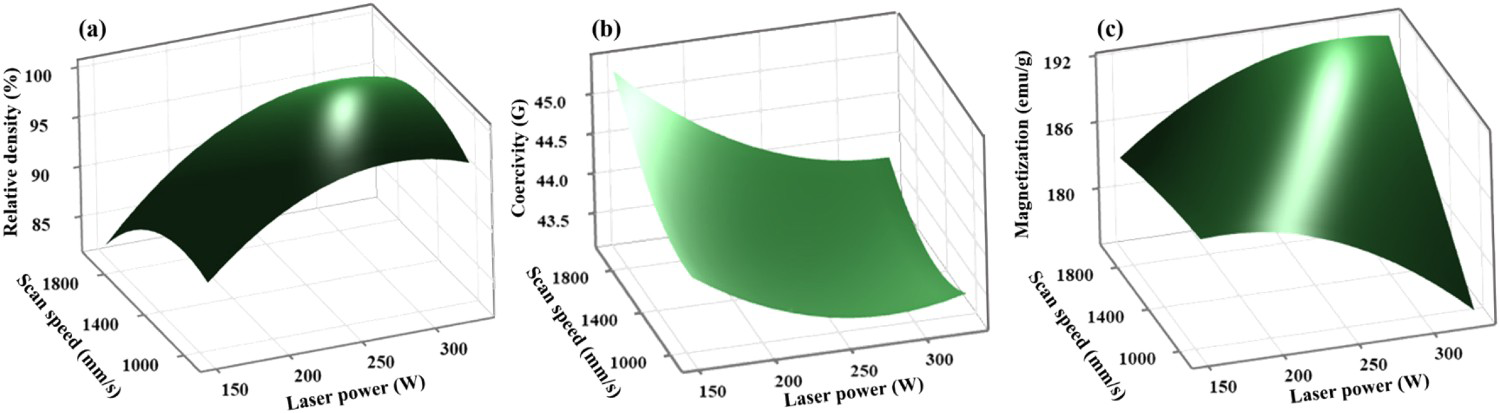
The relative density, coercivity and saturation magnetisation of as-built samples at different process conditions.
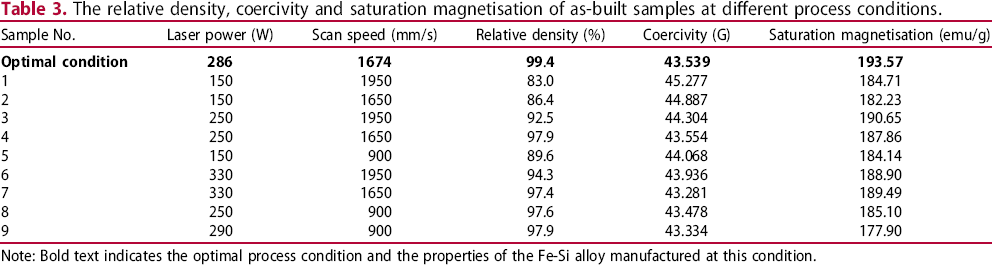
Note: Bold text indicates the optimal process condition and the properties of the Fe-Si alloy manufactured at this condition.
The comparison of the properties of as-built sample manufactured at optimal condition in this study with previously reported results.
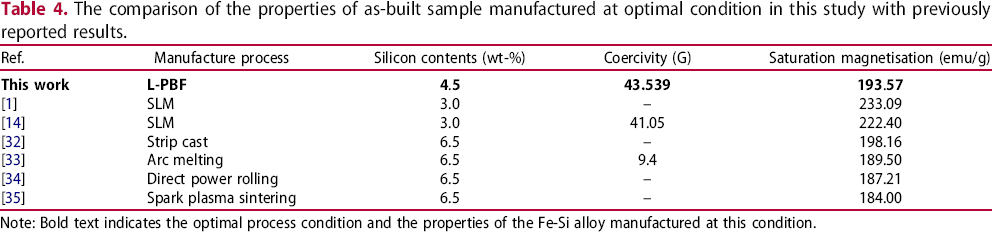
Note: Bold text indicates the optimal process condition and the properties of the Fe-Si alloy manufactured at this condition.
In this study, the processing parameter correlations were conducted based on the statistical methods using the design of experiments. Through this method, the effect of process parameters on various properties, including relative density, coercivity and saturation magnetisation, was systematically investigated. For this purpose, the experimental design was conducted based on statistical screening and exploring the main effect of the respective parameters. The as-built L-PBF samples were manufactured by the powder bed fusion under the designed experimental conditions. Through the systematic analyses, it was discussed in detail the effect of process parameters on the microstructure of the as-built L-PBF samples. Furthermore, the obtained material properties were used as output results for processing parameter correlations to investigate their effect on the properties. Then, based on the above results, the optimal processing condition was successfully suggested, which is able to maximise both relative density and saturation magnetisation and minimise the coercivity of the as-built L-PBF samples. Moreover, the prediction has been successfully verified. Through these results, we expect that this cost-effective and efficient statistical method provides useful insight into the powder bed fusion of magnetic materials.
Footnotes
Disclosure statement
No potential conflict of interest was reported by the author(s).