
Abstract
The Cu–Cr–Ti alloys with different Ti contents were prepared by vacuum induction melting, solid solution, cold deformation, and ageing treatment. The microstructures, mechanical, and electrical properties of Cu–Cr–Ti alloys were investigated under different Ti contents. The results indicate that the increase of Ti content can improve the mechanical properties of Cu–Cr–Ti alloys, whereas its conductivity decreases significantly. After cold rolling by 80% and ageing at 500°C for 60 min, the Cu-0.3Cr-0.05Ti alloy with the hardness, electrical conductivity, and tensile strength are 162.6 HV, 82.2% IACS, and 510 MPa, respectively. The strengthening mechanism of the studied alloys is mainly attributed to the Orowan precipitation and dislocation strengthening. The addition of Ti in the ageing process can retard the growth and coarsen Cr precipitates.
Keywords
Introduction
Copper alloys with excellent mechanical properties and electrical conductivity have been used in many industries, such as large-scale integrated circuit lead frames, electronic component connectors, high-end electrodes, and contact wires of high-speed railway [1,2]. Cu–Cr alloy has become one of the research hotspots for its high strength, high electrical conductivity, and non-magnetic properties [3,4]. As a typical precipitation strengthening alloy, the increased strength of Cu–Cr alloy is attributed to the fine Cr precipitation dispersed in the Cu matrix during aging. In recent years, to further adapt to the future development of science and technology and economy, the research on Cu–Cr alloy gradually diversified.
Alloying is a standard method to improve the mechanical properties of Cu–Cr alloy. Various minor elements, such as Zr, Mg, Ag, and Ti, were added to the Cu–Cr alloy to achieve this goal. Cu–Cr–Zr is a large-scale Cu–Cr base alloy that is widely used at present. The results showed that adding a small amount of Zr element could precipitate Cr and Cu3Zr, and the shape of the precipitated phase changed from flake to granular. The strength and hardness of the alloy were enhanced by the second phase particles [5]. However, under non-vacuum melting conditions, the Zr element is easy to oxidise and burn losses, and it has a severe reaction with graphite lining materials. In addition, it is challenging to control Zr in the smelting process and accurately controlling its content, which impedes the industrial application of these alloys, posing a challenge to the development and application of Cu–Cr–Zr alloy [6]. Ti and Zr belong to the same transition group of metal elements. Their properties are more stable and have lower cost and burn losses than Zr, and the addition of Ti improves the mechanical properties of copper alloy. Many studies have shown that Ti atoms can increase the driving force of precipitation, promote the refinement of precipitation, and delay the growth of grains [7]. Wang et al. [8] reported that the Ti element could refine Cr particles during the annealing process. However, many scholars have not reached a consensus on the phase transformation and strengthening mechanism of Cu–Cr–Ti alloy during aging. On the other hand, the addition of alloying elements will decrease the conductivity of Cu–Cr alloy. Therefore, the optimal content of Ti addition and the influence mechanism of Ti addition on Cu–Cr alloy need further investigation.
Based on the above research progress, four kinds of Cu–Cr–Ti alloy samples with different Ti content were prepared to obtain good comprehensive properties. The properties and microstructure of the alloy after aging treatment were studied. The morphology and microstructure of Cu–Cr–Ti precipitates were analysed by a transmission electron microscope (TEM, Tecnai G2 F30, FEI). The effect of Ti content on the microstructure and properties of Cu–Cr alloy was studied, and the strengthening mechanism of Cu–Cr–Ti alloy was also investigated.
Materials and methods
The Cu–Cr–Ti alloy was smelted in a vacuum induction melting furnace with pure electrolytic Cu (99.9 wt-%), Cu-25%Cr, and Cu-22%Ti alloys as raw materials. Casting was performed after the material was completely melted to prepare an ingot with a diameter of 80 mm. The sides of the ingot were planed to remove surface defects and then cut into 5 mm-thick plate samples by using a CNC wire-cut EDM machine. Subsequently, the samples were homogenised at 870°C for 10 h. To dissolve the Cr and Ti elements in the Cu matrix, the samples underwent solution treatment at 960°C for 60 min with argon shielding and followed by water quenching, and then were cold rolled to 1 mm with a total deformation of 80%. Finally, the plate samples were aged at different temperatures and times to determine the optimum heat treatment. The process flow is shown in Figure 1.
The technological process of the experiment.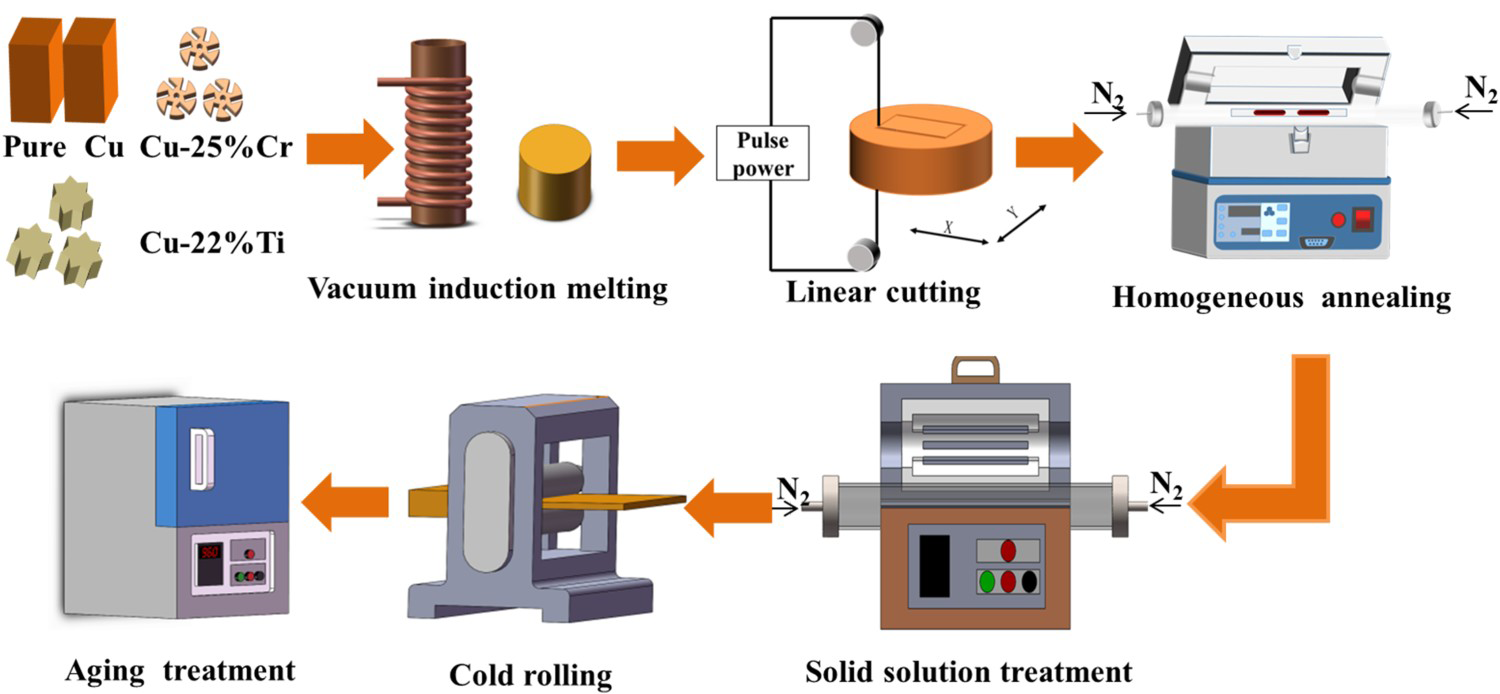
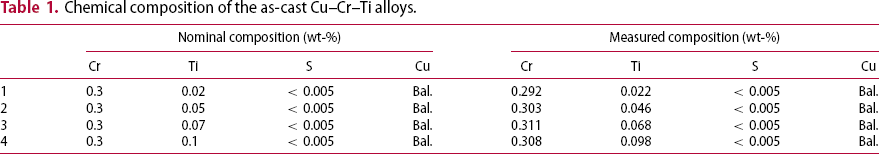
Chemical composition of the as-cast Cu–Cr–Ti alloys.
Results
Mechanical properties and electrical conductivity
Figure 2 shows the hardness and conductivity evolution of the alloy after 60 min aging treatment at different temperatures. The aging temperature has a significant influence on the hardness of Cu–Cr–Ti alloys. Figure 2(a) shows with the increase of aging temperature from 400°C to 500°C, the hardness increases gradually and reaches the maximum at 500°C. Under this condition, the peak hardness of Cu-0.3Cr-0.1Ti reaches 175 HV, and that of Cu-0.3Cr-0.02Ti is 155 HV. Compared with the Cu-0.3Cr-0.02Ti alloy, the hardness of Cu-0.3Cr-0.1Ti increased by 11.4%. The hardness of the four alloys intensely drops with the rise in temperature to 600°C, illustrating that the alloy was over-aged when the aging temperature was higher than 500°C.
The variation curves of hardness (a) and conductivity (b) of the tested alloys aged for 60 min.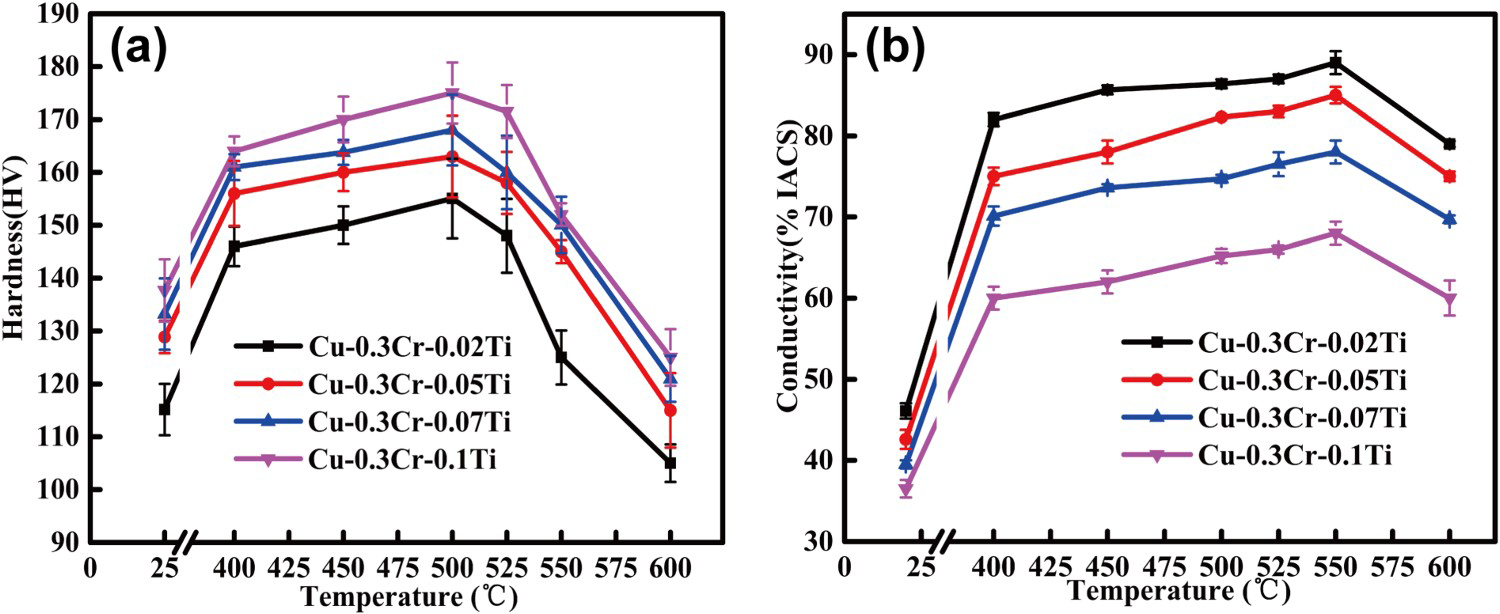
The conductivity curves of the tested alloys aged at different temperatures for 60 min are shown in Figure 2(b). The conductivity increases rapidly initially, and the upward trend gradually decreases until the maximum at 550°C. As the temperature continues to rise, the electrical conductivity begins to decrease. Because when the aging temperature is lower than 550°C, high atomic activity capacity, more precipitation of the second phase, less solid dissolved atoms, weak electron scattering effect, and higher conductivity occur. However, with the increase of aging temperature, the solid solubility of the added second phase elements in the matrix increases, the free energy difference between the supersaturated desolvation phase and the parent phase of alloy elements decreases [9] and the precipitation rate of solute atoms slow down. Therefore, a very high temperature will reduce the conductivity of the alloy.
Figure 3 shows the hardness and conductivity evolution of the alloy at different times during aging treatment at 500°C. Figure 3(a) shows the hardness of the alloys increases rapidly until reaching 60 min. When aged for 90 min or more, the hardness shows a downward trend. After aging for 240 min, the hardness of Cu-0.3Cr-0.02Ti alloy decreased by 38 HV compared with the peak value of aging, and the rate of decrease is 24.5%, whereas that of Cu-0.3Cr-0.1Ti alloy decreases by 33 HV with a dropping percentage of 18.3%. Therefore, the Cu-0.3Cr-0.1Ti alloy shows better resistance to softening than the Cu-0.3Cr-0.02Ti alloy. As the aging time increases, the conductivity of the alloy rises slightly and then tends to a smooth state with the extension of time, as shown in Figure 3(b). After 120 min, there will be a small range of fluctuations in the conductivity of the alloy with different compositions. The conductivity of Cu-0.3Cr-0.02Ti and Cu-0.3Cr-0.1Ti alloys at peak-aging state are 87.3 and 66.3% IACS, respectively.
The variation curves of hardness (a) and conductivity (b) of the tested alloys aged at 500°C.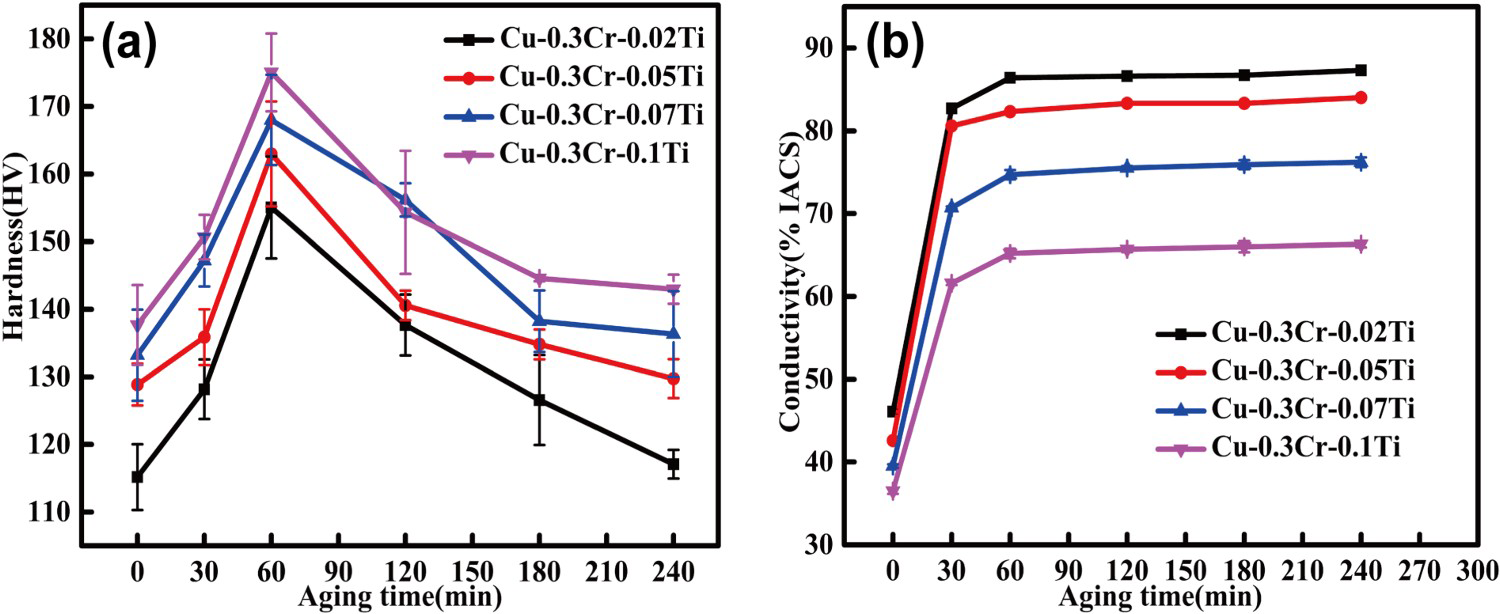
The relationship between the hardness and conductivity of Cu–Cr–Ti alloy and Ti content is shown in Figure 4(a). With increasing Ti content from 0.02 to 0.1 wt-%, the hardness increased from 155 to 175 HV, increase percentage of 11.2%, and the electrical conductivity decreased from 86.4 to 65.2% IACS, the rate of decrease is 24.5%. It is evident that the increase of Ti content has a little influence on the mechanical properties of the Cu–Cr–Ti alloy, but it can significantly affect the conductivity of the Cu–Cr–Ti alloy.
The variation curves of the tested alloys aged at 500°C for 60 min. (a) Hardness and conductivity, and (b) strength and fracture strain.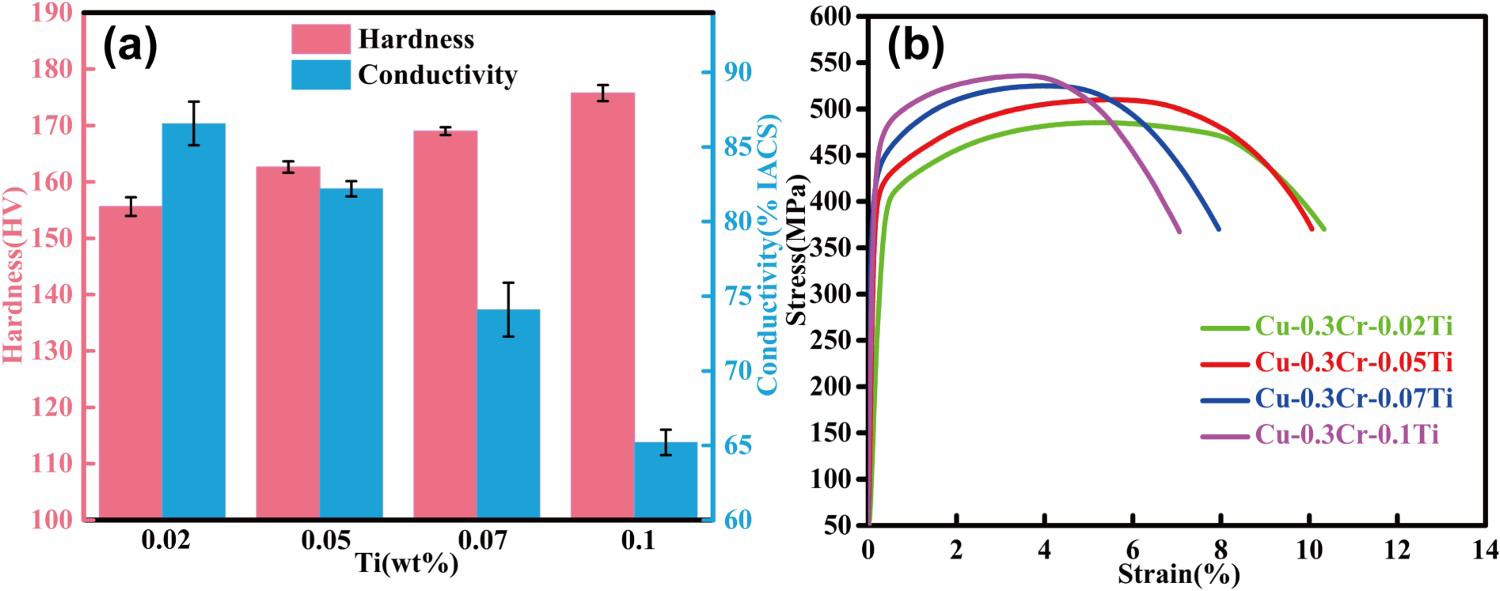
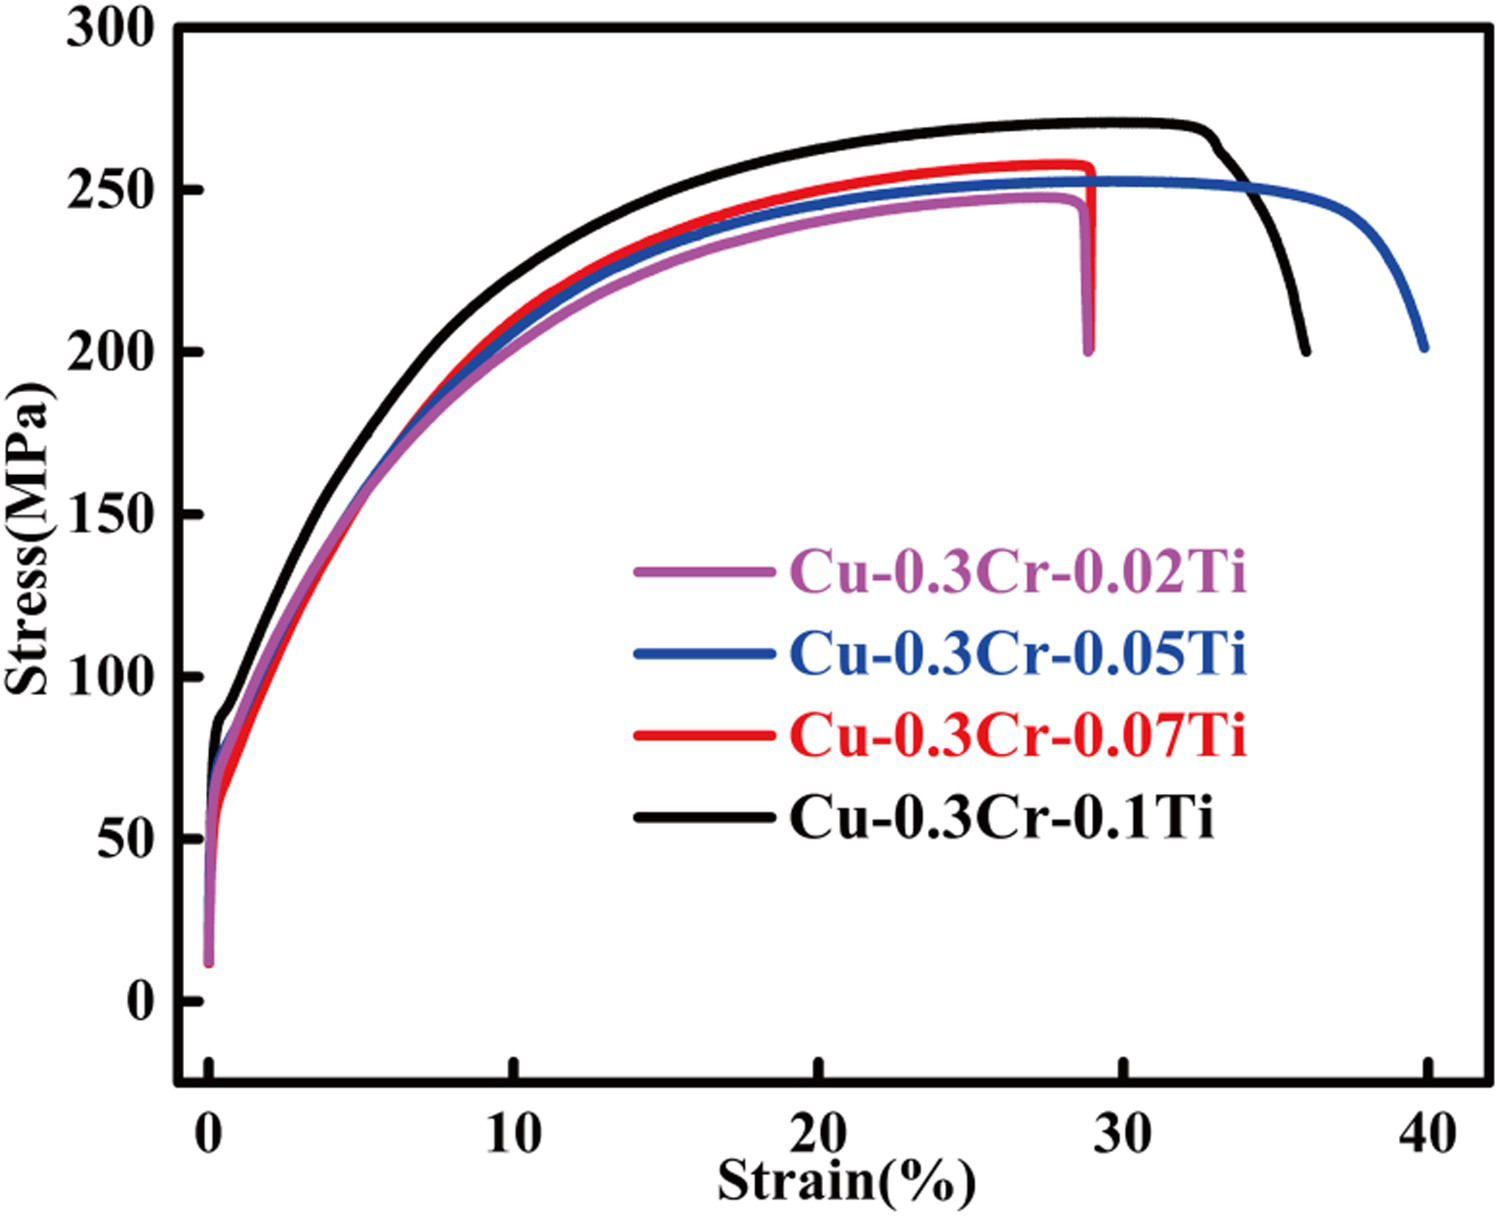
The stress–strain curves of aged Cu–Cr system alloys with different Ti contents are shown in Figure 4(b). The Cu-0.3Cr-0.02Ti alloy after aging has the ultimate tensile strength of 482.4 MPa, and the fracture strain is about 14%. The result shows that the tensile strength is enhanced with the increasing Ti content. The fracture strain presents a significant reduction with the addition of Ti as a response to the improved strength. When Ti content increased to 0.1%, the ultimate tensile strength and fracture strains are 538.3 MPa and about 10%, respectively.
Microstructures
Figure 5 shows the tensile fracture morphology of Cu–Cr alloy with different Ti content. The alloys used in this test have typical ductile fracture characteristics. The dimples are relatively uniform, which are generated by the formation, growth, and coalescence of microvoids during the necking process in the course of tensile deformation. The fracture dimples of Cu-0.3Cr-0.02Ti and Cu-0.3Cr-0.05Ti alloys are deeper and smaller, and the distribution is very uniform (Figure 5(a,b)). With the increase of Ti content, the size and shape of dimples changed significantly. The fracture dimples of Cu-0.3Cr-0.07Ti and Cu-0.3Cr-0.1Ti alloys were flat and round, and the dimples were relatively shallow (Figure 5(c,d)). The result shows that with the increase of Ti content, the fine and uniform dimples gradually transform into thick dimples, which is not conducive to the plastic deformation of the alloy, resulting in the decrease of the plasticity of the alloy.
Fracture surface of the tested alloys aged at 500°C for 60 min. (a) Cu-0.3Cr-0.02Ti; (b) Cu-0.3Cr-0.05Ti; (c) Cu-0.3Cr-0.07Ti; and (d) Cu-0.3Cr-0.1Ti.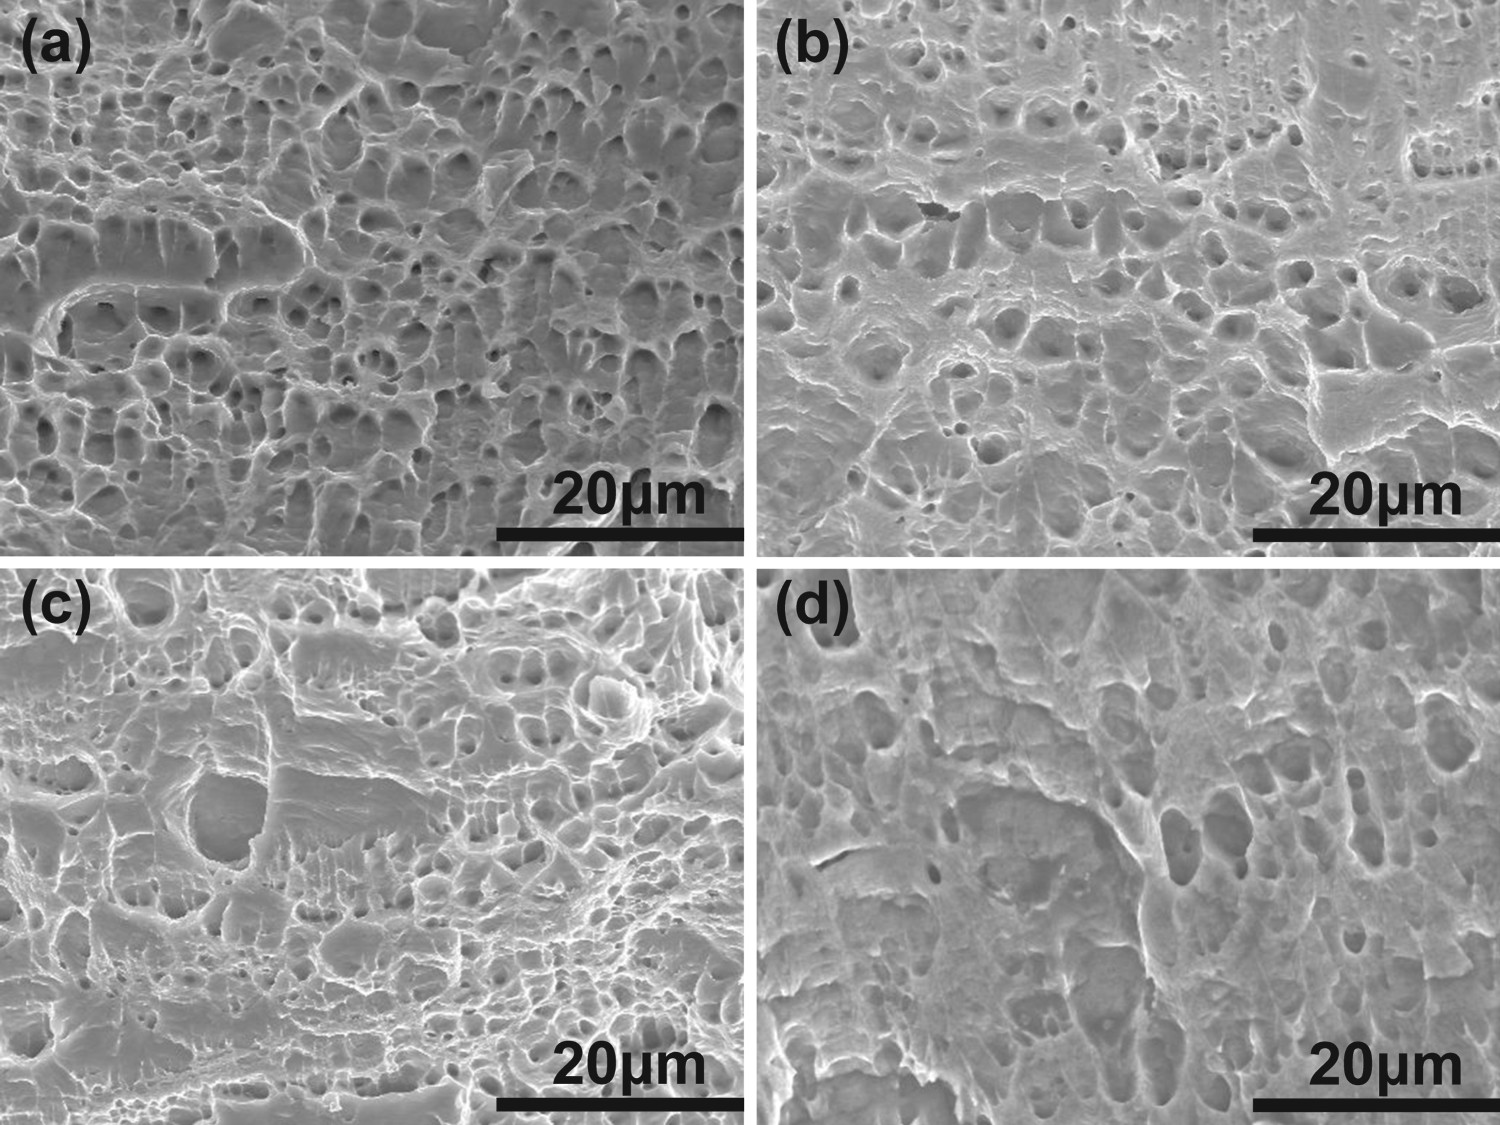
Figure 6 shows the bright-field (BF) images of the Cu–Cr system alloys aged at 500°C for 60 min. A large number of dislocation tangles (Figure 6(a–d)) appear in the matrix. There are dislocation cells caused by high-density dislocations in the alloy due to the formation of many dislocation walls in the cold rolling process. Many nano-scale precipitates also appear in the matrix, as shown in Figure 7(a,c,e,g). The average size of the precipitated phase is about 2∼3 nm, as shown in Figure 7(b,d,f,h). The difference between aging precipitates is that the average size of precipitates decreases with the increase of Ti content, indicating that Ti can inhibit the growth of Cr precipitates. Because the solidified and precipitated Cr phase gradually grows during the aging treatment, and large lattice distortion energy is generated around the Cr phase. The boundary between the Cr phase and the Cu matrix becomes inconsistent, and several dislocations and vacancies appear in the interface area. A diffusion path for Ti atoms that is easy to dissolve is formed, and Ti atoms, therefore, gather at the Cu/Cr phase interface to inhibit the further growth of the Cr phase [10]. After aging treatment, the nano-sized precipitates are decomposed from the supersaturated solid solution and are evenly distributed inside the alloy.
The BF images aged at 500°C for 60 min of the tested alloys. (a)Cu-0.3Cr-0.02Ti; (b) Cu-0.3Cr-0.05Ti; (c) Cu-0.3Cr-0.07Ti; and (d) Cu-0.3Cr-0.1Ti. The BF images, DF images, and the statistical distribution of precipitate size aged at 500°C for 60 min of the tested alloys. (a,b) Cu-0.3Cr-0.02Ti; (c,d) Cu-0.3Cr-0.05Ti; (e,f) Cu-0.3Cr-0.07Ti; and (g,h) Cu-0.3Cr-0.1Ti.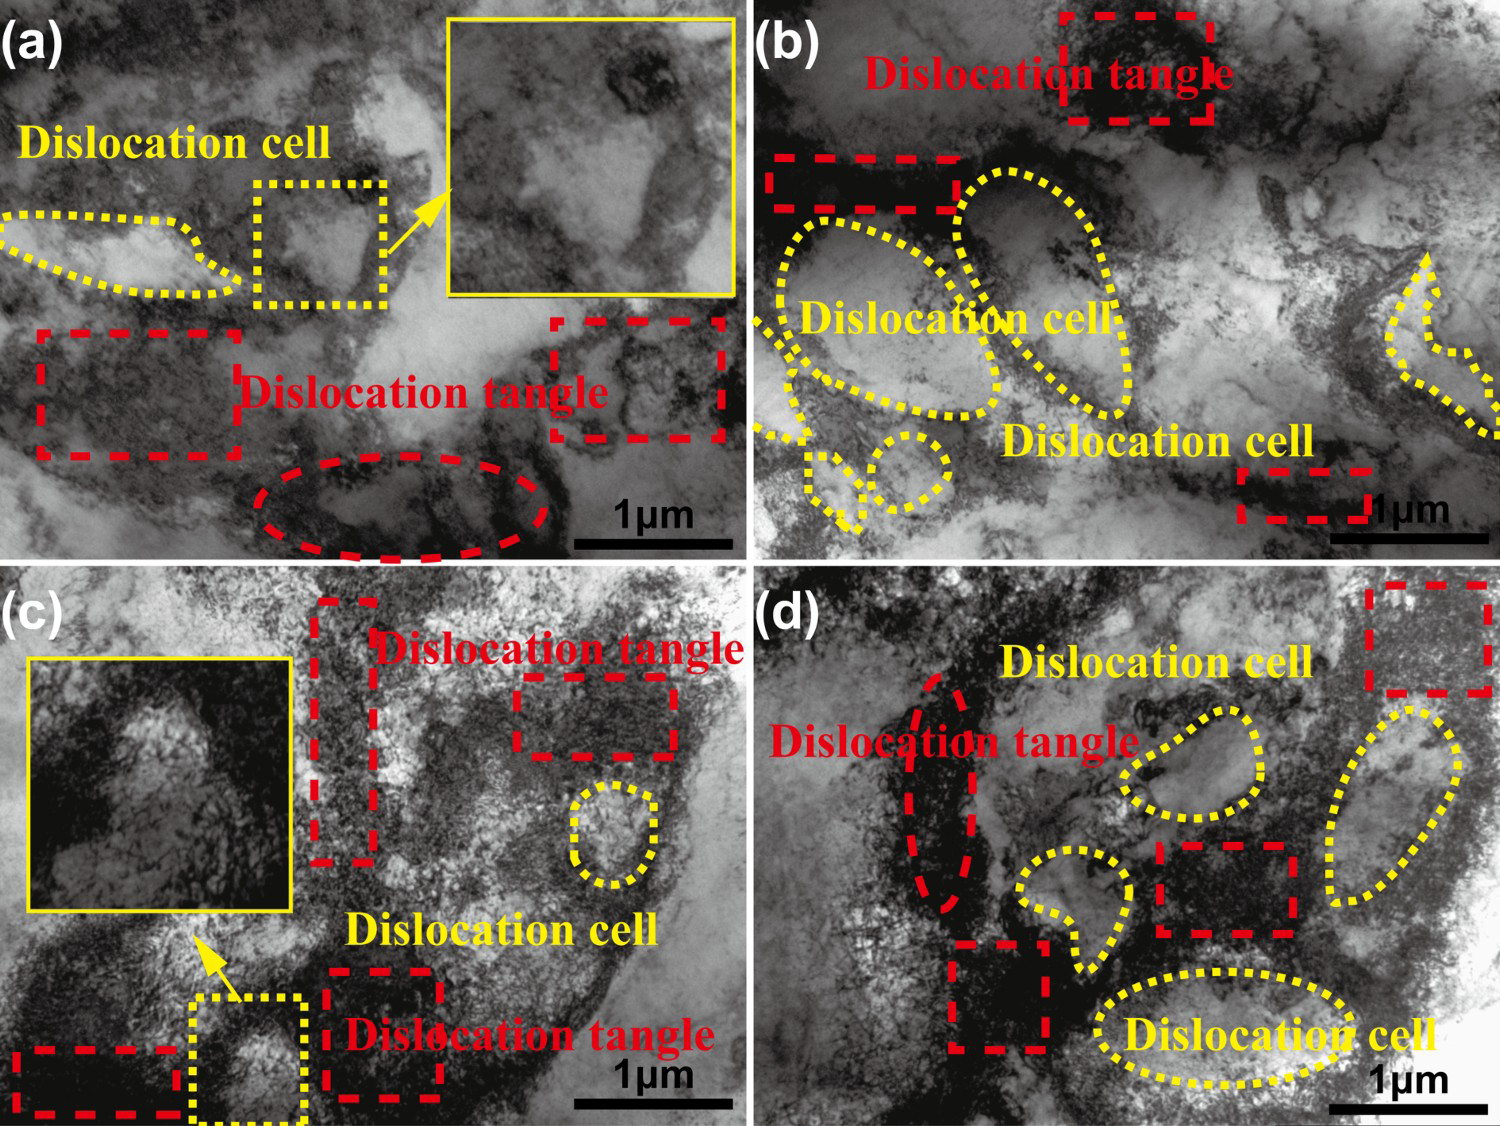
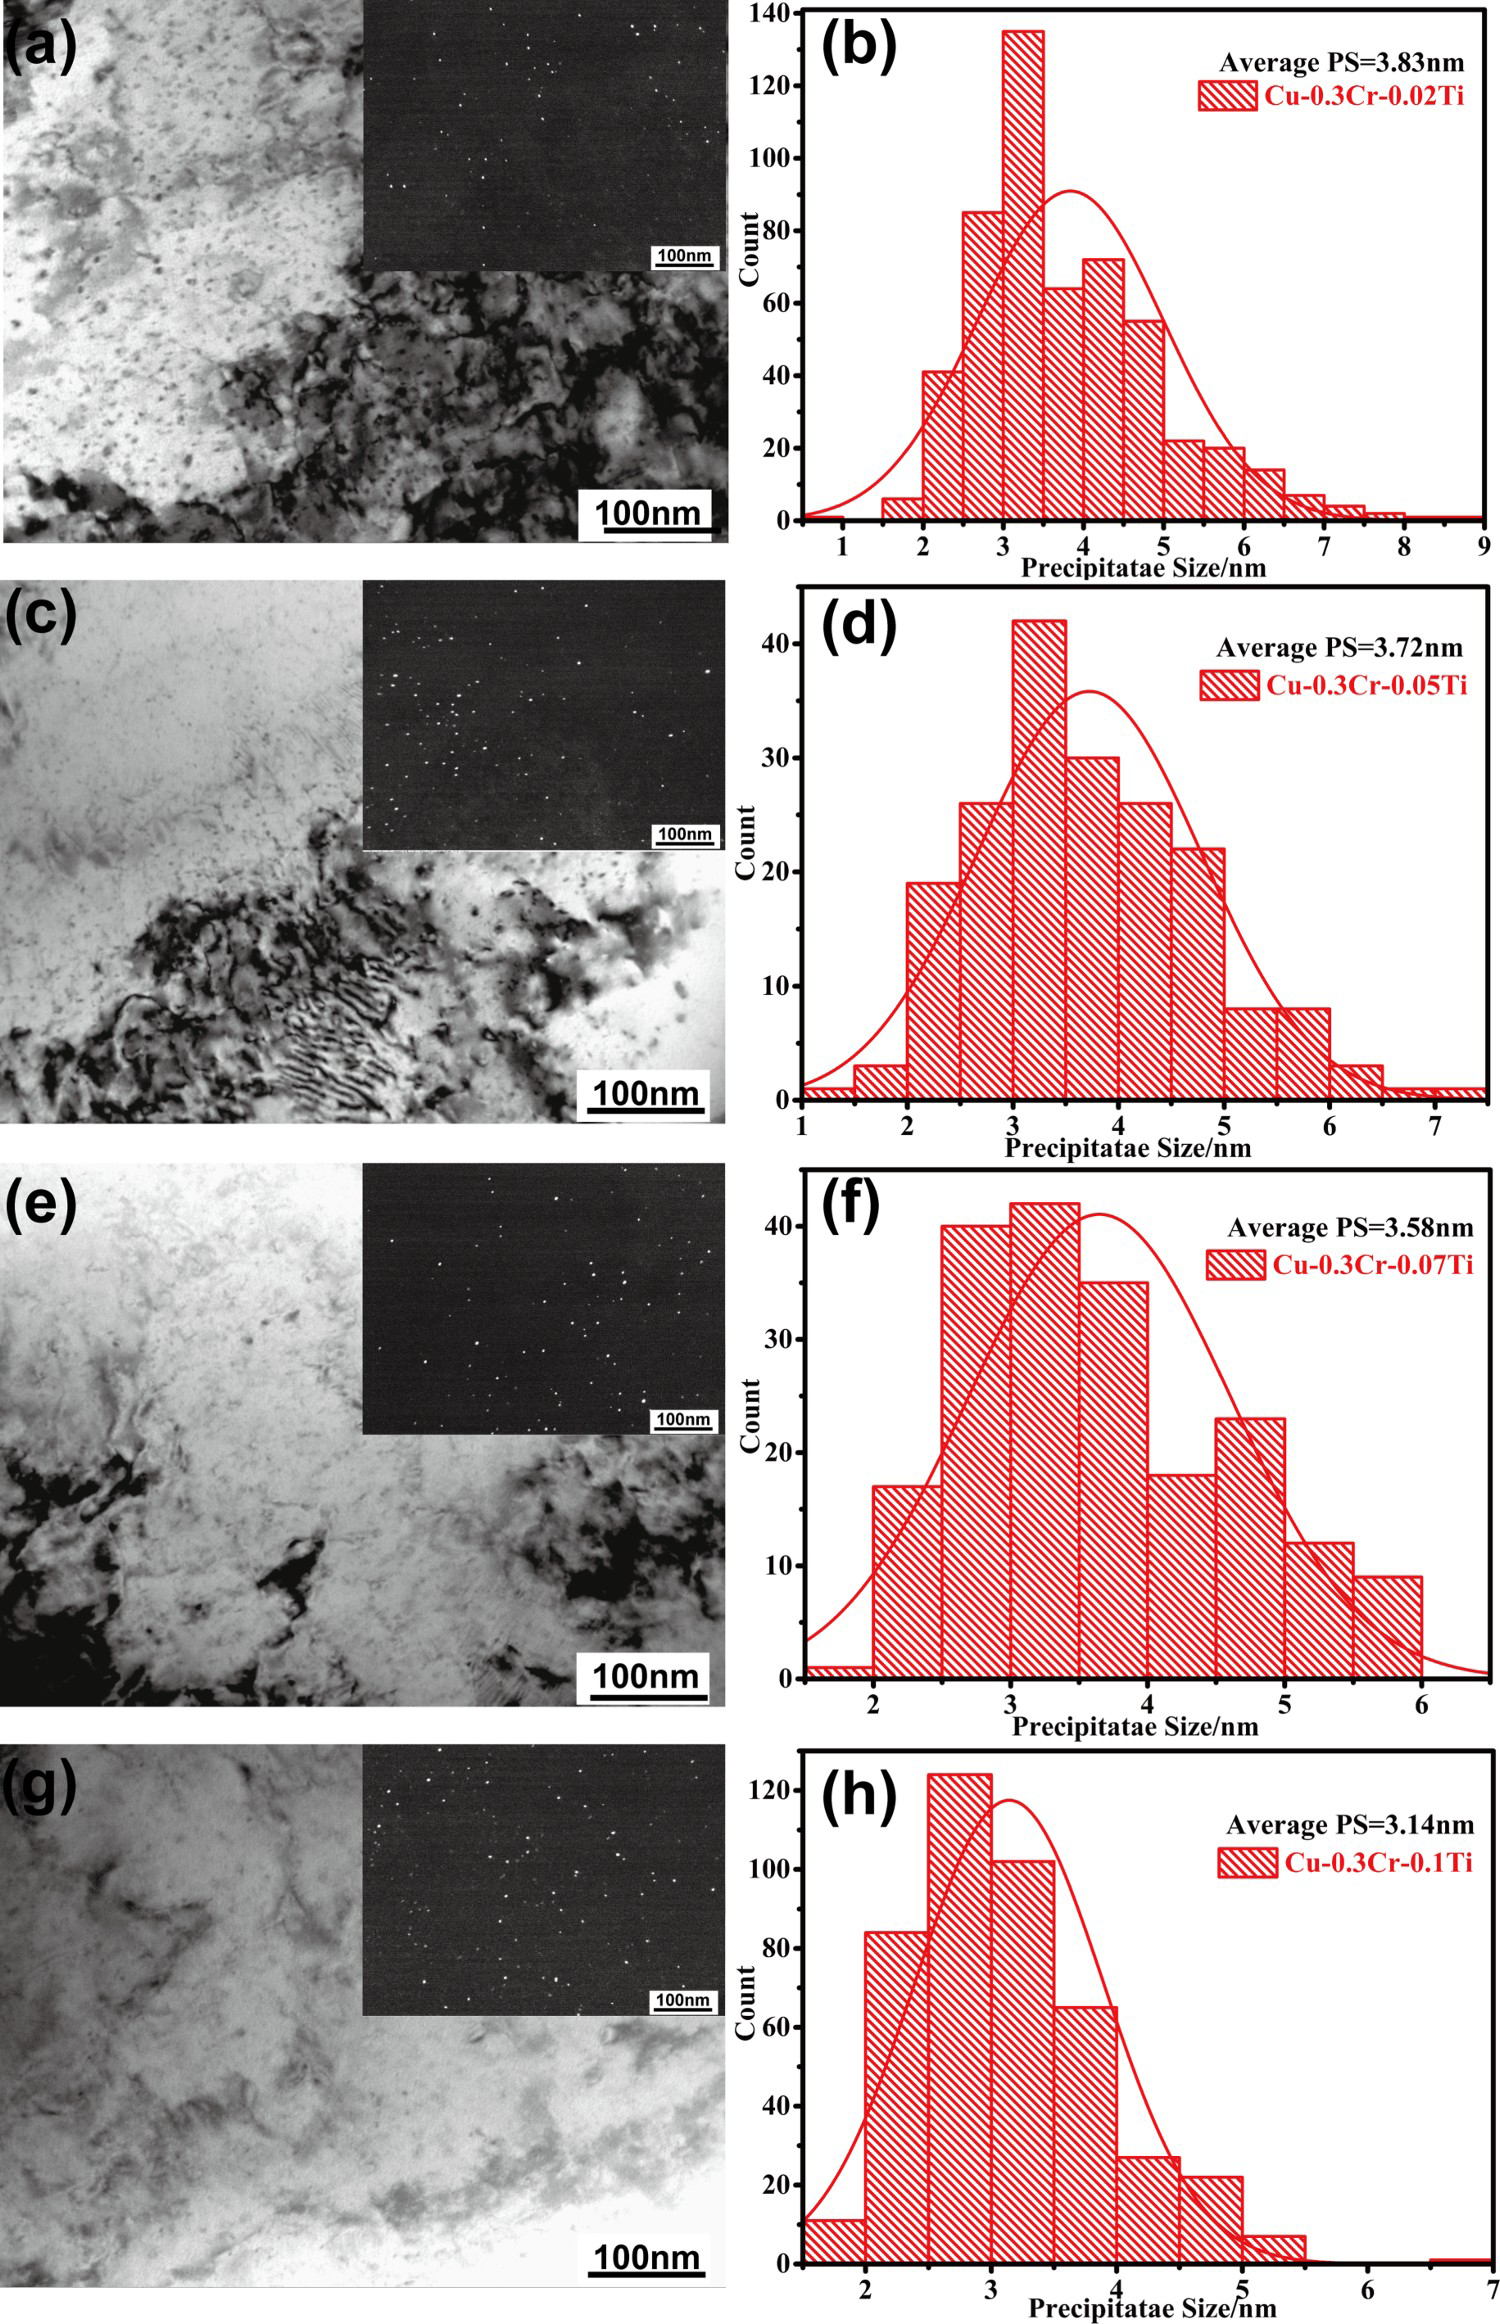
Figure 8 shows the BF image, dark-field (DF) image, and selected area electron diffraction (SAED) pattern aged at 500°C for 60 min of the Cu-0.3Cr-0.05Ti. Two different shapes of precipitates appear in the BF and DF image: spherical-like (marked by cycle) and coffee-bean-like (marked by square) precipitate, as shown in Figure 8(a,b). It can be seen from the SAED characteristics of Figure 8(c) that in addition to the diffraction spots of the matrix, the second phase diffraction spots are also found. These additional diffraction points indicate that both spherical-like and coffee-bean-like precipitates are Cr phases. The spherical-like Cr phase that has an orientation relationship with the copper matrix is [0-11]Cu//[001]Cr, (1-1-1)Cu//(-110)Cr [11]. The coffee-bean-like Cr phase that has an orientation relationship with the copper matrix is [0-11]Cu//[1-11]Cr The BF image, DF image, and SAED patterns aged at 500°C for 60 min of the Cu-0.3Cr-0.05Ti.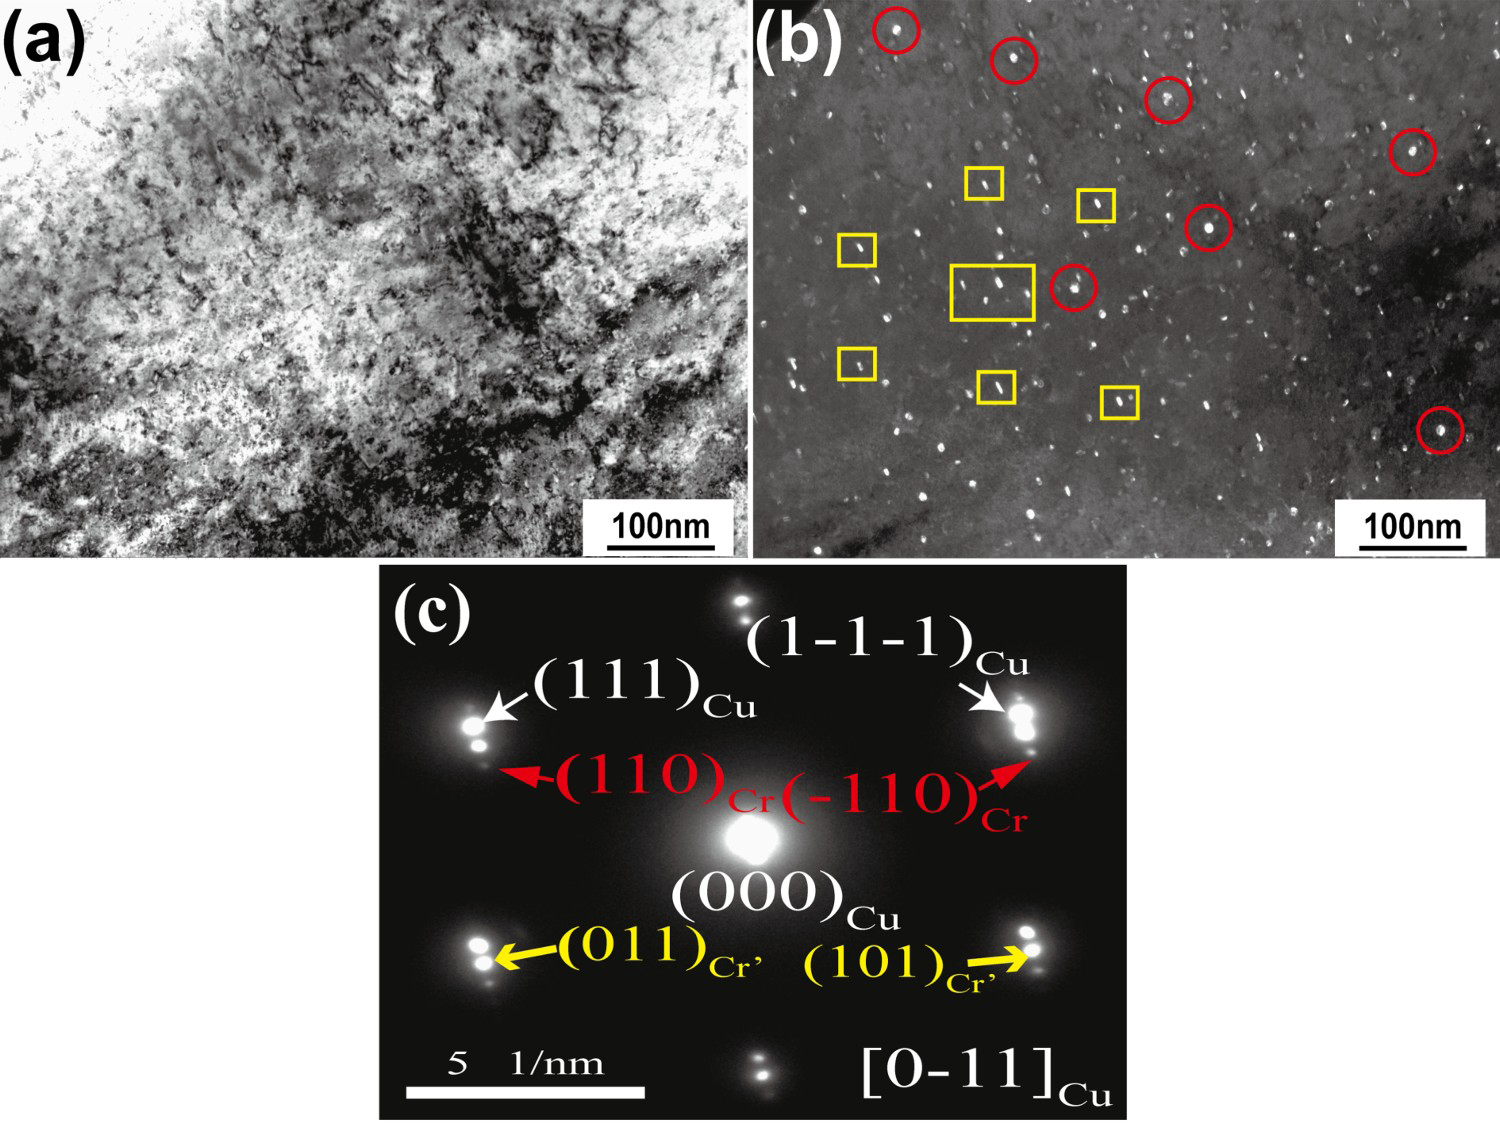
Figure 9 shows the TEM image of Cu-0.3Cr-0.05Ti alloy after aging at 500°C for 60 min. Figure 9(b,c) are the energy dispersive spectrometer (EDS) and SAED patterns of area A in Figure 9(a), respectively. We calibrate the diffraction pattern in Figure 9(c), and it is found to be Ti0.77S phase. It was shown that the Ti element reacts with the impurity S in the metal during the smelting process, which reduces the solid solubility of Ti in the matrix, thus reduces the scattering of electrons and improves the electrical conductivity of the alloy.
(a) TEM images of the Cu-0.3Cr-0.05Ti alloy after aging at 500°C for 60 min; (b) EDS analysis of the area A in (a); and (c) SAED pattern of the area A in (a).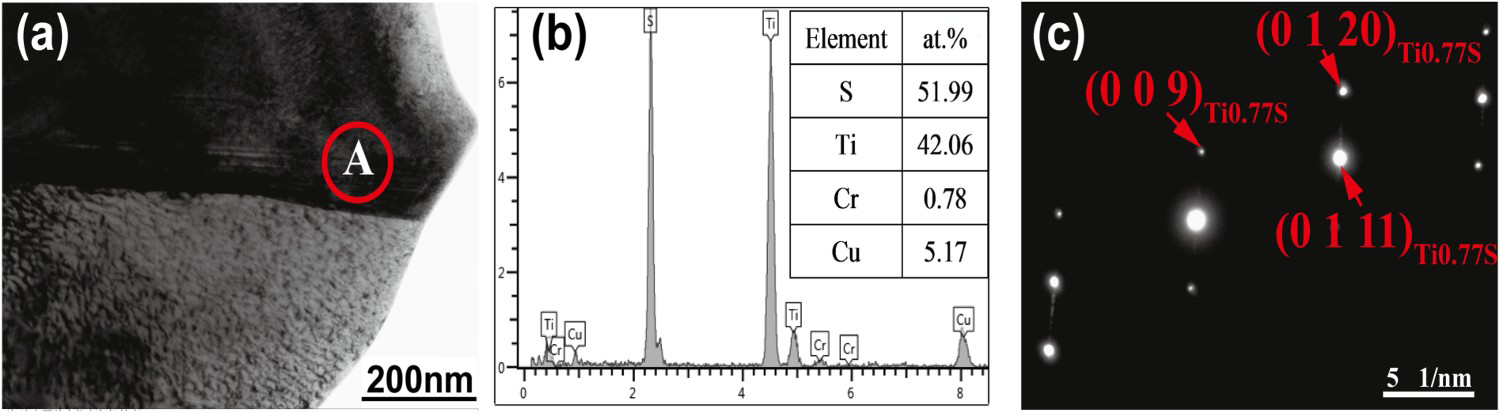
Discussion
Effects of Ti on the mechanical properties of Cu–Cr alloy
The excellent mechanical properties of Cu–Cr system alloys can be attributed to multiple mechanisms, namely, solid solution strengthening, grain boundary strengthening, precipitation hardening, and dislocation strengthening [12]. However, the contribution of grain boundary strengthening in the peak-aging condition can be ignored because the grains are elongated [11]. Therefore, its mechanical properties mainly consist of precipitation hardening, solid solution strengthening, and dislocation strengthening.
Precipitation strengthening
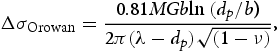
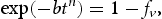
The increase in yield strength contributed by the precipitates can be expressed by the following Orowan–Ashby equation [13]:
 represents the Taylor factor (
 is 3.1),
  represents the shear modulus of the copper matrix (45.5 GPa for Cu-based alloys),
  represents the Burgers vector of the copper matrix (0.2556 nm for Cu-based alloys),
  represents the mean diameter of the precipitates,
  represents the Poisson's ratio of 0.34 for Cu-based alloys, and
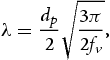
  represents the spacing between precipitates, which is relevant to the radius
  and the volume fraction
  of the second phase particles, and expressed as follows [14]:
 represents the volume fraction of the precipitates. The yield strength is caused by Cr precipitates.
Solute atoms in the copper matrix will be dissolved and transformed into a precipitated phase during alloy aging. The volume fraction of phase transformation can be expressed as follows [15]:

 stands for the volume of new precipitates formed in a unit volume of the matrix for a certain time.
  is the equilibrium volume of new precipitates in a unit volume of the matrix at the end of precipitation. Before aging,
 ,
,  , the initial conductivity in this state is
 . After aging for some time, the transformation of the new phase of the alloy was completed, so
  and
and  , The maximum conductivity is
  . According to Matthiesen's rule, the conductivity and volume fraction of precipitates has a linear relationship, which can be expressed as follows:

 is the volume fraction of the transformed phase;
  and
and  are constants, and
  is the aging time. Taking natural logarithms of both sides of the following equation:
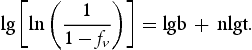
Draw a diagram according to the relationship between  and
and  , and then perform curve fitting, where n is the slope of the line and
  is the intercept. Therefore, the phase transformation kinetic equation of Cu–Cr–Ti alloy with different Ti content after 80% cold rolling and 500°C aging is 1−exp(−0.761t0.347),1−exp(−0.9583t0.2893), 1−exp(−0.3122t0.5281), 1−exp(−0.3735t0.4915), respectively.
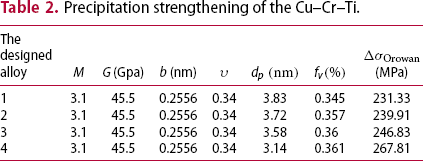
Precipitation strengthening of the Cu–Cr–Ti.


 (MPa)
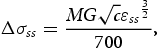
(MPa)Solid solution strengthening
Solid solution strengthening occurs when other elements are alloyed with a metal matrix. The yield strength of the solid solution is enhanced by the action of solid solution atoms, which is expressed as the following equation [17]:
 is the mismatch strain and
  is the atomic percent of the alloying atoms. The
  value of different Ti contents is 0.0291%, 0.061%, 0.09%, 0.13%, respectively. In the Cu–Cr–Ti alloy, Cr atoms are nearly insoluble in the copper matrix at room temperature. The solid solution strengthening effect arising from them can be ignored. All the Ti atoms dissolve in the copper matrix, the value of
  is 0.4 [17]. The calculated results of solution strengthening with different Ti contents are 0.87, 1.26, 1.53, and 1.84 MPa, respectively.
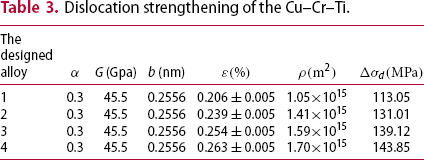
Dislocation strengthening
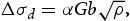
 is an invariant constant for face-centred cubic metals,
  is the dislocation density, and can be calculated by the following equation [19]:

 is the Burgers vector of the copper matrix, and
  is the micro-strain obtained using the Williamson–Hall method [20]. The parameters and calculation results of the dislocation strengthening are listed in Table 3.
Dislocation strengthening of the Cu–Cr–Ti.


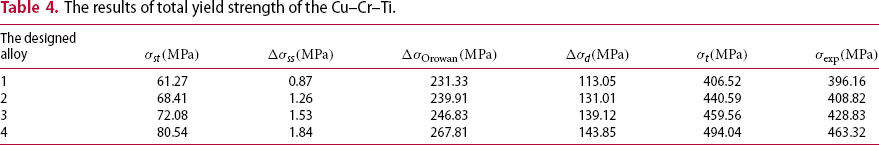
Therefore, the total yield strength of the peak-aged alloys can be calculated by the following equation:
The stress–strain curves of the tested alloys against solution treatment.
 represents the yield strength of the tested alloys against solution treatment, as shown in Figure 10.
The results of total yield strength of the Cu–Cr–Ti.


Effects of Ti on the electrical conductivity of Cu–Cr alloy
The resistance can be calculated according to the Matthiessen rule [21], which is expressed as the following equation:

 represents the resistivity of the copper matrix,
  represents the resistivity of the solute atoms, and
  and
and  represent the resistivity of the precipitates and lattice defects, respectively. Experiments of alloys with different compositions have shown that the conductivity decrease with the increasing Ti content. It shows that the influence of solute atoms on conductivity is dominant. With the increase of Ti content, Ti atoms dissolved in the matrix also increase electron scattering. Therefore, the higher the Ti content, the more significant the decrease in conductivity.
Conclusion
With the increase of Ti content, the mechanical properties of Cu–Cr alloy were improved, but the conductivity decreased obviously. After cold rolling by 80% and aging at 500°C for 60 min, the Cu-0.3Cr-0.05Ti alloy exhibited excellent comprehensive performance with the hardness, electrical conductivity, and tensile strength as 162.6 HV, 82.2% IACS, and 510 MPa, respectively. The yield strength of the studied alloys is mainly ascribed to the Orowan precipitation and dislocation strengthening. There are differences between the calculated values and experimental values, owing to the interaction between four strengthening mechanisms. The increase of Ti content increased the softening temperature of Cu–Cr alloy. TEM results show that the increase of Ti content can inhibit the growth of Cr precipitation, and a large number of fine dispersion distribution of Cr precipitation, so that Cu–Cr-Ti alloy has excellent mechanical properties.
Footnotes
Disclosure statement
No potential conflict of interest was reported by the author(s).