
Abstract
The effect of Y and Si additions on the microstructure and stress corrosion cracking (SCC) of the high Zn-containing 7056 aluminium alloy has been investigated. The morphology and composition of dispersions were analysed by transmission electron microscope equipped with super-X energy disperse spectroscopy. The SCC resistance was measured by a double-cantilever beam experiment. Results indicated that the SCC resistance was significantly improved by the mixed Y and Si additions, which can mainly be attributed to the reduction in the recrystallisation fraction and the increase in the sub-grain boundaries fraction caused by the high coherent (Al,Si)3(Zr,Y) dispersions and another important reason was the formation of the Y–Si-containing oxide film with the higher compactness and electrochemical impedance.
Keywords
Introduction
7xxx (Al–Zn–Mg–Cu) aluminium alloys have been widely used in the aerospace field due to their excellent mechanical properties [1-6]. However, the susceptibility to stress corrosion cracking (SCC) is a key issue limiting the development of new generation high Zn-containing 7xxx aluminium alloys [7-16]. At present, lots of investigations are focused on improving the SCC resistance of 7xxx series aluminium alloys by controlling heat treatment [8,17-26] and reducing recrystallisation by forming new dispersions [27,28]. Micro-alloying elements (Zr, Cr, Sc, Er, Yb, etc.) were used to improve SCC resistance due to enhanced recrystallisation inhibition by forming higher stability of L12-structured Al3M (M = Sc x Zr1−x , Er x Zr1−x , Yb x Zr1−x , etc.) dispersions [27-34]. Compared with conventional alloys, on the one hand, recrystallisation is suppressed, that is, the growth of the grain boundary precipitates (GBPs) is suppressed and low-angle grain boundaries are easier to form. On the other hand, the dislocations formed under the pinning of the Al3M dispersions promote the precipitation of fine precipitates inside the grains. Under the combined action of these two mechanisms, the precipitation in the grain boundaries and the grains becomes more uniform and the stress concentration at the grain boundary is significantly reduced under the same stress conditions, which lead to a significant increase in SCC resistance.
Among them, the aluminium alloy compounded with Sc and Zr has the highest recrystallisation resistance due to the formation of ternary Al3(Sc,Zr) dispersion which is more stable than Al3Sc dispersion and Al3Zr dispersion [29]. However, Sc is very expensive and difficult to apply to industrial production. Therefore, the cheaper rare-earth (RE) element additions were being studied to replace Sc, such as Er [30], Yb [31-34], Y [35-37]. It was reported that the Y element existed in the Al–Mg–Si alloy in the form of Al3Y to refine the grains [35]. Zhang et al. [36] found that the recrystallisation resistance and inter-granular corrosion resistance of the Al–Zn–Mg–Cu–Zr–Gd–Y alloy were improved due to the increase in the pinning effect of the Al3CuGd dispersion on the sub-grain boundary by Y element. Yan et al. [37] thought that the corrosion resistance of high Zn-containing 7xxx series aluminium alloys was greatly improved by RE Y element due to the decrease in Mg and Zn contents of the grain boundary precipitates. However, the existing form of Y element in Al–Zn–Mg–Cu–Zr alloy and its influence on SCC are still unclear. In addition, it was reported that Si also had an effect on the Al3Zr dispersion. Nakamura et al. [38] reported that the Al sites of Al3Zr dispersion in the Al–0.6 mass.%Zr alloy can be substituted by Si to form (Al,Si)3Zr dispersion. Booth-Morrison et al. [39] found that Si can accelerate the nucleation of Al3(Sc,Zr) precipitates in dilute Al–Sc–Zr alloy. Fang et al. [40] reported that Si atoms can refine (Al,Si)3(Yb,Zr) dispersion in dilute Al–Zr–Yb alloy due to Si acting as the medium to reduce the Yb coarsening rate and increase the Zr diffusivity. Vo et al. [41,42] found that Si element existed in dilute Al–Sc–Zr–Er alloy in the form of (Al,Si)3(Sc,Er,Zr) dispersion. But these studies focus on pure aluminium and the existence form of Si element in Al–Zn–Mg–Cu–Zr alloy is unclear. It was also reported that Si element (0.094–0.261 wt.%) had a greater influence on the SCC of 7050 aluminium alloy due to the formation of Mg2Si phase[43], but there is still a lack of research on the effect of trace Si on Al3M dispersions and SCC when the Si content is less than 0.094 wt-%. In addition, the influence of trace elements in alloy, especially RE elements, on the passivation film on the surface of aluminium alloy and its influence on SCC is still rarely studied. Based on the above research status, we studied the complex effects of Y and Si additions on microstructure and SCC resistance of the high Zn-containing (9.1 wt-%) Al–Zn–Mg–Cu–Zr alloy.
Experimental materials and methods
Samples preparation and heat treatment
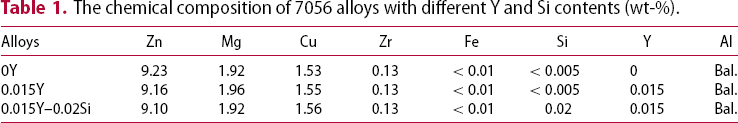
The chemical composition of 7056 alloys with different Y and Si contents (wt-%).
Properties testing
The direction of tensile testing samples was parallel to the extrusion longitudinal direction (L). The tensile testing was conducted by Instron-8082 electronic tensile machine with 2-mm min−1 speed at room temperature. The values of tensile properties were the average of three samples. The fracture morphologies of the samples were examined by scanning electron microscope (SEM, Nova Nano SEM230).
The Vickers hardness of the aged samples was tested by the HV-10B hardness tester with a load of 20 kN and the hardness of samples was obtained by the average values from five measurements.
The inter-granular corrosion (IGC) test was carried out in 1.0-M NaCl + 0.1-M H2O2 in an aqueous solution at 35 ± 2 °C for 6 h according to GB/T 7998-2005 [44]. The exposed surface was normal to the short transverse (S) direction. The morphology and corrosion depth from the cross-sections of samples were observed and measured using optical microscopy (OLYMPUS DSX500).
The stress intensity factor (KI) and SCC propagation velocity (v) were tested according to GB12445.1-90 [45]. The crack length of double-cantilever beam (DCB) samples was prefabricated by screw loading with 2.5–4 mm. The SCC cracks were propagated along the S–L direction. The critical stress intensity factor (KISCC) was obtained at the crack propagation velocity ≤10−9 m s−1. The region-II SCC propagation velocity (vII) was evaluated at the plateau stage. The v–K curves of the samples measured at least three samples.
The electrochemical properties of the samples were tested by the electrochemical workstation (CHI600E) after the polished samples were immersed in 3.5-wt-% solutions for 20 min.
Microstructural investigations
The intermetallics morphologies of the samples were examined by SEM (Nova Nano SEM230) with energy disperse spectroscopy system. The precipitate morphologies (HAADF-STEM, HRTEM, transmission electron microscope (TEM)) were detected by scanning transmission electron microscopy (STEM, Titan G2 60-300) equipped with super-X energy disperse spectroscopy (EDXS) system. Thin foils for TEM were prepared by twin-jet electron-polishing in a 25% HNO3 and 75% CH3OH solution below −25 °C. The main elements in the passivation film on the surface of samples placed in the air for 7 days were analysed by X-ray photoelectron spectrometer (XPS).
Results
Mechanical properties
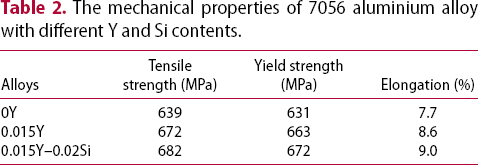
The mechanical properties of 7056 aluminium alloy with different Y and Si contents.
IGC and SCC
The IGC morphologies of 7056 aluminium alloy with different Y and Si contents are shown in Figure 1. It showed that the 0Y alloy and 0.015Y–0.02Si alloy have the largest and smallest IGC depths, 496 and 34 µm, respectively, and the IGC depth of 0.015Y alloy was 143 µm. Therefore, the order of IGC resistance of the three alloys from small to large was: 0Y < 0.015Y < 0.015Y–0.02Si.
The IGC morphologies of 7056 aluminium alloy with different Y and Si contents: (a) 0Y; (b) 0.015Y; (c) 0.015Y–0.02Si.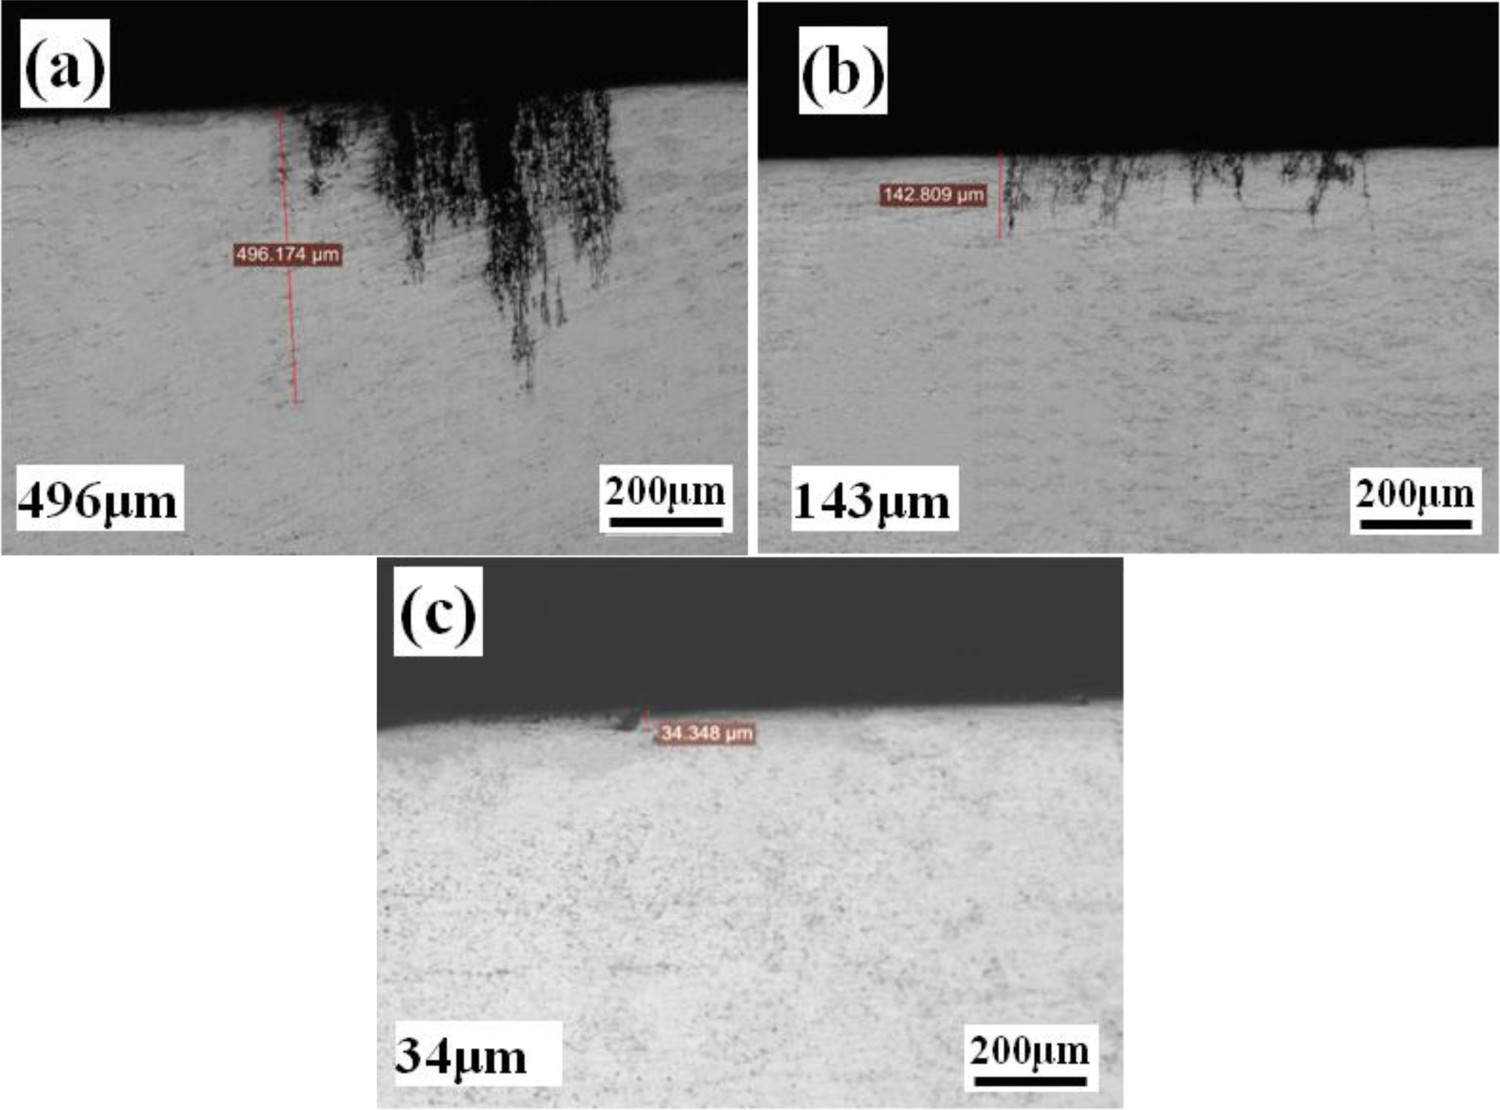
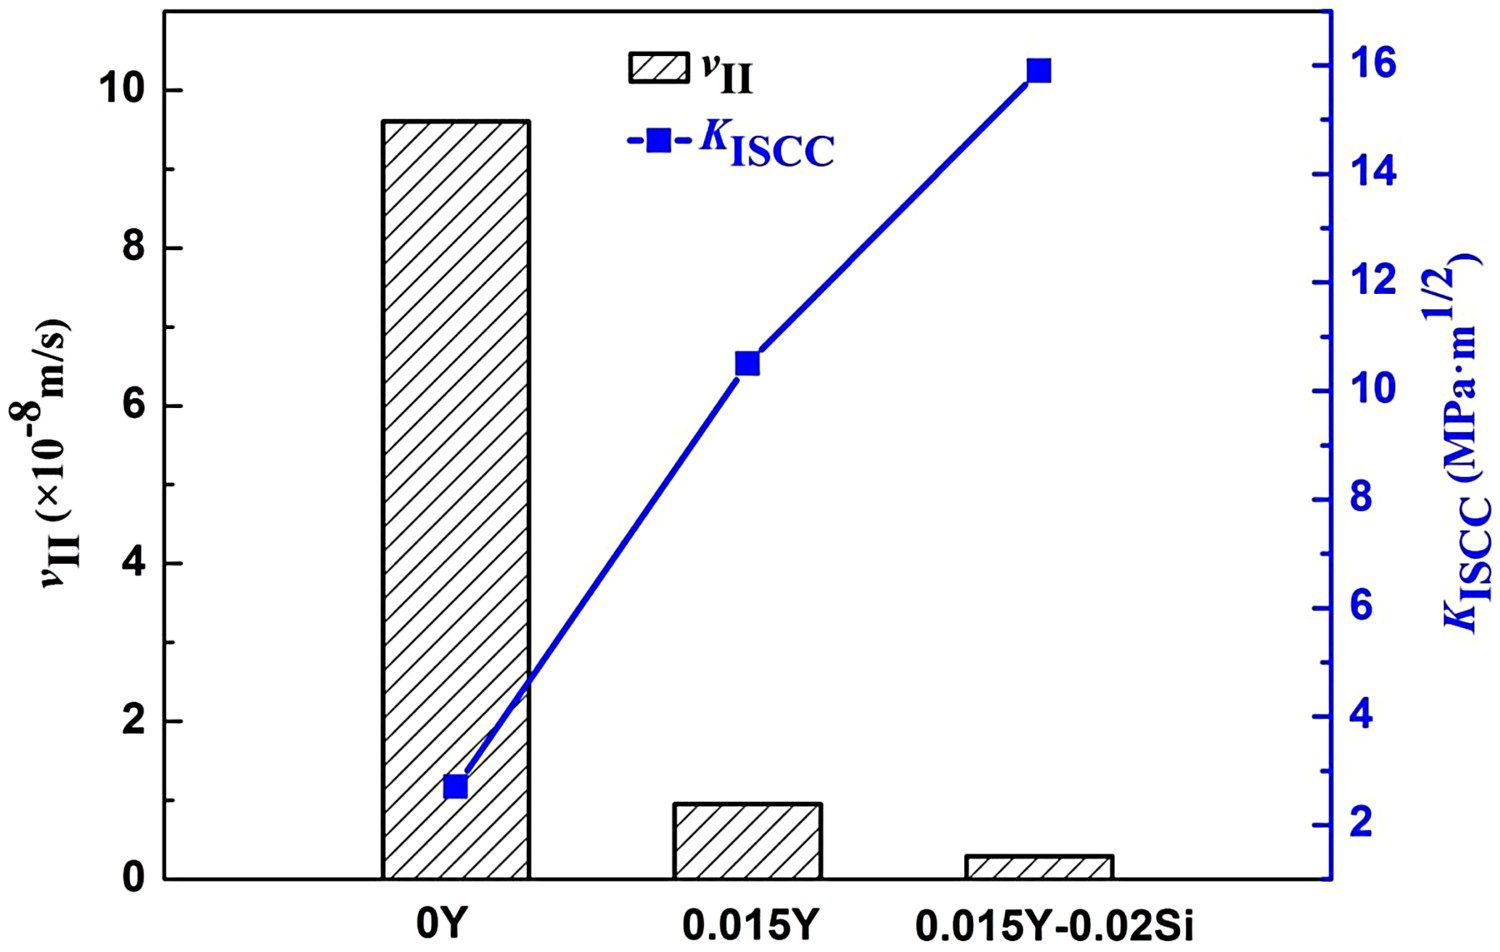
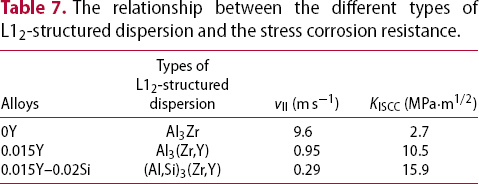
Figure 2 presents the SCC v–K curves of 7056 aluminium alloy with different Y and Si contents. The vII and KISCC of 7056 aluminium alloy with different Y and Si contents obtained from Figure 2 are shown in Figure 3. As can be seen from the figures, the vII was 9.60 × 10⁻⁸ m s−1 in 0Y alloy, 9.5 × 10⁻⁹ m s−1 in 0.015Y alloy and 2.9 × 10⁻⁹ m s−1 in 0.015Y–0.02Si alloy, respectively and the KISCC was 2.7 MPa·m1/2 in 0Y alloy, 10.5 MPa·m1/2 in 0.015Y alloy and 15.9 MPa·m1/2 in 0.015Y–0.02Si alloy, respectively. It was indicated that the mixed addition of Y and Si elements can greatly improve the SCC resistance of 7056 aluminium alloy according to the lowest vII and the largest KISCC in the 0.015Y–0.02Si alloy.
The SCC v–K curves of 7056 aluminium alloy with different Y and Si contents. The vII and KISCC of 7056 aluminium alloy with different Y and Si contents.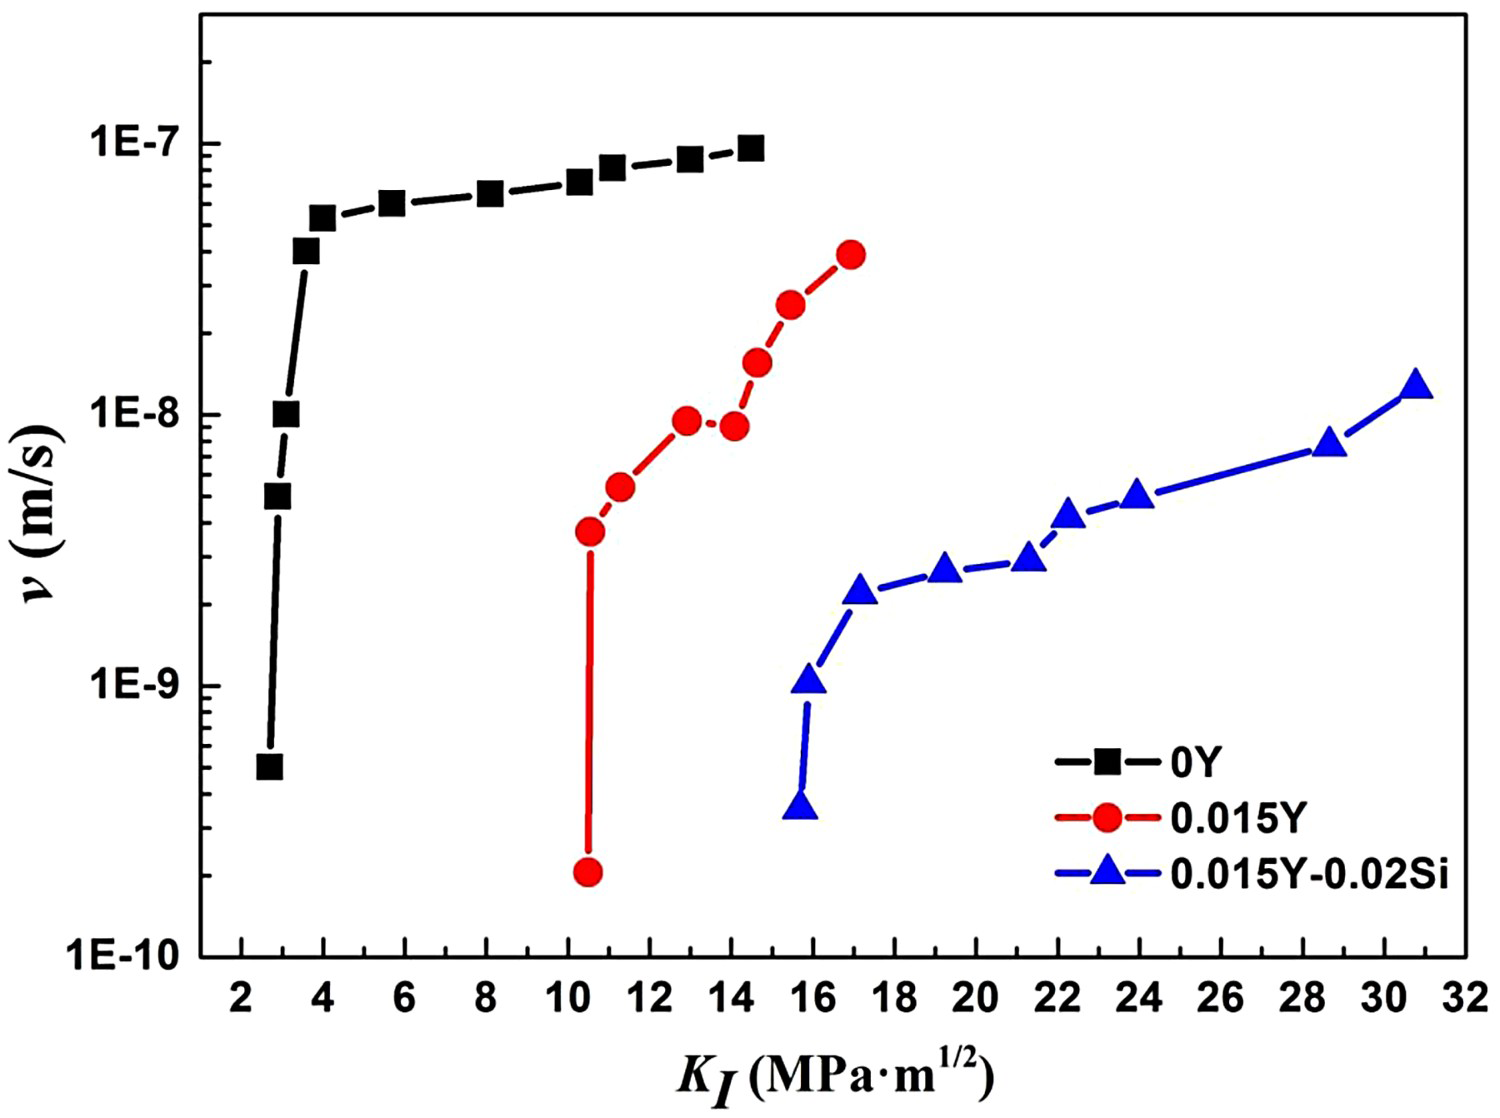
Electrochemical properties
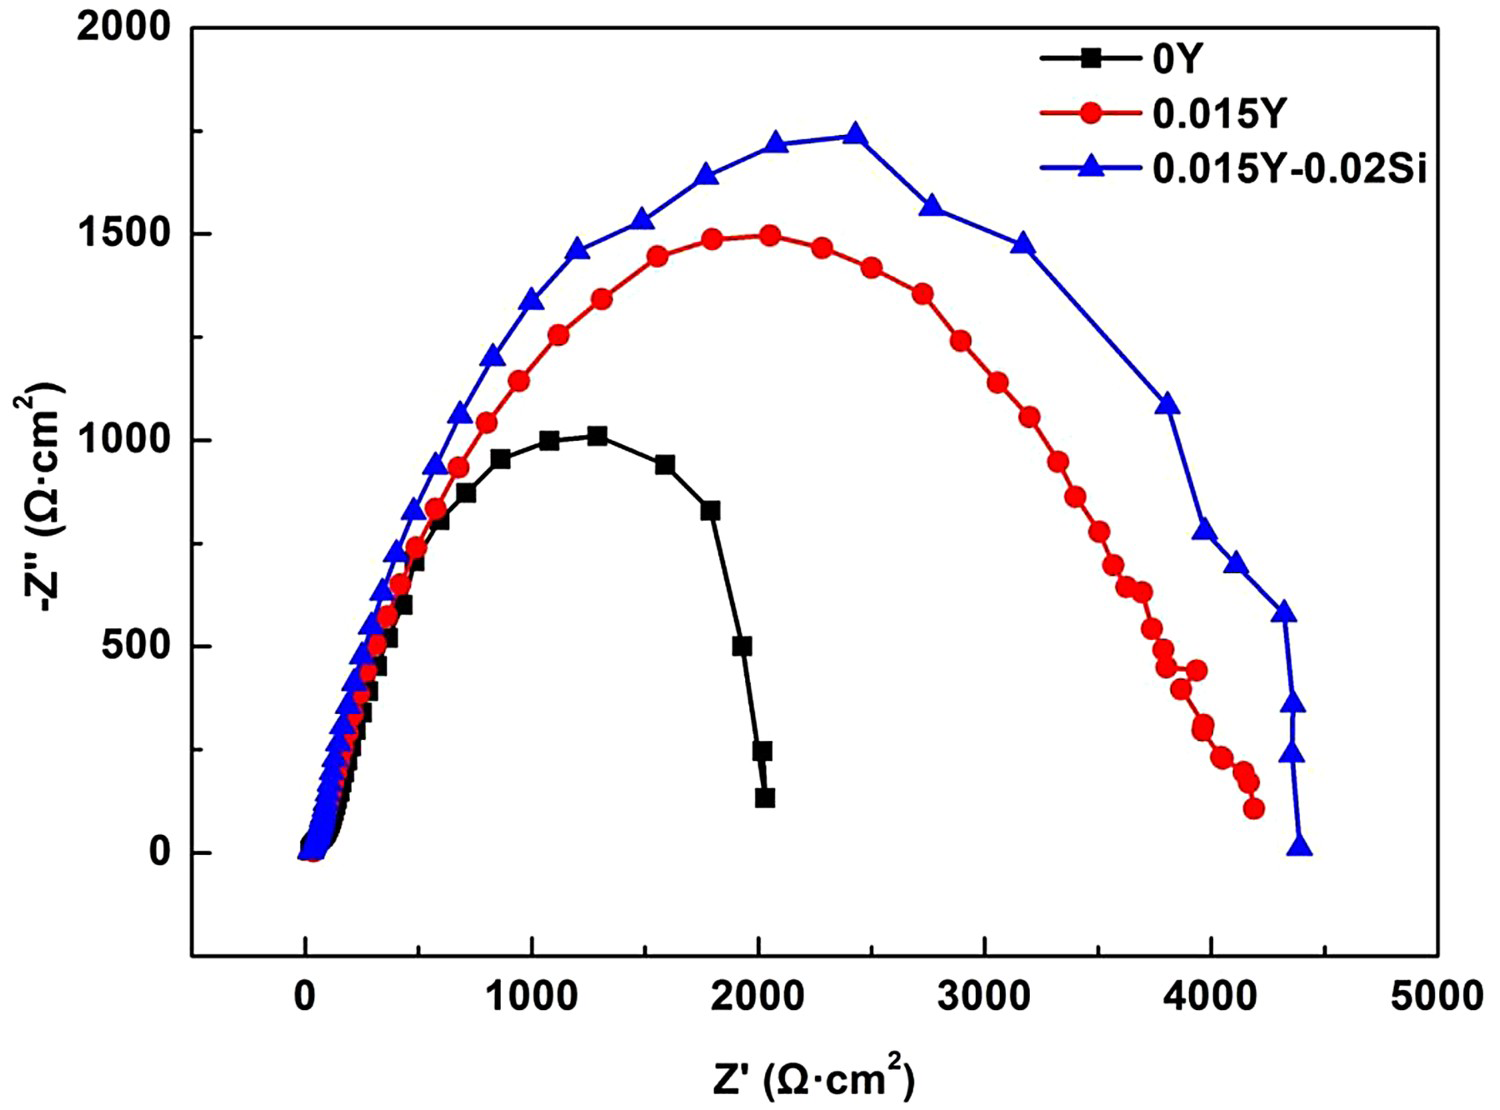
Figures 4–6 show the open-circuit potential curves, Nyquist curves and Tafel curves of 7056 aluminium alloy with different Y and Si contents in 3.5 wt.% NaCl solution, respectively. Tafel curves parameters in Figure 6 were summarised in Table 3, including self-corrosion potential (Ecorr), passivation potential (Erep), pitting potential (Epit), self-corrosion current density (Jcorr), linear polarisation resistance (Rcorr) at the self-corrosion potential, passivation current density (Jrep), linear polarisation resistance (Rrep) at the passivation potential, etc. It can be seen from Figure 4 that the open-circuit potentials of the 0Y alloy, 0.015Y alloy and 0.015Y–0.02Si alloy were −0.87 V, −0.735 V and −0.73 V, respectively. This indicated that the corrosion tendency of 7056 alloy decreased after adding Y element alone or mixing Y and Si elements due to the open-circuit potential moving to the positive potential direction and the corrosion tendency of 0.015Y–0.02Si alloy was the lowest. It can be seen from Figure 5 that the impedance of 7056 aluminium alloy after adding Y element increased and a small amount of Si can further increase the impedance of RE-containing 7056 aluminium alloy.
The open-circuit potential curves of 7056 aluminium alloy with different Y and Si contents in 3.5 wt.% NaCl solution. The Nyquist curves of 7056 aluminium alloy with different Y and Si contents in 3.5 wt.% NaCl solution. The Tafel curves of 7056 aluminium alloy with different Y and Si contents in 3.5 wt.% NaCl solution. Tafel curves parameters of 7056 aluminium alloy with different Y and Si contents.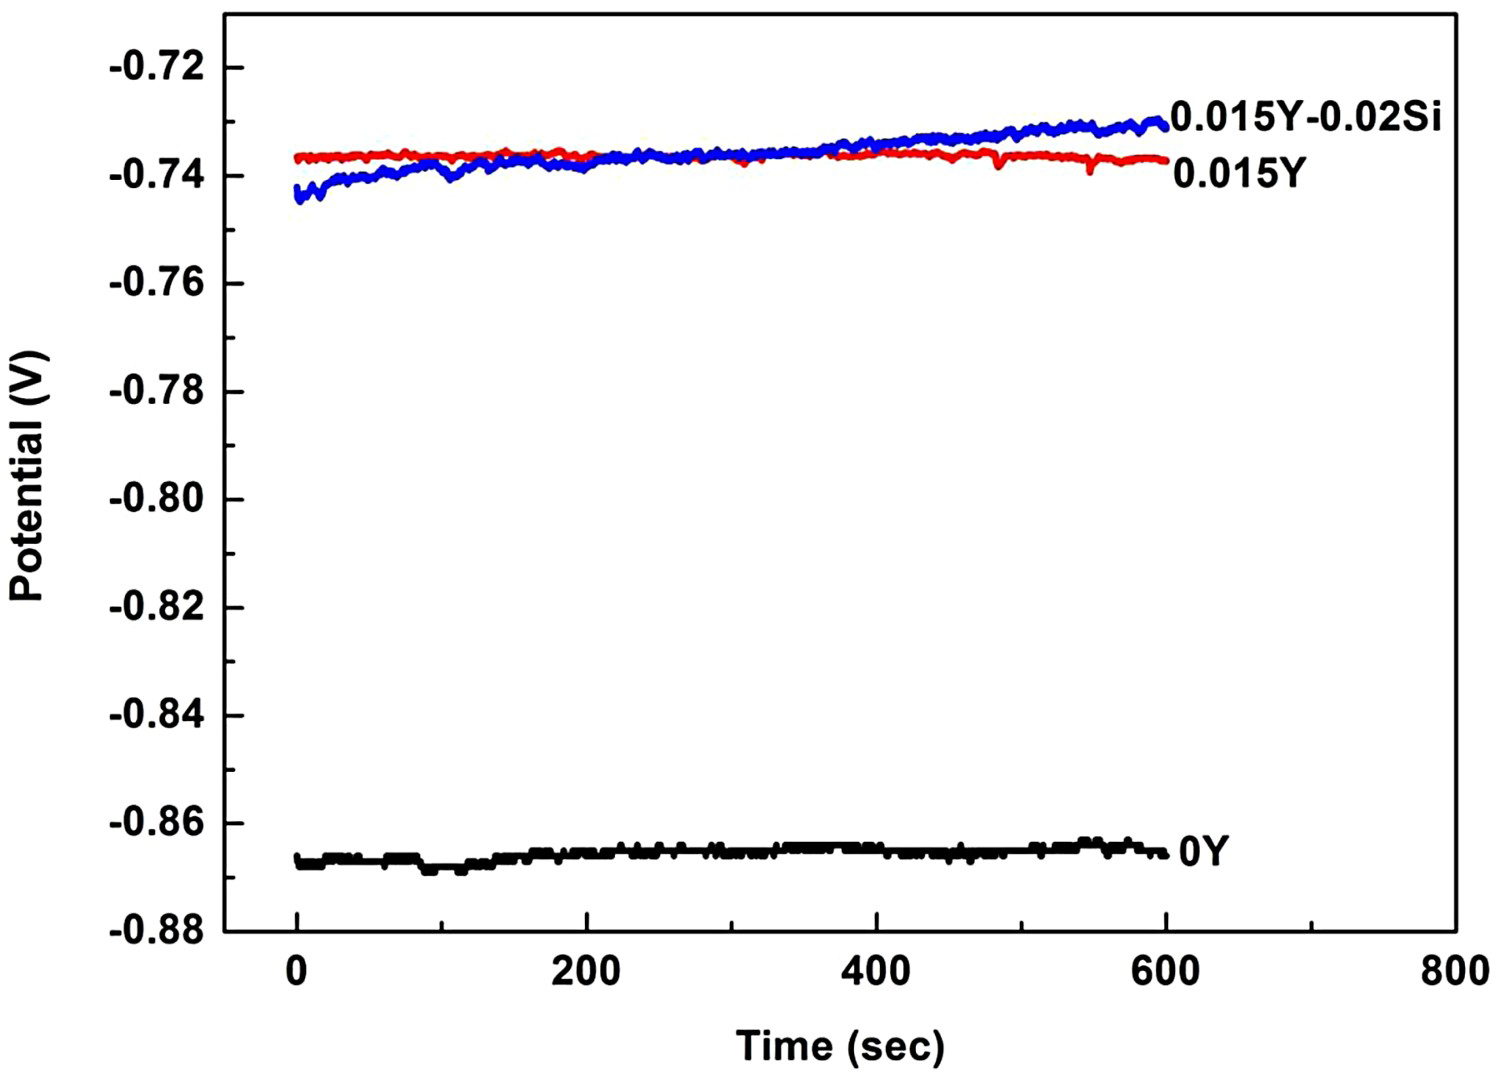
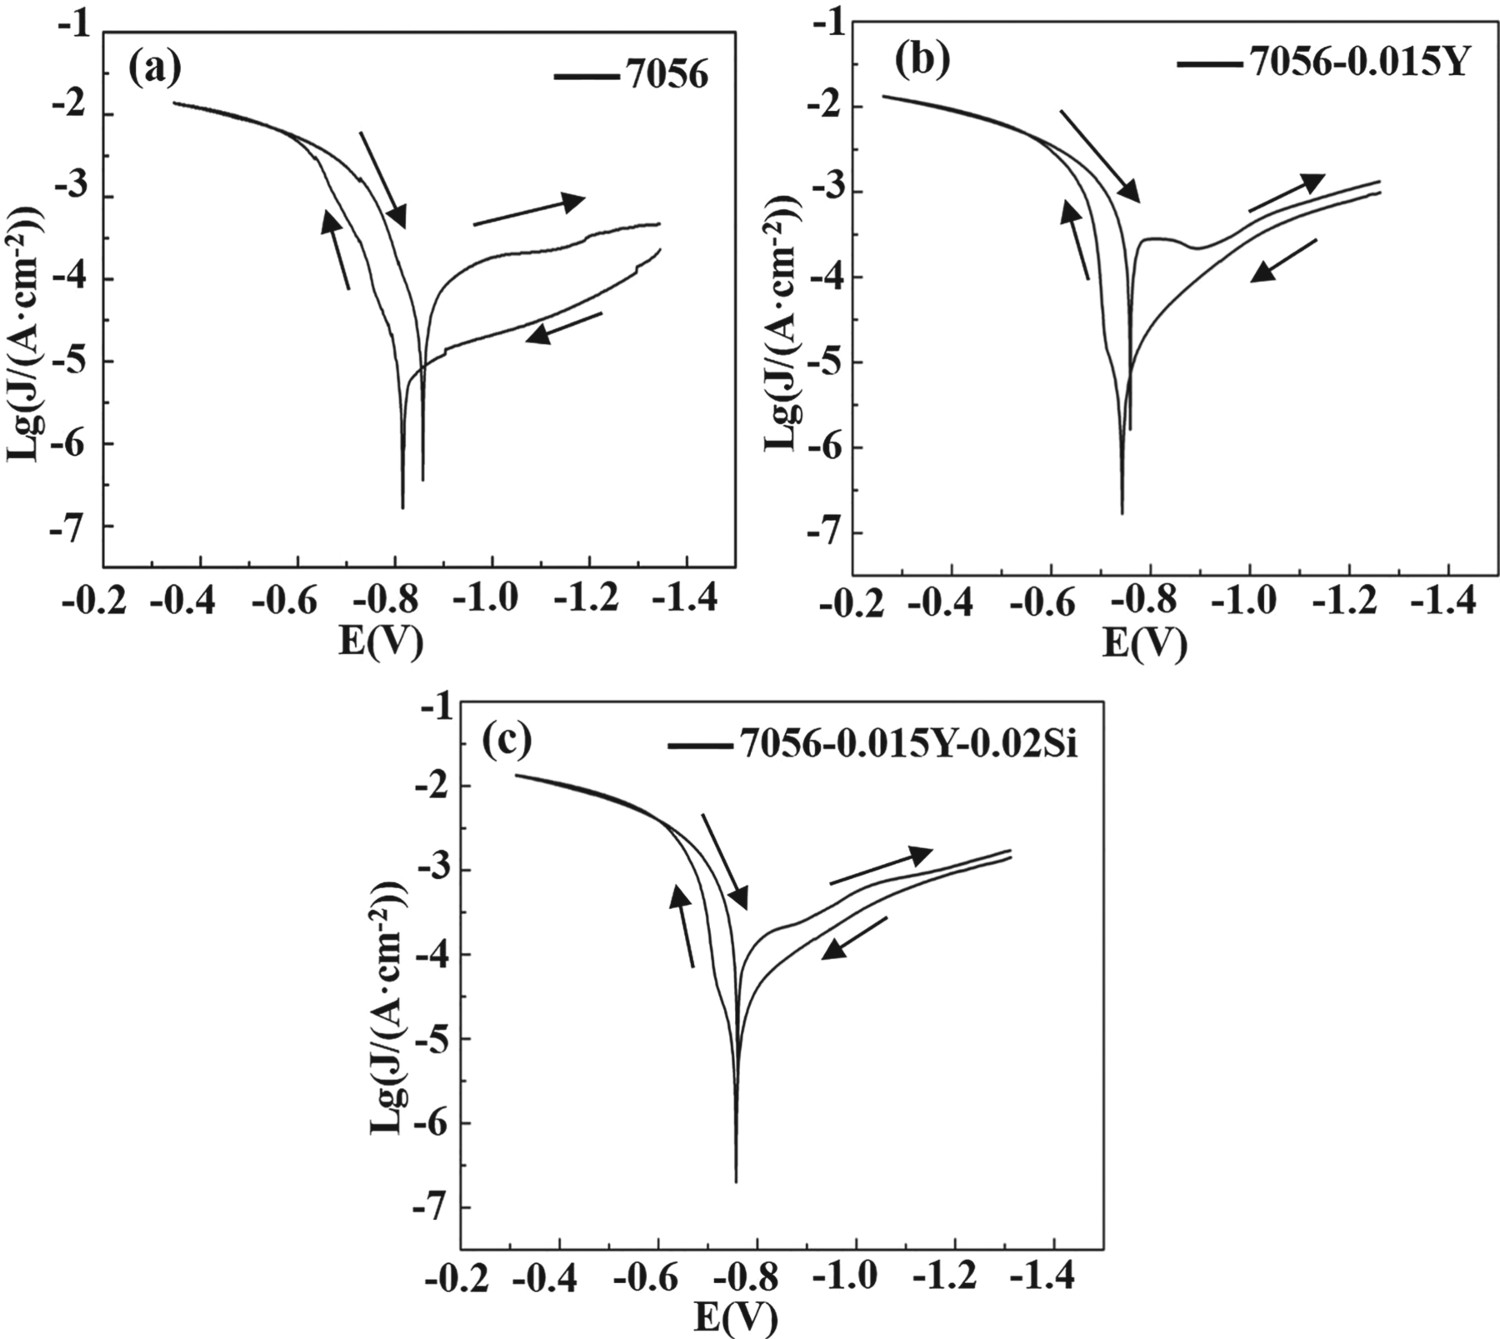
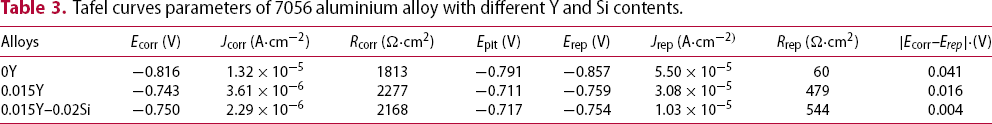
The difference (|Ecorr–Erep|) between the self-corrosion potential (Ecorr) and the passivation potential (Erep) was an important criterion for evaluating the degree of local corrosion development. In the early stage of local corrosion development, the larger the value, the greater the degree of local corrosion development. It can be seen from Figure 6 and Table 3 that the Jcorr, Jrep and |Ecorr–Erep| of 7056 aluminium alloy added with 0.015Y were significantly reduced and the Rcorr and Epit were significantly increased so that the corrosion resistance was significantly improved. In addition, the Jcorr, Jrep and |Ecorr–Erep| of the 0.015Y–0.02Si alloy further decreased and the Rcorr and Epit further increased, which indicated that the corrosion resistance of the 0.015Y–0.02Si alloy further improved.
Microstructure
The recrystallised microstructure and fibrous microstructure in 7056 aluminium alloy with different Y and Si contents are shown in Figure 7. It can be seen from Figure 7 that the size of coarse recrystallised grains in the 0Y alloy was ∼400 µm and in the 0.015Y and 0.015Y–0.02Si alloys, they were all local recrystallised grains with a size of less than 50 µm. We calculated that the area fraction of recrystallised grains in 0Y, 0.015Y and 0.015Y–0.02Si alloys was 42.8%, 17.9% and 10.7%, respectively. In addition, the order of the length-to-width ratio of the fibrous microstructure from small to large was: 0Y < 0.015Y < 0.015Y–0.02Si (Figure 7(a1–c1)) and the shape of the fibrous microstructure became straighter after adding trace Y and Si elements. This indicated that the addition of Y element can inhibit recrystallisation of 7056 aluminium alloy and the addition of trace Si element can further inhibit recrystallisation of RE-containing 7056 aluminium alloy.
Recrystallised microstructure and fibrous microstructure in 7056 aluminium alloy with different Y and Si contents: (a,a1) 0Y; (b,b1) 0.015Y; (c,c1) 0.015Y–0.02Si.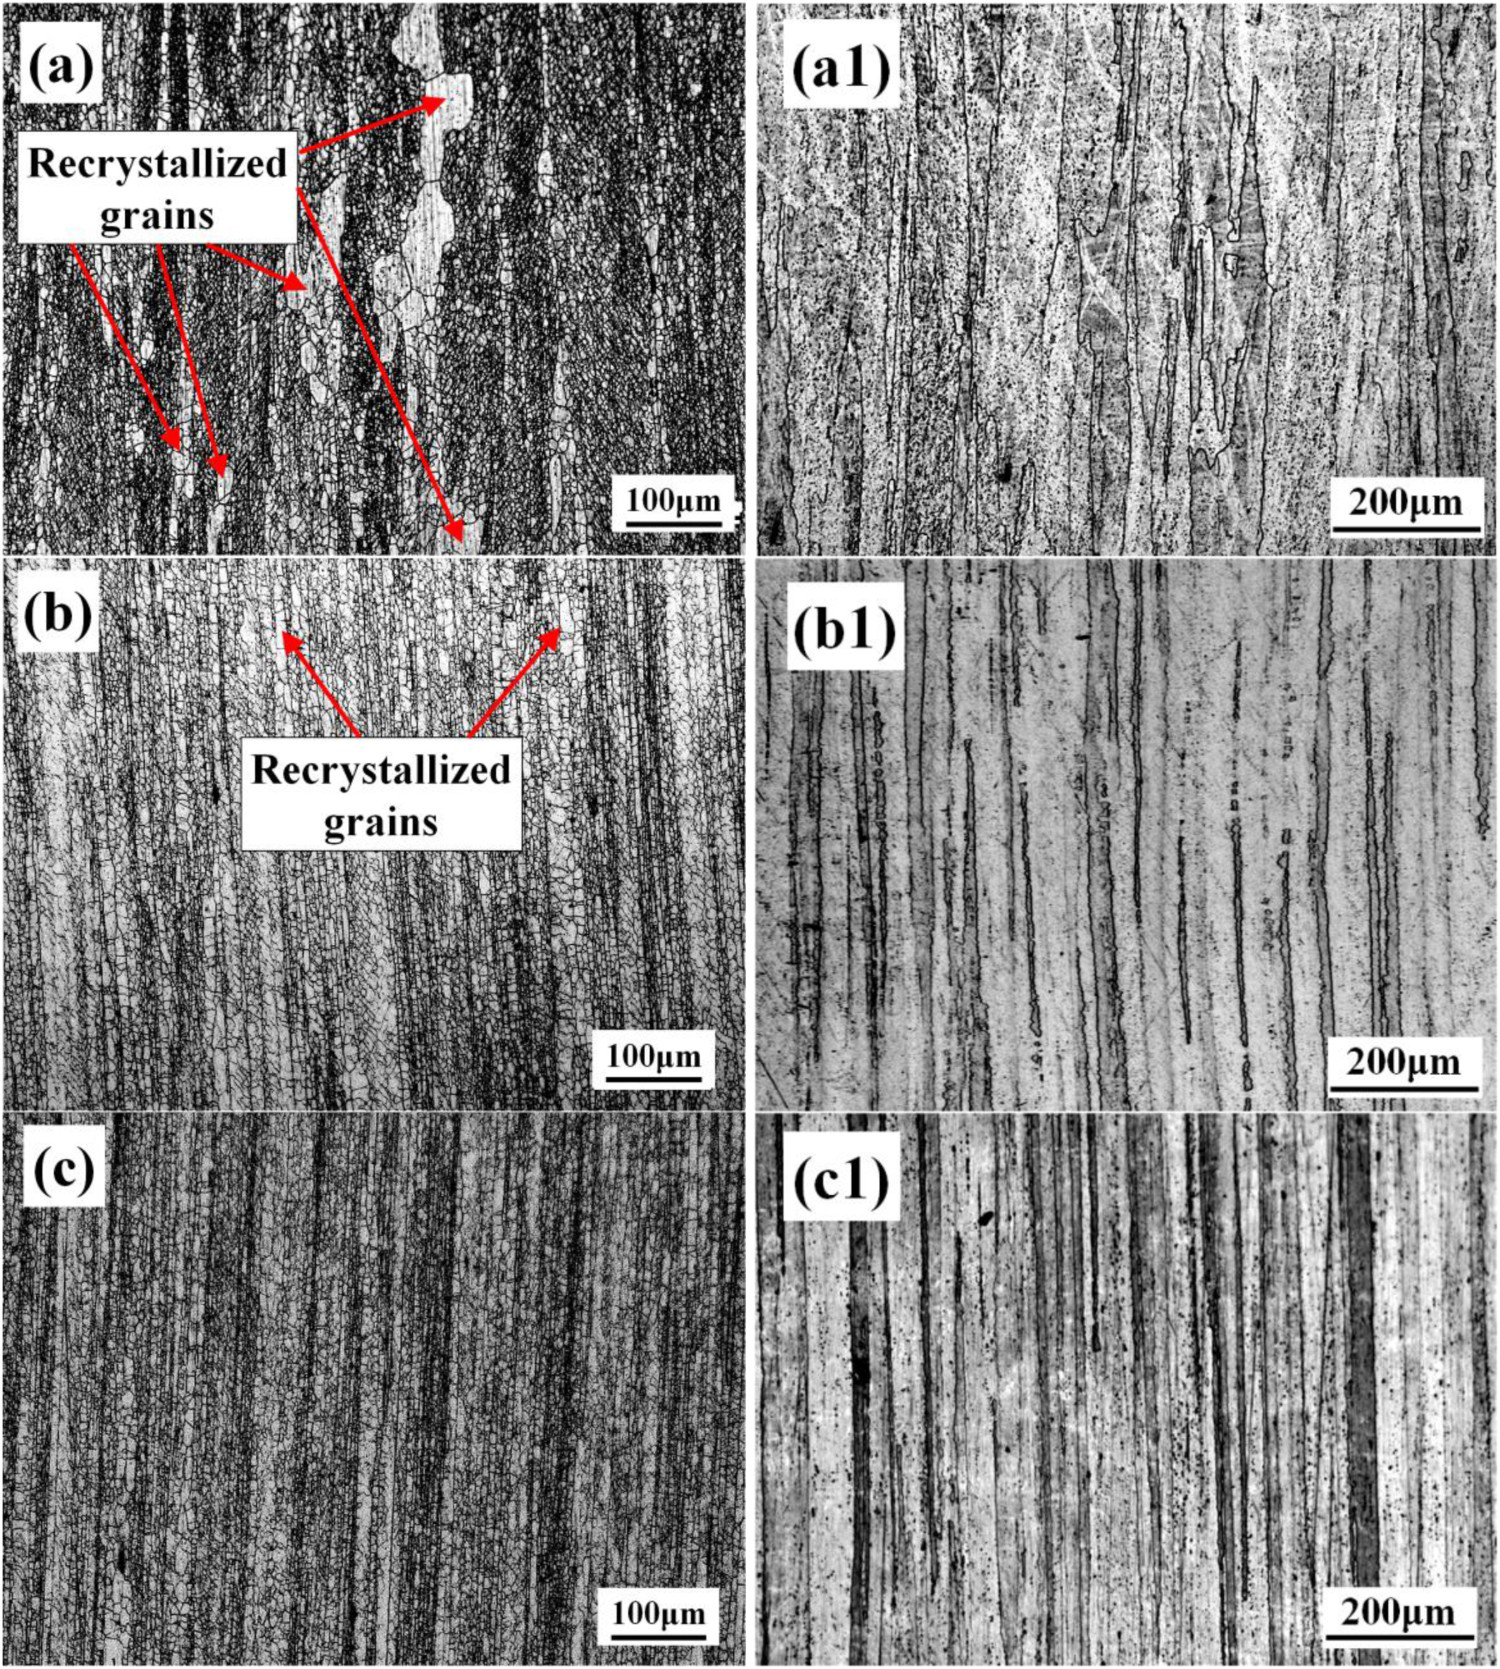
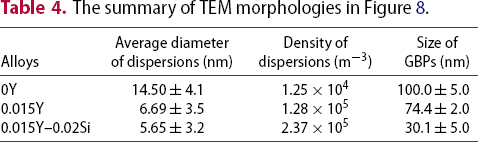
The TEM morphologies and selected area diffraction patterns (SADPs) of 7056 aluminium alloy with different Y and Si contents are shown in Figure 8. The TEM morphologies parameters of 7056 aluminium alloy with different Y and Si contents are summarised in Table 4. It can be seen from Figure 8 and Table 4 that the density of Al3M dispersions in 0Y, 0.015Y and 0.015Y–0.02Si alloys gradually increased and the diameter gradually decreased. In addition, the size of GBPs in 0Y, 0.015Y and 0.015Y–0.02Si alloys gradually decreased. As can be seen from SADPs, in 0Y, 0.015Y and 0.015Y–0.02Si alloys, the spot brightness of Al3M dispersions and η’ phases gradually increased, indicating that their number gradually increased.
TEM morphologies and selected area diffraction pattern(SADP) of 7056 aluminium alloy with different Y and Si contents: (a,b,c) 0Y; (d,e,f) 0.015Y; (g,h,i) 0.015Y–0.02Si. The summary of TEM morphologies in Figure 8.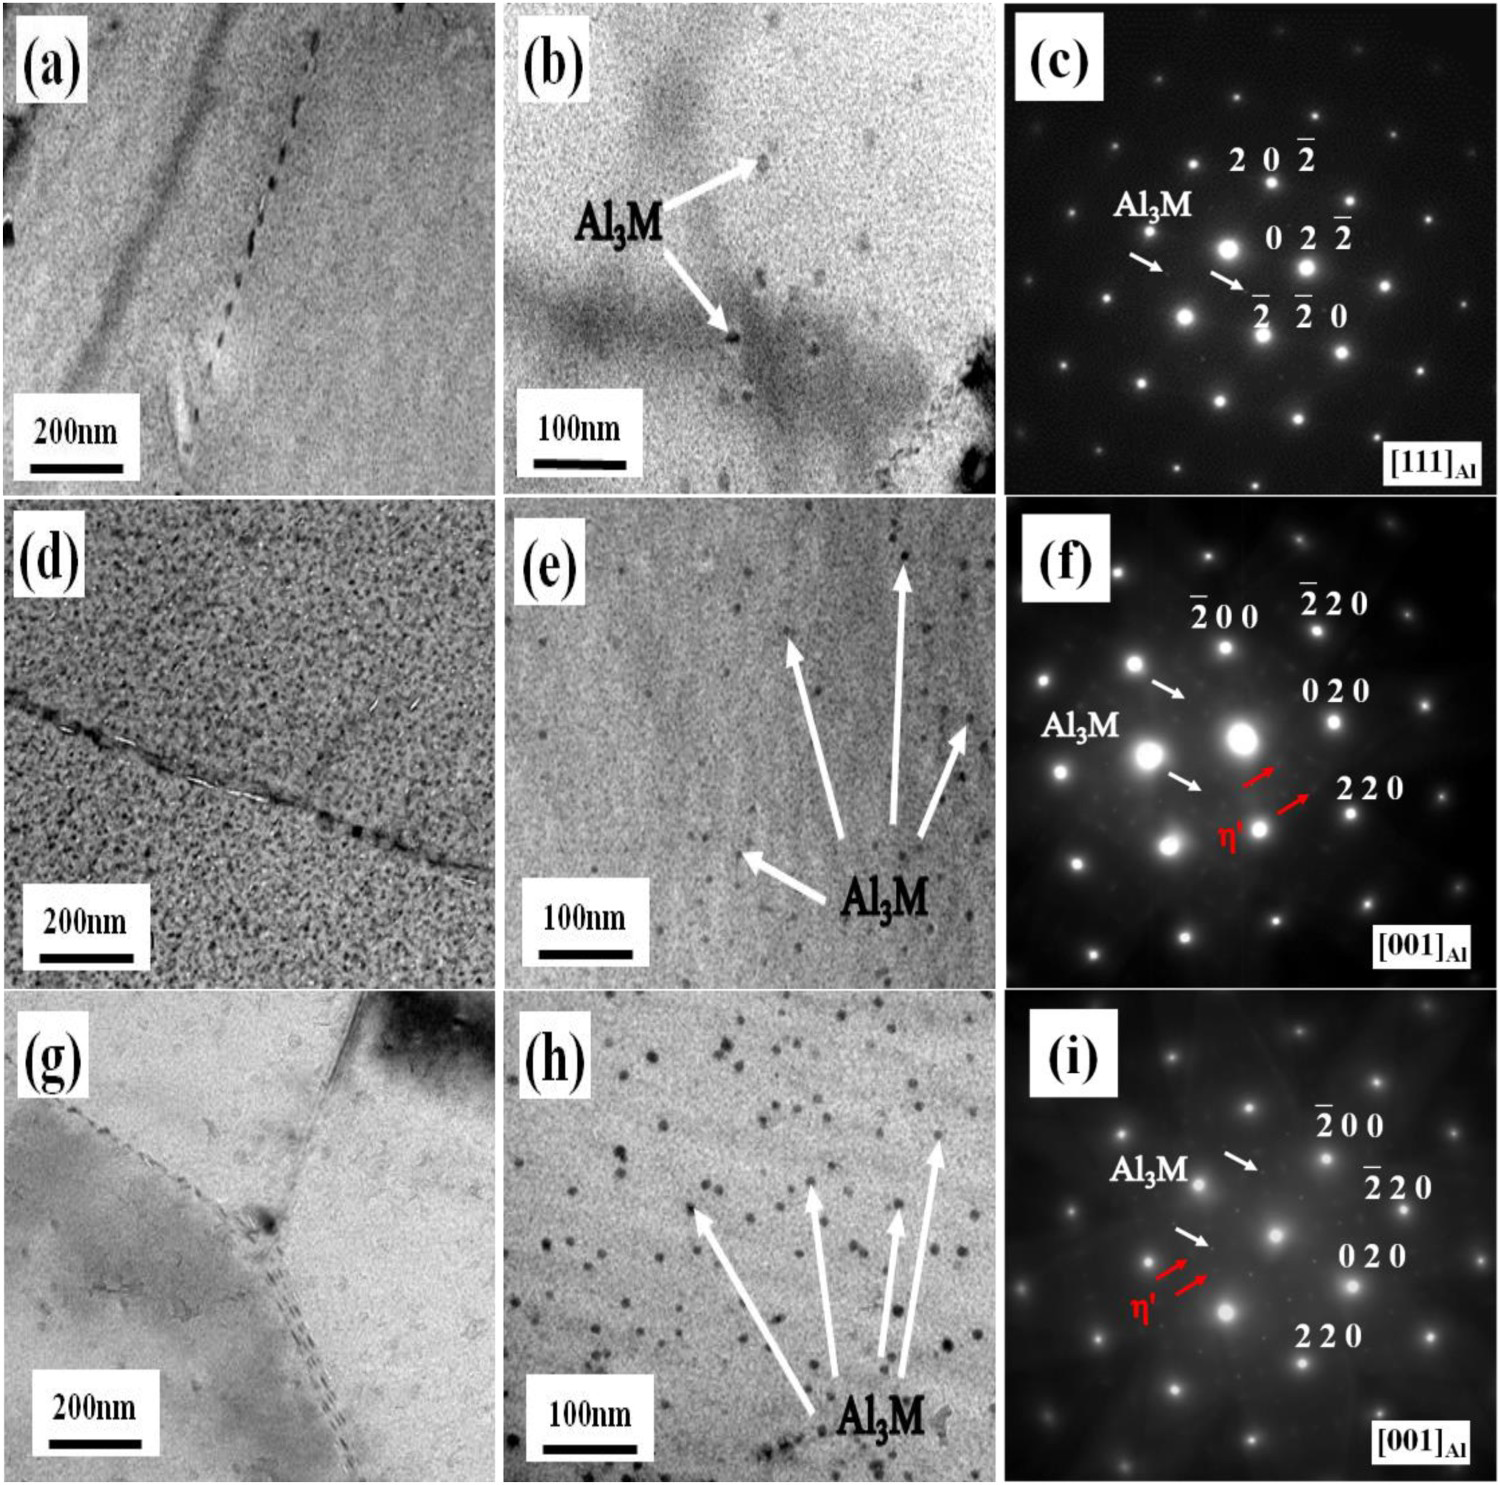
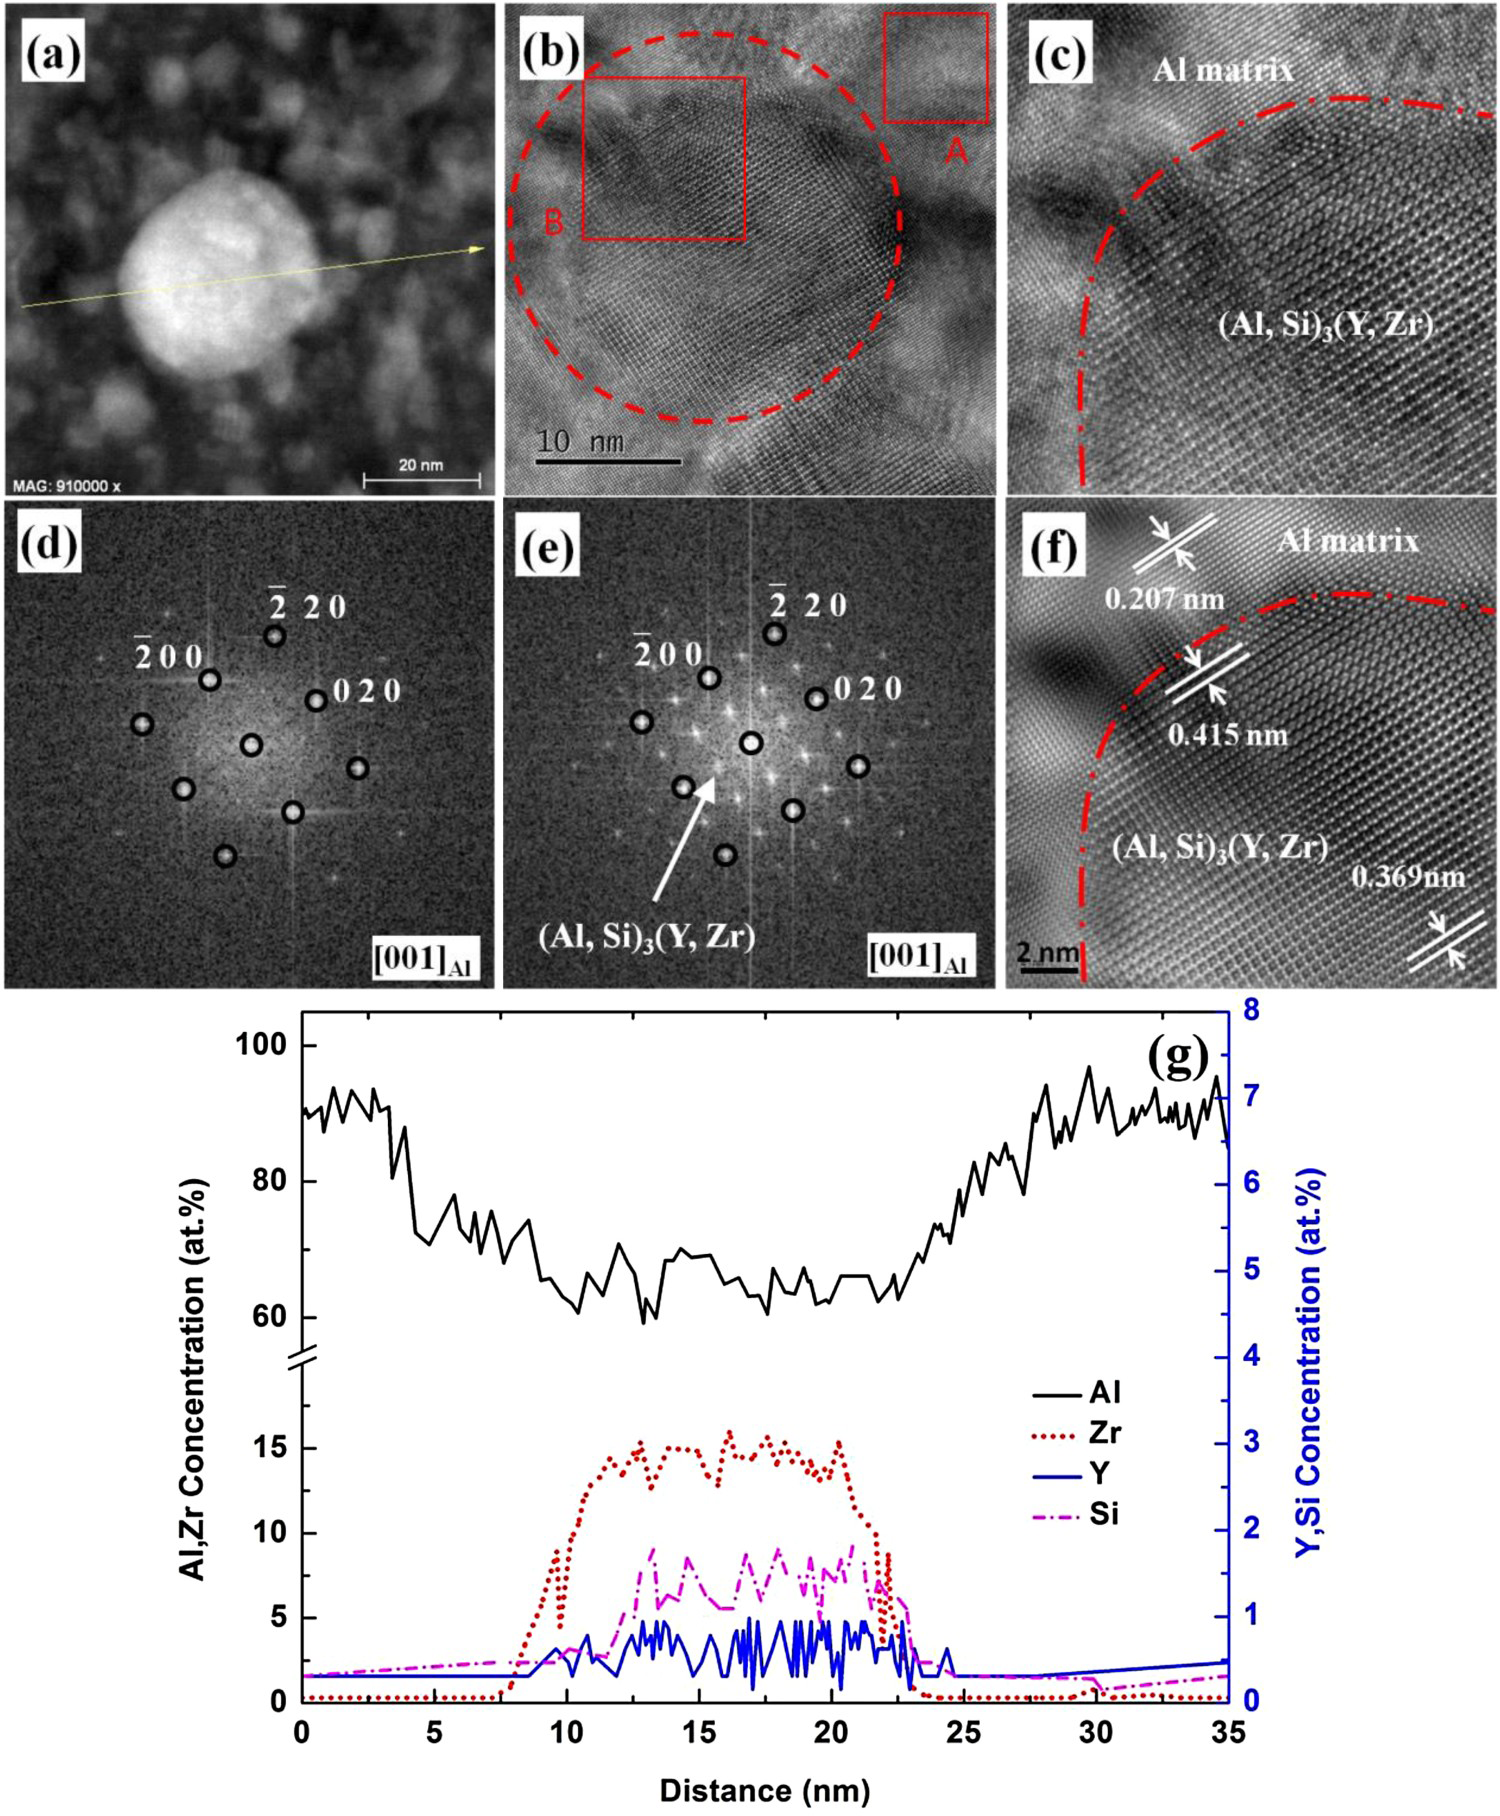
The HAADF-STEM, HRTEM images and elements analysis of Al3M dispersions in 0.015Y and 0.015Y–0.02Si alloys were shown in Figures 9 and 10, respectively. From Figures 9 and 10, we found that the two kinds of dispersions all had the L12-type structure and had good coherence with the matrix. The interplanar spacings of the dispersions were 0.426 nm in the core and 0.378 nm in the shell in 0.015Y alloy and 0.415 nm in the core and 0.369 nm in the shell in 0.015Y–0.02Si alloy, respectively. In the two alloys, the interplanar spacings of the matrix were 0.207 nm. Therefore, the lattice mismatch degree between the dispersions and the matrix in the 0.015Y–0.02Si alloy was smaller than the 0.015Y alloy. The smaller the lattice mismatch degree of the dispersions, the lower the interface energy and the stronger its coarsening resistance. According to the linear-scanning results (Figures 9(g) and 10(g)), the dispersions in 0.015Y and 0.015Y–0.02Si alloys were Al3Zr containing 0.8 at.-% Y atoms and Al3Zr containing 2.0 at.-% Si atoms and 0.8 at.-% Y atoms, respectively. And according to the results, it can be inferred that those dispersions were Al3(Zr,Y) in the 0.015Y alloy and (Al,Si)3(Zr,Y) in the 0.015Y–0.02Si alloy, respectively.
The HAADF-STEM, HRTEM images and elements analysis of dispersions in 0.015Y alloy: (a) HAADF-STEM image; (b)HRTEM image; (c) magnified view of region B in (b); (d) Fourier transform of region B in (b) along [111]Al; (e) Fourier transform of region A in (b) along [111]Al; (f) the inverse Fourier transform of (e); (g) EDXS line-scanning profiles of Al, Zr and Y elements along the line in (a). The HAADF-STEM, HRTEM images and elements analysis of dispersions in 0.015Y–0.02Si alloy: (a) HAADF-STEM image; (b)HRTEM image; (c) magnified view of region B in (b); (d) Fourier transform of region B in (b) along [001]Al; (e) Fourier transform of region A in (b) along [001]Al; (f) the inverse Fourier transform of (e); (g) EDXS line-scanning profiles of Al, Zr, Y and Si elements along the line in (a).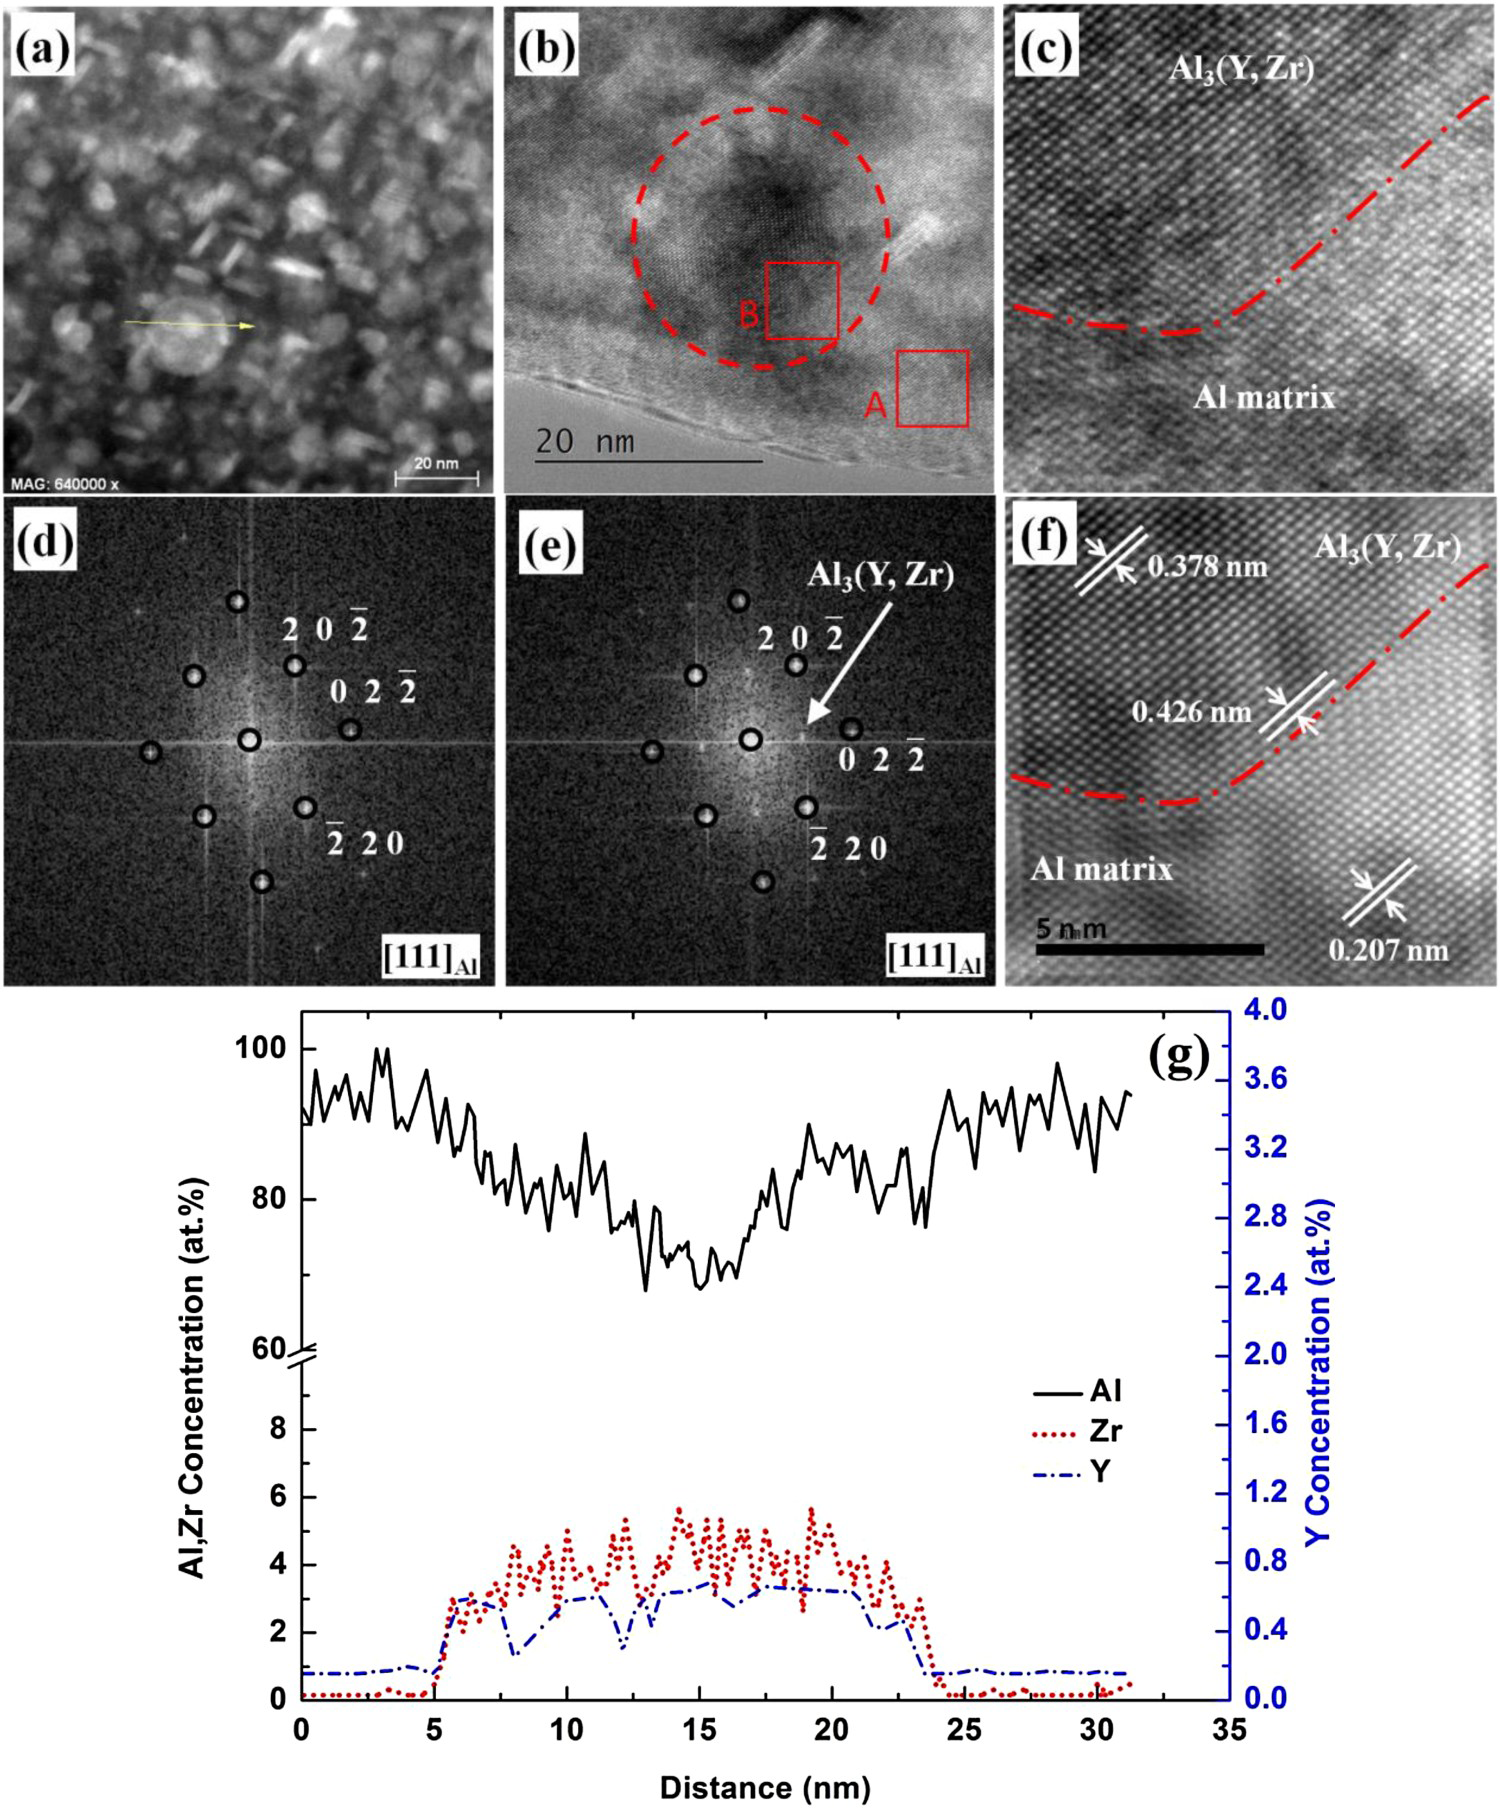
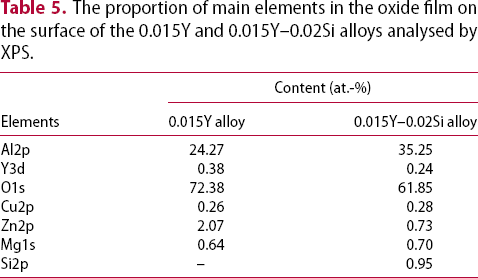
The XPS analysis results about the constituent of elements in the oxide film on the surface of the 0.015Y and 0.015Y–0.02Si alloys are shown in Figure 11. The proportion of main elements in the oxide film on the surface of the 0.015Y and 0.015Y–0.02Si alloys analysed by XPS is shown in Table 5. It was found that the Y element peak appeared in the oxide film of the 0.015Y alloy and the Y element peak and Si element peak simultaneously appeared in the oxide film of the 0.015Y–0.02Si alloy. According to the BE Lookup Table for Signals from Elements and Common Chemical Species [46], it can be speculated that the compounds corresponding to the Al element peak, Y element peak and Si element peak were Al2O3 (74.3 eV), Y2O3 (156.6 eV), SiO2 (103.0 eV), respectively. Therefore, the passivation film on the surface of the 0.015Y alloy may be a composite Al2O3/Y2O3 oxide film and the passivation film on the surface of the 0.015Y–0.02Si alloy may be a composite Al2O3/Y2O3/SiO2 oxide film.
The XPS analysis results about the constituent of elements in the oxide film on the surface of (a) the 0.015Y alloy and (b) the 0.015Y–0.02Si alloy. The proportion of main elements in the oxide film on the surface of the 0.015Y and 0.015Y–0.02Si alloys analysed by XPS.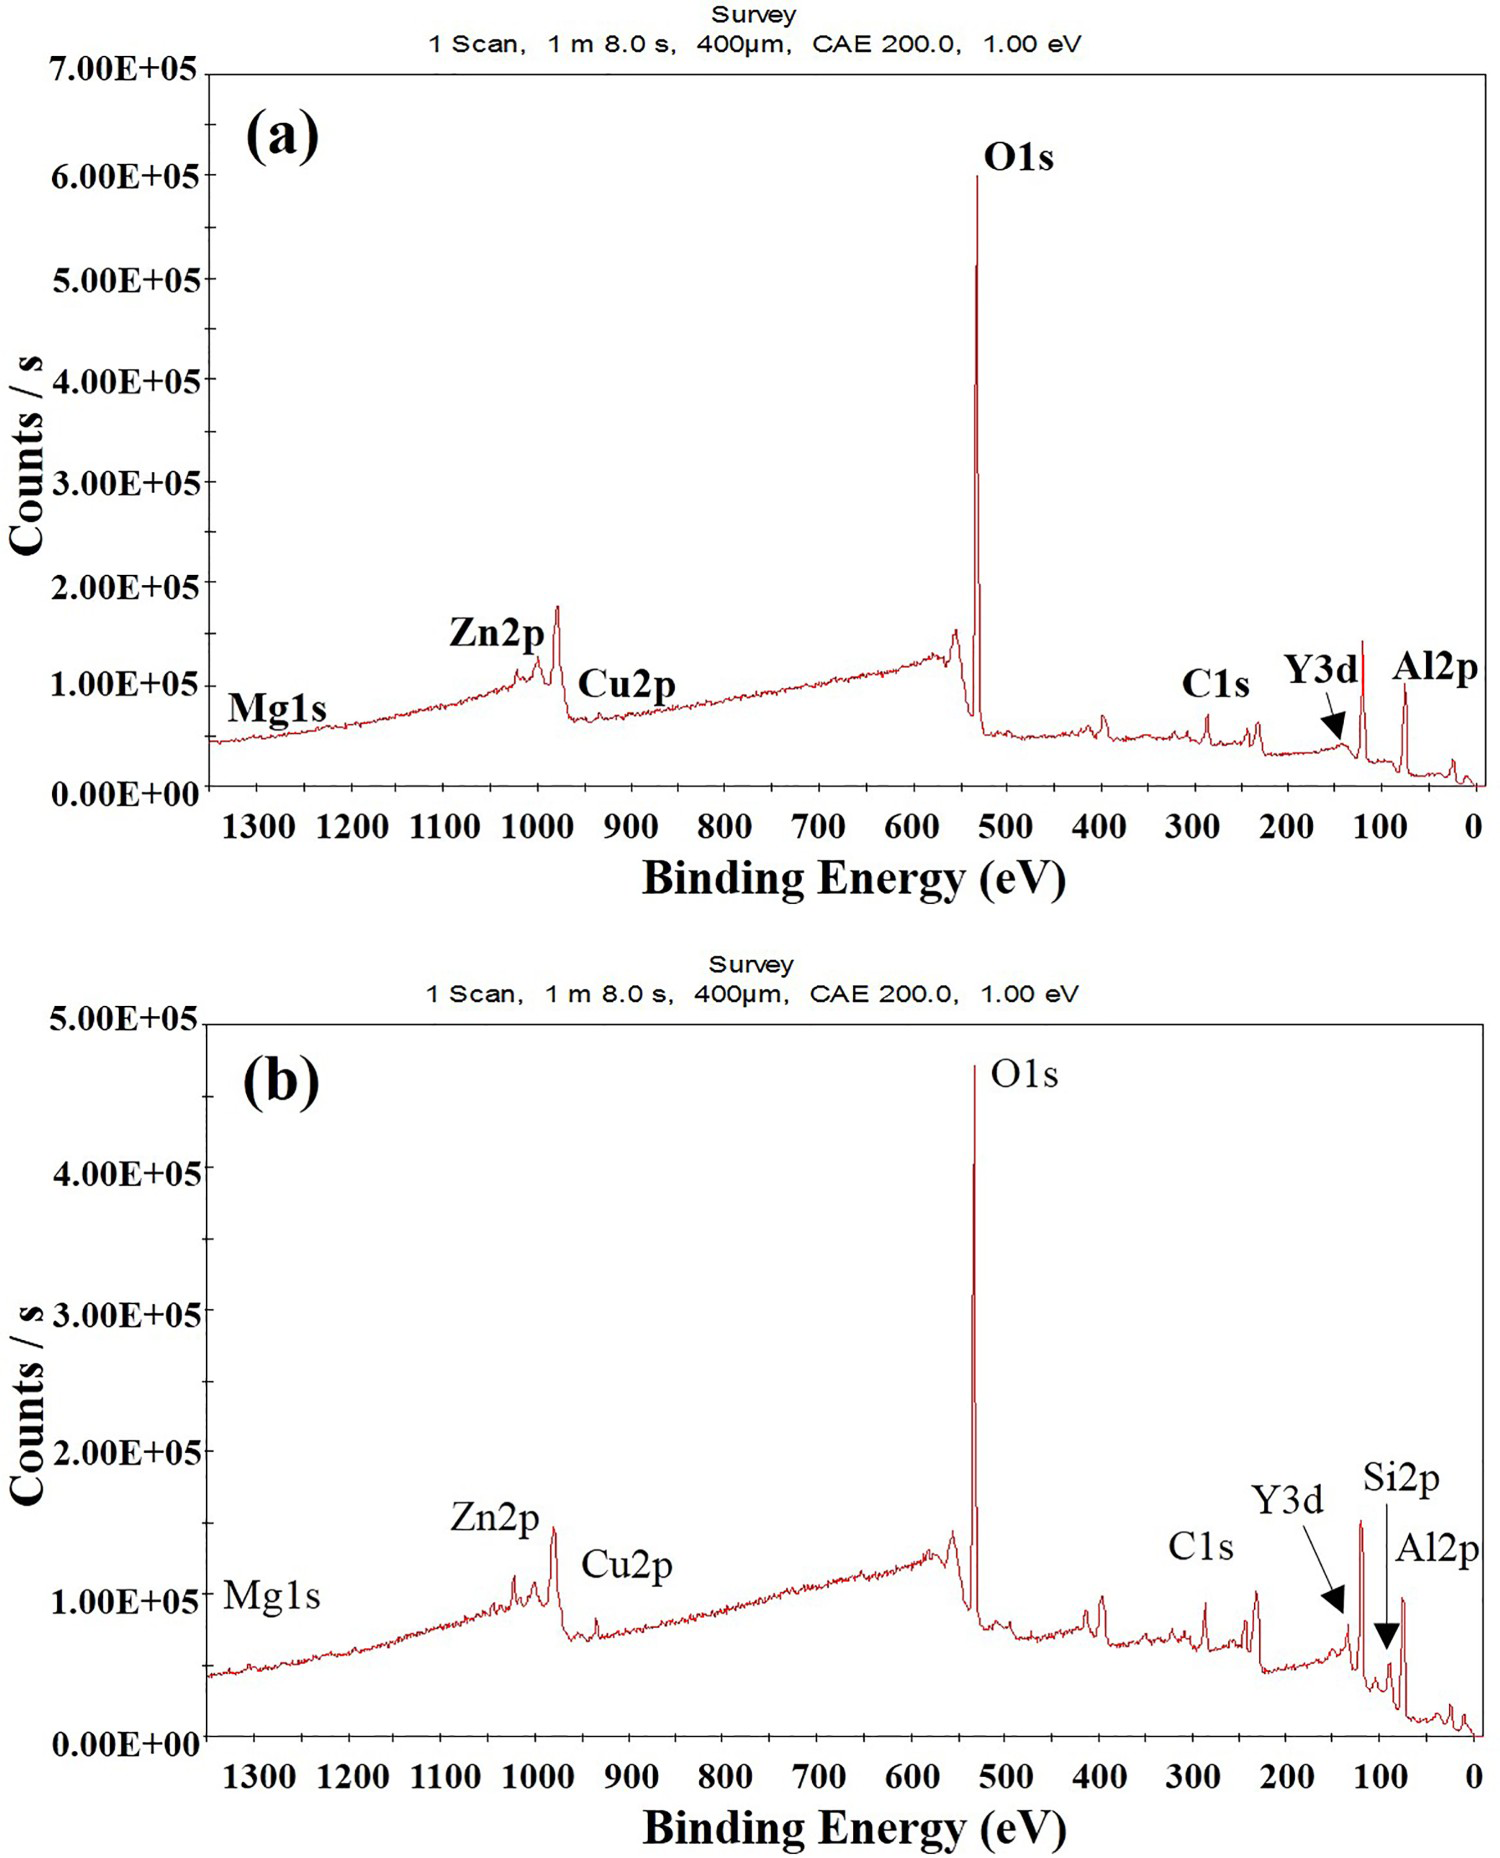
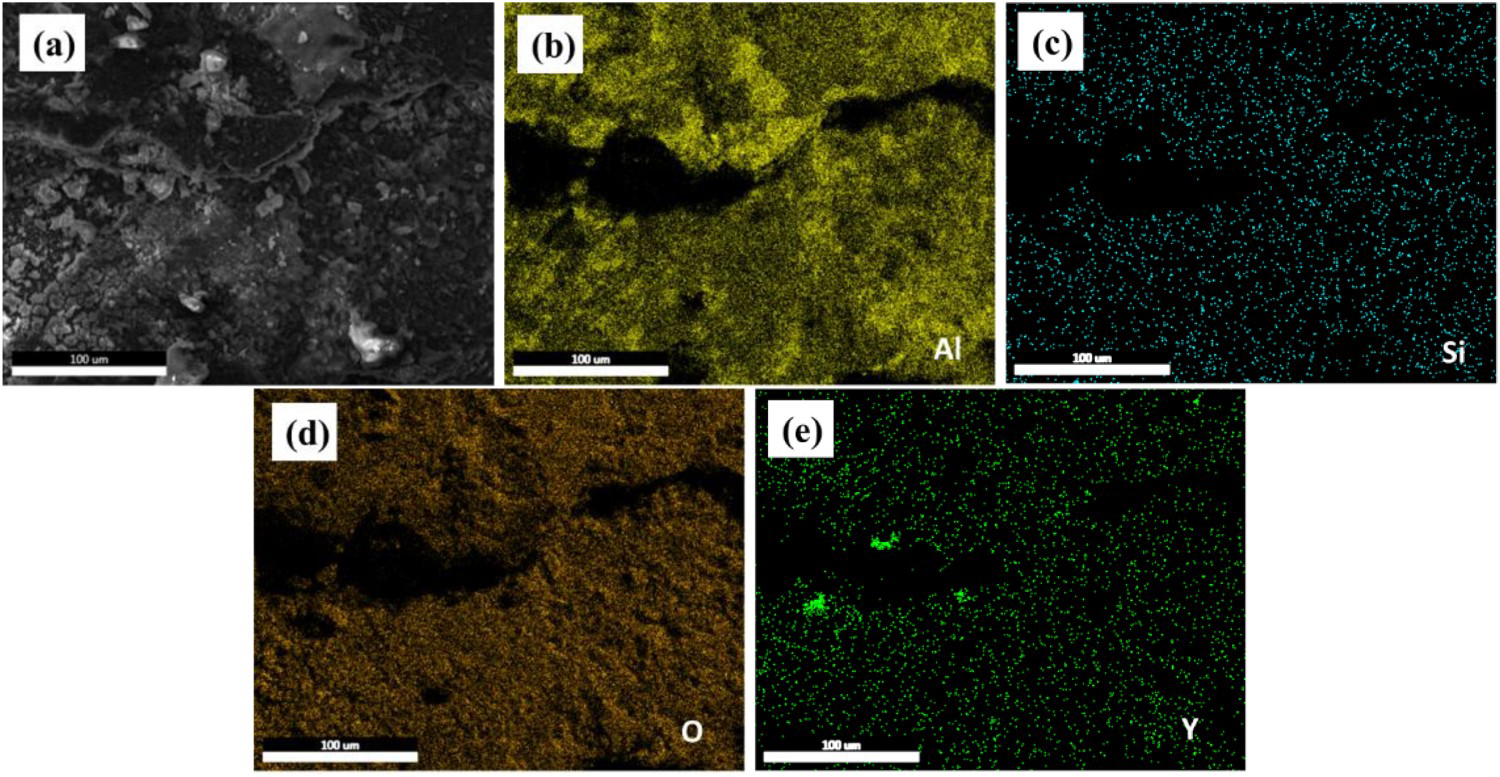
Further, the Mapping analysis results of the passivation film on the tip of the stress corrosion crack of the 0Y and 0.015Y–0.02Si alloys are shown in Figures 12 and 13, respectively. Table 6 displays the element content of the passivation film on the tip of the stress corrosion crack of the 0Y and 0.015Y–0.02Si alloys. This indicates that both Y and Si elements have entered the passive film at the tip of the stress corrosion cracking.
The Mapping analysis results of the passivation film on the tip of the stress corrosion crack of the 0Y alloy. The Mapping analysis results of the passivation film on the tip of the stress corrosion crack of the 0.015Y–0.02Si alloy. The elements content of the passivation film on the tip of the stress corrosion crack of the 0Y and 0.015Y–0.02Si alloys.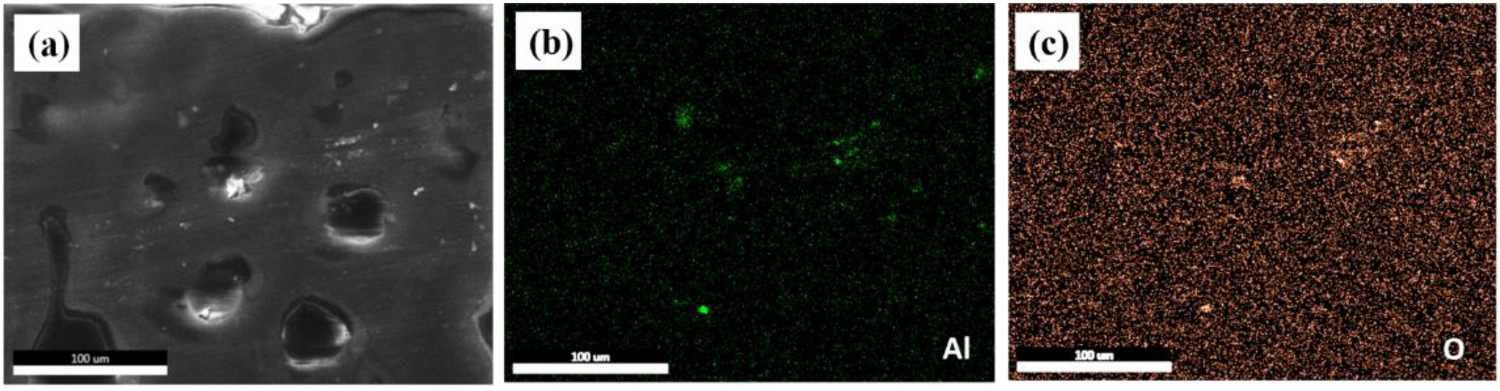

Discussion
Effects of trace Y and Si elements on microstructure and mechanical properties of 7056 aluminium alloy
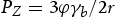
In this paper, the number and size of recrystallised grains in 7056 aluminium alloy were mainly related to the pinning effect of the dispersions on the grain boundary and sub-grain boundary, which was affected by the number and diameter of the dispersions. The formula for the pinning force was as follows [32]:
In the 0.015Y alloy, the diffusion rate of Y atoms was higher than that of Zr atoms, the fine Al3Y core will be preferentially precipitated, which acted as the heterogeneous precipitation site for Zr atoms to form Al3Zr phase so that the Al3Y core was enclosed by Al3Zr shell [40]. Therefore, Al3(Zr,Y) dispersions with the core–shell structure of Al3Y core and Al3Zr shell were precipitated in the 0.015Y alloy. Therefore, under the condition that the Al3Y core induced the precipitation of the Al3Zr shell, the number of Al3(Zr,Y) dispersions increased. In the 0.015Y–0.02Si alloy, the diffusion rate of Si atoms was lower than that of Y atoms and higher than that of Zr atoms, which led to the decrease in the nucleation rate and coarsening rate of the Al3Y core due to the formation of Si–Y atomic clusters [39-41], thereby the finer (Al,Si)3Y core will be preferentially precipitated and the (Al,Si)3Zr shell was accelerated to attach to the (Al,Si)3Y core due to the presence of the Si–Zr atomic clusters and the (Al,Si)3Y sites. Therefore, (Al,Si)3(Zr,Y) dispersions with the core–shell structure of (Al,Si)3Y core and (Al,Si)3Zr shell were precipitated in the 0.015Y–0.02Si alloy. Since the coarsening of the core was suppressed and the formation of the shell was accelerated, a larger number and smaller size of (Al,Si)3(Zr,Y) dispersions were formed in the 0.015Y–0.02Si alloy, which determined that the (Al,Si)3(Zr,Y) dispersions had the strongest pinning effect on the grain boundary and sub-grain boundary.
Owing to the increase in the number of (Al,Si)3(Zr,Y) dispersions and the decrease in size, its pinning effect on the grain boundaries, sub-grain boundaries and dislocations of 7056 aluminium alloy was greatly improved and the growth of precipitates on the grain boundary and sub-grain boundary was suppressed, so that the precipitates were smaller. These small precipitates were not prone to stress concentration under the action of external force, so that the strength required for the fracture of precipitates was higher, thereby increasing the alloy strength.
Effects of microstructure and dispersions on SCC resistance of 7056 aluminium alloy
The relationship between the different types of L12-structured dispersion and the stress corrosion resistance.
However, another possible reason for enhancing SCC resistance is the formation of passivation film containing RE elements. Some scholars believed that the passivation film had a positive effect on the inhibition of SCC. Hinton et al. [47] found that adding a small amount of CeCl3 (100–1000 ppm) to 0.1-M NaCl solution reduced the SCC propagation rate of 7075 aluminium alloy by nearly an order of magnitude. Varela et al. [48] proposed that cerium diphenyl phosphate (Ce(dpp)3) can effectively delay the initiation of SCC and reduce the cracking rate of 7075–T651 aluminium alloy in 0.1-M NaCl solution, which was attributed to the formation of a complex surface film consisting of hydrolysed forms of Ce(dpp)3, cerium oxide, aluminium oxide and phosphate. Further, confirm the positive effect of the passivation film on the inhibition of SCC. The DCB experiment of the 0Y alloy was carried out in 0.6-M NaCl solution and 0.6-M NaCl + 0.1M YCl3 solution, respectively. The SCC v–K curves of the 0Y alloy in 0.6-M NaCl solution and 0.6-M NaCl + 0.1-M YCl3 solution are shown in Figure 14. It can be seen from the figure that after adding Y3+ RE ions to the NaCl solution, the vII of the 0Y alloy was reduced from 9.60 × 10⁻⁸ to 7.6 × 10⁻⁹ m s−1 and KISCC increased from 2.7 to 15.1 MPa·m1/2. Those results were similar to that of the 0.015Y–0.02Si alloy in NaCl solution. Combined with the XPS analysis results (Figure 11) and electrochemical analysis results (Figures 4–6) of the passivation films on the 0.015Y and 0.015Y–0.02Si alloys, it can be inferred that the passivation film played a positive role in the SCC inhibition of 7xxx series aluminium alloys. Further, comparing the passive film composition at the tip of the stress corrosion cracks of the 0Y alloy and the 0.015Y–0.02Si alloy, it can be found that both Y and Si elements enter the passive film (Figures 12 and 13, Table 6), thereby inhibiting the stress corrosion crack propagation.
The SCC v–K curves of the 0Y alloy in 0.6-M NaCl solution and 0.6-M NaCl + 0.1-M YCl3 solution.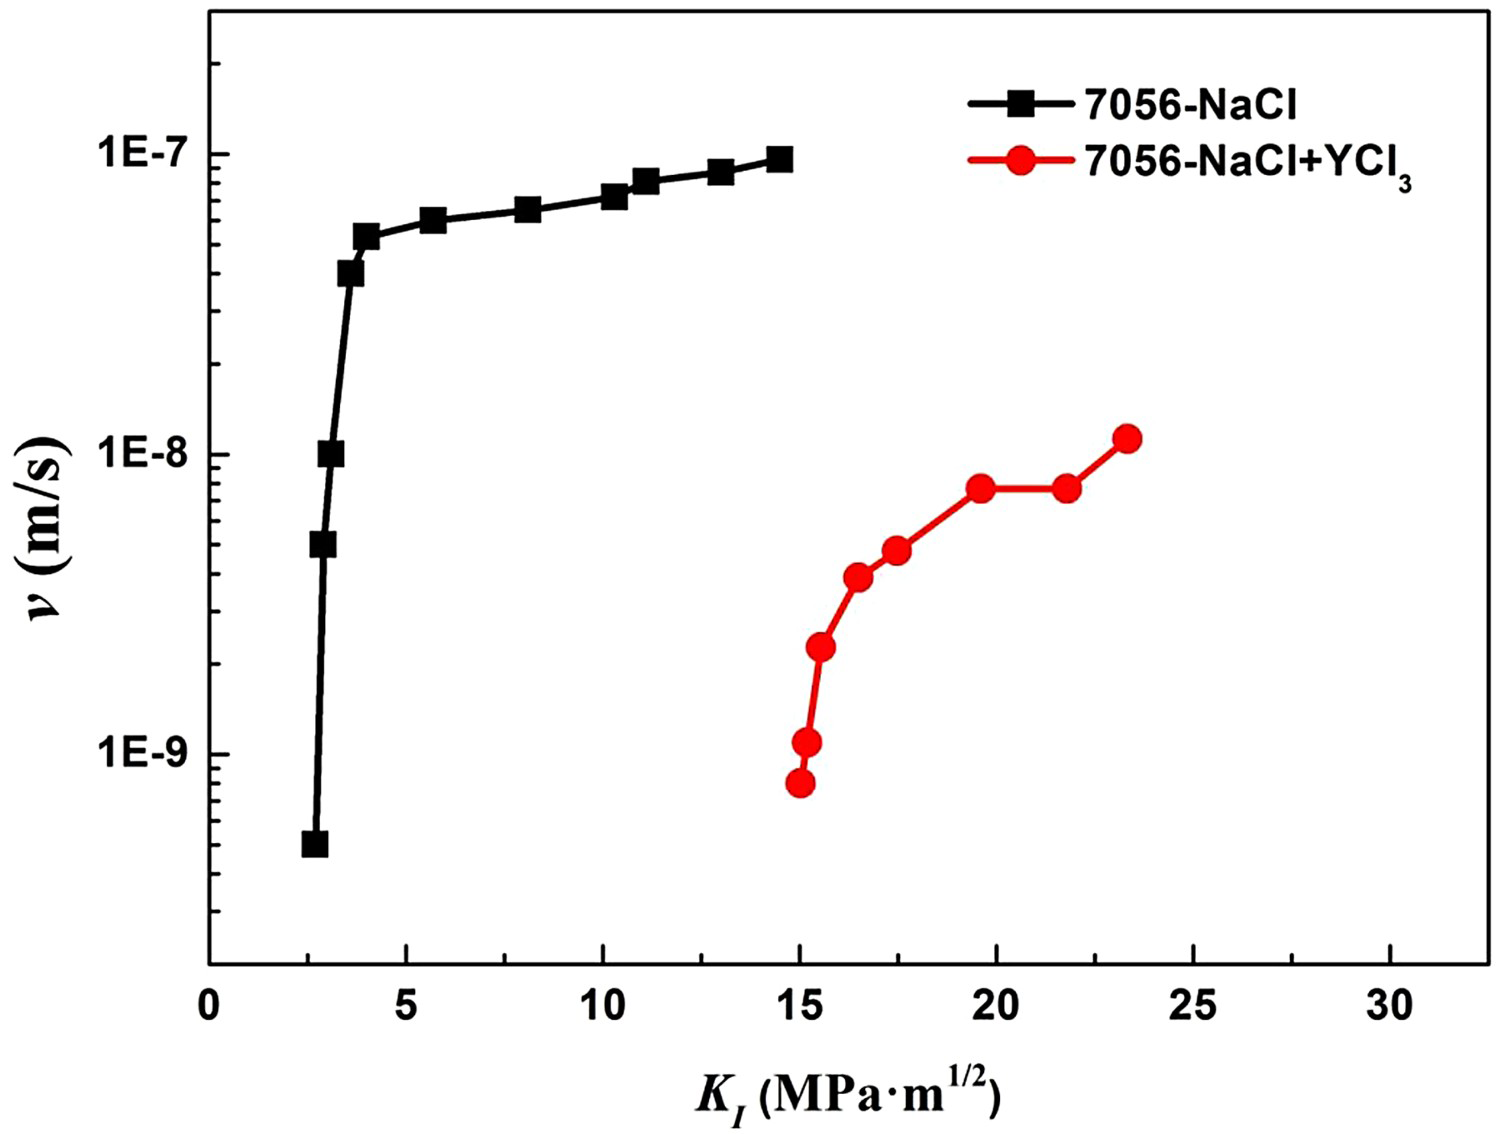
The schematic of stress corrosion crack propagation for the RE-free and RE-containing alloys can be plotted in Figure 15. In the 0Y alloy, crack initiation was mainly caused by the stress concentration at the intermetallics sites on the alloy surface because the loose and porous Al2O3 oxide film with low electrochemical impedance on the alloy surface was easy for corrosive media to pass through and corrode the matrix around those intermetallics, which generated cracks under stress. In the crack propagation stage of the 0Y alloy, the main reason for the faster crack propagation rate was the weak pinning effect of Al3Zr dispersions on the grain boundary and sub-grain boundary, resulting in the maximum recrystallisation fraction, so that the cracks were easy to propagate along the recrystallised grain boundaries (high-angle grain boundaries). At the same time, the Al2O3 oxide film with low electrochemical impedance on the stress corrosion crack tip cannot effectively prevent the corrosive medium from eroding the GBPs. Thus, the anodic dissolution behaviour of the GBPs had not been effectively suppressed, resulting in its high-stress corrosion propagation rate. In the 0.015Y–0.02Si alloy, the crack initiation was suppressed by the composite oxide film containing Y and Si elements, because it was difficult for corrosive medium to pass through composite oxide film with higher compactness and electrochemical impedance and corrode the matrix around intermetallics, which suppressed the initiation of cracks under stress. In the crack propagation stage of the 0.015Y–0.02Si alloy, on the one hand, the decrease in crack propagation rate was attributed to the increase in the sub-grain boundary fraction under the enhancing pinning effect of the (Al,Si)3(Zr,Y) dispersions. On another hand, the anodic dissolution behaviour of the GBPs caused by the corrosive medium was suppressed due to the Y and Si elements-containing composite passivation film with higher compactness was attached to the GBPs. Therefore, the SCC resistance of the 0.015Y–0.02Si alloy was improved when both crack initiation and crack propagation were suppressed.
The schematic of stress corrosion crack propagation for the rare-earth-free and rare-earth-containing alloys: (a) 0Y alloy; (b) 0.015Y–0.02Si alloy.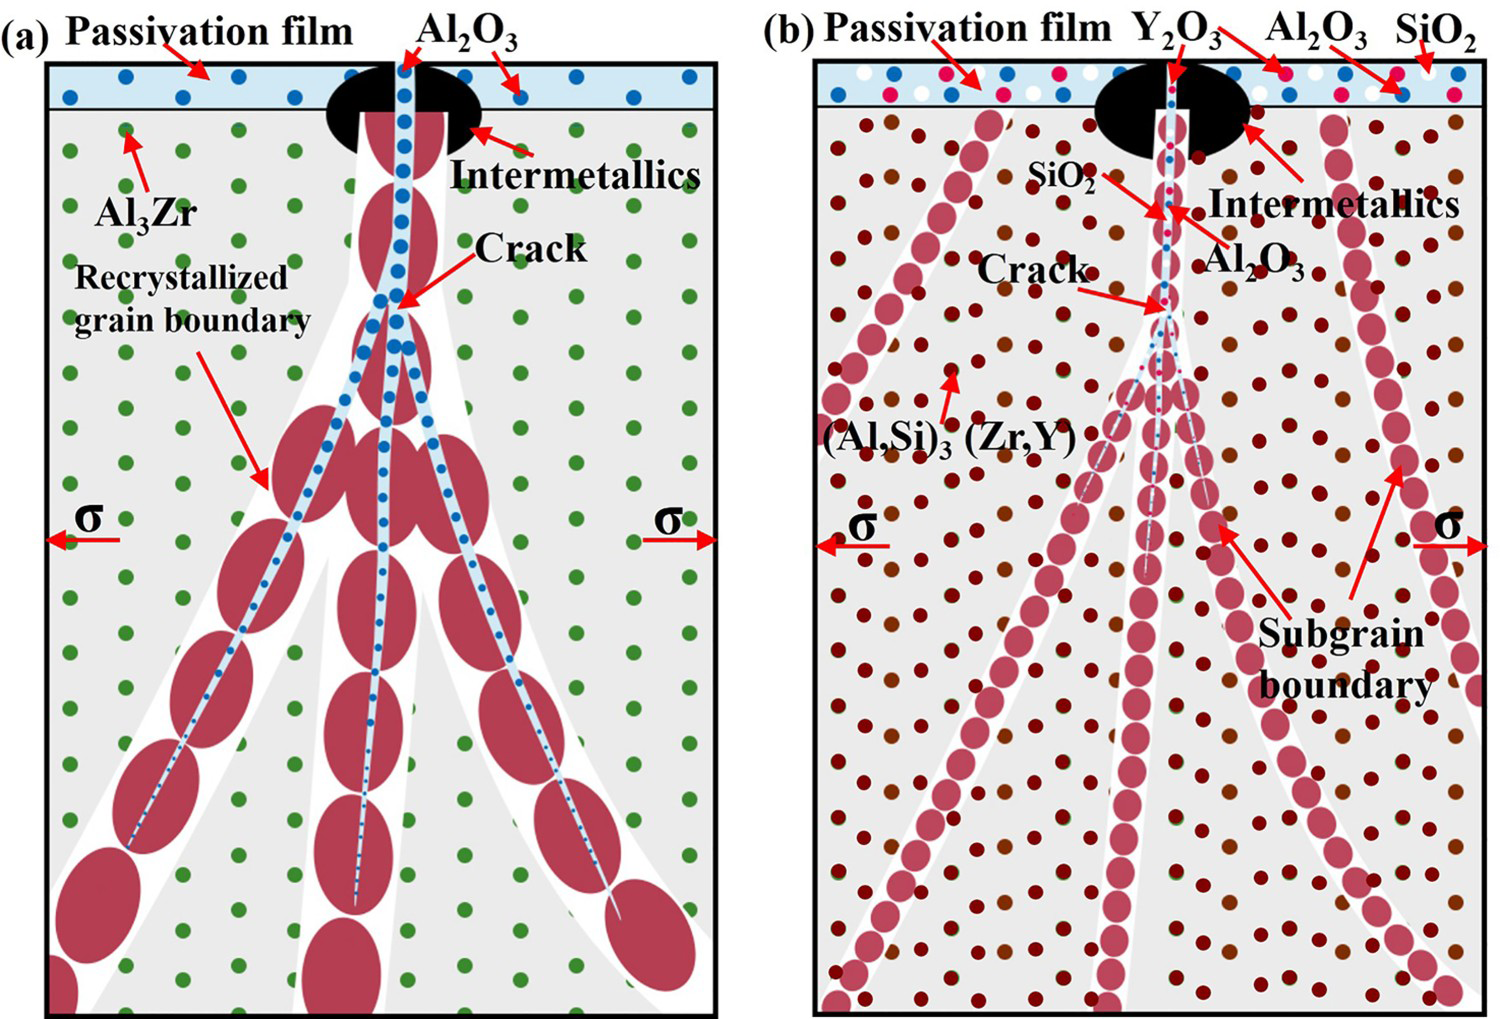
In summary, the main reasons for the mixed addition of trace Y and Si elements to enhance the SCC resistance of 7xxx series aluminium alloys were the inhibition of recrystallisation and the increase of sub-grain boundary fraction caused by formed L12-structured coherent (Al,Si)3(Zr,Y) dispersions. Another possible reason was the formation of a passivation film with high compactness and electrochemical impedance containing Y and Si elements.
Conclusions
The L12-structured coherent (Al,Si)3(Zr,Y) dispersions formed in the 0.015Y–0.02Si alloy can strongly pin the grain boundaries and sub-grain boundaries and inhibit recrystallisation, leading to the increase in the sub-grain boundaries area fraction and the SCC resistance. Another possible reason for the mixed addition of Y and Si elements to enhance the SCC resistance is the formation of a Y–Si-containing passivation film with high compactness and electrochemical impedance. Improving the compactness and electrochemical impedance of the passivation film to prevent the corrosive medium from eroding the grain boundary precipitates and avoid the anode dissolution behaviour of the grain boundary precipitates may be a new way to improve the SCC resistance of the new generation high Zn-containing 7xxx series aluminium alloy.
Footnotes
Acknowledgements
Liang Zhou: Conceptualisation, Investigation, Data curation, Writing – original draft, Funding acquisition. Zhiyong Sheng: Investigation. Qiang Liu: Investigation. Ligang Xin: Investigation. Kanghua Chen: Funding acquisition. Songyi Chen: Funding acquisition, Writing.
Disclosure statement
No potential conflict of interest was reported by the author(s).
Data availability
The raw/processed data required to reproduce these findings cannot be shared at this time as the data also forms part of a continuing study.