
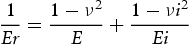
Abstract
Nanoindentation technique was adopted to study indentation size effects of physical-mechanical and creep performance with various depths (200–2000 nm) in GH901 utilising sharp and spherical tip. Residual impressions of both indenters with pile-up patterns are discussed. Nanohardness, reduced modulus and elastic recovery rates curves versus maximum displacement of two tips are obtained and nanohardness size effects are discussed with different models for Berkovich tip. The data obtained with spherical indentation are analysed separately by establishing stress–strain diagram. The creep results using Berkovich tip indicate that creep strain rate declines while creep stress exponent first decreases and then increases with the increasing depth; the creep stress exponent (n) values, 2.39–7.35, imply the dominant creep deformation mechanism is dislocation control.
Keywords
Introduction
Nanoindentation technology can detect load and depth real-timely and get the corresponding curves, and can be utilised to measure the physical-mechanical properties [1,2] such as yield strength [3], strain hardening capacity, creep activation energy [4] and strain rate sensitivity [5], and residual stress [6]. Due to the high displacement resolution of the sensor, nanoindentation technique can reach an indenting depth in a range of nano-scale, 0.1–100 nm, so it has been used widely in ultrathin layers and micro-regions [7]. Nanoindentation has been employed by some researchers to study Ni-based superalloys. For instance, Kommel et al. [8] researched micromechanical properties change of different phases as a result of alloying elements moving at interdiffusion by nanoindentation in single crystal Ni-based superalloy ZS32-vi. Schöberl et al. [9] measured morphology and nanomechanical properties of two ternary Ni-based superalloys with various precipitate volume fraction and annealing time combing the results obtained by atomic force microscope and nanoindentation device, and they found out that the hardness of matrix and precipitates shows a declining trend with indenting depth increases. Nickel-based superalloys are developed for applications involving severe mechanical stress at elevated temperatures, so Sawant et al. [10] conducted nanoindentation studies with respect to creep compliance, hardness and modulus of single crystal CMSX-4 oriented in the 〈001〉and 〈110〉 directions from 303 to 673 K, and the results were further incorporated into the contact mechanics analyses to calculate the elastic modulus of CMSX-4 as a function of temperature.
GH901 is Fe–Ni–Cr-based superalloy showing excellent elevated temperature strength and corrosion resistance, and has been utilised to manufacture turbine disks, shafts and rotors in aerospace field, nuclear engineering and gas turbine industry [11-13]. Welding technology and surface treatment techniques are commonly employed when manufacturing mechanical parts with GH901 in power plants, which will result in microstructural variations in a narrow region of micro scale. With the development of measurement technology and the increase in required accuracy, it has been found out that even at a lower temperature (T/Tm < 0.2) like room temperature many engineering components can undergo creep when subjected to a constant load, which can cause microstructural changes, crack sprouting and expansion and final material failure [14]. The failure resulted from creep is a significant failure mode for components which are manufactured utilising Ni-based superalloys [15]. Nanoindentation technique has been adopted by Zhang et al. [16] to analyse room temperature creep resistance of DD407, and the creep mechanism is diffusion controlled based on the stress exponent. Bulk/uniaxial creep testing method is difficult to accurately measure the properties of each micro zone of the welded joints or treated surface, while nanoindentation technology has shown unique advantages in characterising the mechanical properties of micro zones. The triangular pyramid Berkovich diamond indenter is used to press into the surface of the sample to reach a certain load and keep it for a certain time. Because the applied stress is usually several to dozens of GPa, most materials, including ceramics, can experience a creep phenomenon similar to that occurring in the range of tensile creep from 0.5Tm to the melting point temperature at room temperature [17].
However, the indentation size effect (ISE) cannot be ignored when adopting nanoindentation technology to evaluate properties. It has been observed and reported in Ni-based superalloys and other alloys that material properties like hardness tend to increase with the drop of penetration depth, which is termed as the indentation size effect [18-20]. As the hardness of the material is closely related to other mechanical properties such as elastoplasticity, strength and wear resistance of the material, so in this research we adopted two most commonly used indenting tips, Berkovich and spherical indenter, to determine physical-mechanical properties like hardness and module and analyse the size effects produced by the Berkovich indenter base on the Meyer model [21] and Nix-Gao model [22]. The size effects of indentation creep behaviour such as creep rate, strain rate and stress exponent with various maximum penetration loads during dwell stage lasting 120 s are also explored. The above research aims to provide a theoretical foundation for the scientific and engineering applications of the welded joints and components and parts after surface strengthening treatment of GH910 or other similar materials.
Experimental and procedures
Chemical composition of GH901 (wt. %).

Figure 1 displays residual impressions of (a1-a6) Berkovich and (b1-b6) spherical indenter with six indenting depths 200, 400, 800, 1200, 1600 or 2000 nm with a magnification of 15,000 using scanning electron microscope. When projected on XY coordinate plane, Berkovich indenter leads into an equilateral triangle shape and spherical tip exhibits a rounded square shape, but Z-coordinate is not constant. Furthermore, it can be seen from the figure that the indentation of spherical indenter shows crushed and peeling material and the surface of the pit is rough compared with Berkovich indenter. Berkovich indenter which is self-similar (geometrically) is further chosen in this study to research the creep behaviour under different maximum pressed depths.
Residual impressions of (a1-a6) Berkovich and (b1-b6) spherical indenter for six indenting depths 200, 400, 800, 1200, 1600 or 2000nm, 15,000×.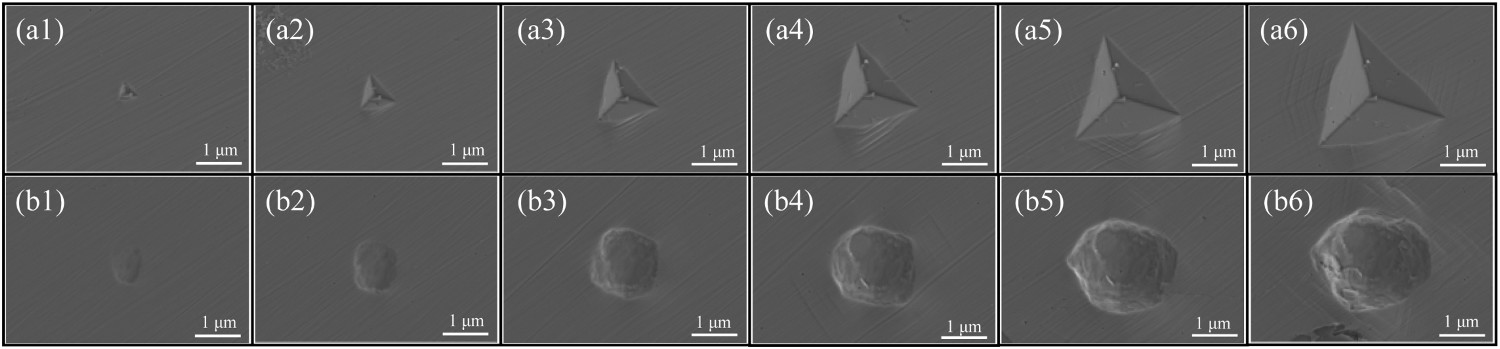
Results and discussions
Microstructural information and residual imprint morphology
Figure 2 demonstrates SEM micrograph of carbides which are situated in grains and at grain boundaries in alloy 901. The EDS spectra from the observed carbides indicate that elements Mo and Ti are present in carbides and (Ti, Mo)C carbide was also reported in the same alloy [23] and other superalloys such as U-500 and Rene 77 [12]. Annealing twinnings, one of the microstructural features of this alloy, are also illustrated in Figure 2. It is worth noting that γ′ precipitates could not be detected at the magnifications of SEM, since this family of alloys exhibit an ultrafine precipitate in nanometric size in face-centered cubic (FCC) matrix [13]. According to previous study [23], the increase of carbon content of 901 can lead to a higher amount of carbide sizes, meanwhile it can give slight rise to the mismatch between γ and γ′ phases, which are beneficial to the alloy in the first place, and then big blocky carbides become crack initiation sites, because of the incoherent interface of MC and matrix. The average grain size (equivalent circular diameter) is around 100 µm and most precipitates’ size is several micrometers, Figure 2, while the maximum indenting depth is set to be 200 to 2000 nm and the corresponding maximum indentation size (equivalent circular diameter) is between 2 and 10 µm as shown in Figure 1. So, there is no doubt that the precipitates, grain size and orientation can affect the measured nanohardness and creep data in this study. To better understand such effects, further study on factors like dislocation movements, interaction between geometrically necessary dislocations and statistically stored dislocations, the impediment of twin boundaries and precipitates on dislocation motion, the indentation being located in one or more grains with different orientations is needed. And in this research, the discrete data generated by indenting on the precipitates are eliminated and the testing data of repeated measurements with good repeatability are obtained and averaged to improve reliability and precision.
SEM micrograph showing carbides of alloy 901.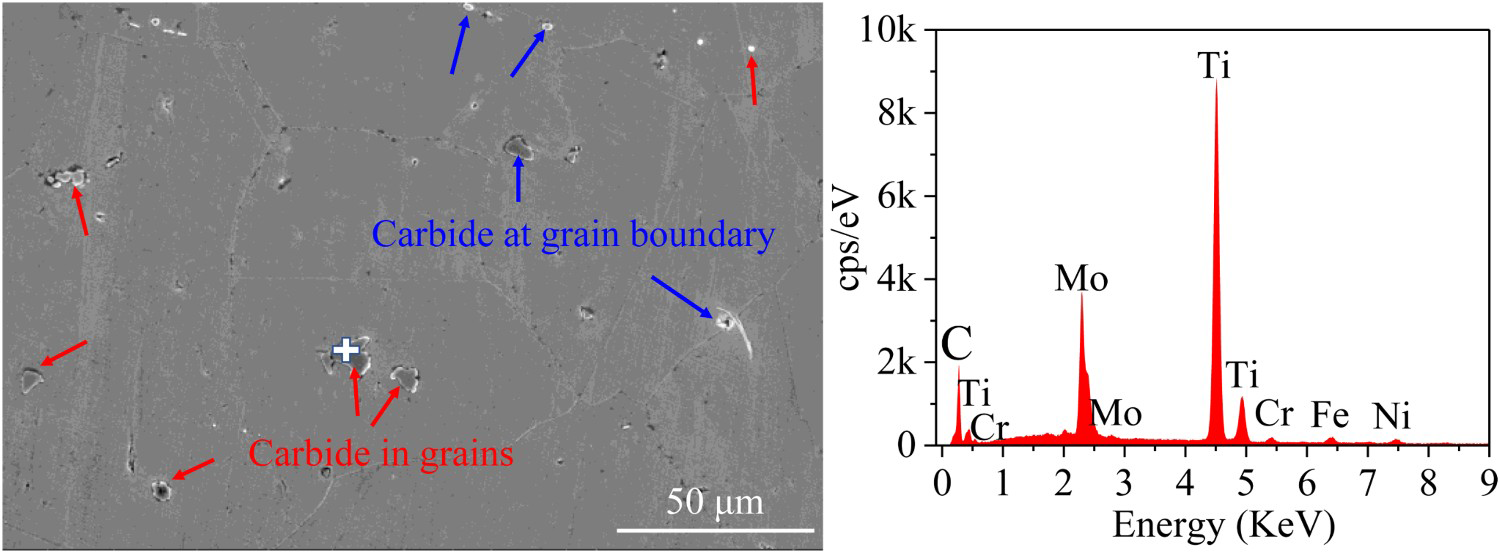
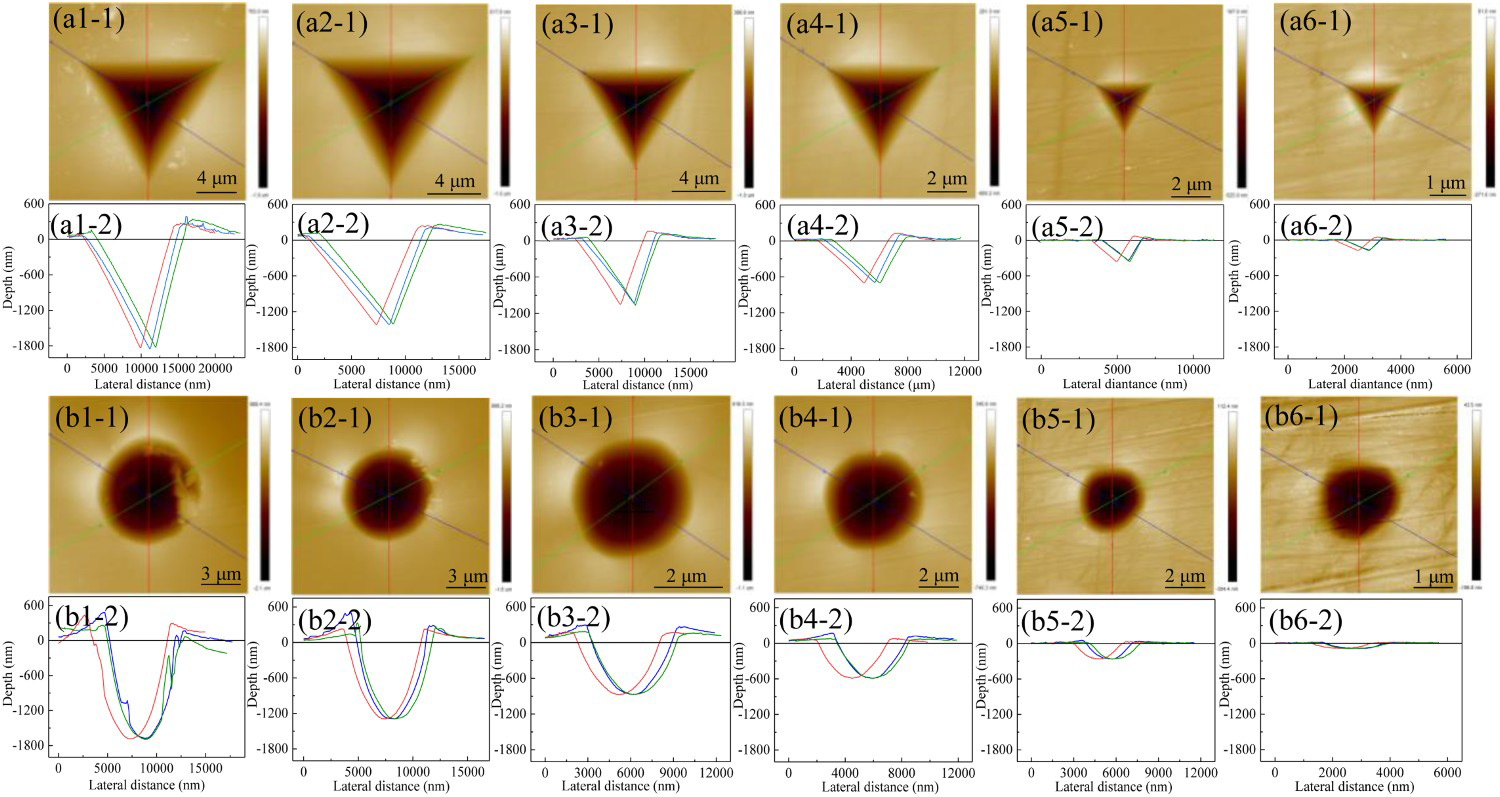
Kucharsiki et al. [24] gave a schematic of sample and indenter surface in loaded and unloaded state for isotropic material that exhibit sink-in (or pile up) pattern in their study of the size effect in single crystal copper examined with spherical indenters. Figures 3 and 4 show the three-dimensional residual imprint morphology and the indenting profiles of three cross sections for Berkovich indenter and spherical indenter obtained by utilising atomic force microscopy (AFM). It can be seen that the residual indentation of GH901 alloy exhibits pile-up pattern. In the observation of the indentation depth of 200 to 2000 nm, it is found that all the residual indentation shows the pile-up phenomenon, and the pile-up degree increases when the indentation depth increases. In general, some materials with a low strain-hardening tendency [25] such as strain-hardened Cu [26] will produce pile-up around residual indentations, while residual indentations around materials with a high work-hardening tendency generally exhibit sink-in phenomena. In addition, the penetration depth measured for spherical indenter is smaller than that for Berkovich for a particular set indenting depth, probably because two indenters with different geometry are utilised and they bring in different residual indentation morphology and different deformation and recovery mechanism, which needs further research. For instance, when 2000 nm is chosen as indenting depth, the residual depth is approximately 1850 and 1681 nm for Berkovich and spherical indenter respectively.
3D residual imprint morphology of (a) Berkovich indenter and (b) spherical indenter obtained by atomic force microscopy. Indenting profiles of three cross sections of six pressed depths from 2000 to 200 nm of (a) Berkovich indenter and (b) spherical indenter obtained with atomic force microscopy.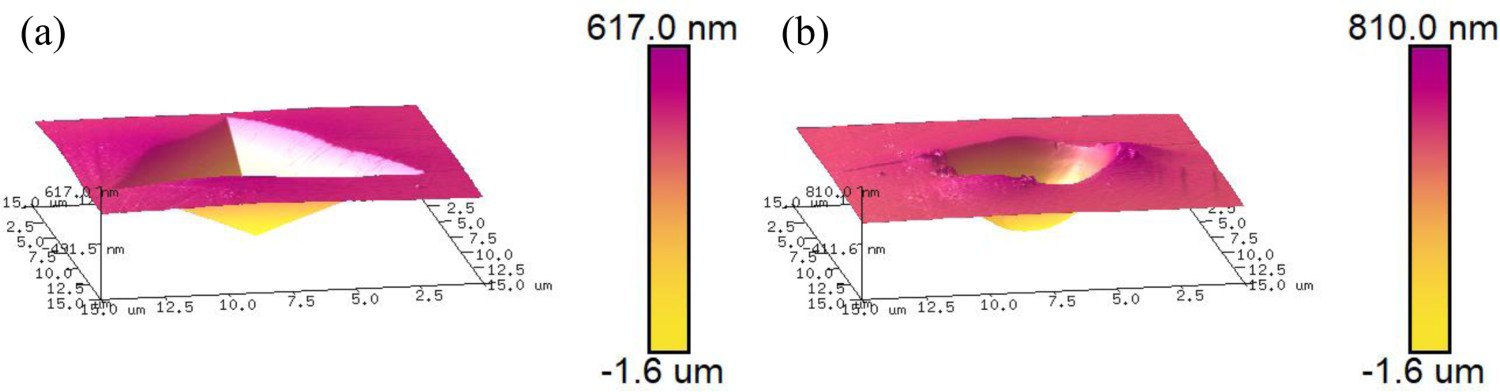
Nano-indentation results employing spherical and Berkovich indenter

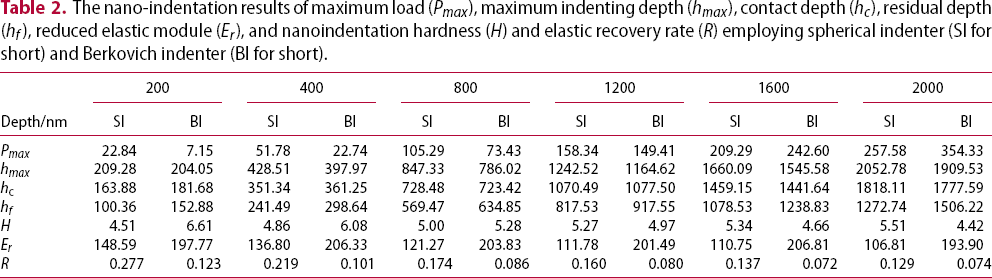
The nano-indentation results of maximum load (Pmax ), maximum indenting depth (hmax ), contact depth (hc ), residual depth (hf ), reduced elastic module (Er ), and nanoindentation hardness (H) and elastic recovery rate (R) employing spherical indenter (SI for short) and Berkovich indenter (BI for short).
Load versus depth with spherical and Berkovich indenter under six different maximum indenting depths, 200, 400, 800, 1200, 1600 and 2000 nm, are shown in Figure 5(a). The load-depth curves commonly contain load, dwelling, and unload stages, and the duration plateau for dwelling stage is not obvious as a result of short time of 10 s. The loading curves coincide well, indicating the whole testing process has a good reproducibility. The maximum load increases linearly with the required maximum penetration depth for spherical indenter, while the relationship between the two is close to parabola for Berkovich tip, see Figure 5b. During unloading process, the depth decreases from the maximum depth to a fixed value indicates a local permanent plastic deformation emerging in the tested area, as shown in Figure 5(a), Figures 3 and 4.
(a) Load versus depth curves during indenting process and (b) maximum loads for different maximum indentation depths of spherical and Berkovich indenter.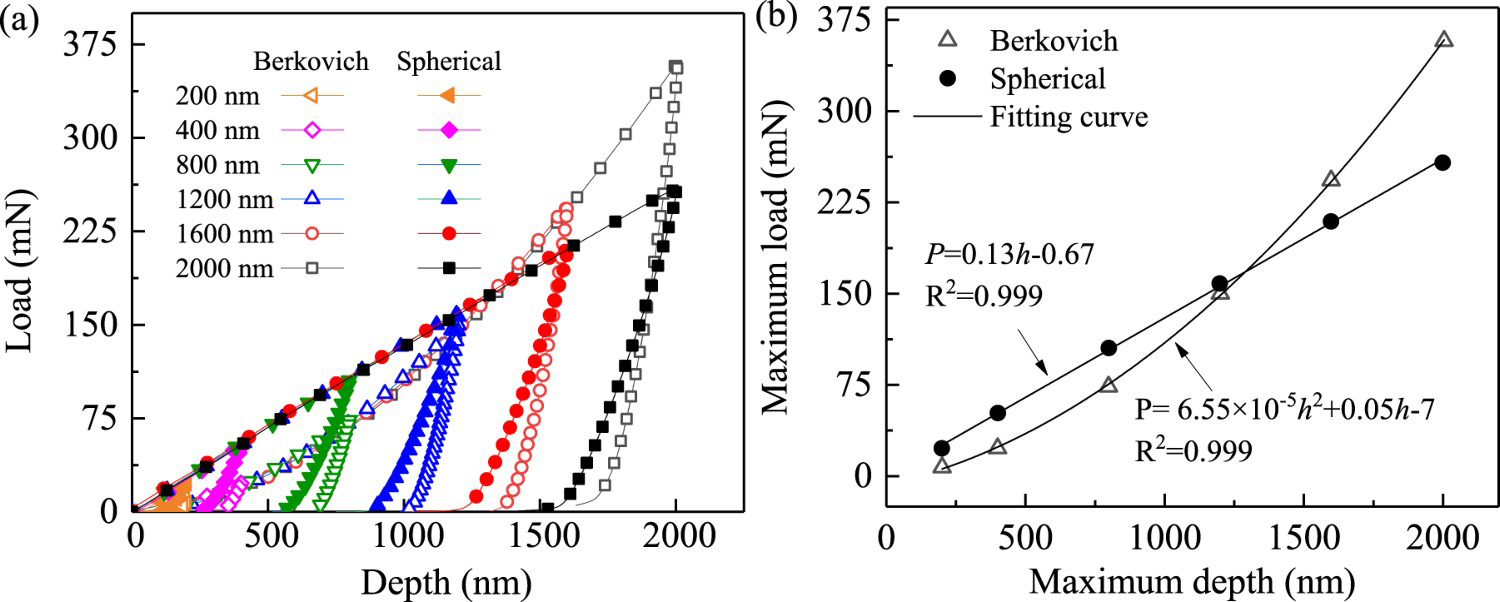
Indentation size effects of nanohardness employing Berkovich indentation
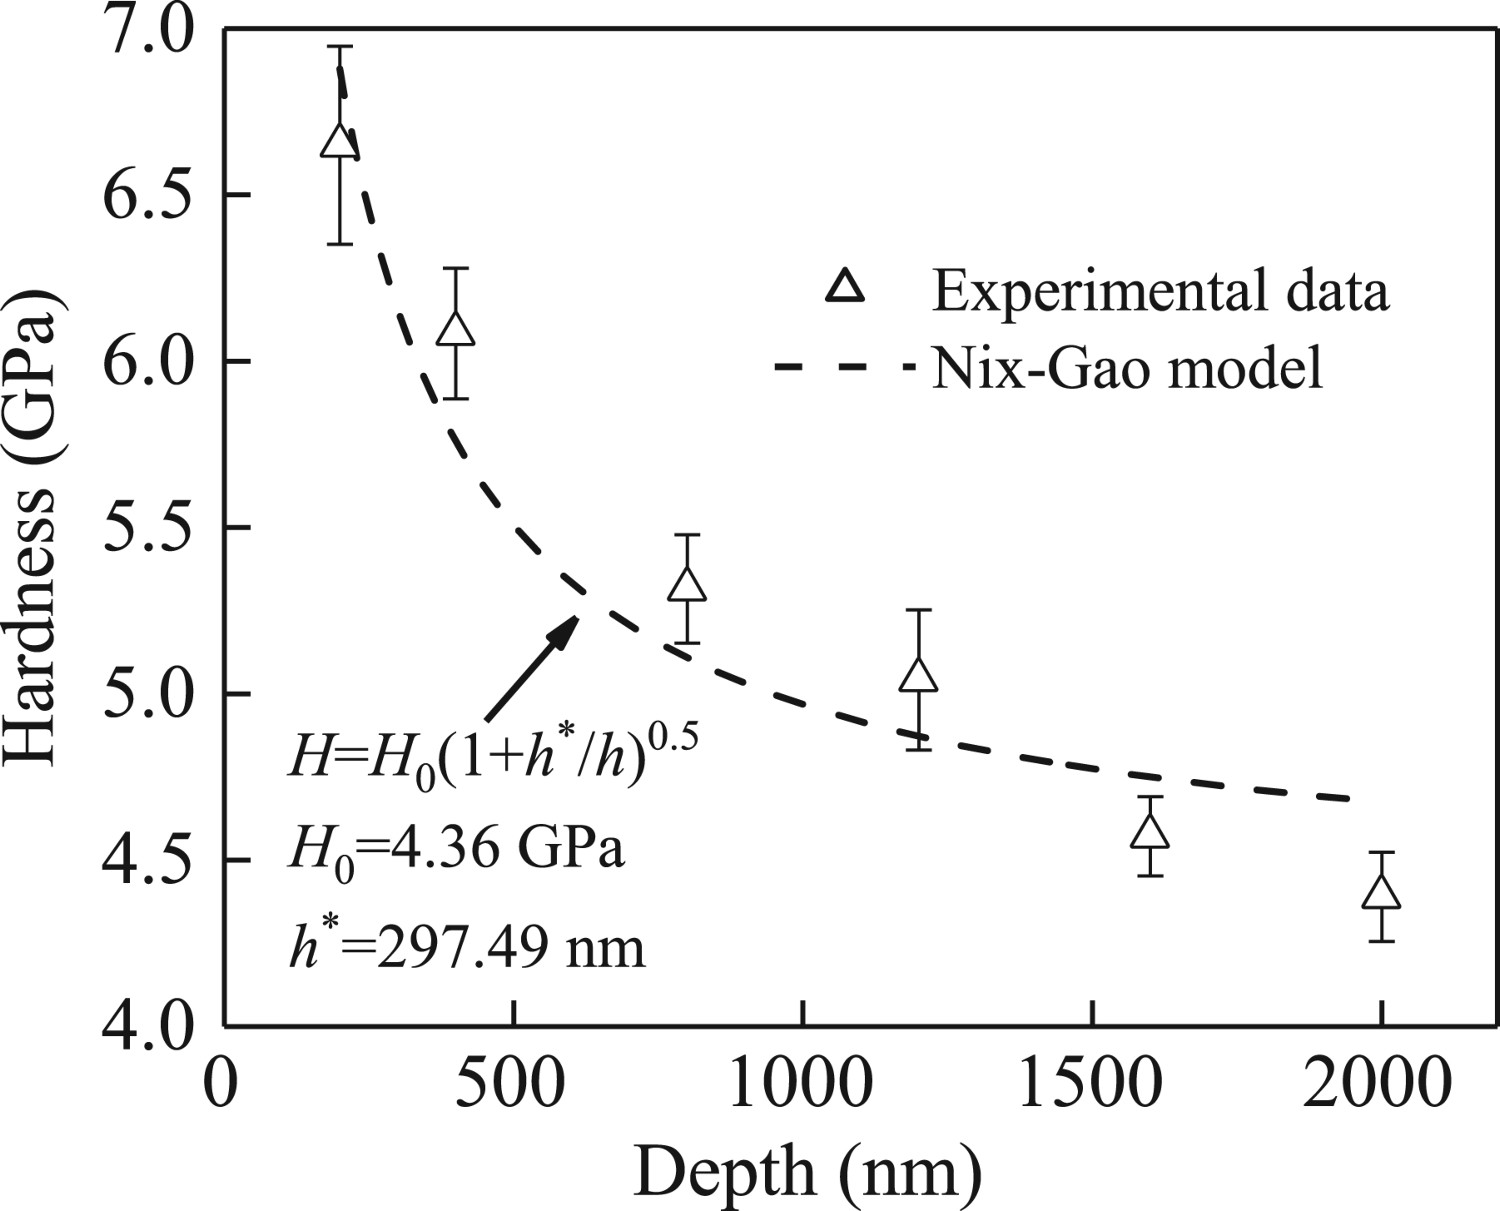
Figure 6 displays (a) indentation hardness-depth, (b) reduced modulus-depth, and (c) elastic recovery rates-depth curves measured with Berkovich indenter. The elastic reduced modulus values change little with the increasing indention depth. The high value of elastic recovery rate under small indentation displacement implies that the contribution of the elastic deformation for shallow indentation is more significant than that for deep indentation. The hardness (or stress) varies at different displacement (or load) for Berkovich indentation, which means that the indenting size effect exists in the data, and ISE for Berkovich indenter has been observed in previous researches on other alloys [29-31]. Based on classic plasticity theory, the hardness should be independent of the indenting depth, so the early ISE observations have been attributed to the experimental artefacts such as surface conditions and indenter tip imperfections, thus the underlying physical mechanisms was ignored over a period of time. Then, atomic and molecular dynamics models and dislocation dynamics theories were established to explain the ISE phenomenon [29-34]. Indentation data will be analysed, and load-independent hardness, i. e. characteristic nanohardness, will be evaluated from the analysis of data exhibiting ISE with various models such as Nix-Gao model [22] in the following text.
(a) Hardness-depth curves; (b) reduced modulus-depth curves; (c) elastic recovery rates-depth curves for different maximum indentation depths by Berkovich indenter.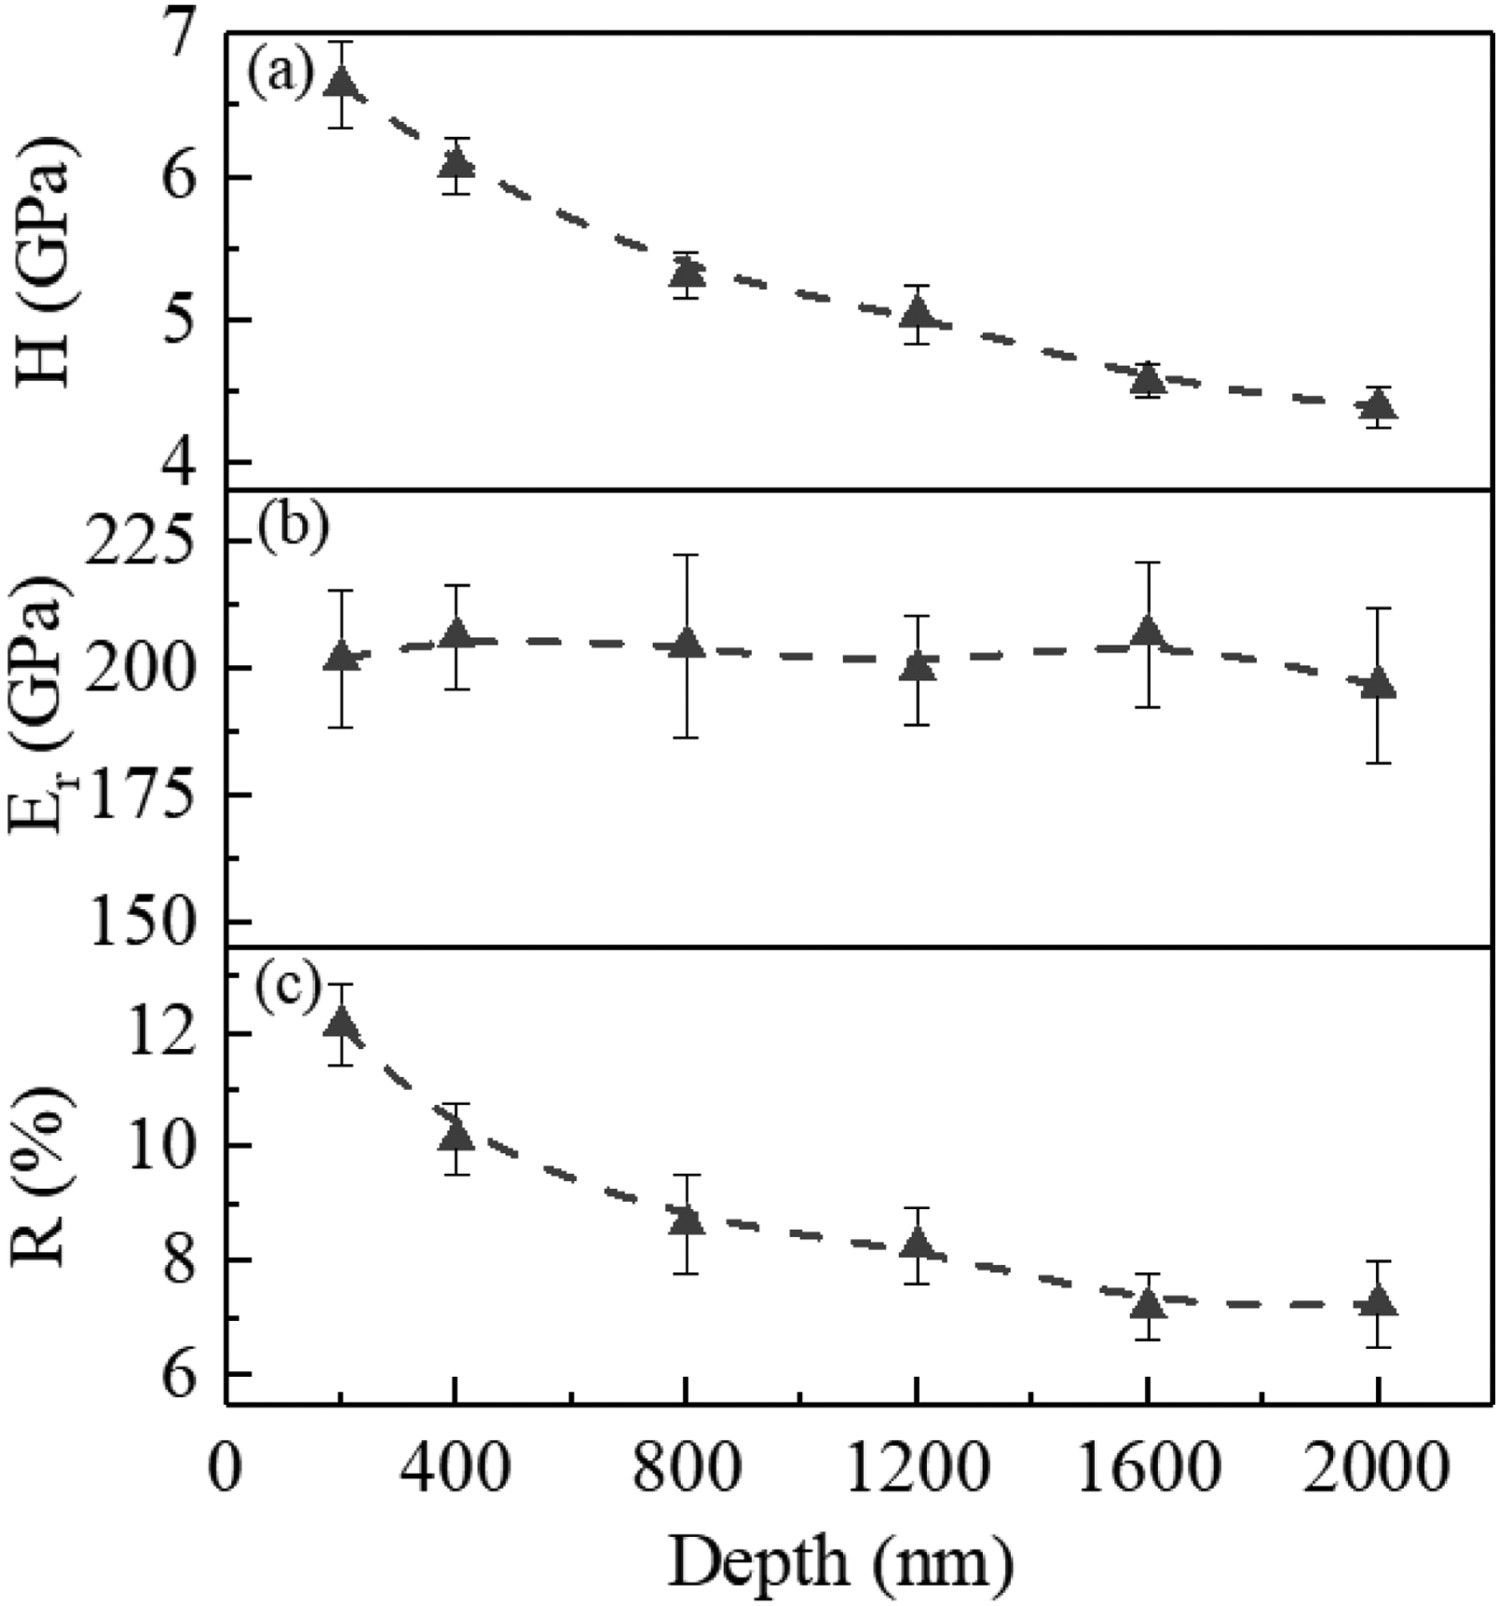
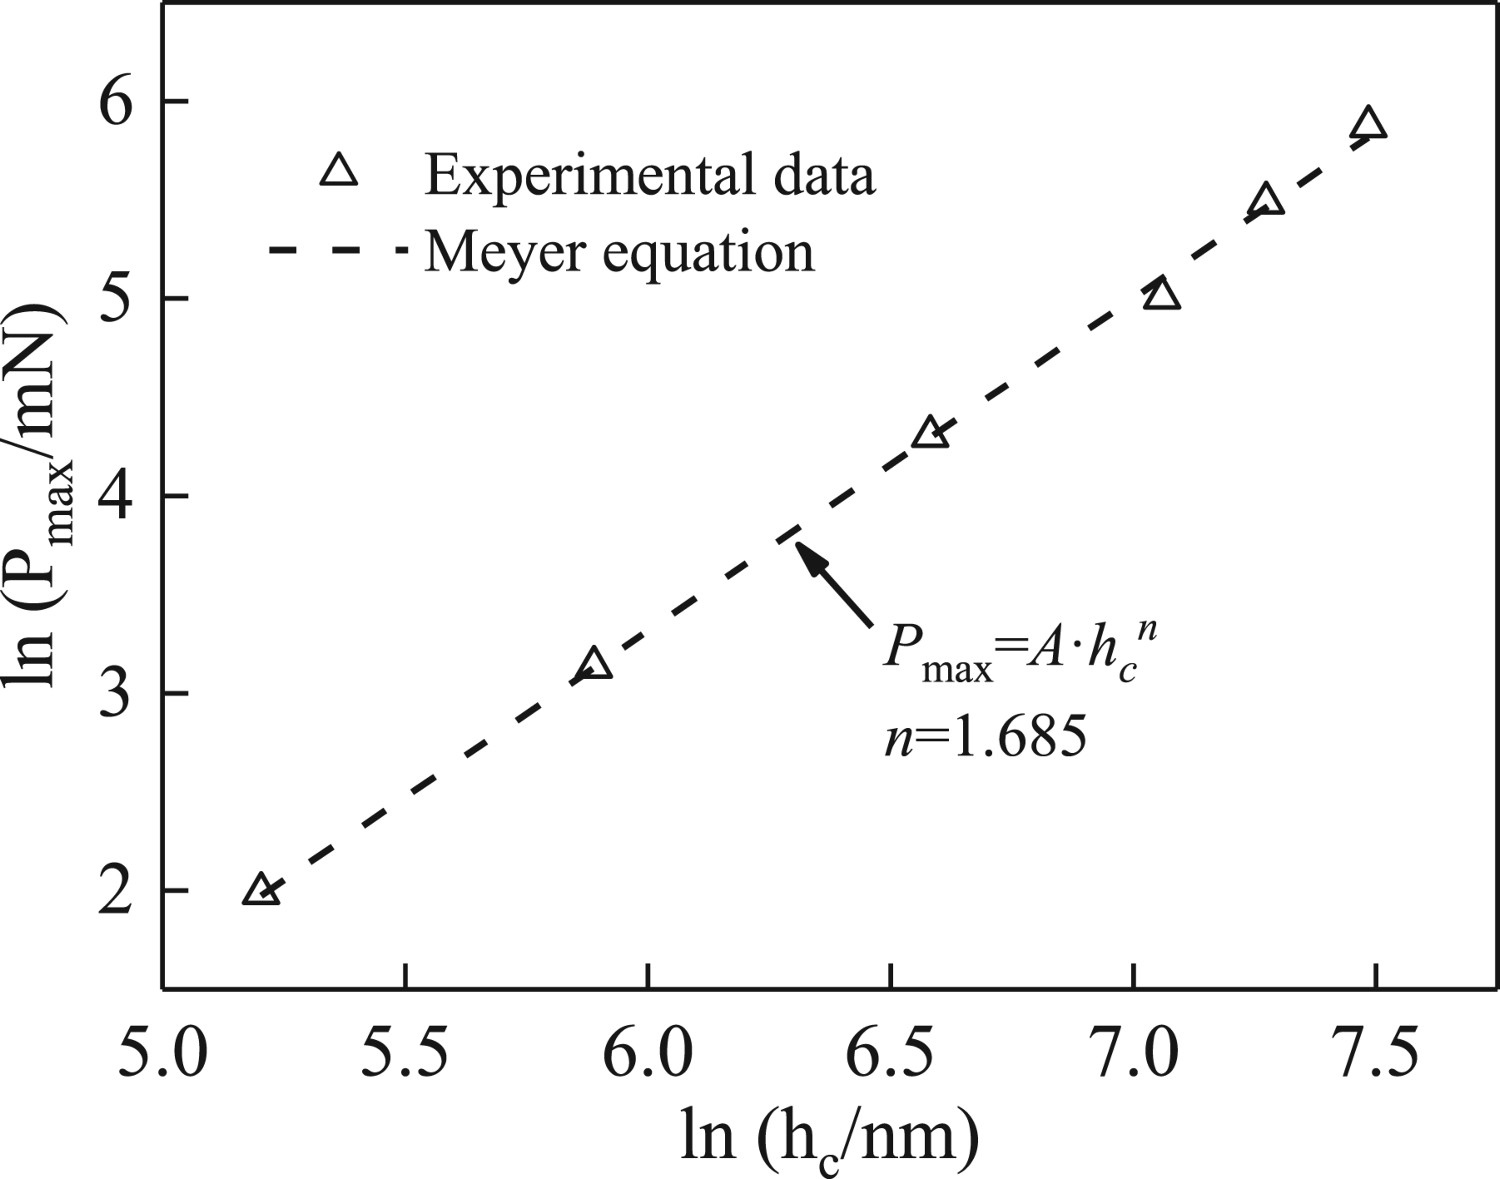
Meyer model
The Meyer equation based on the energy balance method is the most widely utilised method to describe the size effects [21]; it describes the relationship between the maximum load Pmax
and the indentation contact depth hc
; see the following:
Fitting curves of ln Pmax
and ln hc
based on Meyer model.
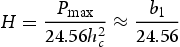
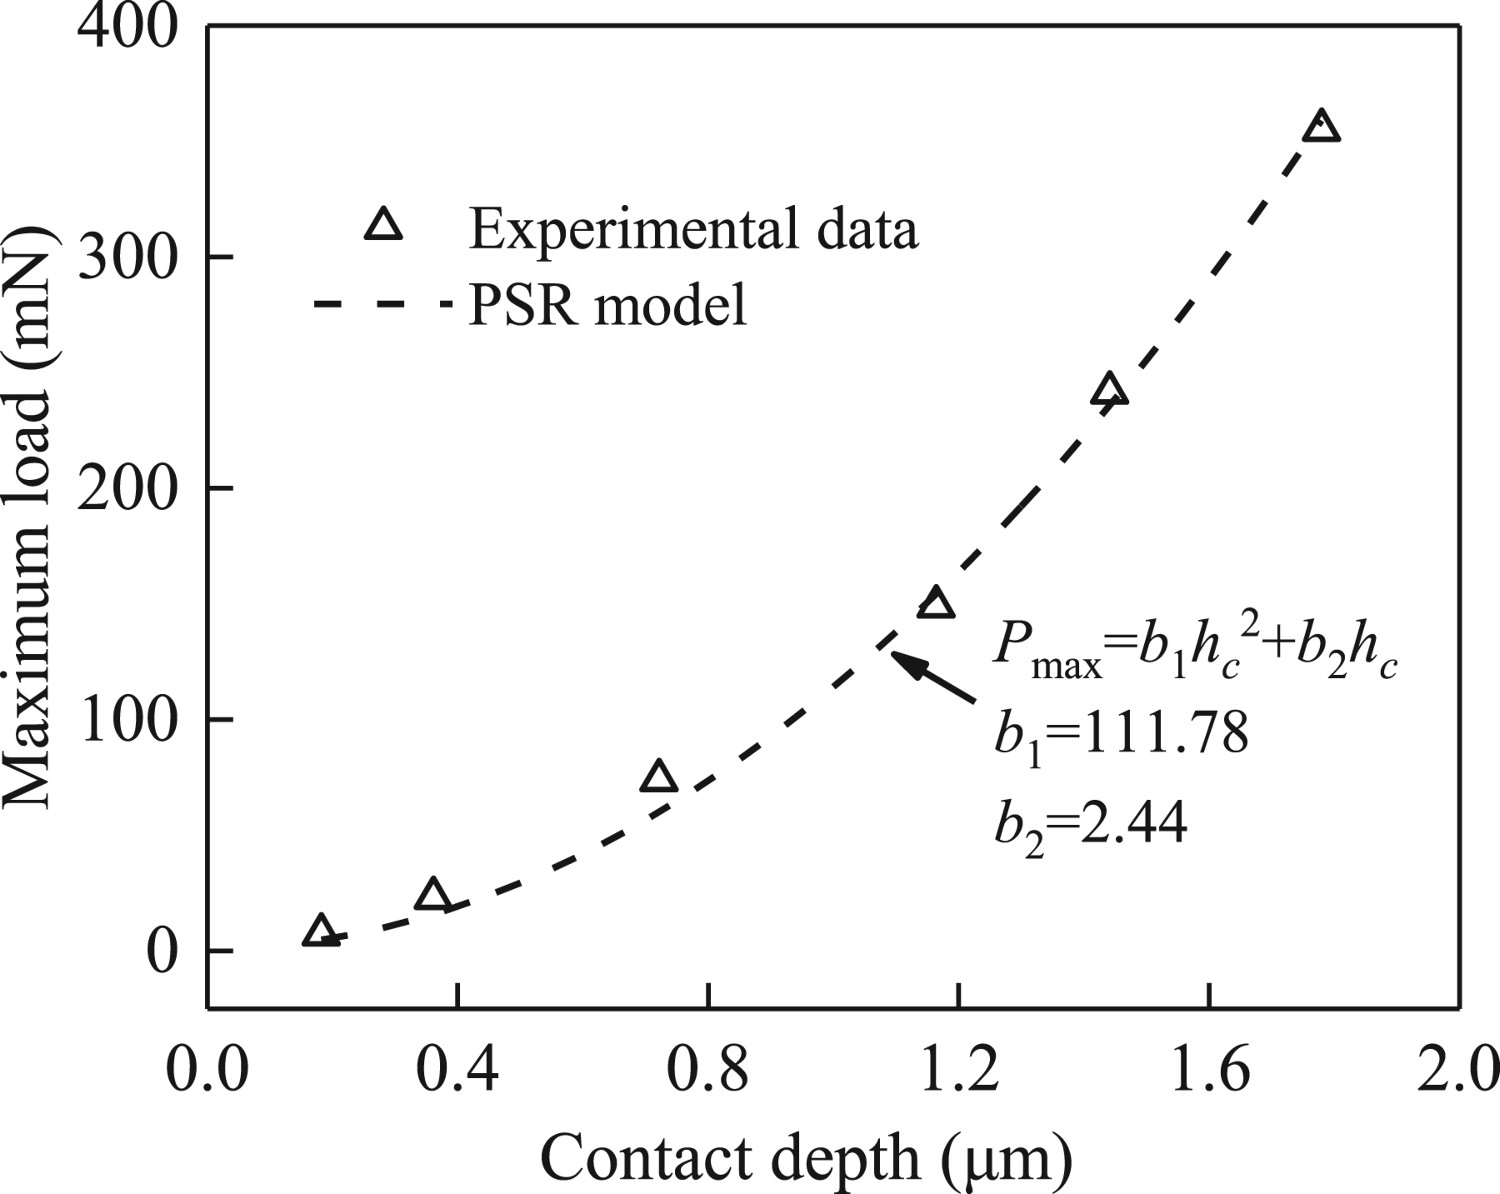
Proportional specimen resistance (PSR) model
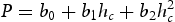
Li and Bradit [35] proposed a PSR model which considers both the elastic resistance of the material and frictional effects between the indenter facet and specimen interface during indenting. As the model indicates, the resistance caused by the friction between specimen and indenter has been offset by part of the load due to the elastic deformation of the material during loading. The expression for this model is:
Fitting curves the experimental results of Pmax
and hc
based on PSR model.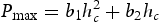
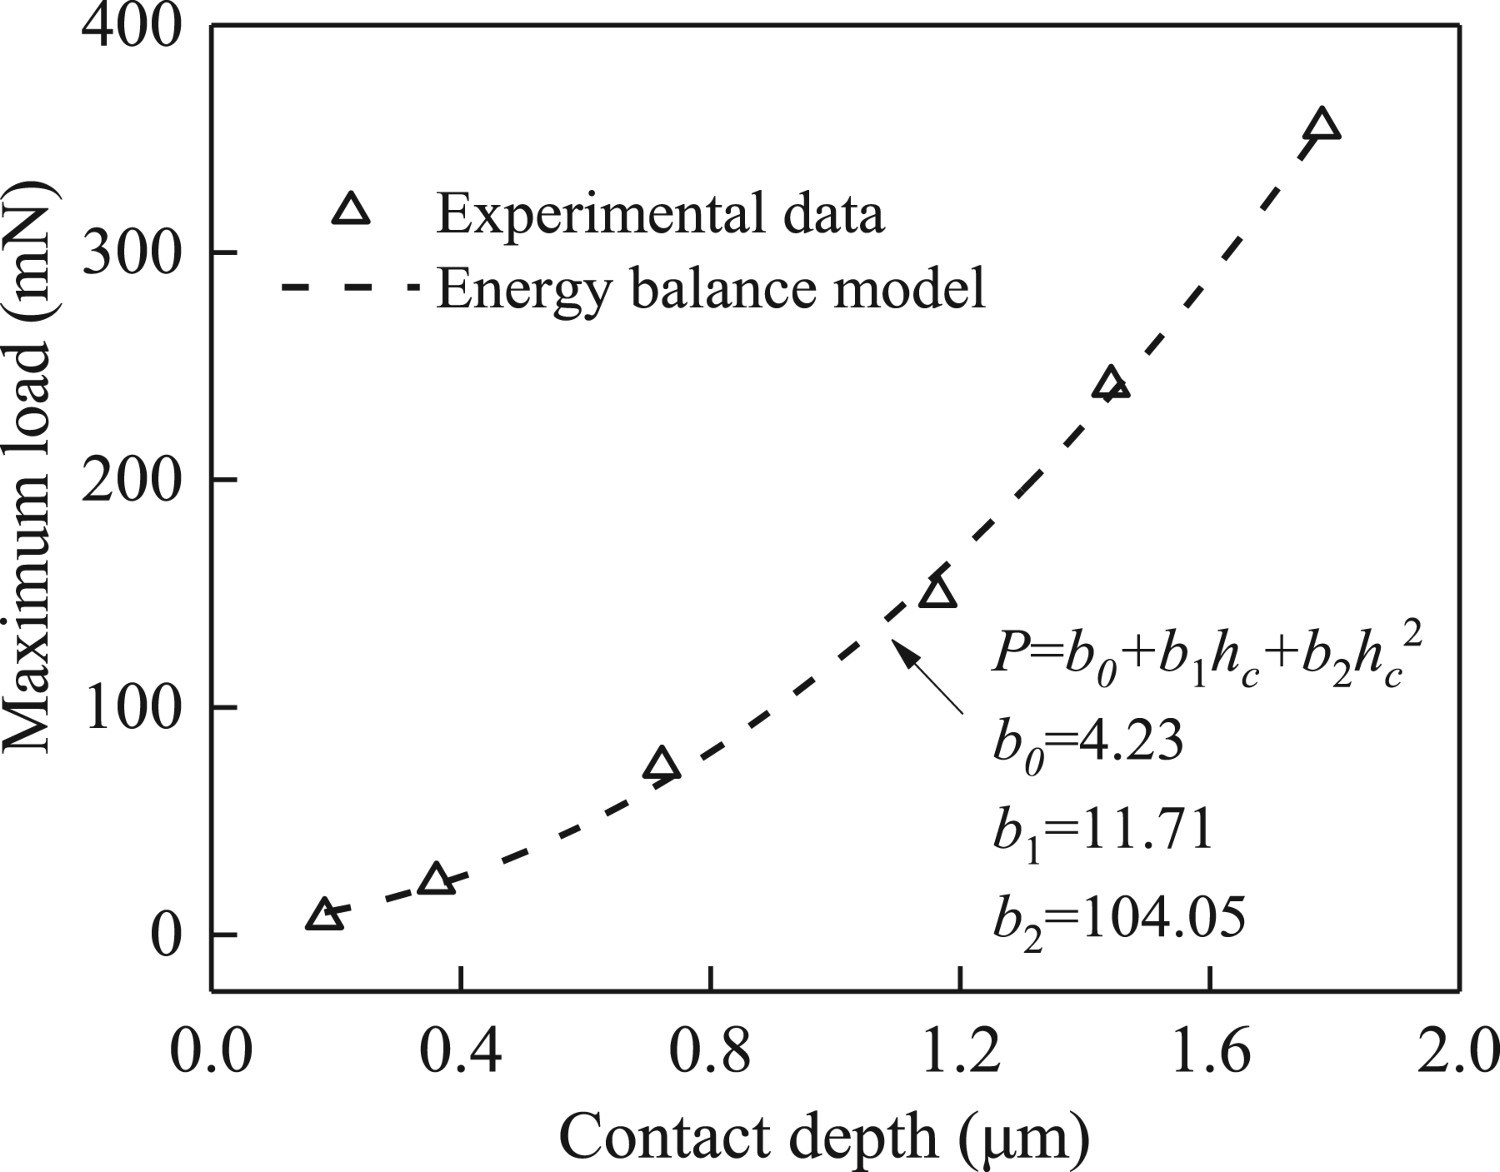
Energy balance model
Gong et al. [36] and Mukhopadhyay et al. [37] argued that PSR model is only applicable to data in a narrow range of loads, so they proposed correction to the PSR model, multiplying both sides of the Equation 4 in Section Energy balance model by the contact depth (h
c), and the energy balance model is given as follows:
Fitting curves the experimental results of Pmax
and hc
based on energy balance model.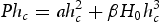
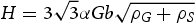
 is the energy consumed to produce a new surface, and
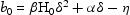
 is the work done to produce permanent deformation. When η is used to denote the error of the load force P generated by the instrument, δ denotes the error of the indentation size hc
, then the Equation (6) can be expressed as:
is the work done to produce permanent deformation. When η is used to denote the error of the load force P generated by the instrument, δ denotes the error of the indentation size hc
, then the Equation (6) can be expressed as:
 ,
,
 ,
,
 , and b0
reflects the systematic error and the residual stress of the specimen. For Berkovich indenter, the hardness of material can be calculated based on Oliver–Pharr theory:
, and b0
reflects the systematic error and the residual stress of the specimen. For Berkovich indenter, the hardness of material can be calculated based on Oliver–Pharr theory:
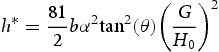
Nix–Gao model
The model proposed by Nix and Gao [22] based on the theory of gradient strain of Fleck and Hutchinson [38] is a milestone of the models, which neglected the interaction between geometrically necessary dislocations (GNDs) and statistically stored dislocations (SSDs), and assumed the total dislocation density (ρ) is simply the summation of SSDs (ρS
) and GNDs (ρG
); the variation of indentation hardness (H) as a function of the indention depth (h) is given by:
Nonlinear fitting curve of H−h based on Nix−Gao model [22].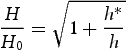
Analysis on data obtained from spherical indentation
As observed in Figure 11, the hardness measured by spherical indenter increases with the increment of maximum indenting depth, while the reduced modules and elastic recovery rate values drop and level off with the load growth. The above load-dependent hardness for spherical indenter has also been reported by other researchers [24,40,41]. When adopting the self-similar (geometrically) Berkovich indenter, the stress varies at various load/displacement for indentation though the strain remains constant due to the self-similar geometry, indicating the existence of the indenting size effect. However, for spherical indenter, the strain is continuously varying so the stress required will also vary, which should not be confused with ISE. Herein, the part of spherical indenter is not included when dealing with ISE and is analysed separately with stress–strain diagram in this section.
(a) Hardness-depth curves; (b) reduced modulus-depth curves; (c) elastic recovery rates-depth curves for different maximum indentation depths by spherical indenter.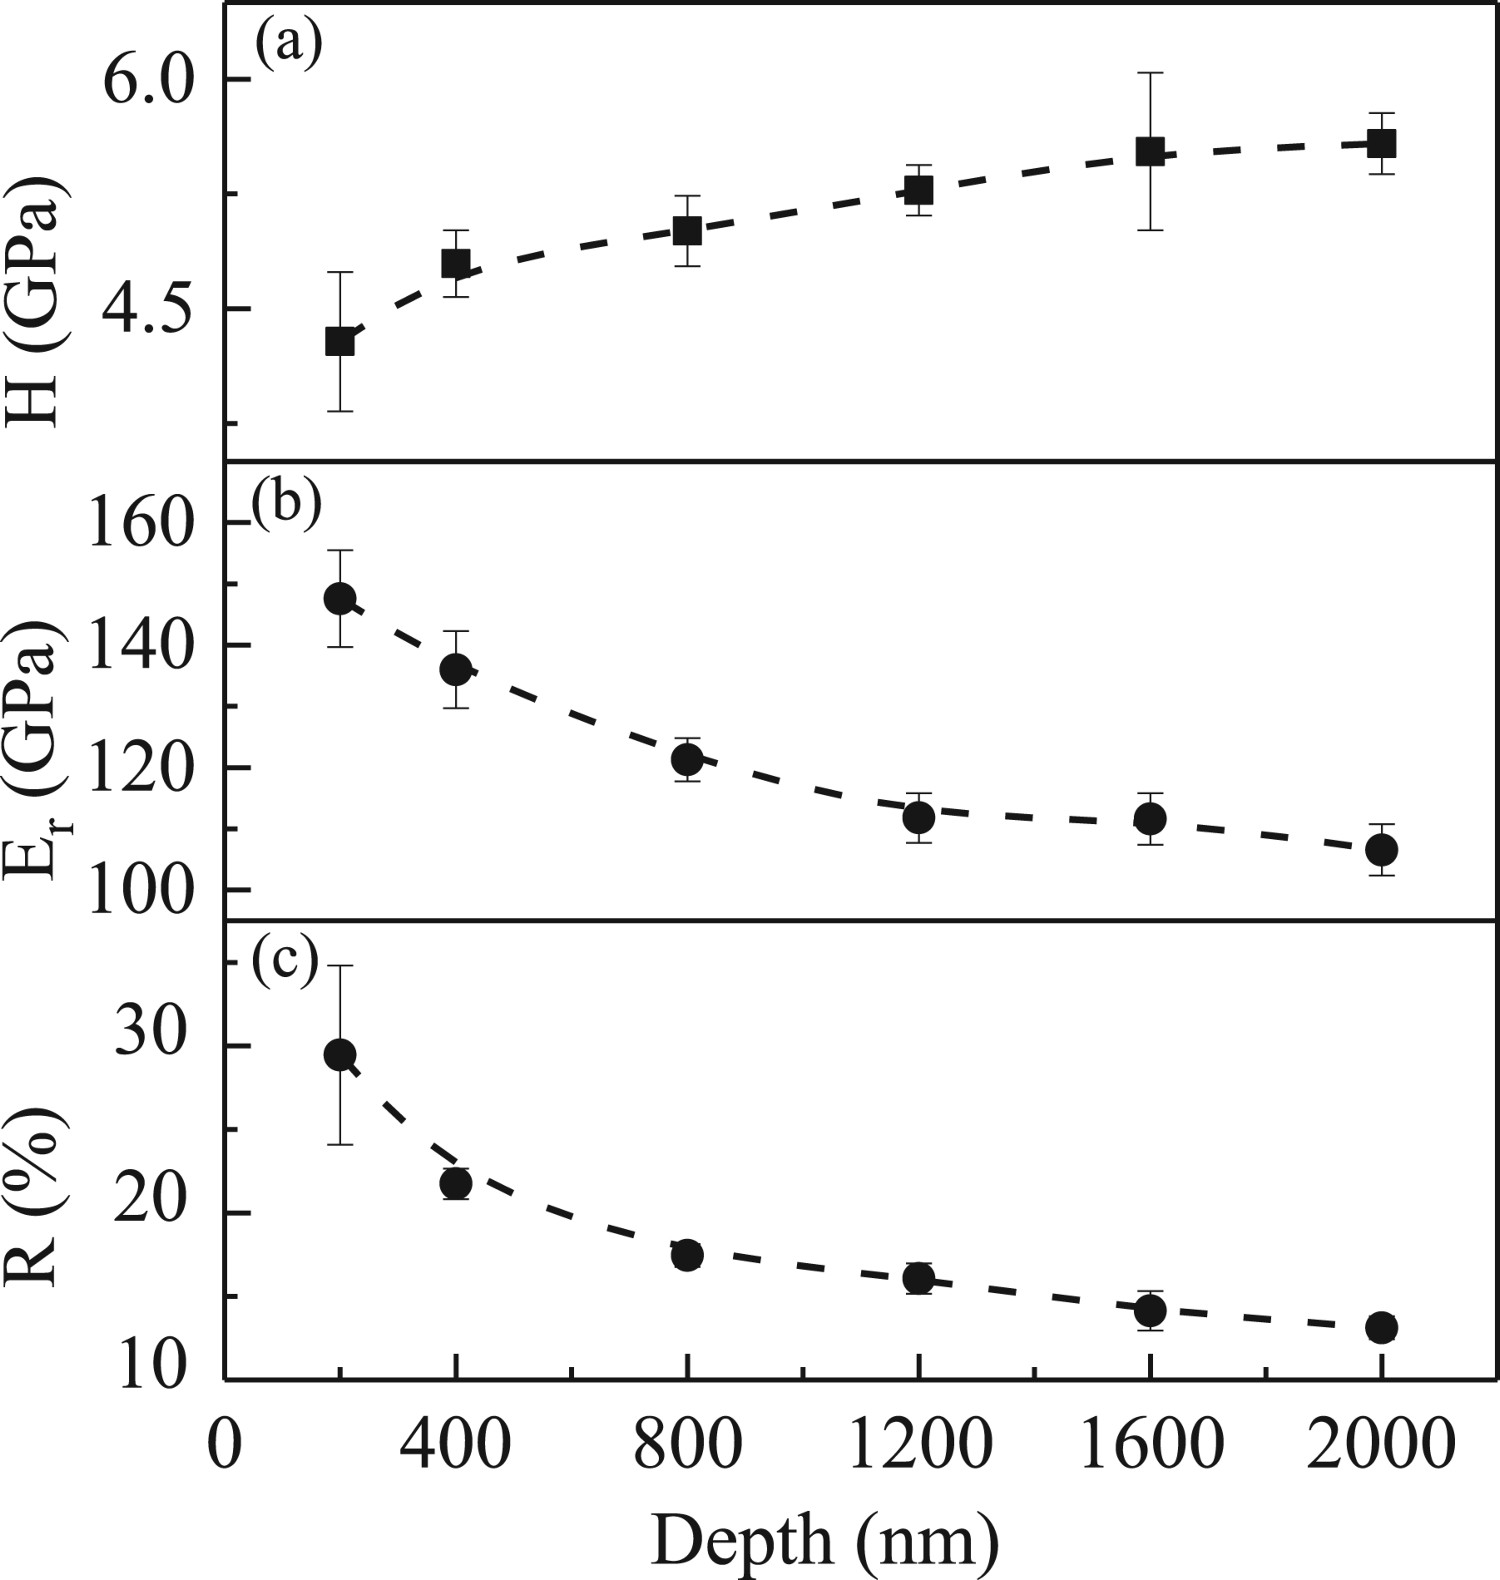
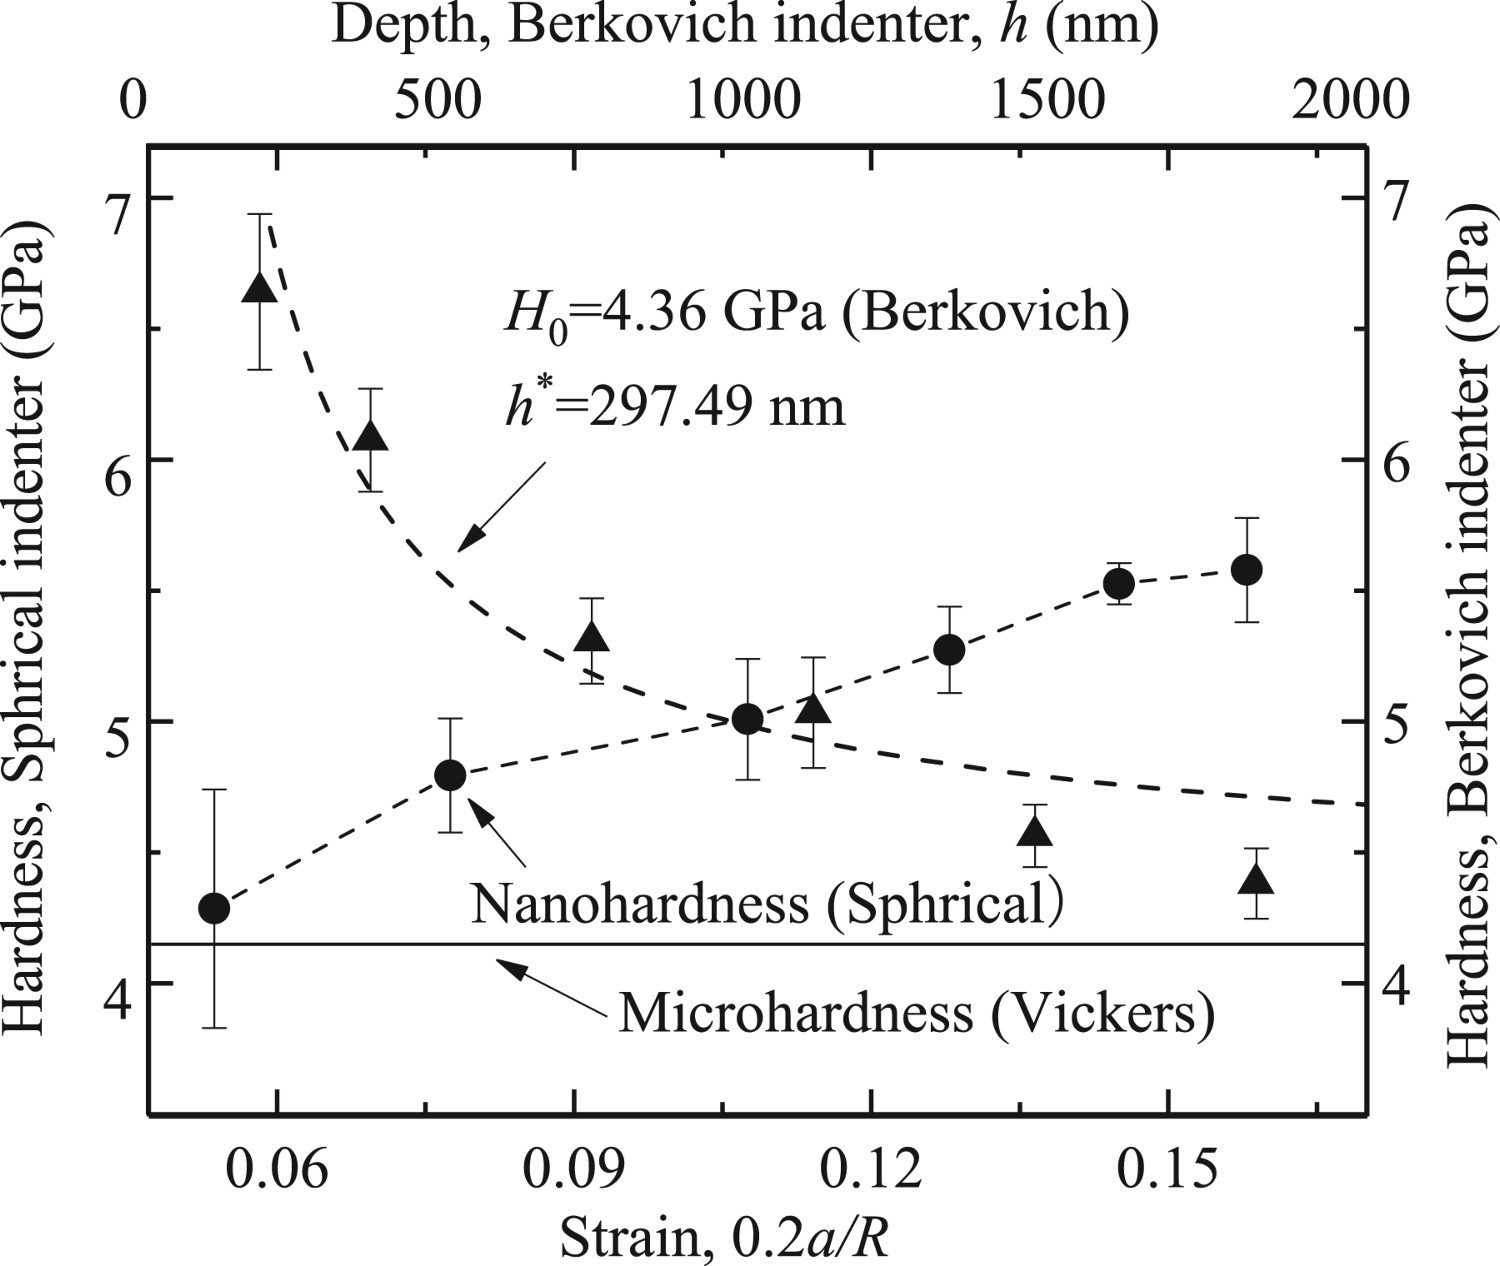
Figure 12 displays the relationship between hardness and 0.2a/R for the spherical indenter used in this study, where R is indenter radius and a is contact radius. For the spherical indenter, Johnson [42] has shown that by using a strain of 0.2a/R, the indentation data can be compared to the tensile data. It is known that the values of hardness are related to local elastic and plastic deformation [43]. The measured hardness increases rapidly as a result of the transition from elastic-dominated deformation to plastic dominated [42]; and the growth rate levels off with the growth of the indenting displacement. And such variation of hardness with strain for spherical indenter is not an indentation size effect as discussed above. Unlike sharp indentation, Swadener et al. [44] and Kucharski et al. [24] have found out that the hardness increases with the decrease of indenter's own size (radius) when the indenter's shape remains spherical and the maximum indenting depth keeps the same. It has been reported that the spherical indenter does not show depth dependence in hardness but show a dependence on the radius of the sphere, i.e. H2∼1/R relationship,
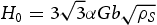
Stress-strain diagram: relation between hardness and strain (0.2a/R) for the spherical indenter (•); experimental hardness values and their fitting curve for Berkovich indenter (▴ and dotted line); microhardness measured by Vickers (solid straight line). where R* is material length scale [44], and that qualitatively agrees with H2∼1/h proposed in previously discussed Nix–Gao model. In this research, we do not carry out nanoindentation testing with spherical indenters of different sizes, so the H2∼1/R relationship cannot be justified. The hardness due to SSDs based (H0
), 4.36 GPa, is predicted by Nix–Gao model with a confidence coefficient of 0.911 and the hardness measured by spherical indenter at the smallest a/R = 0.26 is 4.68 GPa. The microhardness value is measured to be approximately 4.15 GPa (424 HV) employing Vickers indenter, which agrees with the above experimental nanoindentation results in the same order of magnitude.
where R* is material length scale [44], and that qualitatively agrees with H2∼1/h proposed in previously discussed Nix–Gao model. In this research, we do not carry out nanoindentation testing with spherical indenters of different sizes, so the H2∼1/R relationship cannot be justified. The hardness due to SSDs based (H0
), 4.36 GPa, is predicted by Nix–Gao model with a confidence coefficient of 0.911 and the hardness measured by spherical indenter at the smallest a/R = 0.26 is 4.68 GPa. The microhardness value is measured to be approximately 4.15 GPa (424 HV) employing Vickers indenter, which agrees with the above experimental nanoindentation results in the same order of magnitude.
Analysis of indentation size effects for indenting creep behaviour
In this section, we discuss the size effects in the case of indentation creep, that is, the influence of different indenting depths on the detected creep behaviours. The typical peak load-sensitive P−h curves with different depths 200, 400, 800, 1200, 1600 and 2000 nm for 120 s employing Berkovich tip are displayed in Figure 13. The loading curves are overlapped for all P−h curves, implying a good repeatability. A plateau can be observed for all curves, whose width represents the creep depth and height indicates the maximum load, and the plateau depth and indenting load during creep both increase with the growth the setting depth. The plateau data during dwell stage are utilised to research the creep behaviour of the alloy.
Typical peak load-sensitive P−h curves for six different setting depths with Berkovich tip.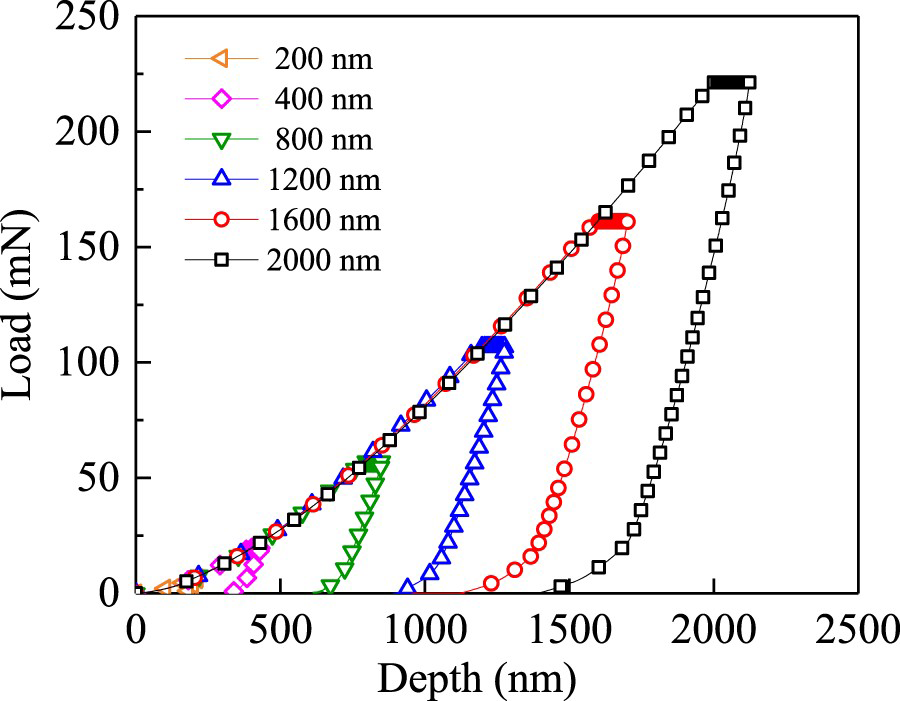
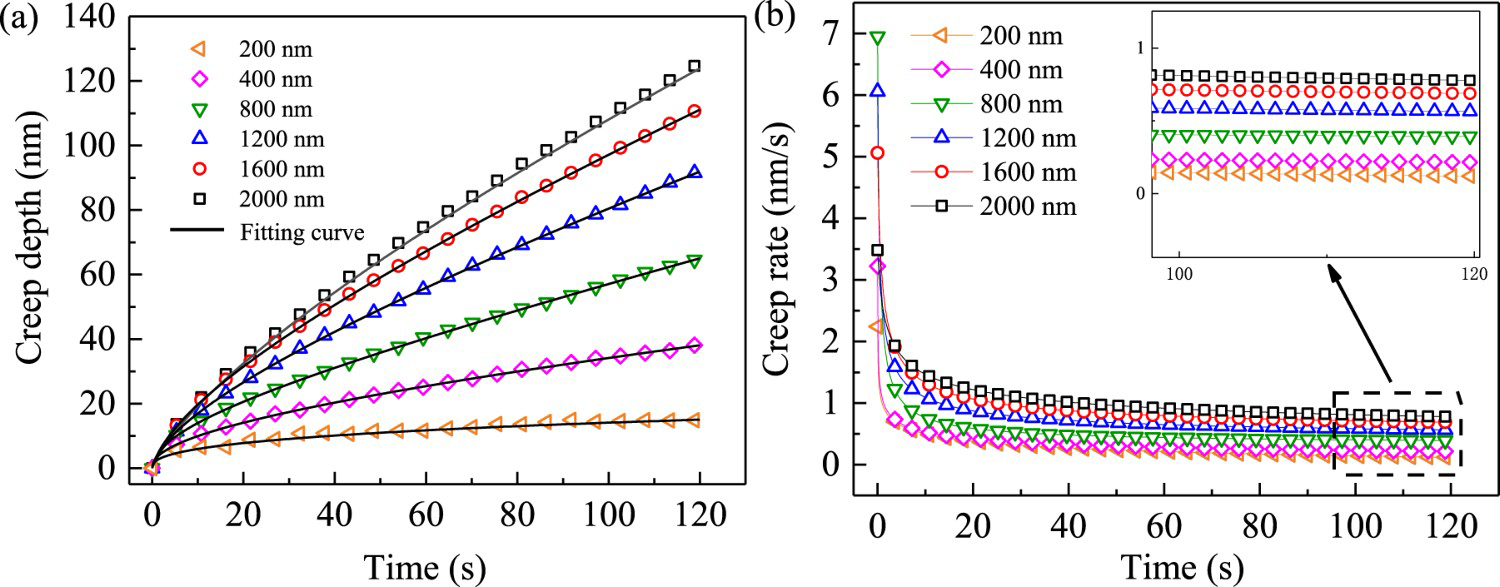
Figure 14 displays (a) the creep depth versus time (h-t) and (b) creep depth rate versus time (h-t) under different stationary loads corresponding to the setting depths. h is the indentation depth during the holding stage.
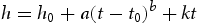
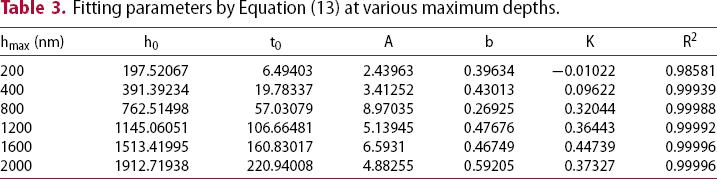
(a) Nonlinear fitting curves of creep depth−time and the fitting parameters are listed in Table 3; (b) creep rate–time curves under different maximum depths. Fitting parameters by Equation (13) at various maximum depths. is creep rate and can be calculated by fitting h-t curve during holding time with the following empirical law [45]:
For Berkovich indenter, creep strain rate
(a) Creep strain rate and (b) hardness as a function of dwell time for different indenting depths. Double logarithmic plot of creep strain rate vs. instantaneous stress and variations of creep stress exponent for different set depths. [46] and indentation contact stress or nanoindentation hardness (σ) [7] can be expressed respectively as follows:
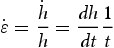

 is creep rate, P is holding load, Ac
is projected contact area. The calculated creep strain rate and hardness as a function of dwell time for different indenting depths are displayed in Figure 15. The variation tendency of creep strain rate versus dwell time is similar to creep rate of Figure 14(b), but the nanoindentation of the deepest indenting depth exhibits the smallest creep strain rate. It is obvious that it takes longer time for 200 and 400 nm depth to reach the steady creep strain rate stage. Overall, the instantaneous hardness declines as a function of dwell time for a specific set depth, and the hardness values are greater for small depths.
is creep rate, P is holding load, Ac
is projected contact area. The calculated creep strain rate and hardness as a function of dwell time for different indenting depths are displayed in Figure 15. The variation tendency of creep strain rate versus dwell time is similar to creep rate of Figure 14(b), but the nanoindentation of the deepest indenting depth exhibits the smallest creep strain rate. It is obvious that it takes longer time for 200 and 400 nm depth to reach the steady creep strain rate stage. Overall, the instantaneous hardness declines as a function of dwell time for a specific set depth, and the hardness values are greater for small depths.
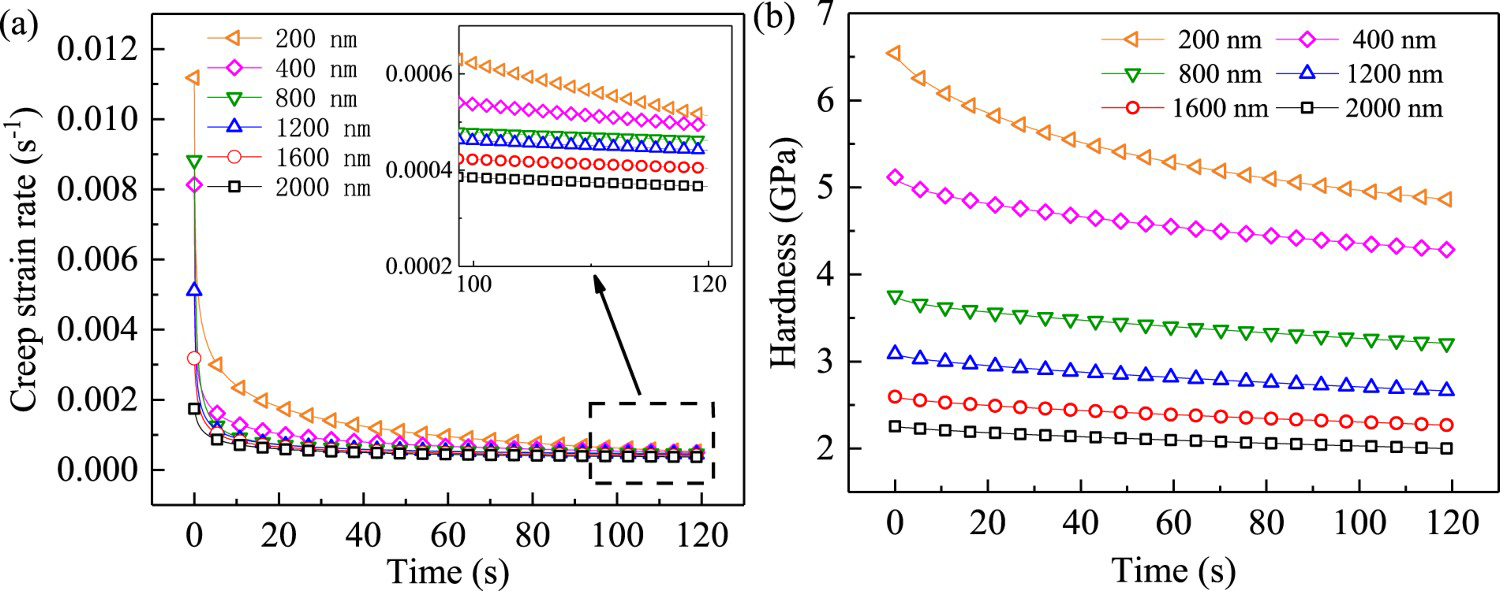
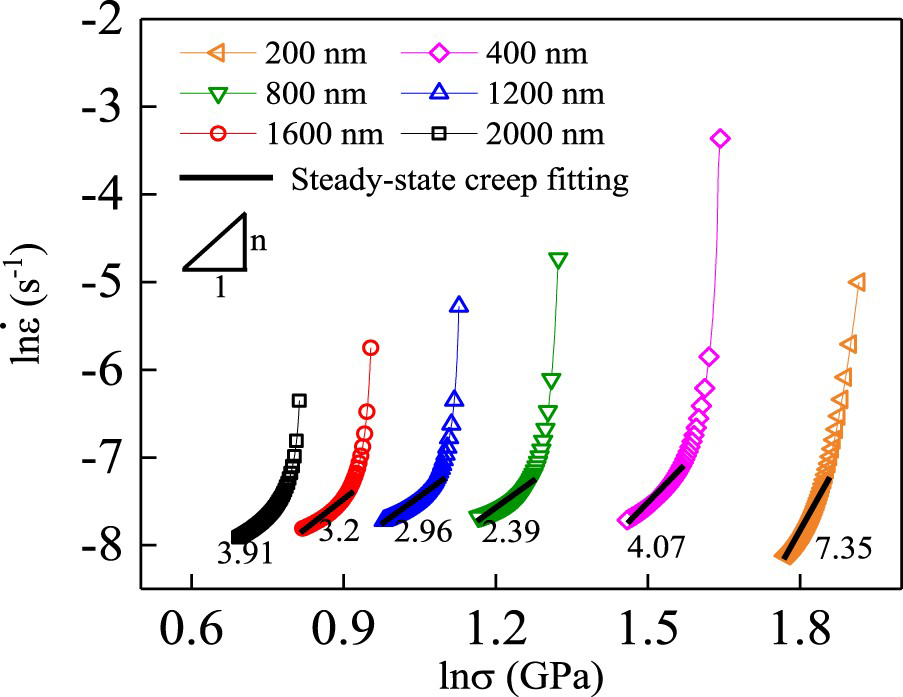
Figure 16 demonstrates double logarithmic plot of creep strain rate vs. hardness and variations of creep stress exponent at different set depths. The relationship between strain rate
 and the applied stress (σ) can be established upon the power law equation [47]:

 and σ under isothermal conditions:

Creep stress exponent n is an important parameter to study material's creep behaviour, which reflects the stability of creep resistance; meanwhile, it can reflect the deformation mechanism for the dwell stage of indenting testing. The diffusion creep is dominant when n values is below 1, when n is between 1 and 2 the main creep deformation mechanism is grain boundary diffusion control or lattice diffusion control, and when creep stress exponent is greater than 3, the creep mechanism is associated with dislocation movement such as dislocation glide (n ≈ 3) and dislocation climb (n > 4) [48,49]. Zhang et al. [16] measured the creep stress exponents of signal crystal Ni-based superalloy DD407 under different loading rates and applied peak loads, which are between 3.82 and 7.10, implying a dislocation controlled deformation. The apex radius of indenter tip is around 200 nm, so the contact area is small, resulting into very high stresses in nanoindentation compared to those developed during uniaxial tensile/compressive tests [50], which allows dislocations to glide through the lattice and obstacles by either passing or shearing them. Also, according to the deformation mechanism map given by Frost and Ashby [51], the dominant mechanism is dislocation glide plasticity under room temperature around 298 K. So, it is reasonable that the dominant deformation mechanism is dislocation glide during loading stage at room temperature in this research. The slope values of the curves in Figure 16 are different for different points, and the creep stress exponent is obtained at the steady-state creep, ranging from 2.39 to 7.35, which indicates the creep mechanisms are dominated by dislocation control.
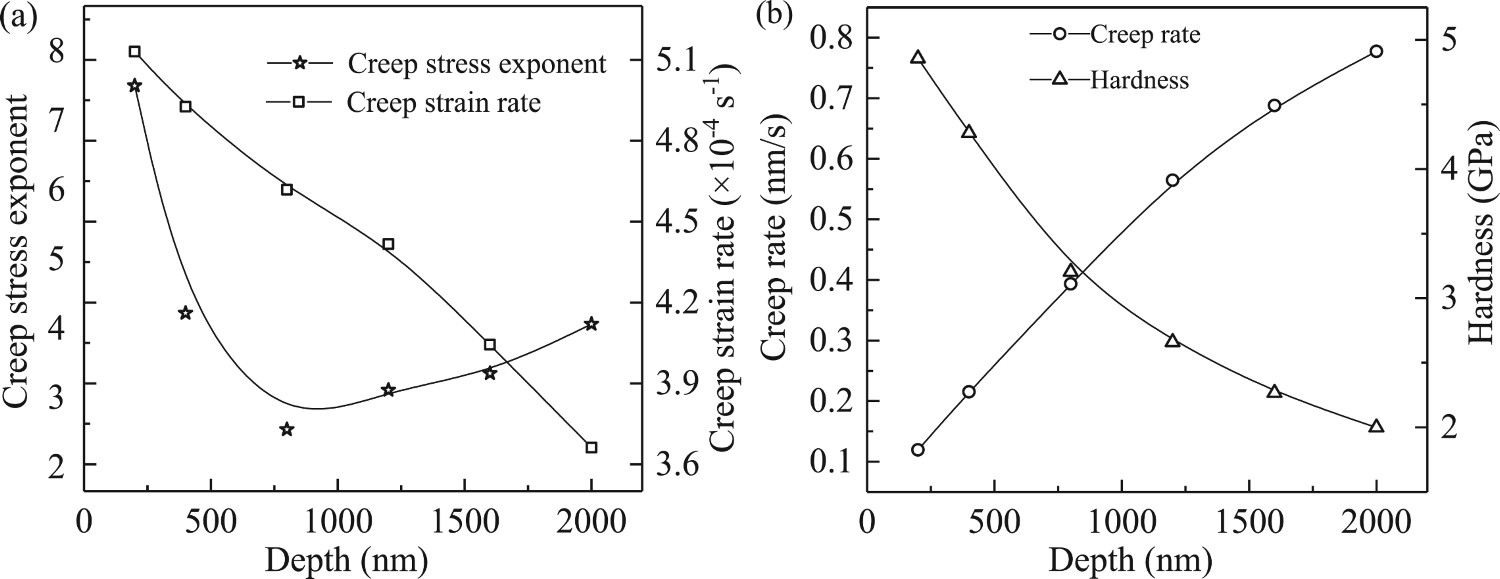
As displayed in Figure 17(a), the creep stress exponent (n) ranges from 2.39 to 7.35, it decreases with depth for shallow indentations, then it grows up as indenting depth increases; and the smallest n value occurs at the depth of 800 nm. The trend of n value decreasing with depth has been reported by references [16,52], meanwhile n increasing with depth has also been observed in references [45,53,54]. For shallow indentations 200 and 400 nm, it takes longer time to reach the stable creep stage (Figure 15a), and thus large n values are obtained. With the increment of depth, the change rate of creep strain rate with respect to time remains constant in steady state creep stage, and the rate of variation for hardness becomes smaller for large depths, also see Figure 15, which results into an increasing creep stress exponent versus depth. So, Sambhava et al. [53] proposed equation
The variations of (a) creep stress exponent and creep strain rate and (b) hardness and creep rate, as a function of maximum indenting depths. to calculate n, in which K is a constant correlated with indentation size effect. The creep strain rate, creep rate, and hardness are also displayed in Figure 17(a) and (b), with which their dependency on depth of impression, i.e. size effect, can been clearly demonstrated. The creep strain rate and hardness increase with depth whereas a contrary trend was observed for the creep rate and creep stress exponent. The stored elastic strain energy during constant loading rate stage grows with the maximum indenter load, and it releases in constant creep stage, and thus the corresponding maximum creep displacement will increase with indenting depth and leads into larger creep rate with same creep time scope. But creep strain rate still shows a downtrend with maximum load because large creep displacement values for deeper indentation would appear in the denominator in the calculation.
Conclusions
In this study, we employed nanoindentation technology to study the indentation size effect of GH901 concerning mechanical properties and creep performance with different maximum indenting depths varying from 200 to 2000 nm with Berkovich and spherical indenter. The main results are as follows:
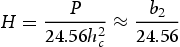
The hardness tends to decrease and the reduced module rarely changes with increased depth for Berkovich indenter, and the hardness increases with the growth of the depth while the reduced module changes in the opposite direction for spherical tip. Indentation size effect for hardness is observed for Berkovich indenter, and it is further analysed by different models. The exponent of Meyer equation is 1.685, lower than 2, implying a significant normal size effect. Based on PSR model, the values of for b
1 and b
2 are 111.78 and 2.44 respectively and the indentation hardness 4.55 GPa is calculated, while the hardness obtained based on the energy balance model is 4.23 GPa. The hardness due to statistically stored dislocations is 4.36 GPa with a characteristic length (h*) of 297.49 nm employing Nix-Gao model. The hardness measured by spherical indenter increases with the increment of maximum indenting depth; previously proposed H2∼1/R relationship for spherical tip can't be verified, because nanoindentation testing with spherical indenters of different sizes is not implemented in this research. The hardness due to SSDs based (H
0) 4.36 GPa is predicted by Nix-Gao model with a confidence coefficient of 0.911 and the hardness measured by spherical indenter at the smallest a/R = 0.26 is 4.68 GPa. The microhardness value is measured to be 4.15 GPa (424 HV) employing Vickers indenter, which agrees with the above experimental nanoindentation results. The creep performance of different indenting depths sustaining for 120 s are obtained with Berkovich indenter. The results indicate a negative relationship between hardness and depth, and between creep strain rate and depth; the creep stress exponent decreases firstly and then increases with the depth increasing. The creep mechanisms are dominated by dislocation based on the calculated creep stress exponents, in a scope of 2.39–7.35.
Footnotes
Disclosure statement
No potential conflict of interest was reported by the author(s).
Correction Statement
This article has been corrected with minor changes. These changes do not impact the academic content of the article.