
Abstract
A casting Mg–3Gd–0.6Zr alloy was designed to evaluate the effect of cuboid-shaped phase on its mechanical properties. The morphology of cuboid-shaped phase was correlated with the directional covalent bonding between Gd atoms and H atoms along <100 > directions. The cuboid-shaped phase can be eliminated by a designed annealing treatment, without grain coarsening simultaneously. The ductility of as-cast alloy is about 20% higher than that of the annealed one. The improvement of ductility was caused by cuboid-shaped phase in three aspects: first-principle calculations, hydrogen embrittlement and crystal imperfections.
Keywords
Introduction
The cuboid-shaped phase (CSP) is observed in many kinds of Mg–RE (rare earth) alloys, including the Mg–La [1], Mg–Ce [1], Mg–Nd [1-3], Mg–Y [4,5], Mg–Gd [5-11] and Mg–Dy [5,12] alloys. The casting processes of these alloys are diverse, including the sand casting [1], permanent mould casting [1,4,7,9,10], squeeze casting [3,6], water quenching [5,8,11,12] and melt spinning [2]. CSP is sometimes encountered in the as-cast Mg–RE alloys and is observed more frequently in the solution-treated condition. At first, the CSP was identified as intermetallic both containing Mg and RE elements [4,7-9]. But the lattice constant of CSP cannot match any kind of phases in the corresponding Mg–RE phase diagrams. Afterwards, the CSP was identified to be RE hydrides [1,3,5] and [10-12]. It is a highly thermo stable phase. Solid solution treatment cannot eliminate it. Instead, its size and quantity will be increased after solid solution treatment. For the CSP is a metastable phase, the slow cooling rate is conducive to eliminating it. So, a well-designed annealing is more appropriate than the solid solution to eliminate it. Despite the different Mg–RE alloy systems, it was shown to have a face-centred cubic (fcc) structure with a lattice constant of 0.52–0.56 nm. The formation of CSP is considered to have an adverse effect on mechanical properties, because it will consume RE elements. RE elements are normally present as solutes in the Mg matrix to provide solid solution strengthening or as Mg–RE intermetallic phases in the eutectic to provide dispersion strengthening [1]. But, this is speculation. No direct proof to support this view. In the previous reports, the CSP coexisted with the Mg–RE eutectic phases [3,4,7,9] and [11]. So, the effect of CSP on the mechanical properties of Mg–RE alloys cannot be evaluated precisely.
To investigate the morphology of CSP and precisely evaluate the effect of CSP on the mechanical properties of Mg–Gd alloy, the first step is to design an Mg–Gd alloy, which only contains Mg matrix and CSP. First, in the Mg–Gd phase diagram, the solid solubility of Gd in Mg is 3.8 wt-% at 200°C [13]. This value will further decrease at room temperature. Second, in [14], a series of Mg–xGd–0.6Zr (x = 2%, 4% and 6% mass fraction) alloys were synthesised by semi-continuous casting process. The microstructure of as-cast alloys consists of typical equiaxed grains. The XRD results of as-cast alloys indicated that no second phase but α–Mg solid solution appears in Mg–2Gd–0.6Zr and Mg–4Gd–0.6Zr alloys. However, second phases were detected in Mg–6Gd–0.6Zr alloy. To eliminate the effect of eutectic phases thoroughly, the alloy was designed as Mg–3Gd–0.6Zr (wt-%). A permanent mould casting Mg–3Gd–0.6Zr alloy with micro-scale {10
 2} growth twins in the microstructure was reported [15]. The solutes Gd are segregated on both sides of twinning boundaries and facilitate its formation. The alloy revealed good ductility both in tensile and compressive tests. The tensile elongation of Mg–3Gd–0.6Zr alloy is 14.8%. Meanwhile, the tensile elongations of pure Cu [16] and Al alloy [17], both have growth twins in their microstructure, are 13.5% and 14%, respectively. The compressive elongation of Mg–3Gd–0.6Zr alloy is as high as 50.0%. The compressive true stress–true strain curve has an approximate constant flow stress during the plastic deformation stage. This characteristic plateau was associated with flow stress stability without the work hardening effect. The compressive yield stress was as low as 77 MPa. All these features indicated that the casting Mg–3Gd–0.6Zr alloy is an ideal candidate for wrought Mg alloy.
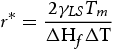
Besides the composition, the cooling rate has a significant effect on the microstructure of the alloy. A higher cooling rate can increase the degree of undercooling (ΔT) during solidification. The relationship between the degree of undercooling (ΔT) and the critical nucleus radius r* can be expressed as [18]
As a universal phase in many Mg–RE alloys, the investigation of CSP is beneficial to reveal the strengthening mechanism of RE elements in Mg alloys. So, the first aim of this work is to investigate the formation mechanism of this morphology. The second aim is to evaluate the effect of CSP on the mechanical properties of the designed Mg–Gd–Zr alloy. The accurate evaluation of CSP on mechanical properties of Mg–3Gd–0.6Zr alloy is expected to lead to insights into the design of alloy compositions and thermomechanical processes.
Experimental procedures and computational methods
Two cylindrical ingots, with the same diameter of 88 mm, were prepared by an electric resistance furnace under the mixed atmosphere of CO2 and SF6. One ingot was cooled in the air (GK30I alloy) and the other was cooled into cooling water (GK30II alloy) with the crucible, respectively. The chemical composition was determined by using inductively coupled plasma atomic emission spectroscopy (ICP–AES) and the results were Mg–2.54Gd–0.64Zr (wt-%, GK30I) and Mg–2.82Gd–0.61Zr (wt-%, GK30II), respectively. The sample for annealing treatment was cut from the as-cast GK30II alloy and sealed with graphite. A designed annealing treatment was performed on GK30II alloy to eliminate CSP. According to the Mg–Gd phase diagram, the eutectic temperature is 542°C in the Mg-rich corner [13]. So, the maximum temperature should be lower than the eutectic temperature but close to it. By experimentations, the maximum temperature was determined at 535°C. During the heating process, atwo-step program was set. It is beneficial to get a homogenous microstructure [24]. During the cooling process, multistep heat preservation was set up to eliminate the non-equilibrium conditions. The preservation times were doubled with the decreased temperatures. Both the heating and cooling rate is 1°C min–1. When the temperature was lower than 200°C, precisely controlling the temperature is impossible in the muffle furnace. So, the power of the furnace was shut down and the furnace was opened after one day. The schematic diagram of the annealing procedure is shown in Figure 1. The preparation of the annealed sample is the same with as-cast samples. The tensile specimens were machined by electrical discharge machining with 5 mm in diameter and 25 mm in length in the gauge section. The results of ultimate tensile strength (UTS), tensile yield strength (TYS, offset = 0.2%) and tensile elongation to fracture (ET) were the average of at least three specimens.
Schematic diagram of annealing procedure.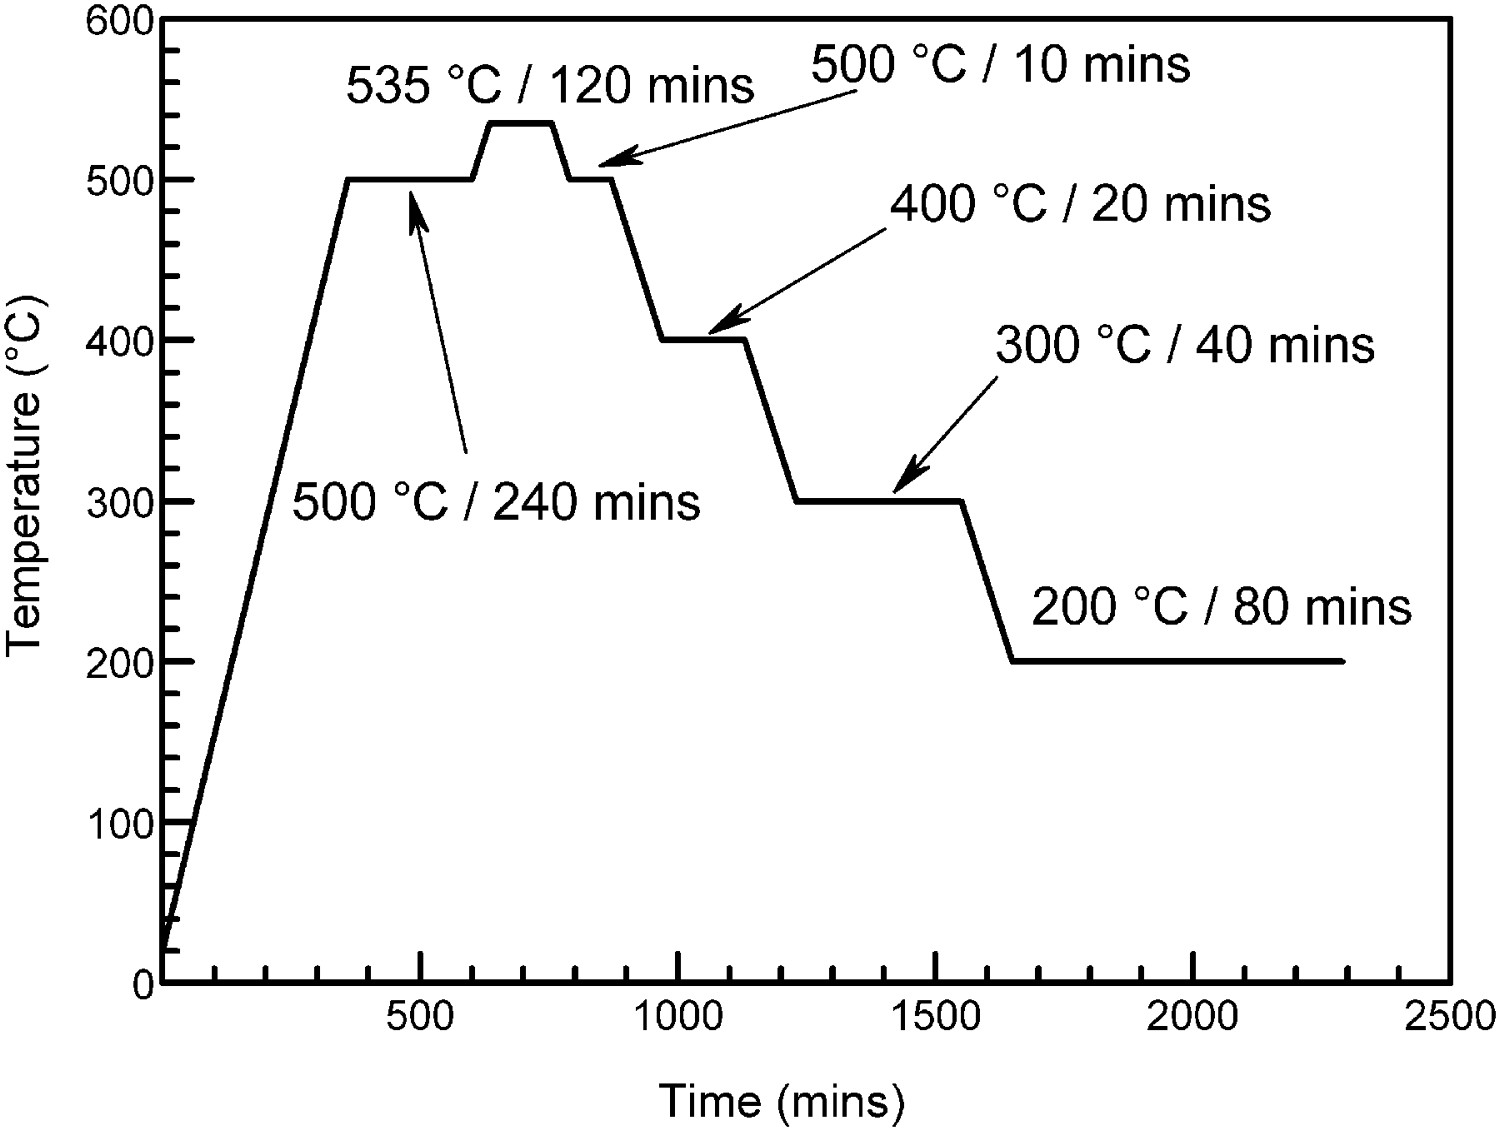
The microstructure of the alloys was observed with an optical microscope (OM, Zeiss, Axio Observer A1) and field emission scanning electron microscope (FE–SEM, JEOL, JSM–7800F) with an energy dispersive X-ray spectrometer (EDS). The preparation of samples for OM and FE-SEM examinations was carried out in three steps: (i) grind with ethanol; (ii) electropolishing; (iii) etching in 4 vol.-% nital. The average grain size was measured by the linear intercept method over 500 grains using OM images. For transmission electron microscopy (TEM) examinations, discs of 3 mm diameter and 0.5 mm thickness were prepared from the bulk sample by electrical discharge machining and then ground to 0.05 mm, followed by ion milling using a Gatan Precision Ion Polishing System (PIPS 695). The TEM observation was carried out on an FEI Tecnai G2 F20 electron microscope. Atomic-resolution high-angle annular dark-field scanning transmission electron microscopy (HAADF-STEM) was conducted on an FEI Titan G2 60–300 ChemiSTEM, equipped with a Cs probe corrector and a Super-X EDS with four windowless silicon-drift detectors.
First-principle calculations based on density functional theory (DFT), within the generalised gradient approximation (GGA) as incorporated in the Vienna Ab Initio Simulation Package (VASP) are employed [25,26]. Projector augmented wave method (PAW) in the GGA with the Perdew–Burke–Ernzerhof functional (PBE) was implemented in the VASP. According to the results of TEM, CSP in GK30II alloy was identified as GdH2. Its supercell was illustrated in Figure 2. The Brillouin zone was sampled using a Monkhorst–Pack k-points 5 × 5 × 5 grid for GdH2 supercell, 16 × 16 × 8 for H2 supercell and 12 × 12 × 4 for Gd supercell. The valence electron configurations included in the calculations are: Gd (4f, 5d) and H (1s). The cut-off energy was set as 400 eV. The total energy accuracy was 1.0 × 10 −5 eV per atom. The atomic positions were optimised until all Hellman–Feynman forces less than 0.01 eV Å–1. To get stable and accurate results, the geometric structure of crystal cell is optimised until the corresponding parameters reach the required accuracy. Electronic structures of the optimised model were calculated.
Supercell of GdH2 phase.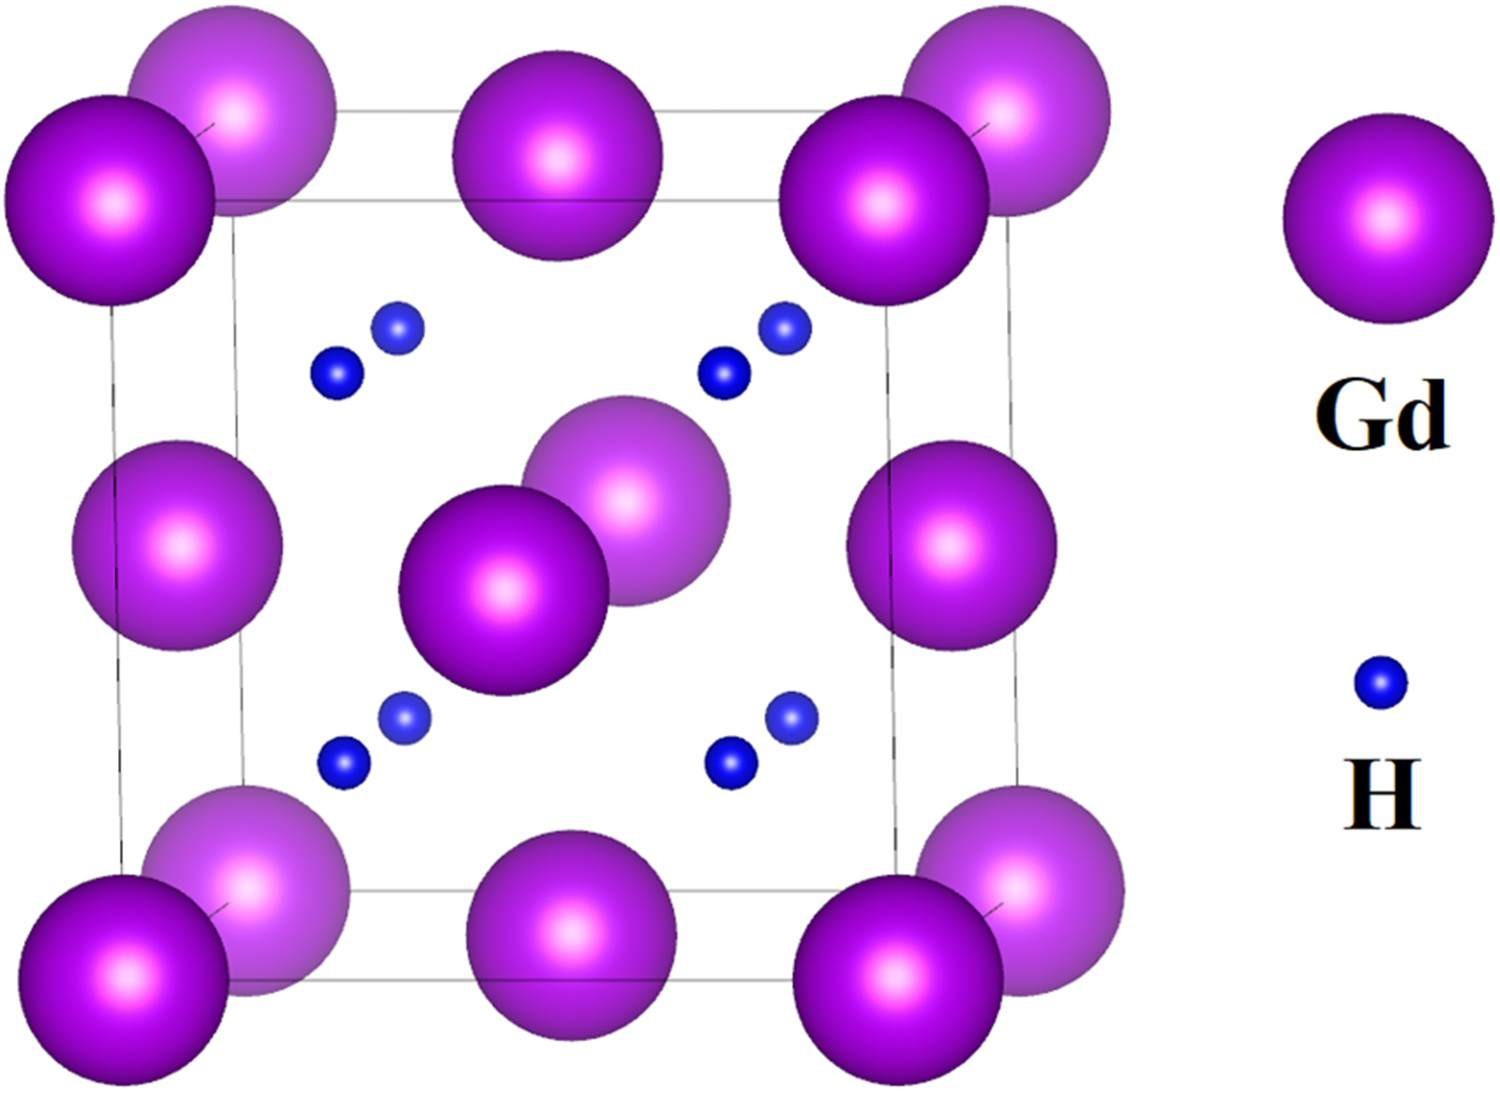
Results
Microstructure
The optical micrographs of as-cast alloys are shown in Figure 3. The GK30I alloy showed a microstructure of α-Mg and tiny amount of pits (Figure 3a). However, the massive of the second phase was shown in GK30II alloy (Figure 3b). The average grain sizes are 51.2 ± 6.12 µm for GK30I alloy and 48.8 ± 4.38 µm for GK30II alloy, respectively.
Optical microstructure of as-cast alloys: (a) GK30I alloy and (b) GK30II alloy.
Further FE-SEM examinations about as-cast GK30I and GK30II alloys are shown in Figure 4 and Figure 5, respectively. In Figure 4, the tiny amount of pits was Zr particles. In Figure 5, according to the morphology and EDS results, the second phases were Zr particles (Figure 5b and c) and CSP (Figure 5d and e), respectively. Statistics from several SEM images show that the number density of CSP is about 3600 mm–2.
Microstructure of a pit in as-cast GK30I alloy: (a) FE-SEM image and (b) EDS data. Microstructure of as-cast GK30II alloy: (a) FE–SEM image, (b) and (c) morphology and EDS of Zr particles, respectively, (d) and (e) morphology and EDS of CSP, respectively.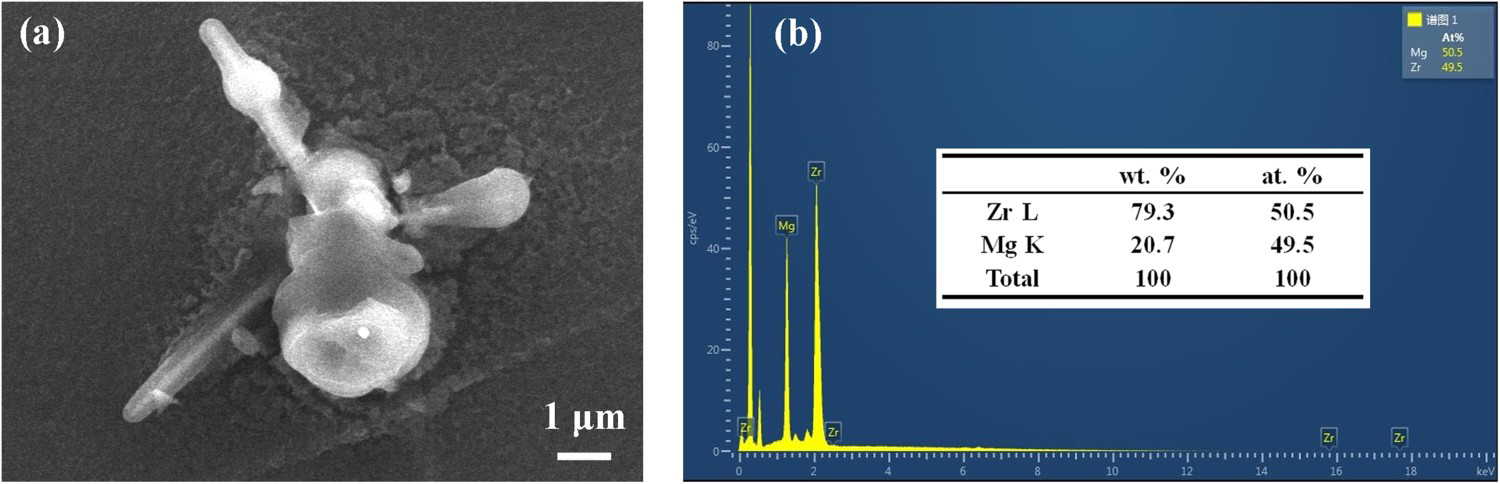
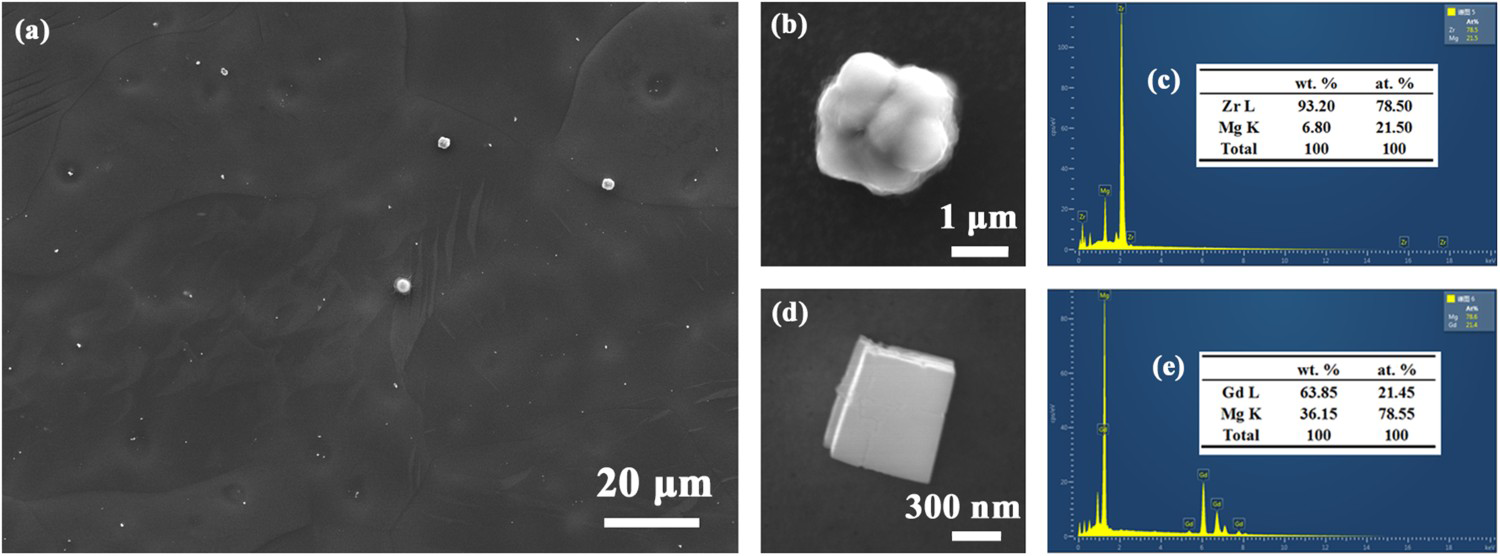
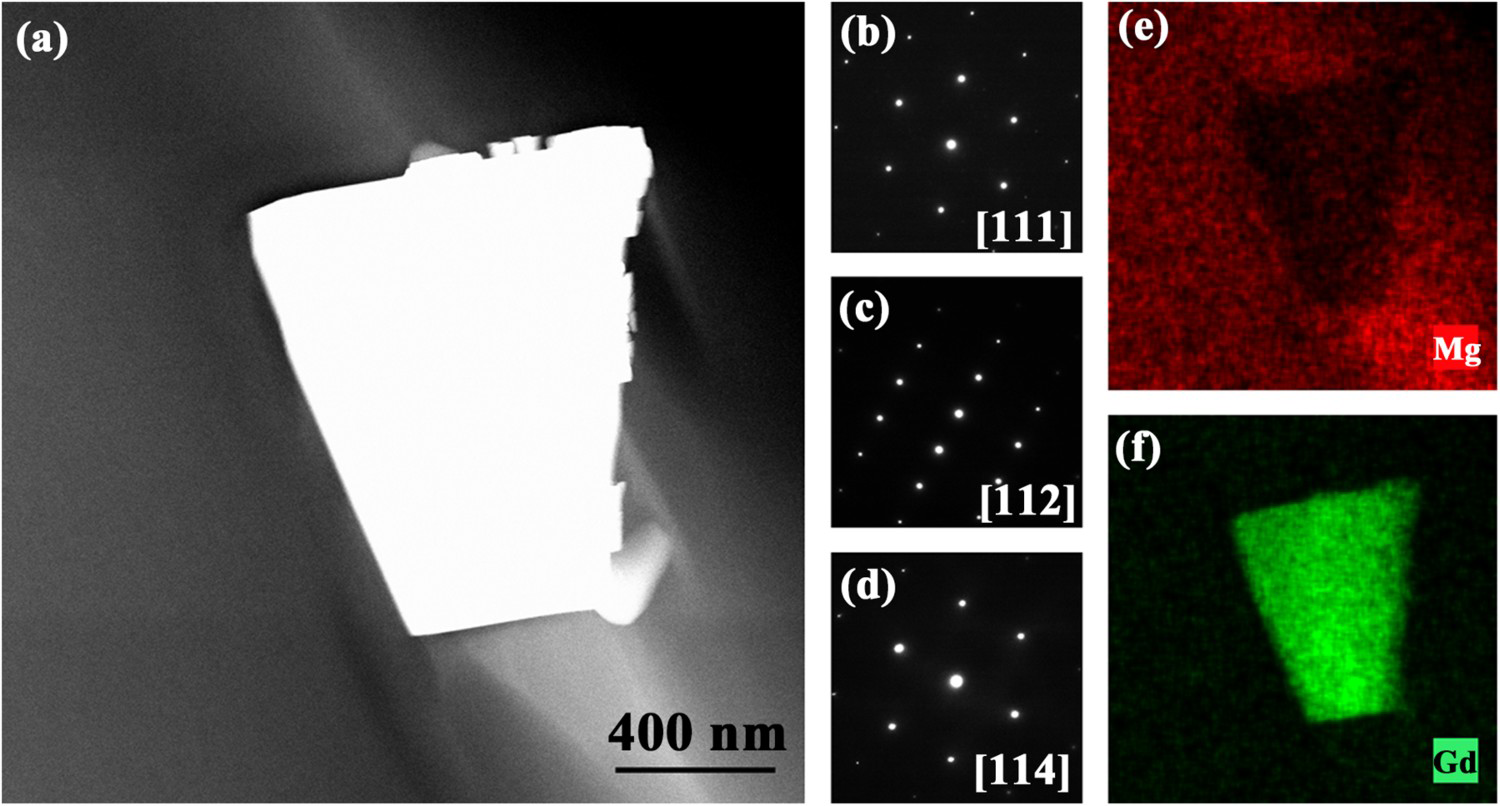
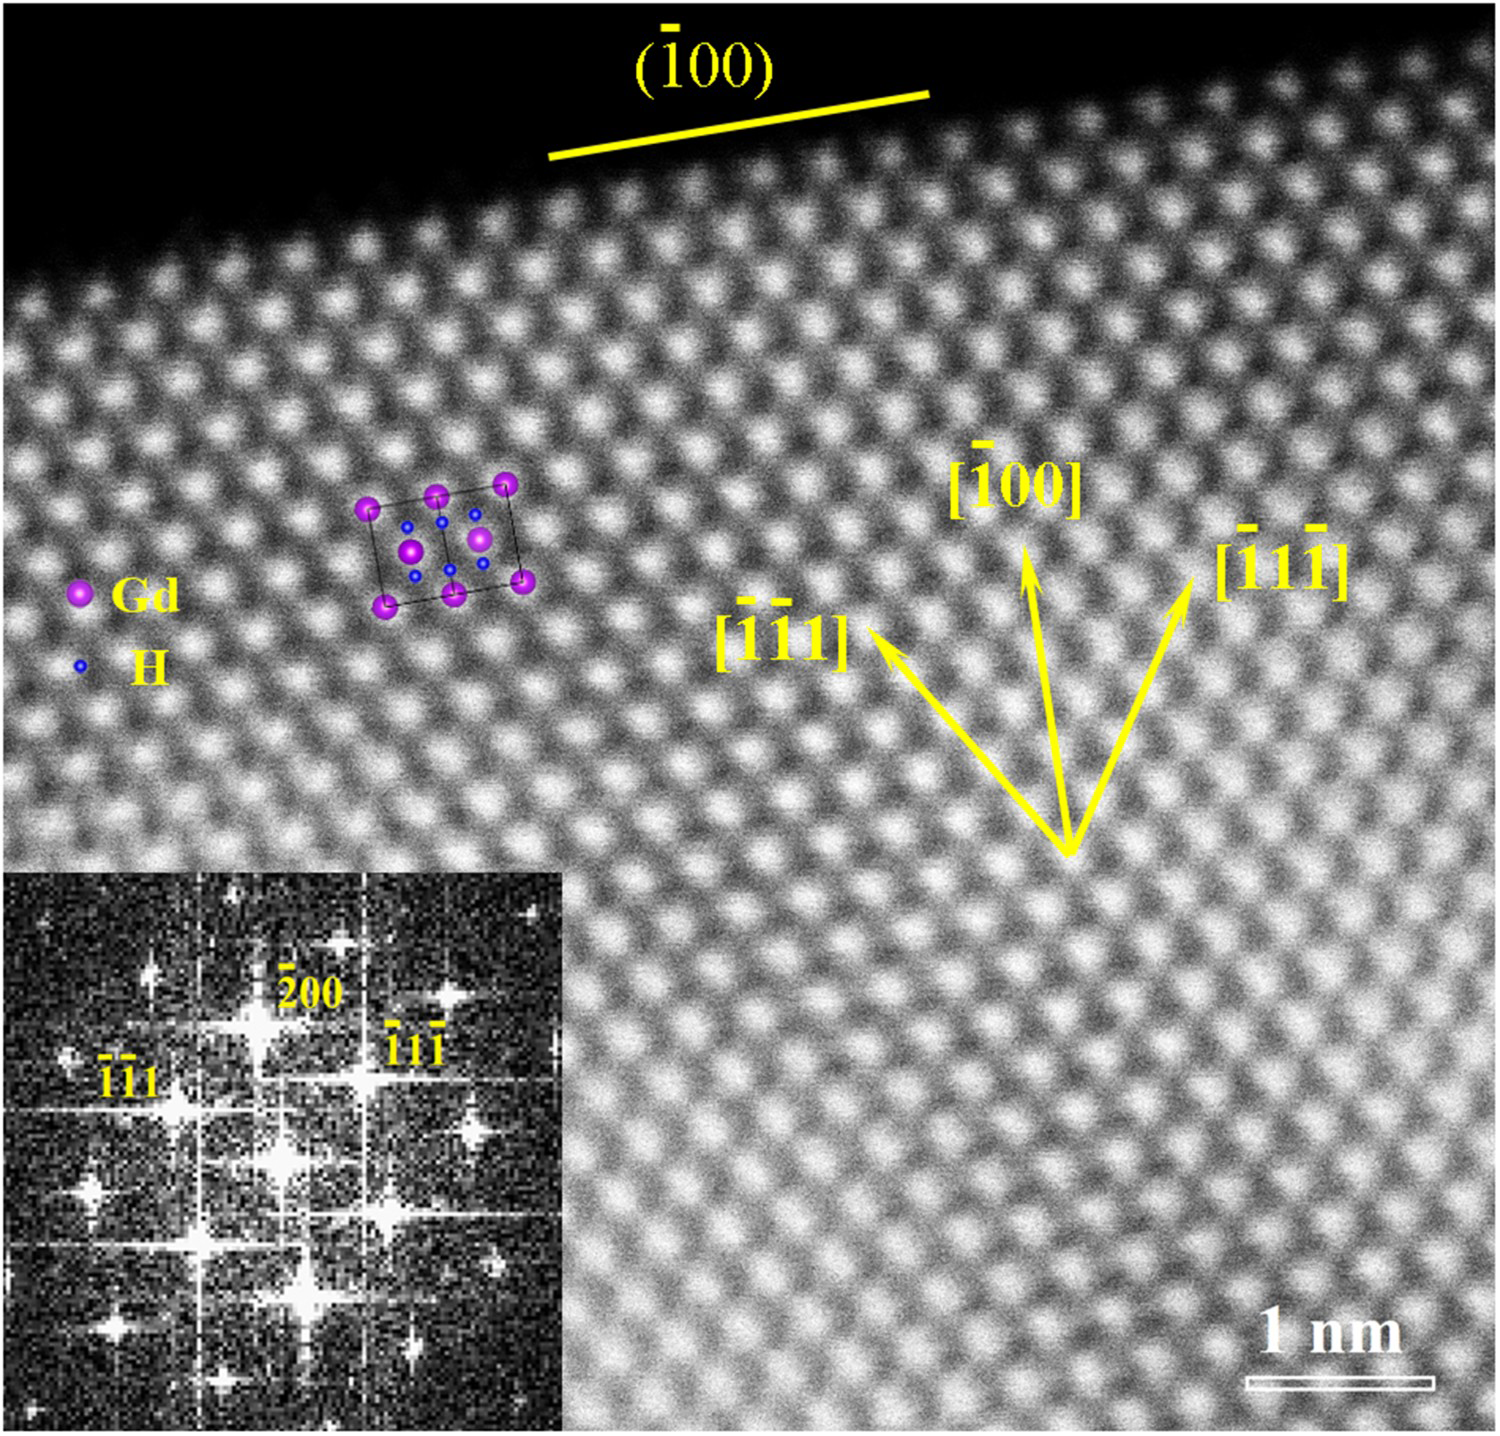
Figure 6 is the TEM identification of CSP in as–cast GK30II alloy. Figure 6(a) is the bright field image. The corresponding selected area electron diffraction (SAED) patterns (Figure 6b–d) indicate that the CSP has an fcc structure with a lattice constant of 0.54 nm. This is in accordance with previous reports [1,10] and [11]. According to the EDS mappings (Figure 6e and f), the CSP is enriched in Gd. Figure 7 is the HAADF-STEM image of CSP at its phase boundary. It revealed only one atomic number contrast. In summary, CSP in as-cast GK30II alloy was identified as GdH2 phase. The insert corresponding fast Fourier transformation (FFT) pattern reveals that electron beam is parallel to [011] direction of CSP. According to the FFT result, three low-index directions can be labelled with yellow arrows. The boundary of CSP is atomically flat and is parallel to its (
Identification of CSP in as-cast GK30II alloy by TEM: (a) bright field image, (b–d) SAED patterns, (e) and (f) EDS mapping of Mg K and Gd L, respectively. HAADF-STEM image of CSP at phase boundary. 00) plane. It is a flat phase boundary not only in macroscale but also in micro one.
The optical microstructure of annealed GK30II alloy is shown in Figure 8. The annealed sample was further examined by SEM. No second phase was detected. The annealed GK30II alloy showed a microstructure of single phase of α-Mg. The average grain size of annealed GK30II alloy is 52.3 ± 3.22 µm. Compare with the as-cast GK30II alloy, the designed annealing treatment can eliminate the CSP without grain coarsening.
Optical microstructure of the annealed GK30II alloy.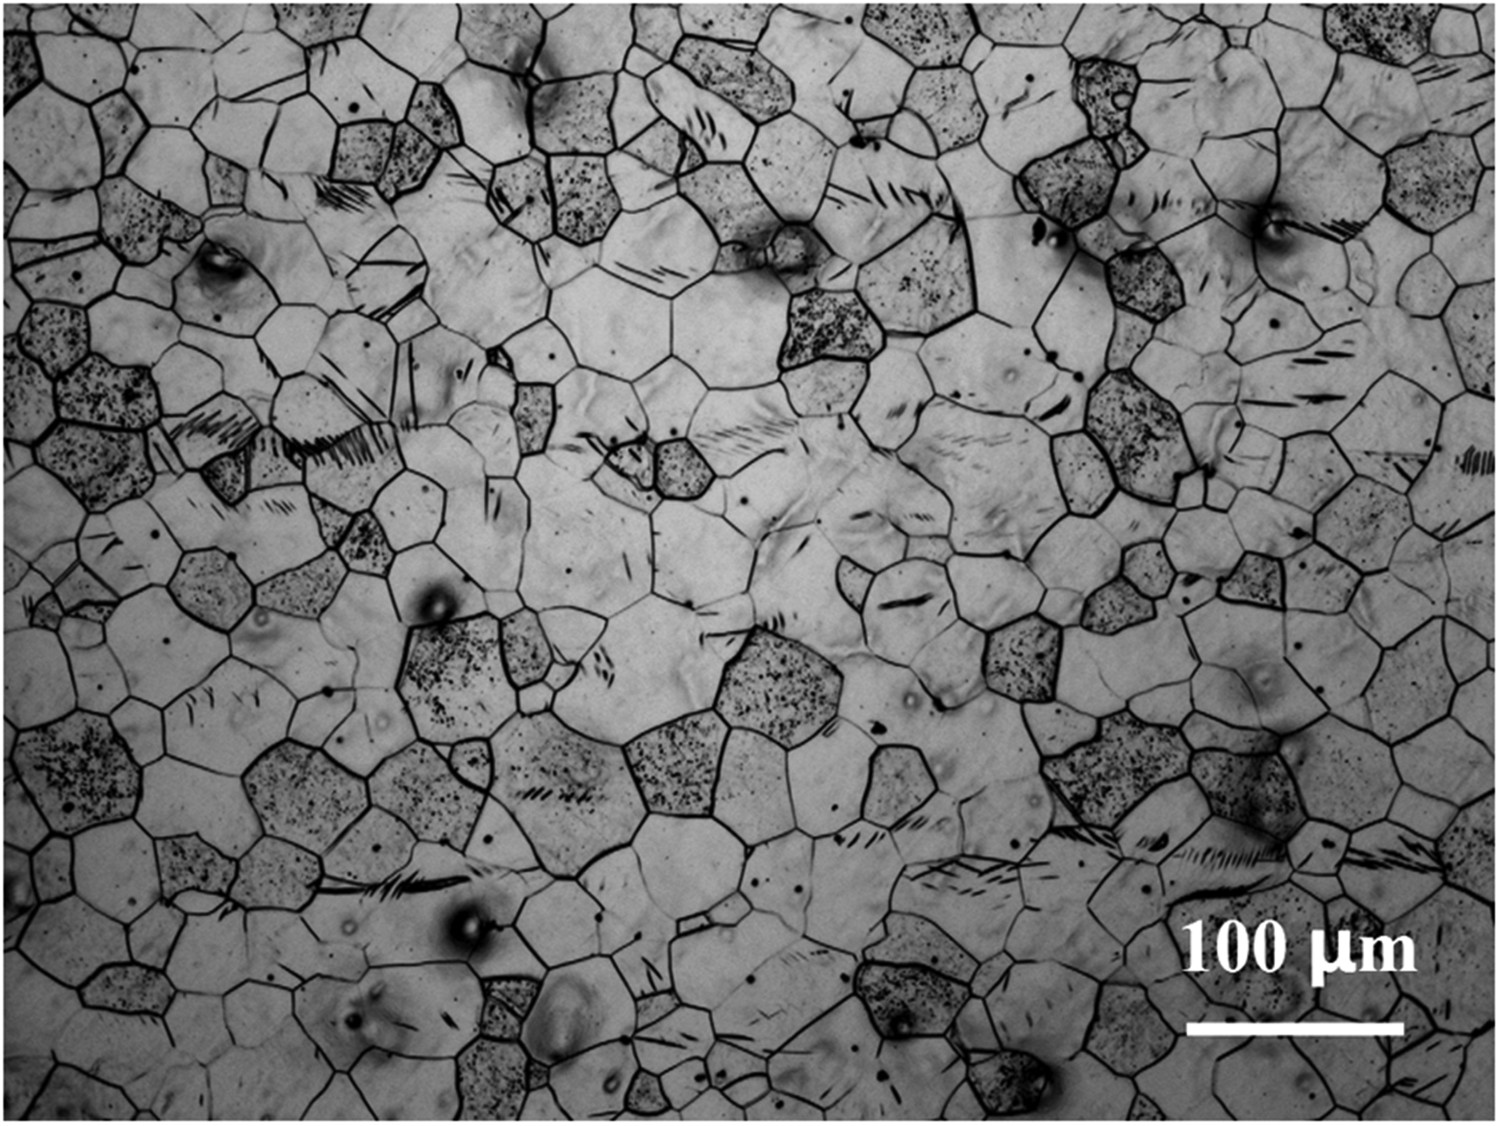
Mechanical properties
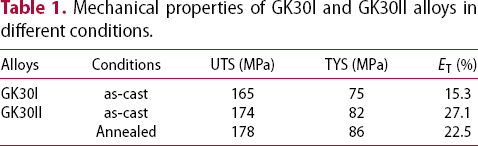
Figure 9 is the mechanical properties of GK30I and GK30II alloys in different conditions. The values were listed in Table 1. In as-cast condition, the ET of GK30II alloy is nearly twice than that of the GK30I alloy. The UTS and TYS of GK30II alloy have little change before and after annealing treatment. The E
T of as-cast GK30II alloy (27.1%, α-Mg + CSP) is about 20% higher than that of the annealed one (22.5%, α-Mg).
Typical engineering stress–strain curves of GK30I and GK30II alloys in different conditions. Mechanical properties of GK30I and GK30II alloys in different conditions.
Discussion
Formation mechanism of the morphology of CSP
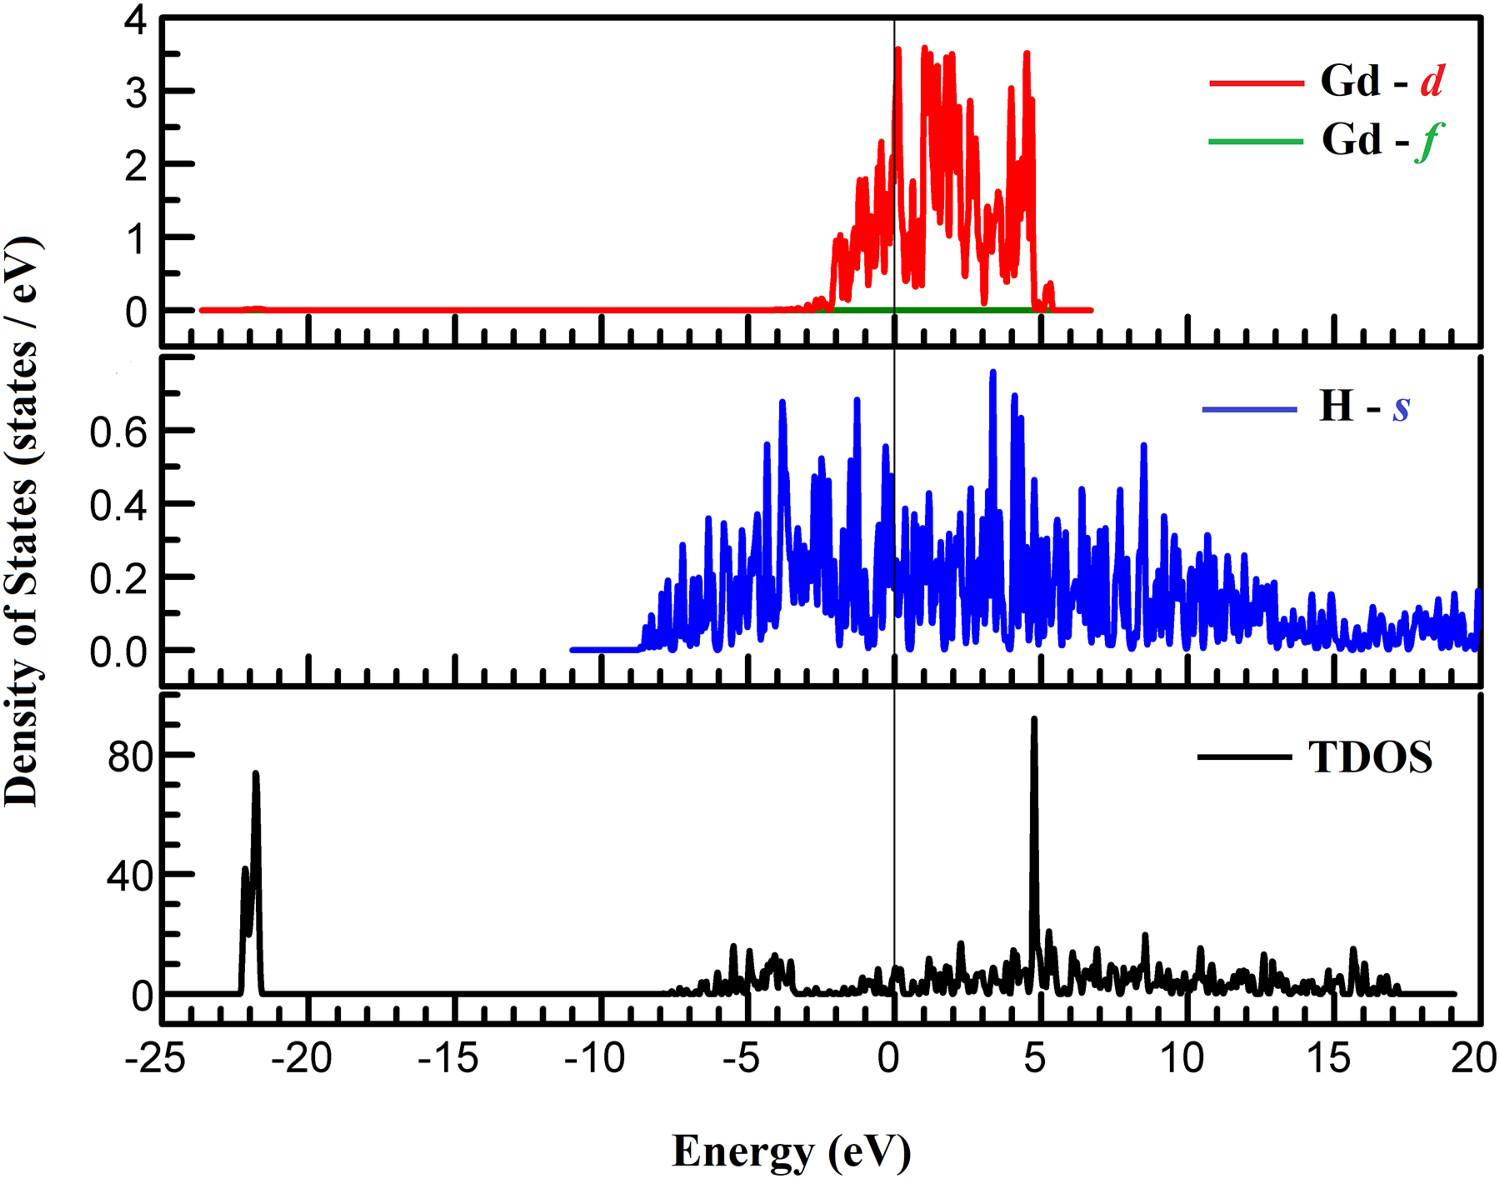
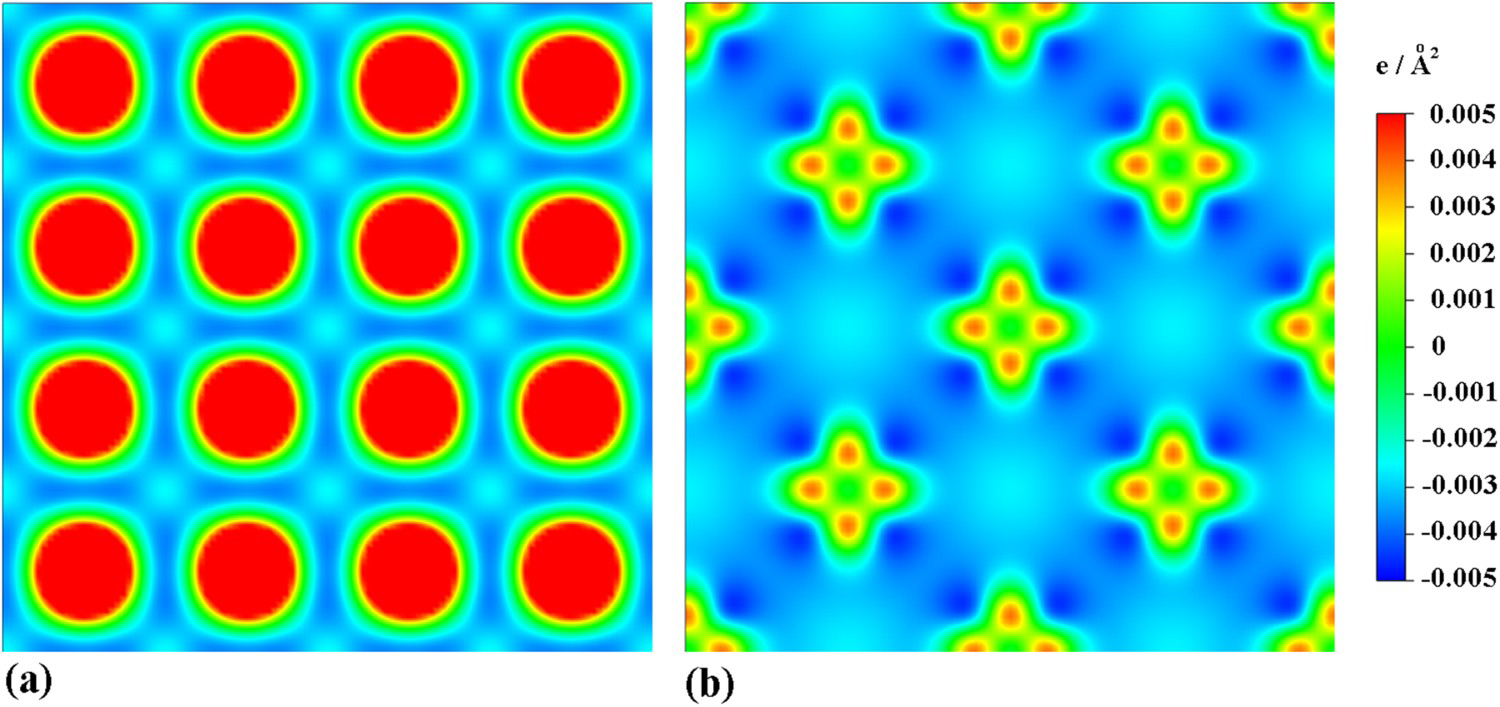
It is known that anisotropy of the interface energy exists during crystal growth. For the fcc crystal, (111) is the close-packed plane and has the lowest interface energy during solidification. So, the final shape of the fcc crystal should be octahedral. However, other factors may affect the growth behaviour of specific planes and change the final appearance of the crystal [27]. To explain the formation mechanism of this morphology, the electronic structures, which include total density of states (TDOS), partial density of states (PDOS) and difference charge density, were researched systematically. Figure 10 is the PDOS and TDOS of CSP. Here the Fermi energy is at zero energy. The PDOS of Gd–5d is localised from –2 to 5 eV. Steep peaks are also present in this energy range. This typical characteristic is also reported in [28]. These good agreements indicate that our calculations are reliable. There is no obvious peak in the Gd–4f state. Because the Gd–4f subshell is half-full condition and a relatively stable state. The PDOS of H–1s is distributed in a wide energy range, indicating the existence of metallic character. Through further analysis of PDOS, the peak of TDOS at about 5 eV is primarily contributed by Gd–5d and H–1s bands. The TDOS around Fermi level is nearly zero, indicating that CSP is a fairly stable structure [29,30] and has a small fraction of metallic bonding [31]. To further explain the chemical bonding of CSP, difference charge density was also examined and illustrated in Figure 11. From Figure 11(a), the difference charge density around H atoms revealed a near-spherical morphology. The core regions of H have the largest electron density in the form of ‘sea of electrons’. It is an evidence for the existence of metallic bonds. This conclusion is accordant with the results of PDOS and TDOS. From Figure 11(b), the difference charge density around Gd atoms revealed a petal-shaped morphology. Evidently elongated contours along Gd–H bond axis can be observed in Figure 11(b), which is powerful evidence for the covalent bonds. The elongated directions are just vertical to {100} family of crystal planes, which are the flat ones of CSP. On the atomically smooth surface, the crystal growth rate is normally very low at low supersaturations, owing to the large barriers for conventional two–dimensional nucleation [32]. The directional covalent bonding between Gd atoms and H atoms will provide sources of steps for crystal growth. So, the crystal planes with atoms outcropped on their surface can grow more easily than other planes. As a consequence, the growth of {111} planes of CSP was inhibited but the {100} ones was facilitated during the solidification of GK30II alloy. The SEM image (Figure 5d) reveals the unique morphology of CSP. The flat planes should be the {100} ones. This conclusion was verified by the TEM image (Figure 7). The experimental result is in according with the calculated one. It is worth noting that CSP is not an equilibrium phase, which does not appear in the corresponding Mg–RE phase diagram. GK30II alloy was cooled in cold water and its solidification process was far-away from equilibrium. So, CSP appeared in as-cast GK30II alloy but did not in as-cast GK30I alloy. In Figure 11(b), obvious charge deplete region can be achieved near Gd atoms in the direction of Gd–H bonding. It is indicated that ionic bonding exists in GdH2 compound. This result is also reported in [28].
Total and partial density of states of CSP. Difference charge density through (100) plane of CSP (a) d = 0.25 d(100)
and (b) d = 0 d(100)
.
Effect of CSP on the mechanical properties of GK30II alloy
In general, the wrought alloys will be strengthened during cold-working by the presence of defects, such as dislocations and interfaces. If the material is subsequently annealed to a high temperature, thermally activated processes such as solid-state diffusion provide mechanisms whereby the defects may be removed or alternatively arranged in configurations of lower energy. The tensile properties of wrought alloys will show significant change by a decrease in strength and increased ductility after annealing treatment [33]. But this is not the situation in casting alloys. The process of casting GK30II alloy does not involve cold-working. So, the strength does not show significant change before and after annealing treatment. The annealing treatment can reduce compositional segregation and thus provide a more uniform structure in castings. It is conducive to the improvement of ductility. Instead, the tensile ductility of GK30II alloy is reduced after annealing. After annealing treatment, an obvious difference is the disappearance of CSP in microstructure of GK30II alloy. The number density of CSP is 3600 mm–2 in as-cast GK30II alloy. It was generated by 3 wt-% Gd and increased the ductility by about 20%. Every 1 wt-% of solute Gd will generate a number density of 1200 mm–2 for CSP and increase the ductility by about 6.7%. The effect of CSP on the ductility of GK30II alloy was analysed in three aspects: calculations, hydrogen embrittlement and crystal imperfections.
Calculations
Calculated mechanical properties of CSP.
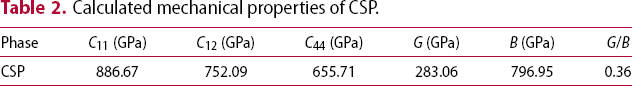
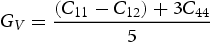
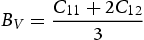
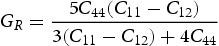
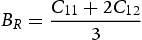
Finally, the G and B of CSP can be obtained by
The results are listed in Table 2. The G/B ratio of CSP is 0.36, which is less than 0.57. It indicates that the CSP is a ductile phase and promotes the ductility of as-cast GK30II alloy. The calculated results are in accordance with the experimental ones.
Hydrogen embrittlement
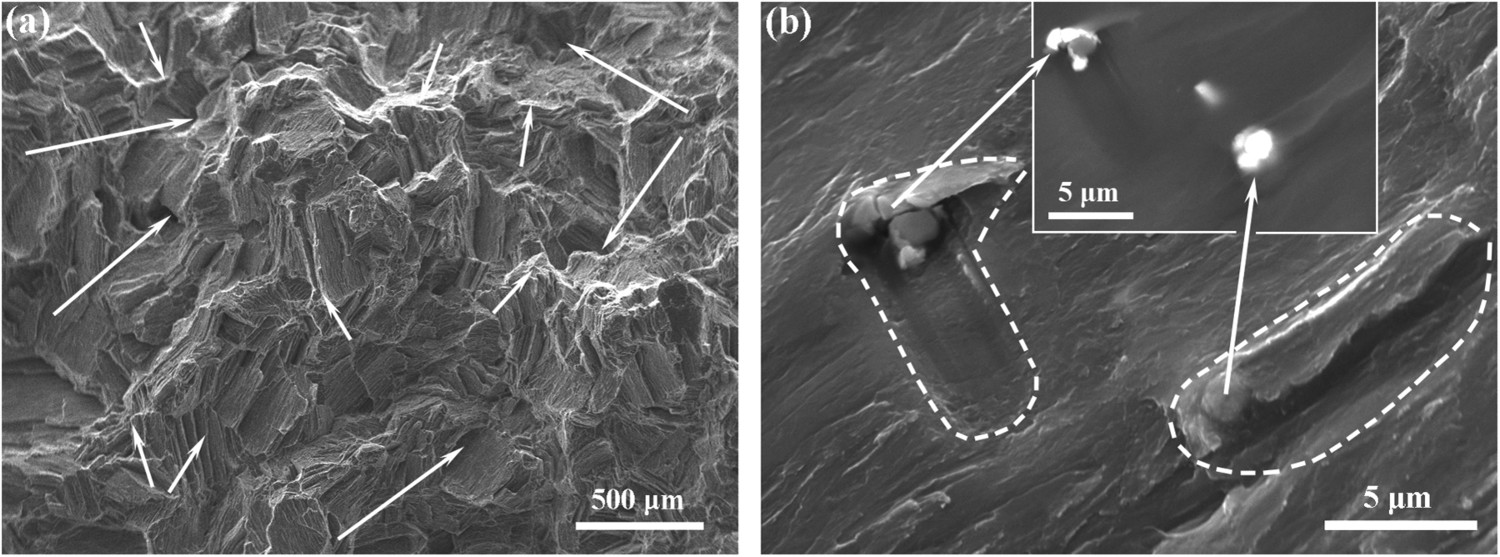
The CSP in as-cast GK30II alloy was identified as GdH2 phase. This conclusion is in accordance with previous reports [1,10] and [11]. As a hydride, the formation of CSP was able to trap a certain amount of hydrogen and decrease the sensitivity of hydrogen embrittlement (HE) in as-cast GK30II alloy due to the high chemical affinity between gadolinium and hydrogen [11]. The introduction of precipitates has been considered to be a relevant strategy for alloy design with improved resistance to HE [37,38], since they can both induce precipitation strengthening effect in materials and are often mentioned to act as an efficient deep hydrogen trapping site to remove the detrimental diffusible hydrogen from microstructure [39-42]. Trapping diffusible hydrogen using precipitates as trapping sites is generally accepted to be one of the approaches to enhance the resistance against HE [43]. Despite no precipitate formed in as-cast GK30II alloy, the formation of CSP was able to trap a certain amount of hydrogen. Compared with precipitates in steels, CSP in magnesium alloy has similar effect on decreasing the sensitivity of HE. This can be concluded from the fracture morphology of tensile test GK30II alloy in as-cast condition, which is shown in Figure 12. Dense tear ridges (short arrows) and deep dimples (long arrows) were observed in Figure 12(a). The as-cast GK30II alloy exhibited ductile transgranular fracture features [44], which was in accordance with its high elongation of more than 25%. As can be seen from Figure 12(b), the CSP was located at the tip of cracks. It indicated that more local plastic deformation was caused by CSP during tensile test. As delineated by the dotted lines, the two cracks have different directions. The area under stress–strain curve is determined to be the fracture energy [45], as evaluated according to the equation
Fracture morphology of as-cast GK30II alloy: (a) microstructure in SE model (short arrows: tear ridges, long arrows: dimples); (b) microstructure under higher magnification in SE and BSE model (The inserted image is the corresponding region in BSE model. The dotted lines delineate local plastic deformation regions. The CSP are located at the tip of cracks, as indicated by arrows). , where σ and ε represent the stress and strain, respectively. Both the fracture energy of GK30I and GK30II alloys in the as-cast condition was calculated according to Figure 9. The results are 2170 and 4437 MPa*%, respectively. Compared with GK30I alloy, the fracture energy of GK30II alloy was increased significantly by CSP. It reveals that the CSP can facilitate different directions for crack propagation and increase the fracture energy. In summary, as a hydride, the formation of CSP can decrease the concentration of solute hydrogen, enhance local plastic deformation and increase the fracture energy during the tensile test. All these conditions will reduce the susceptibility of HE and improve the ductility of Mg–Gd alloy.
Crystal imperfections
According to experimental results, the relationship between three types of hydrogen and HE was plotted together with a linear fitting [46]. A coefficient of determination (R2) of 95% between the degree of HE and the amount of mobile hydrogen was achieved. It was indicated that the amount of mobile hydrogen trapped by dislocations played a determinant role in the degree of HE. This further confirms the importance of enhanced dislocation mobility in the presence of hydrogen, as described in the HELP mechanism.
In fcc crystal, {111} < 110 > is the most important slip system. Figure 13(a) is the HAADF–STEM image of CSP from [011] direction. Inverse fast Fourier transform (IFFT) images of (
Atomic-scale HAADF-STEM image of CSP (a) and its corresponding IFFT images of (
Atomic-scale HAADF–STEM image of CSP showing lattice distortion by arrows. 1) lattice planes at different areas of Figure 13(a) were shown in Figure 13(b–d), respectively. Obviously there are extra half-planes marked by the symbol of ‘┴’ residing at the edge of stacking fault. These dislocations can trap mobile hydrogen and lower susceptibility of HE. Meanwhile, the slip of these dislocations can accommodate plastic deformation and improve the ductility of as-cast GK30II alloy. To further examination, intensive lattice distortion was present in the microstructure. Parts of the distorted lattice sites were marked by white arrows in Figure 14. The lattice distortion may be caused by the solidification process of GK30II alloy and/or the segregation of hydrogen at interstitial sites. It is worth noting that the solidification process of GK30II alloy is far away from equilibrium. For the smallest atom radius, hydrogen atom was usually at the interstitial sites of crystals. The segregation of interstitial atoms at distorted sites will relieve hydrostatic stresses around distorted sites and make the system tend to be equilibrium. It has been confirmed that carbon atoms segregate around dislocations, which leads to the formation of the well-known ‘Cottrell atmospheres’ in steel [47]. These interstitial atoms will affect mechanical properties of steel, such as hardness [48,49], creep resistance [50] and elastic stiffness [51]. It was considered that the intrinsic point defects can relax misfit strain and facilitate dislocation nucleation and slip during plastic deformation [52]. The hydrogen atoms play similar role in CSP as carbon atoms in steel. The CSP is conducive to increasing ductility of GK30II alloy.
 1) lattice planes at different areas, respectively and (b–d) dislocations were marked by red symbols of ‘┴’.
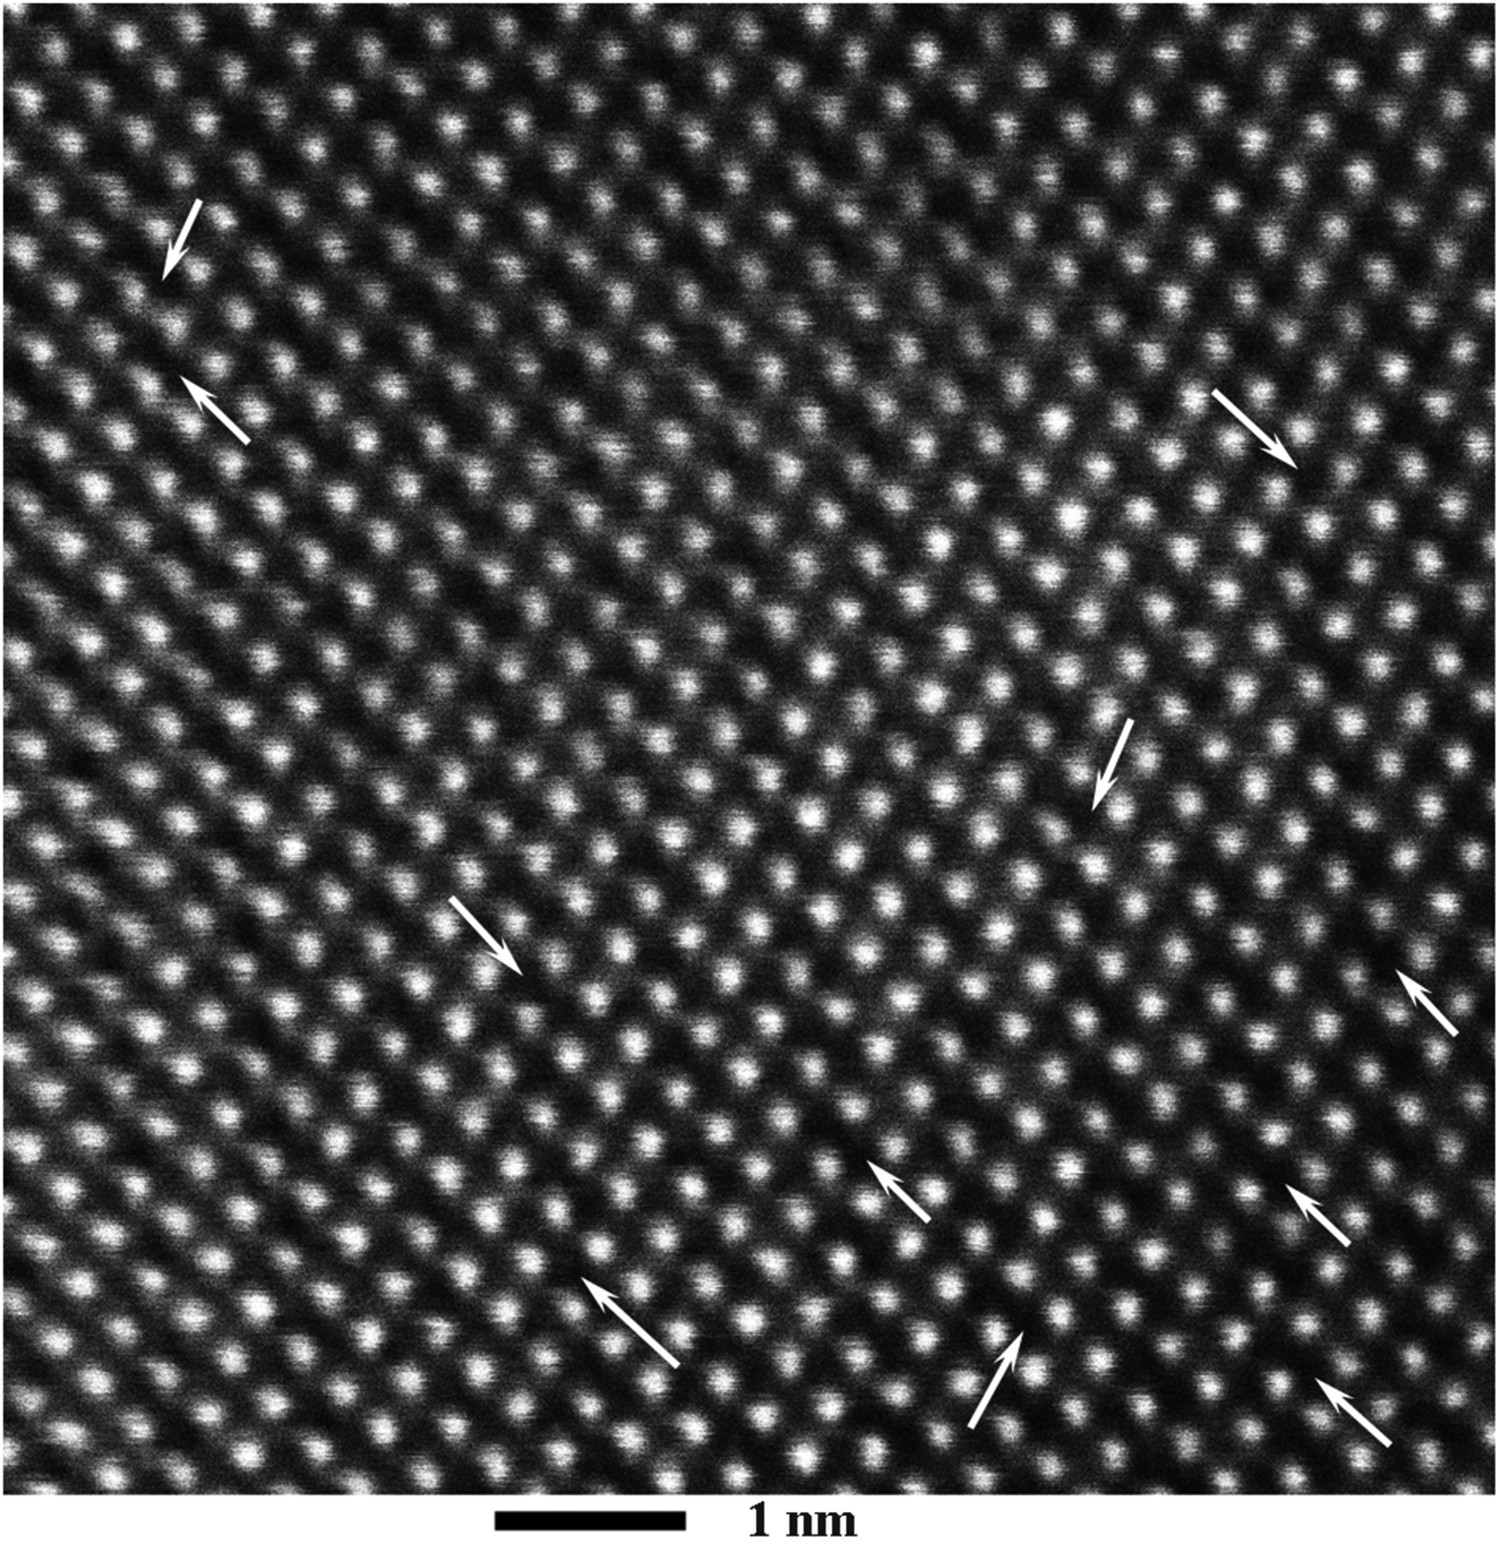
Conclusion
According to the phase diagram and controlling the cooling rate, a casting Mg–3Gd–0.6Zr alloy with phase constituents of α-Mg and CSP was designed for the first time. The effect of eutectic phase on mechanical properties of GK30II alloy was avoided. The CSP was first eliminated by a designed annealing treatment, without grain coarsening simultaneously. Then, the electronic properties of CSP were calculated by first-principle calculations. The formation mechanism of the morphology of CSP was discussed. The effects of CSP on mechanical properties of GK30II alloy were evaluated.
Based on the results of total density of states, partial density of states and difference charge density of CSP, its atomic bonding showed mixed character of metallic, covalent and ionic bonds. The morphology of CSP was correlated with the directional covalent bonding between Gd atoms and H atoms along <100 > directions. The flat planes of CSP are the {100} ones by HAADF-STEM identification. The CSP has a negligible strengthening effect, but has a beneficial effect on the ductility of GK30II alloy. It is the first time to report the improvement of ductility by CSP in Mg–Gd alloy. The tensile elongation of as-cast GK30II alloy (27.1%, α-Mg + CSP) is about 20% higher than that of the annealed one (22.5%, α-Mg). Every 1 wt-% of solute Gd will generate a number density of 1200 mm–2 for CSP and increase the ductility by about 6.7%. The calculated G/B ratio of CSP is 0.36, which is less than 0.57. It indicates that the CSP is a ductile phase and promotes the ductility of as-cast GK30II alloy. The as-cast GK30II alloy exhibited ductile transgranular fracture features. The formation of CSP was able to trap a certain amount of solute hydrogen and decrease its concentration due to the high chemical affinity between gadolinium and hydrogen. CSP in as-cast GK30II alloy can enhance local plastic deformation and increase the fracture energy during the tensile test. All these conditions will reduce the susceptibility of HE and improve the ductility of as-cast GK30II alloy. Dislocations in CSP can trap mobile hydrogen and reduce the susceptibility of HE. Meanwhile, the slip of these dislocations can accommodate plastic deformation and improve the ductility of as-cast GK30II alloy. The distorted lattice can relax misfit strain and facilitate dislocation nucleation and slip during plastic deformation. Both kinds of crystal imperfections in CSP are conducive to increasing the ductility of GK30II alloy.
To develop high-performance Mg alloys, the effect of CSP on mechanical properties of other Mg–RE alloys was needed to be further investigated.
Footnotes
Disclosure statement
No potential conflict of interest was reported by the author(s).