
Abstract
To study the effect of the variable amplitude on the carburised 17CrNi high-strength steel, very high cycle fatigue tests were performed on smooth specimens under the stress ratios of 0 and −1. After the experiment, the characteristics of the fracture surfaces were investigated by means of an optical microscope and a scanning electron microscope. Circular-formed marks were found around the inclusion inside the fisheye. Finally, based on five damage models, the fatigue life of the carburised 17CrNi high-strength steel was predicted. The comparison of the calculated lives with the experimental data shows that the modified Miner's criterion is the most accurate and it can adequately characterise the fatigue life of the 17CrNi steel.
Introduction
Components and structures (e.g. wind turbine components, helicopter rotors, or wheelset axels) are frequently exposed to a very high number of cycles with different stress ratios and variable amplitudes (VA). As already discussed in previous studies [1,2], fatigue properties of high-strength steels under Very High Cycle Fatigue (VHCF) are strongly affected by metallurgical defects such the non-metallic inclusions, and the crack nucleus often takes place in the interior, and that fatigue failure involves the initiation and propagation of the crack. Paris et al. revealed that the time consumed in crack propagation only occupies a very small portion of total fatigue life in the VHCF regime whereas the crack initiation period is of overriding importance [3-5]. Furthermore, several research papers have introduced experimental methods to estimate the cycles-number for crack growth from an interior inclusion under VHCF [6,7]. Nakasone et al. calculated the interior crack growth using Paris law and found that the crack growth life is about 102–105 cycles of the total life, and it can be ignored if compared to the long crack initiation life with more than 107 cycles [6]. In addition, Wagner et al. used a thermo-mechanical fatigue approach to elicit that over 90% of the total fatigue life in the VHCF range is used in the crack initiation stage in the FGA [7]. Moreover, some models are proposed to predict the fatigue life in the VHCF regime such as the
 parameter model [8], the inclusion size model [9], material characteristics such as tensile strength [10], the accumulative damage [11], etc … For the high-strength steels that show a high crack growth rate and low fracture toughness, the fatigue life within the VHCF is expected to be primarily governed by crack initiation. Thus, the VHCF lifetime prediction approach related to crack initiation needs to be discussed in more detail.
Despite significant advances in fatigue testing equipment and techniques, there remains a need to understand how fatigue characteristics change under different loading conditions. Since it is impossible to carry out fatigue tests under real service conditions for all machine components and structural elements, it is necessary to find experimental procedures that can serve as a reference. Except for a few studies that consider VA loading and stress ratio (eg: [12-16]), most available research does not focus on investigating these two important factors.
In the last decades, researchers attempted to find the most suitable rule to describe the behaviour of fatigue damage accumulation. Although, previous works [17-22] concluded that damage due to fatigue increases with applied loading cycles in both VA and CA, however, the damage accumulation characteristics under VA need to be further discussed.
For the reasons mentioned above, the effect of VA loading on crack morphology was studied in this paper: The axial fatigue testing under CA and VA loading of the smooth specimens of carburised 17Cr2Ni2Mo steel at the stress ratios of 0 and −1 were performed, then the S-N curves were plotted. After that, the microscopic observation of fracture surfaces was conducted and the characteristic crack size of inclusion and fisheye were calculated. Finally, based on the Miner criterion, Modified Miner criterion, Damage Curve with maximum stress level (DCA1), Damage Curve with minimum stress level (DCA2), and Corten-Dolan theory, the fatigue life under the VA loading was predicted, and then the prediction accuracy of the five methods was compared to experimental results.
Material and methods
Material and specimen
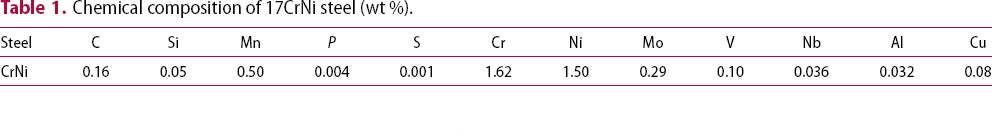
The material used in this paper is the carburised 17Cr2Ni2Mo steel. Its chemical composition is given in Table 1. From the annealed steel bar with a diameter of 18 mm, test specimens were machined into an hourglass shape with a certain finishing margin and then polished in a direction parallel to their axis using sandpaper with grades ranging from 400 to 2000, as shown in Figure 1. The minimum diameter and the corresponding stress concentration factor of the samples are 6 mm and 1.03, respectively.
Shape and dimensions of specimen (units: mm). Chemical composition of 17CrNi steel (wt %).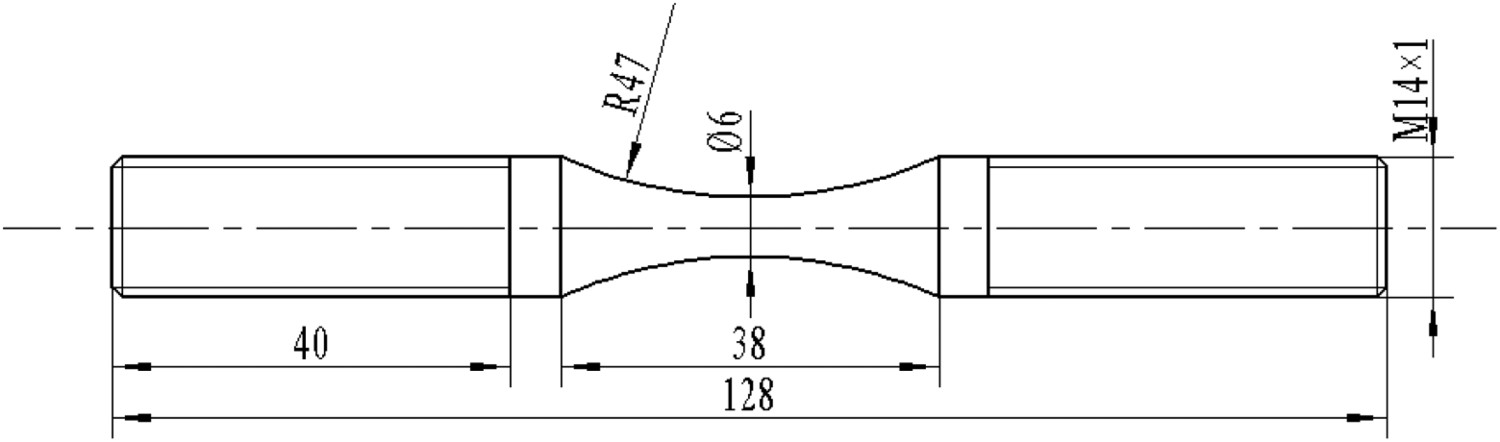
In order to determine the mechanical characteristics of the material, monotonic tension testing was performed on the carburised 17Cr2Ni2Mo specimens. The tested specimens were subjected to controlled tension until failure. According to the results of monotonic tension testing, values of Poisson's ratio (υ), Young's modulus (E), tensile strength (σ b), yield strength (σ y), and the shear modulus (µm) of 17Cr2Ni2Mo steel were determined: 0.3, 205 GPa, 1800MPa, 1510 MPa, and 80.4 GPa, respectively.
Surface-treatment and microstructural property
The specimens were put into a container riddled with carburisation powder which consists of charcoal, calcium carbonate, and barium carbonate solution with 12:1:5. The container was shuttered by fire clay and heated by a vacuum furnace. The temperature of the furnace first elevates up to 800–850°C, and then it was held for 2 or 4 h steeping time and finally reaches the carburising temperature of about 930°C. The carburising time is about 6 h with pack-carburising speed about 0.1–0.15 mm/h and the expected depth of carburised layer is about 0.6–0.8 mm. Upon completion of the process, direct quenching and low tempering were performed. The furnace temperature is stepped down to 860°C for 30 min prior to quenching in oil, followed by tempering at 200°C for 2 h.
After the heat treatment process, a multi-process including grinding, polishing, and etching with a 4% alcohol nitric acid solution is performed. Then, the microstructure in the cross-sectional area of the specimen was observed using the Scanning Electron Microscope (SEM) and the Optical Microscope (OM), as shown in Figure 2. Acicular high-carbon martensites and partial residual austenites are observed in the carburised layer (Figure 2(b)), while low-carbon lath martensites are observed in the matrix region (Figure 2(c)).
OM and SEM observation of microstructure: (a) thickness of carburised layer; (b) microstructure in carburised layer; (c) microstructure in core region; (d) inclusion.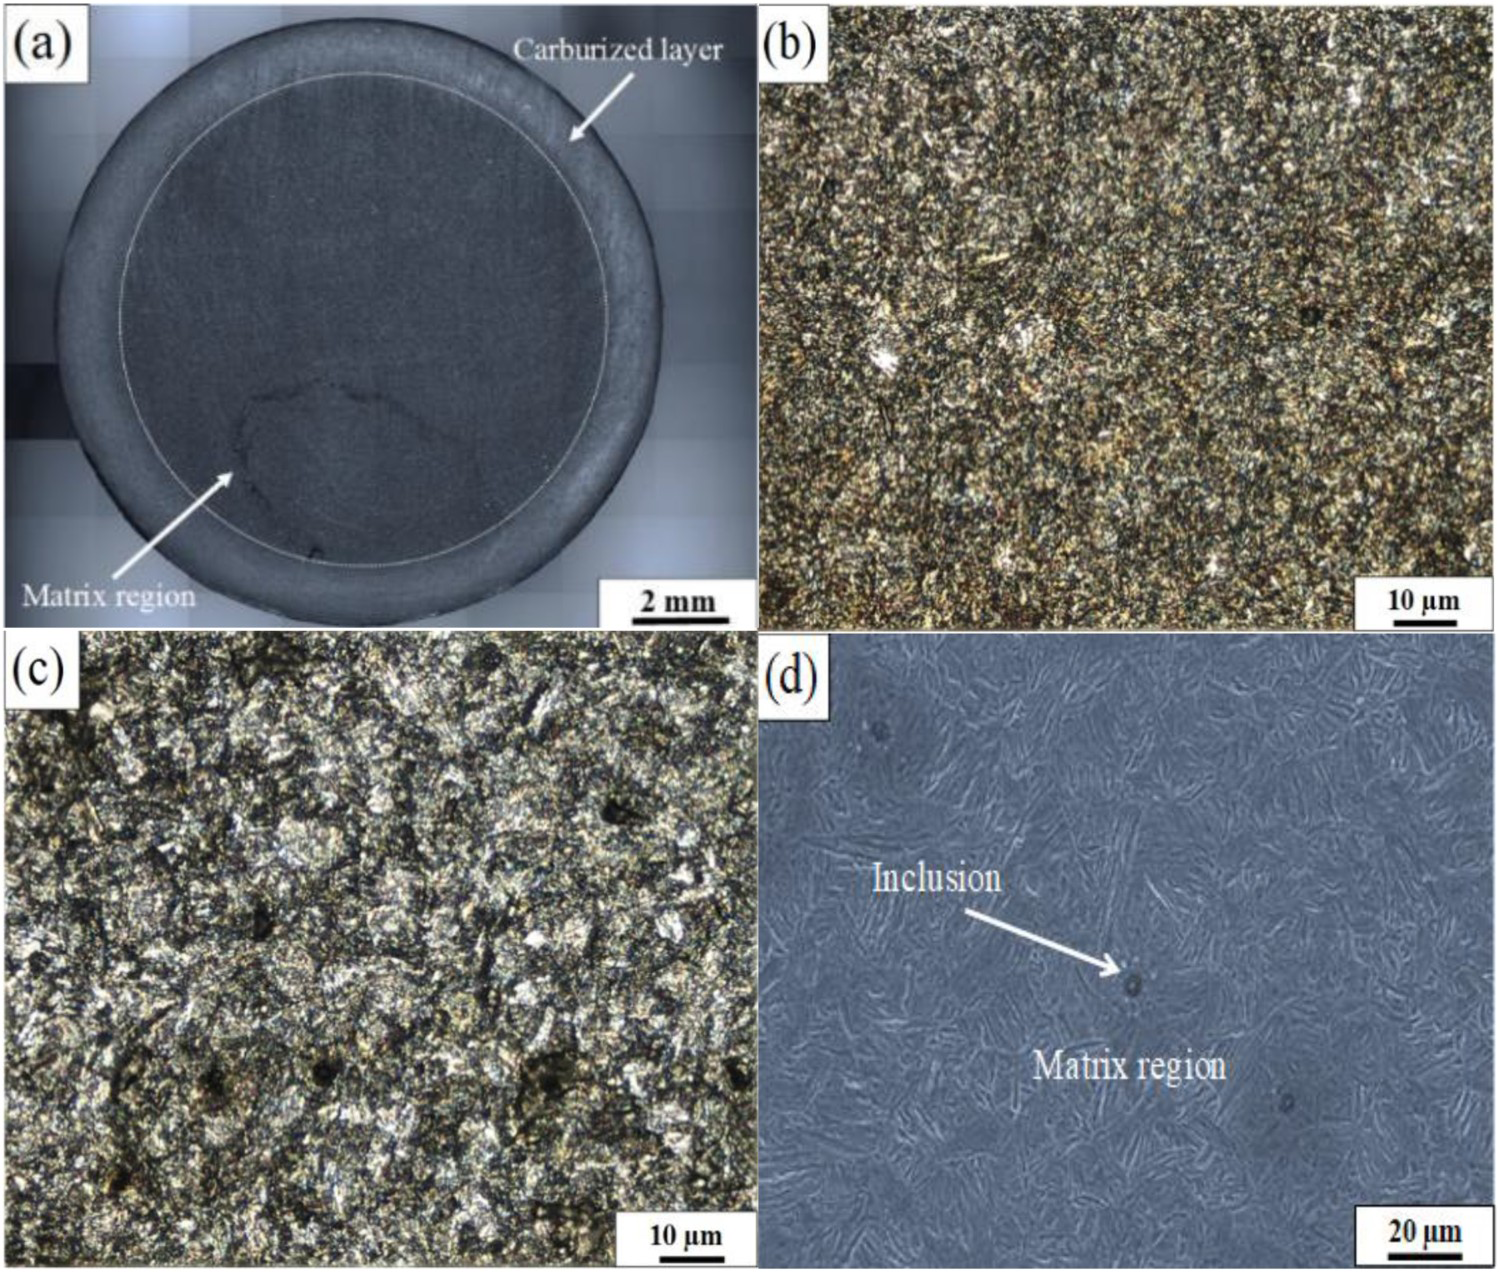
Additionally, some non-metallic inclusions can be observed in the microstructure (Figure 2(d)). Based on energy dispersive X-ray spectrometer (EDS) analysis, the main chemical composition of the inclusion is Al2O3. These non-metallic inclusions are usually produced in the smelting process. Poisson's ratio and Young's modulus for the inclusion, υ inc and E inc, are about 0.25 and 390 GPa, respectively [23].
Fatigue testing method
The 17Cr2Ni2Mo samples were tested under CA loading and VA loading with two distinct stress ratios: R = 0 and R = −1; by an electromagnetic resonant fatigue testing machine with a frequency of 100 Hz. The experiment was carried out in normal conditions (an open environment with room temperature). The fatigue life varies approximately in the range of 104–109 cycles. The VA test contains two loading modes: step loading and block program loading. The step loading contains only the load-decreasing sequence. In block program testing, and by means a CPU-control unit, the values of loading sequence and stress amplitude can be controlled based on a common method. The stress level in a block varies from two levels to three levels with a load ranging from 10% to 80% of the yield strength and the number of cumulative cycles n ranges from 5 × 10³ to 2 × 10⁵ for each stress level.
After the experiment, the fracture surfaces were observed by the Optical Microscope (OM) and the SEM to examine the crack nucleation and propagation sites and then define their morphologies and characteristics.
Results and discussion
S–N diagram
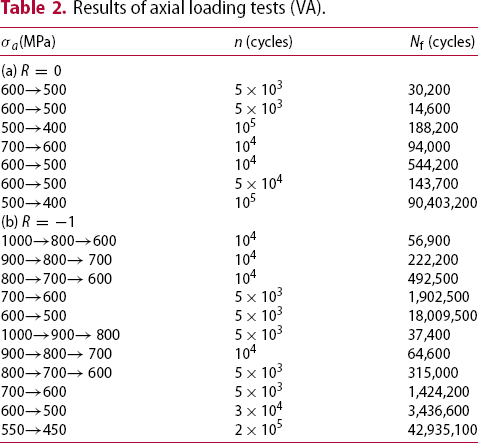
The VA loading sequences for each test are presented in Table 2 (Table 2(a); R = 0 and Table 2(b); R = −1). The S-N diagram related to stress amplitude and fatigue life is given in Figure 3. Figure 3(a) shows the CA and VA tests under R = 0, the S-N data were scattered in the life region between 104 and 109 cycles for the values of stress varying from 400 to 700 MPa. Figure 3(b) shows the CA and VA tests under R = −1, the S-N data were scattered in the life region between 104 and 108 cycles for the values of stress varying from 500 to 1000 MPa. The steel represents the continuously descending S-N property without duplex characteristics, and the conventional fatigue limit cannot be observed. In this situation, the typical S-N formula proposed by Basquin was used to represent the S-N curve of the 17CrNi steel under the VA loading within 104–109 life cycles, as indicated by solid lines in Figure 3.
S–N curves of carburised 17CrNi steel under axial loading. (a) CA vs. VA under R = 0. (b) CA vs. VA under R = −1 Results of axial loading tests (VA).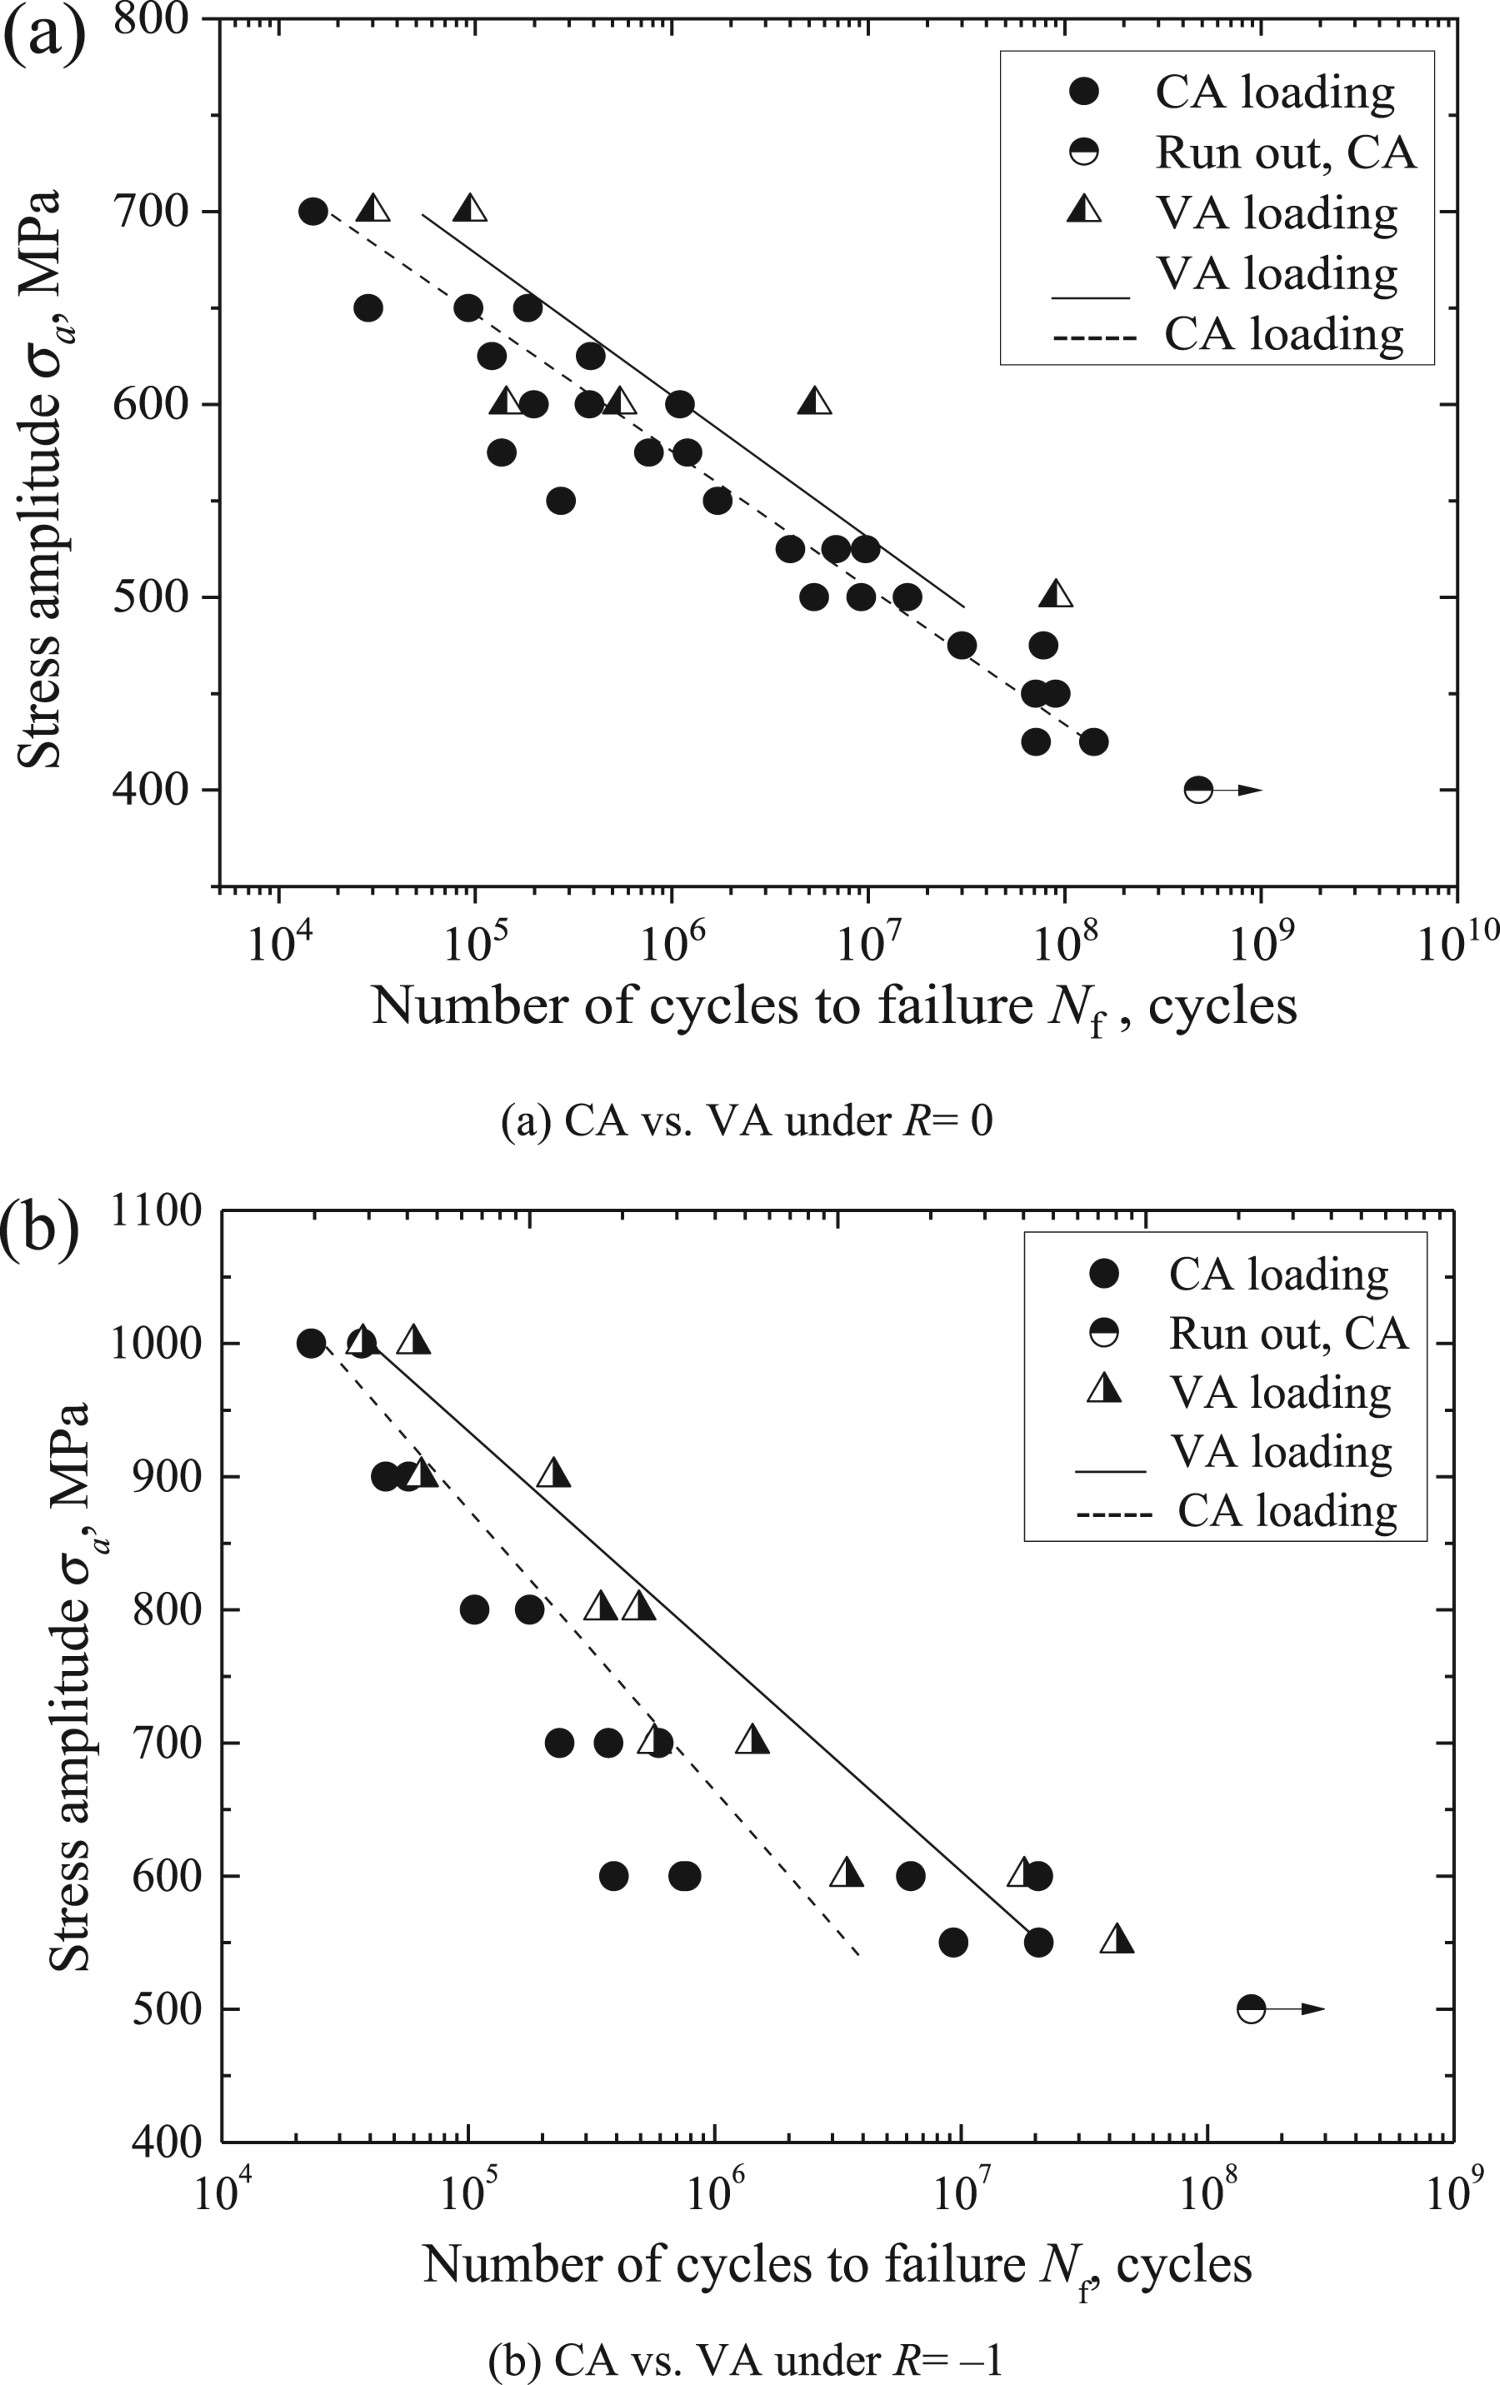
Compared to the S-N curves of the same steel under the CA loading (denoted by interrupted lines in Figure 3 [23-25]), the fatigue strength of the carburised 17Cr2Ni2Mo steel under the VA loading is a bit higher. The main reason is related to the existence of only one stress level in the CA loading however there are several stress levels in VA loading with a medium stress that is generally lower than that of CA loading (Table 2(a) and (b)). As a consequence, the total life is inevitably longer in VA loading due to the effect of low stresses. This is similar to the results of some other studies [26].
Observation of fracture surfaces
Typical fracture surfaces for the VA loading under two stress ratios (R = 0 and R = −1) are presented in Figure 4(a,c) and Figure 5(a,c,d,e,g,i). The enlarged images of the inclusions and the adjacent zones inside the fisheye are given in Figure 5(b,d) and Figure 5(b,f,h,j).
Observation of typical fracture surfaces of carburised 17CrNi under VA loading, R = 0: (a) entire fracture surface, two stress levels (σa
= 700 MPa, N
f = 94,000); (b) inclusion; (c) entire fracture surface, two stress levels (σa
= 600 MPa, N
f = 544,200); (d) Inclusion. Observation of typical fracture surfaces of smooth specimens under VA loading, R = −1: (a) entire fracture surface, three stress levels (σa
= 1000 MPa, N
f = 56,900); (b) inclusion; (c) entire fracture surface, three stress levels (R = –1, σa
= 900 MPa, N
f = 222,200); (d) entire fracture surface, three stress levels (R = –1, σa
= 800 MPa, N
f = 315,000); (e) entire fracture surface, three stress levels (σa
= 800 MPa, N
f = 492,500); (f) inclusion; (g) entire fracture surface, two stress levels (σa
= 600 MPa, N
f = 3,436,600); (h) inclusion; (i) entire fracture surface, two stress levels (σa
= 550 MPa, N
f = 42,935,000); (j) inclusio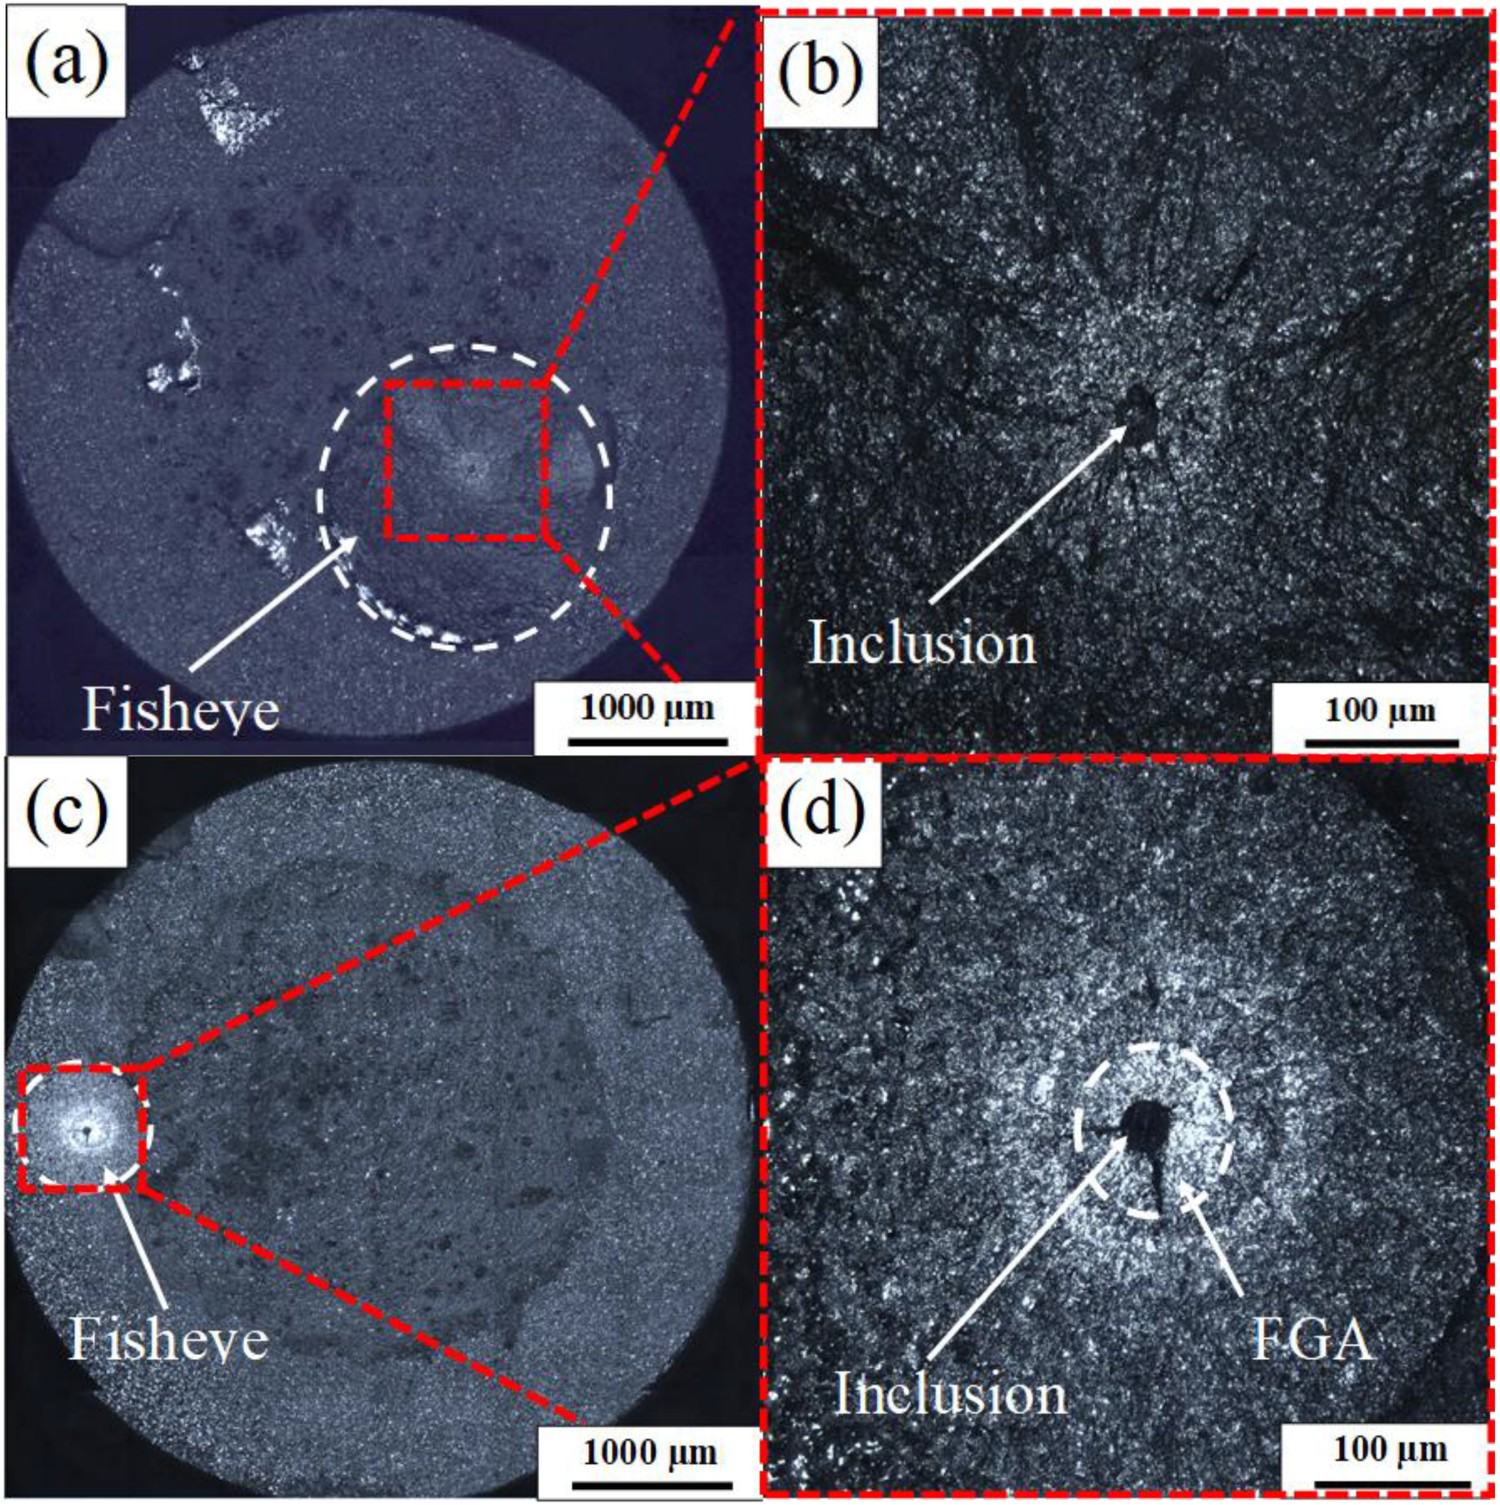

For the VA loading, it can be observed that the interior failure is the only failure mode and the fisheye region can be seen on the fracture surface for the two stress ratios, with an interior inclusion that can be found in the centre of the fisheye. The inclusions are playing a key role in crack nucleation as they serve as stress concentrators on a micro-level during repeated loading. Similar results were obtained for the CA loading.
Moreover, under relatively high-stress levels, multiple crack initiation sites were observed on the fracture surface. Figure 5(c) gives the case of three cracks interfering with each other: the crack initiated from inclusion (1) is predominant compared to the other cracks initiated from inclusions (2) and (3). The fact that inclusion (1) has a larger size makes the stress concentration at the interface with the ambient matrix greater than that of inclusions (2) and (3). Thus, we can say that the crack initiated from inclusion (1) is responsible for the final failure.
In consideration of the FGA occurrence under VA loading, the interior failure with FGA mainly occurs in the VHCF region beyond 107 cycles in both cases (R = 0 as shown in Figure 4(d) and R = −1 as shown in Figure 5(j)). However, it should be noted that the FGA can occur even under the limit of 107 in a few cases especially under R = −1 as shown in Figure 5(h). Moreover, the FGA is not obvious at R = 0 compared to the same stress at R = −1. This is due to the crack closure effect [27] which is more effective under R = −1. Therefore, we can say that even under VA loading, FGA is more prominent under compressive stress.
The analyses of fracture surfaces show circular-shaped marks around the inclusion within the fisheye (Figure 4(b,d) and Figure 5(b,f,h)). This phenomenon is mainly due to the interference between the two crack surfaces: crack's starting and growing at different rates during the VA loading. In addition, the intervals between the circular marks are distinct for different VA tests. This is mainly due to the difference in crack growth rate [6,7] from one test to another.
Evaluation of characteristic crack size
For further discussion on crack size characteristics, the parameters r
inc, r
fisheye and d
inc were defined as: the radius of inclusion, the radius of fisheye, and the inclusion depth; respectively. The inclusion depth was measured from the inclusion's centre to the nearest starting edge of the fracture surface. Figure 6 shows the relationships between d
inc and N
f for both CA and VA tests under the stress ratio −1. As can be seen in the figure, there is no difference between the values of d
inc under both: CA and VA. In addition, all the inclusions were found inside the matrix region, and the range of d
inc is 1663.5–2179.3 µm.
Relationship between d
inc and N
f, R = −1.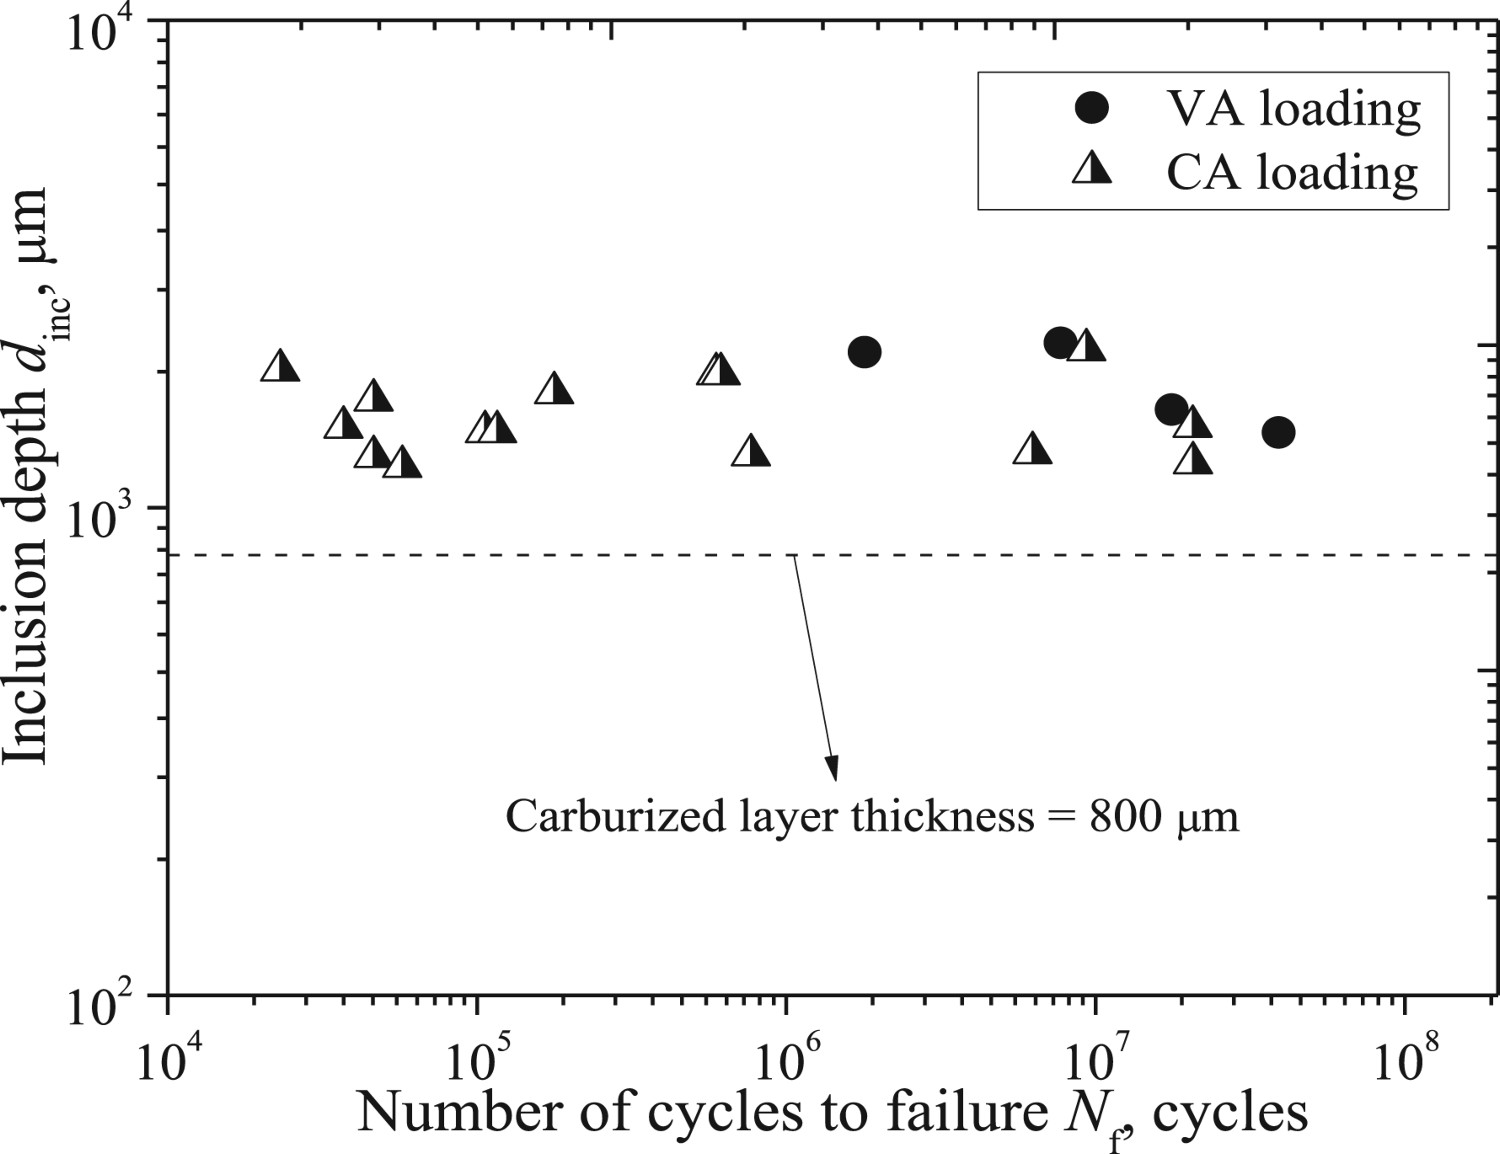
Comparisons between the values of r
inc under CA and VA are given in Figure 7. It can be said that r
inc is independent of both the fatigue life and the loading mode. The slight difference in the r
inc values between CA and VA is mainly caused by the difference in the overall stress applied for each level in the two cases. The range of r
inc under VA loading is 16.1–41.5 µm and the range of r
inc under CA loading is 14.6 and 33.7 μm.
Relationships between r
inc and r
fisheye, and N
f, R = −1.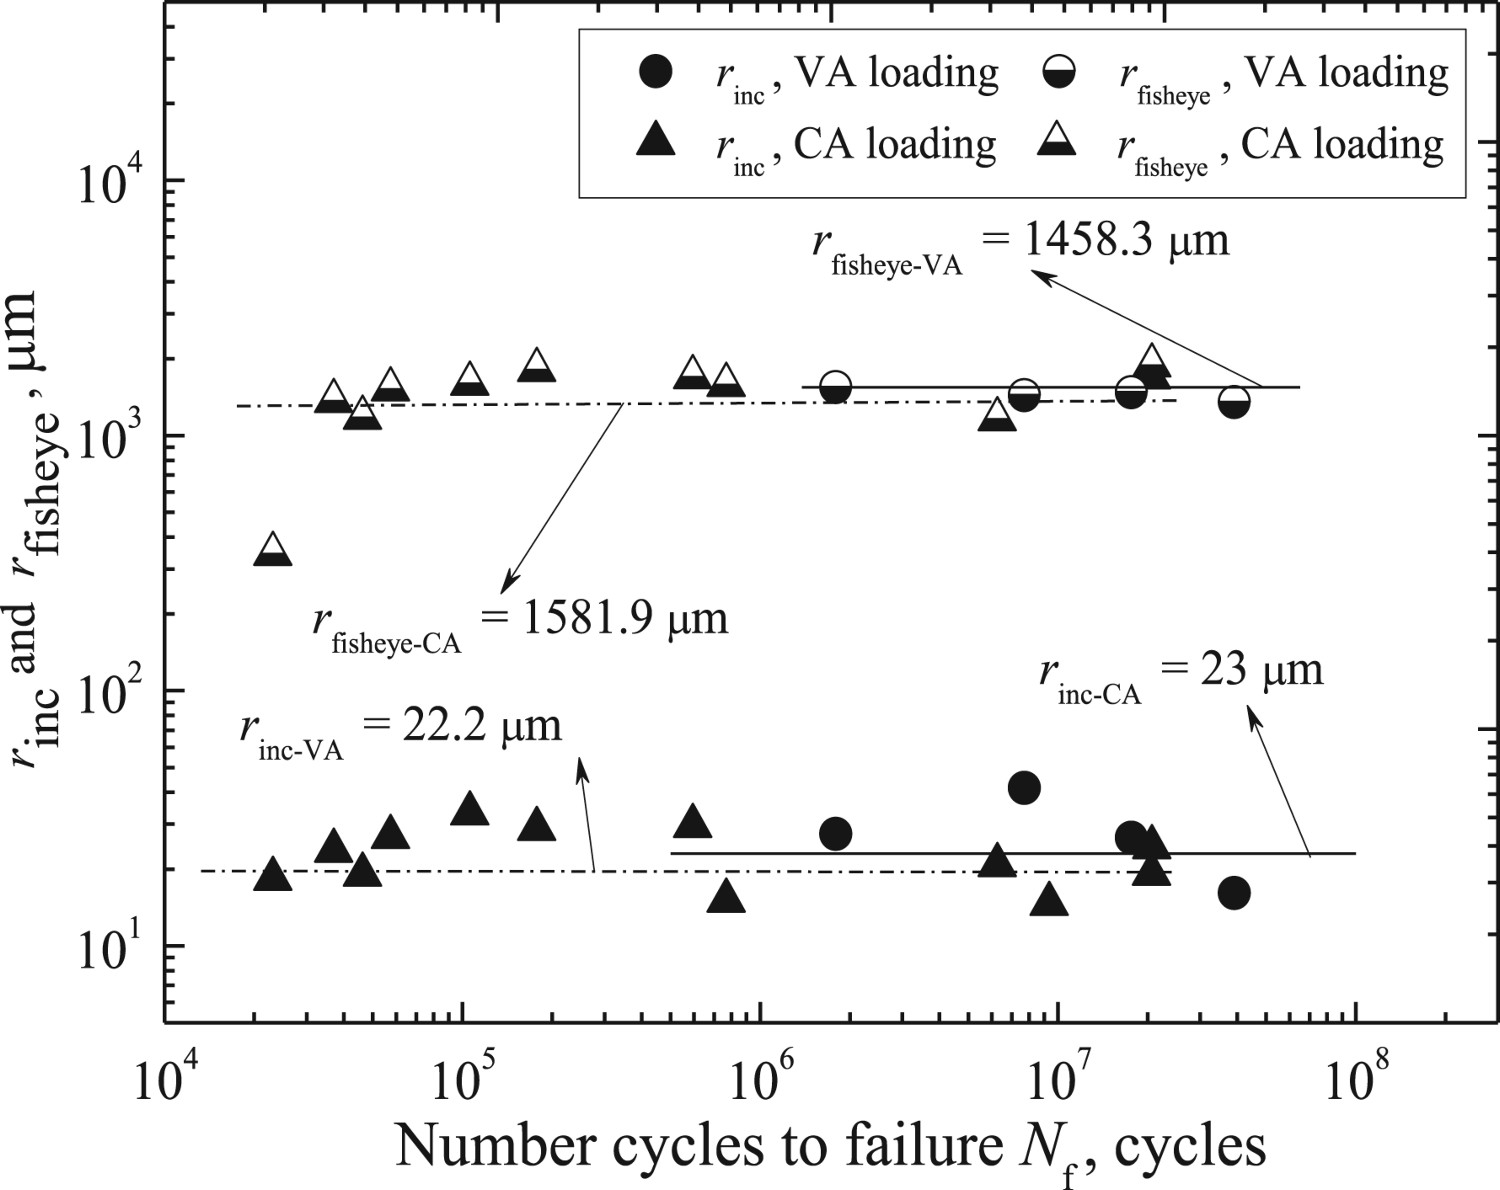
Moreover, the value of r fisheye under the CA loading and the VA loading tends to be constant with the increase of fatigue life N f as shown in Figure 7. The range of r fisheye under VA loading is 1350.6–1546.3 µm and under CA loading is 343.7–1880.7 µm. The difference between r fisheye values from CA to VA is mainly due to the difference in the overall stress applied in the two cases. Thus, the value of r fisheye is independent of the loading mode. Thus, it can be said that the ‘crack size’ value is independent of the loading mode and it is mainly related to the applied stress [27].
Life prediction
Under fully reversed loading condition and based on five damage models, the fatigue life of the carburised 17CrNi high-strength steel was predicted.
Linear damage rule (LDR) or Miner's criterion
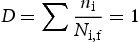
The linear cumulative damage method of Miner's criterion is the earliest cumulative damage calculation method. It was first proposed by Palmgren in 1924. This method is well-known as the name of ‘Palmgren-Miner's criterion’. The mathematical expression of this criterion is given as follows [28]:
Modified linear damage rule (MLDR) or modified miner's criterion
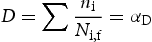
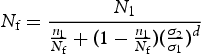
Many previous researchers have found that the value of cumulative damage D doesn't equal to 1 when fatigue failure occurs. Thus, it can be said that the fatigue life based on Miner's rule is inadequate. For this reason, the Miner's criterion has been revised then a new formula ‘the Modified Miner's criterion’ was proposed [29]:
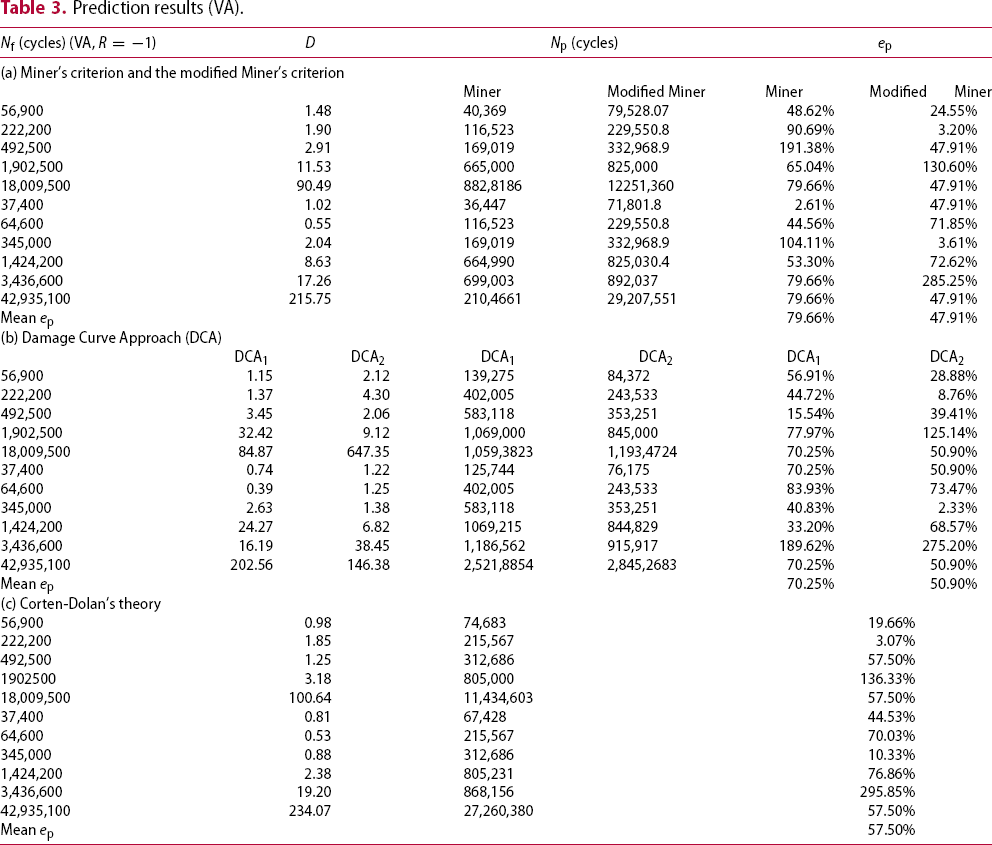
Prediction results (VA).
Damage curve approach (DCA)
Both, Miner's and modified Miner's rules ignore the impact of loading sequence on fatigue life. To improve the accuracy of fatigue life prediction, Manson [30] proposed the Damage Curve Approach. For multiple-level loading, the Damage Curve Approach is given as follows:
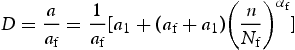

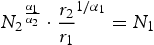
For multi-stage loading, the fatigue life at the highest stress level can be regarded as the reference fatigue life, and the corresponding relationship can be constructed. Therefore, the amount of damage caused by the second stress level can be calculated as follows:
Based on the Damage Curve Approach (DCA) (Eq. (3)), D and the predicted fatigue life (Np) were calculated under R = −1 as given in Table 3(b). DCA1 represents the case of the Damage Curve Approach with the maximum stress as a reference and DCA2 represents the case of the Damage Curve Approach with the minimum stress as a reference.
Corten-Dolan's theory
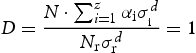
Corten-Dolan's theory is a nonlinear damage theory proposed by Corten and Dolan in 1956. According to Corten-Dolan's theory, the amount of damage caused by a single crack can be expressed as follows [31]:

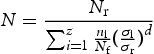
Based on Eq. (12), the amount of damage is defined as:

It can be observed from Table 3(a), (b), and (c) that by using the modified Miner's criterion and the DCA2 the predicted lives are generally lower than the experimental life. In addition, these predicted lives are relatively stable and they are closest to the experimental life. The average value of the prediction error for the modified Miner's criterion is 47.91% and for the DCA2 is 50.90%. Therefore, it will be safer to make a fatigue design based on these two methods.
Based on DCA1, the predicted results are slightly greater than the experimental life, with a range of prediction errors of about 15.54%–189.62%. It can be said that the prediction error is relatively high.
The predicted life based on Miner's criterion is the largest among the five methods with a range of prediction error is about 2.61%–104.11% and an average prediction error of about 79.66%.
The predicted lives using the above-studied methods were compared with the experimental data as shown in Figure 8. Both calculated lives using modified Miner's rule and Corten-Dolan's theory have no significant difference from experimental life when N
f < 106 cycles. Most of the data are located near the central line, very close to the experimental data. When N
f > 106 cycles, except for Miner's criterion; the other four approaches tend to be in good agreement with the experimental data.
Comparison between predicted and experimental fatigue lives (VA, R = −1).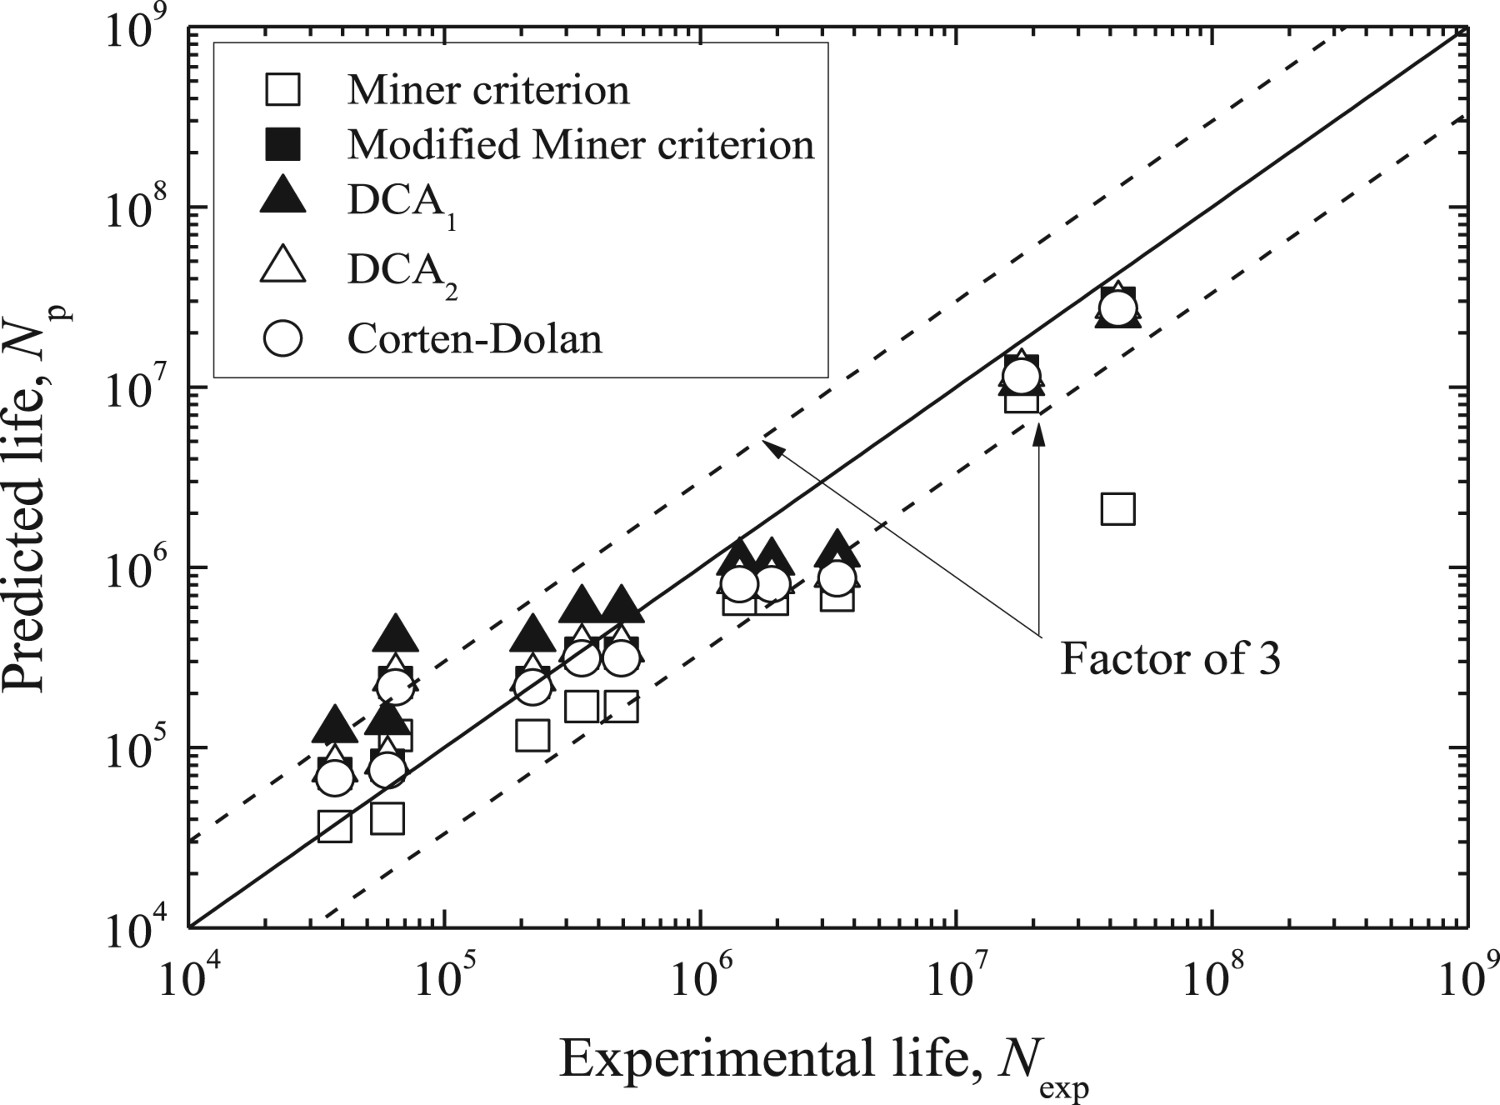
Comparing the five discussed approaches, one can say that the modified Miner's criterion has the highest prediction accuracy for the carburised 17CrNi high-strength steel. It was noted that the prediction error varies in relatively wide ranges. However, there are more significant factors that can play a key factor in fatigue design such as the position of the predicted data relative to the experimental curve. Thus, in such analytical models, the best formula should be made by taking into consideration all the details but according to the importance level. Further improvements have to be made in future works in terms of minimising the prediction error.
Conclusions
Under VA loading, the FGA is more prominent in the presence of compressive stress, which is similar to the results for steels under CA loading. The analyses of the fracture surfaces show circular marks formed around the inclusion inside the fisheye. This is mainly due to the interior cracks starting, stopping, and growing at different rates during the VA loading. The value of the ‘crack size’ is independent of the loading mode (CA or VA) and it is mainly related to the applied stress. Based on five damage models: Miner's criterion, Modified Miner's criterion, the Damage Curve Approach with maximum stress as a reference stress (DCA1), the Damage Curve Approach with minimum stress as a reference stress (DCA2), and the Corten-Dolan's theory, the fatigue life for the smooth specimens of the carburised 17CrNi high-strength steel was predicted under fully reversed loading condition. The comparison of the calculated lives with the experimental data reveals that the modified Miner's criterion is the most accurate and can adequately characterise the fatigue life of the carburised 17CrNi high-strength steel under VA loading.
Footnotes
Disclosure statement
No potential conflict of interest was reported by the authors.