
Abstract
Adding SiC particle (SiCp) to Al alloys to form Al/SiCp composite can increase the elastic modulus and reduce the thermal expansion coefficient of the material. In this study, the microstructure, porosity and thermal expansion coefficient, and mechanical properties of AlSi10Mg-10 vol.% SiCp composite fabricated by laser powder bed fusion (LPBF) were investigated. The ultimate tensile strength, compressive strength, compressive modulus, and the thermal expansion coefficient of LPBF-deposited AlSi10Mg/SiCp composite are 351, 861.9 MPa, 121.9 GPa and 18.23 × 10⁻⁶°C−1, respectively. The results demonstrate that the use of the Ev equation to evaluate the effect of LPBF parameters on mechanical properties and relative density of the composites is accurate when only one parameter changes in the Ev equation.
Keywords
Introduction
Aluminum alloys are commonly used in automotive and aerospace fields owing to their high specific strength and corrosion resistance [1,2]. However, the relatively low stiffness and high thermal expand coefficient of Al alloys restrict their application in an extreme engineering environment. Fortunately, adding SiC to aluminum alloys can increase the stiffness while lowering the thermal expand coefficient of the material. Al/SiCp composites can be extensively applied in aerospace, electronic packaging, nuclear power, and other fields due to their excellent thermal expand coefficient and mechanical properties. However, the processing performance of Al/SiCp composites is poor, which can limit its application to a certain extent. Therefore, metal additive manufacturing is a new manufacturing technology developed in recent 30 years, and has the advantages of near net-shaping, rapid manufacturing, and high design freedom, addressing the problem of poor machining performance of Al/SiCp composites.
Recently, an increasing number of studies investigating the additive manufacturing of Al/SiCp composites have been published [3,4]. Laser powder bed fusion (LPBF) additive manufacturing is currently able to produce metal parts with a complex shape suitable for high demanding applications in space, aerospace, medical, and racing fields [5,6]. Therefore, the effects of processing parameters and the SiCp character on the microstructure and mechanical properties of LPBF-deposited Al/SiCp composites have been systematically studied [3,4,7–13]. Chang et al. [9], Gu [12], Zhao et al. [13] found that deposition parameters (especially the laser power and the laser scanning speed) and particle sizes strongly affected the final microstructure, the density, the porosity, and the mechanical properties of the composite. Xue et al. [4,11] considered that the relative density of LPBF-deposited AlSi10Mg-15wt.%SiCp composites increased with the laser power, and the excessive laser energy input could lead to the pore formation while the mechanical properties improved with the decreasing SiC particle size. Jandaghi et al. [14,15] demonstrated that the nanoparticle reinforced Al matrix composites are superior to those of microscale reinforced Al matrix composites. Compared with the microscale reinforcement, due to the fine grain strengthening, the acquired average hardness for nano-oxide reinforced specimens was greater than the values for LPBF-fabricated AlSi10Mg-matrix composites. However, nanoscale particle reinforcements are easily prone to aggregation in the aluminum matrix owing to the poor wettability and high specific surface area [3]. Thus, microscale SiC particles with lower cost price than the nano-scale particles and relatively more homogenous distribution of pre-mixed matrix alloys were extensively applied to reinforce AlSi10Mg alloys fabricated by LPBF. The volumetric laser energy density (Ev) is a vital parameter for evaluating the effect of LPBF parameters on the structure and properties of LPBF-deposited alloys [16,17]. The value of Ev can be calculated as follows [18]:

During the LPBF process of Al/SiCp composites, SiCp can react with Al to form Al–Si–C or Al-C compounds. Astfalck et al. [20] suggested that a new phase Al4C3 formed during the LPBF process of Al12Si/SiCp composites, while Zhang et al. [19] considered that the elongated Al4SiC4 was produced during the LPBF process of AlSi10Mg/SiCp composites. Xue et al. [4,11] reported that the new phase appearing in the AlSi10Mg/SiCp composite deposited by LPBF was Al4SiC4 or Al4C3. Here, it should be noted that it remains uncertain whether the new phase in the LPBF-deposited Al/SiCp composites is Al4SiC4 or Al4C3. Moreover, it is also unclear whether the new compounds in the LPBF process are beneficial or detrimental to the properties of Al/SiCp composites.
In this study, the effects of processing parameters (e.g. the laser power, the laser scanning speed, and the hatch spacing) on the structure, defect, and mechanical properties of LPBF-deposited AlSi10Mg-10 vol.% SiCp composites were investigated. In addition, the function of the formed Al4SiC4 phase and the preconditions of the Ev equation were discussed emphatically.
Materials and methods
Materials
The gas atomised spherical AlSi10Mg alloy powders (Figure 1a) with a diameter between 15 and 53 µm were used (Xi'an Bright Laser Technologies CO., LTD., China). The average chemical compositions (wt.%) of AlSi10Mg powders analysed by inductively coupled plasma-atomic emission spectrometry (ICP-AES) are listed in Table 1.
Deposited materials for LPBF-deposited AlSi10Mg/SiCp composites: (a) AlSi10Mg particles, (b) SiC particles, (c) mixture of AlSi10Mg and SiC particles, (d) magnified image of the marked rectangle region in (c), (e) particle size distribution of the AlSi10Mg and SiC particles, and (f) detailed powder size distribution of the two powders. Chemical composition of AlSi10Mg alloy powders.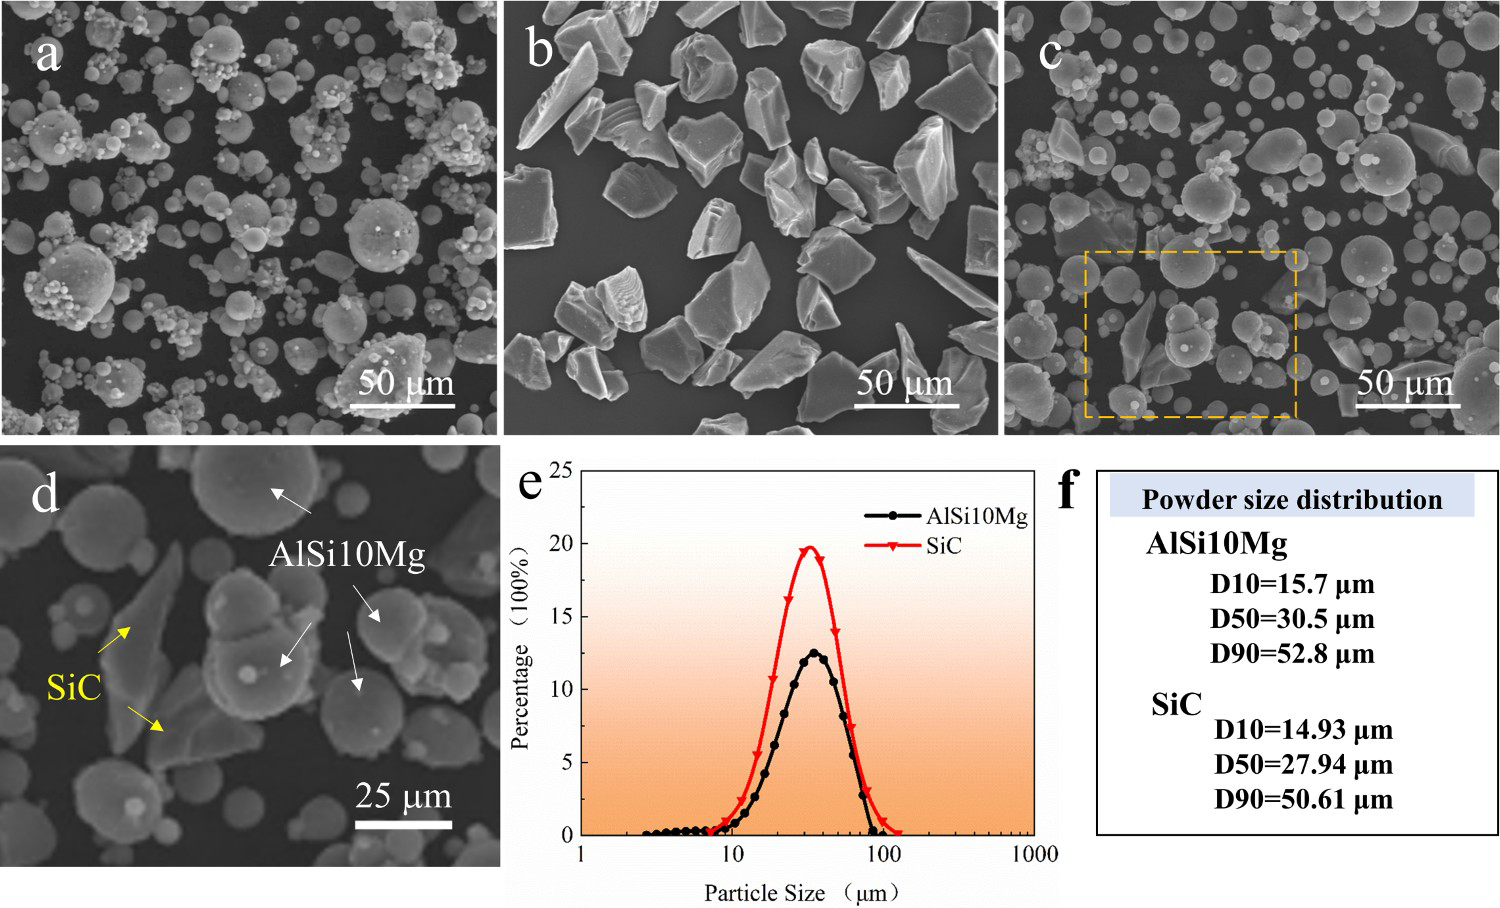
SiC powders were formed by an air-current mill method with an irregular shape (Figure 1b) and the average powder size of 28 µm (Shandong Jinmeng New Material CO., LTD, China). The irregularities morphology of the SiC particles determined the poor flowability of its. Owing to this character of the SiC particles, in order to further obtain a homogenous powder distribution and to modify the morphology of the irregular-shaped SiC powders, we added the steel balls during the mixed process to keep the SiC particles distribute in the mixed powders uniformly. SiC particles and AlSi10Mg powders with a weight ratio of 11.6: 88.4 were blended in a planetary ball mill (YXQM-2L, Changsha Mitr Instrument Equipment Co., Ltd, China) at a speed rate of around 120 rpm for 70 min. The detailed mixture procedure is presented as follows. The machine was set to rotate clockwise for 30 min, which was then stopped for 10 min, and was finally set to rotate counterclockwise for 30 min. Three diameters (5, 10, and 15 mm) of steel balls were mixed with a weight ratio of 2:3:5 as a ball milling material. Then, we weight the AlSi10Mg/SiCp composite powders and the mixed steel balls at a weight ratio of 1:1 to blend the composite powders. After the ball milling, the mixed steel balls were removed by large meshes, while after blending, mixed composite powders were dried in a vacuum oven at 120°C for 2 h to remove the absorbed water. The morphology of size distribution of the AlSi10Mg and SiC powders after blending is shown Figure 1c–f, respectively.
Additive manufacturing
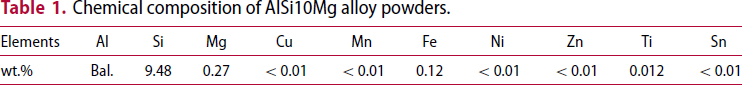
The composites were deposited by an S310 Metal additive manufacturing machine (Xi'an Bright Laser Technologies CO., LTD., China), containing an IPG YLR-500-WC fibre laser (1.06 µm wavelength) with 500 W maximum output power, a powder feeder system, and a computer system to control the device. The deposition experiments were protected in an Argon atmosphere with an inlet pressure of 6.9 bar and the oxygen content below 300 ppm. To ensure that the deposited parts and the substrate bond firmly, the laser beam re-melted the substrate three times without any powder spreading at the beginning of the deposition process. To reduce the thermal stress at the interface between the substrate and the deposits, laser beams were used to scan the first powder layer three times, while three times of re-melting processes could make the deposited layer firmly grow without the pre-heated substrate at room temperatures. Figure 2a displays the schematic concerning the deposition process of LPBF AlSi10Mg/SiCp composites. The scanning strategy is the alternate hatching with the single pass of the laser beam. The direction of scanning is rotated at 67° between consecutive layers. For example, the first layer is 67° and the n-th layer is rotated at n × 67°, as displayed in Figure 2b. The magnification morphology of the melt-pool region marked by blue rectangle lines (Figure 2c) depicts three regions, namely, liquid, solid, and liquid–solid two-phase regions. Five laser powers (280, 300, 320, 340 and 360 W), five laser scanning speeds (900, 1000, 1100, 1200 and 1300 mm/s), seven kinds of the hatch spacing (0.05, 0.07, 0.09, 0.11, 0.13, 0.15 and 0.17 mm), and a constant layer thickness (0.03 mm) were employed to form the composites. After the deposition, the wire electrical discharge machining (W-EDM) was adopted for cutting the samples from the substrate, followed by the samples being cleaned by an ultrasonic wave in acetone to remove the impurity at the surface of the deposited parts.
The deposition process and deposited samples of LPBF-deposited AlSi10Mg/SiCp composites: (a) the L-PBF process, (b) scanning strategy, and (c) magnified morphology of the melt-pool region marked by the blue rectangle in (a); the black arrows in the L+S region denote the grain growth direction, and L, S, and L+S represent liquid, solid, and the liquid–solid two-phase regions, respectively; (d) the geometry size and deposited tensile specimen, (e) the geometry of compression samples (unit: mm), and deposited samples of the composites.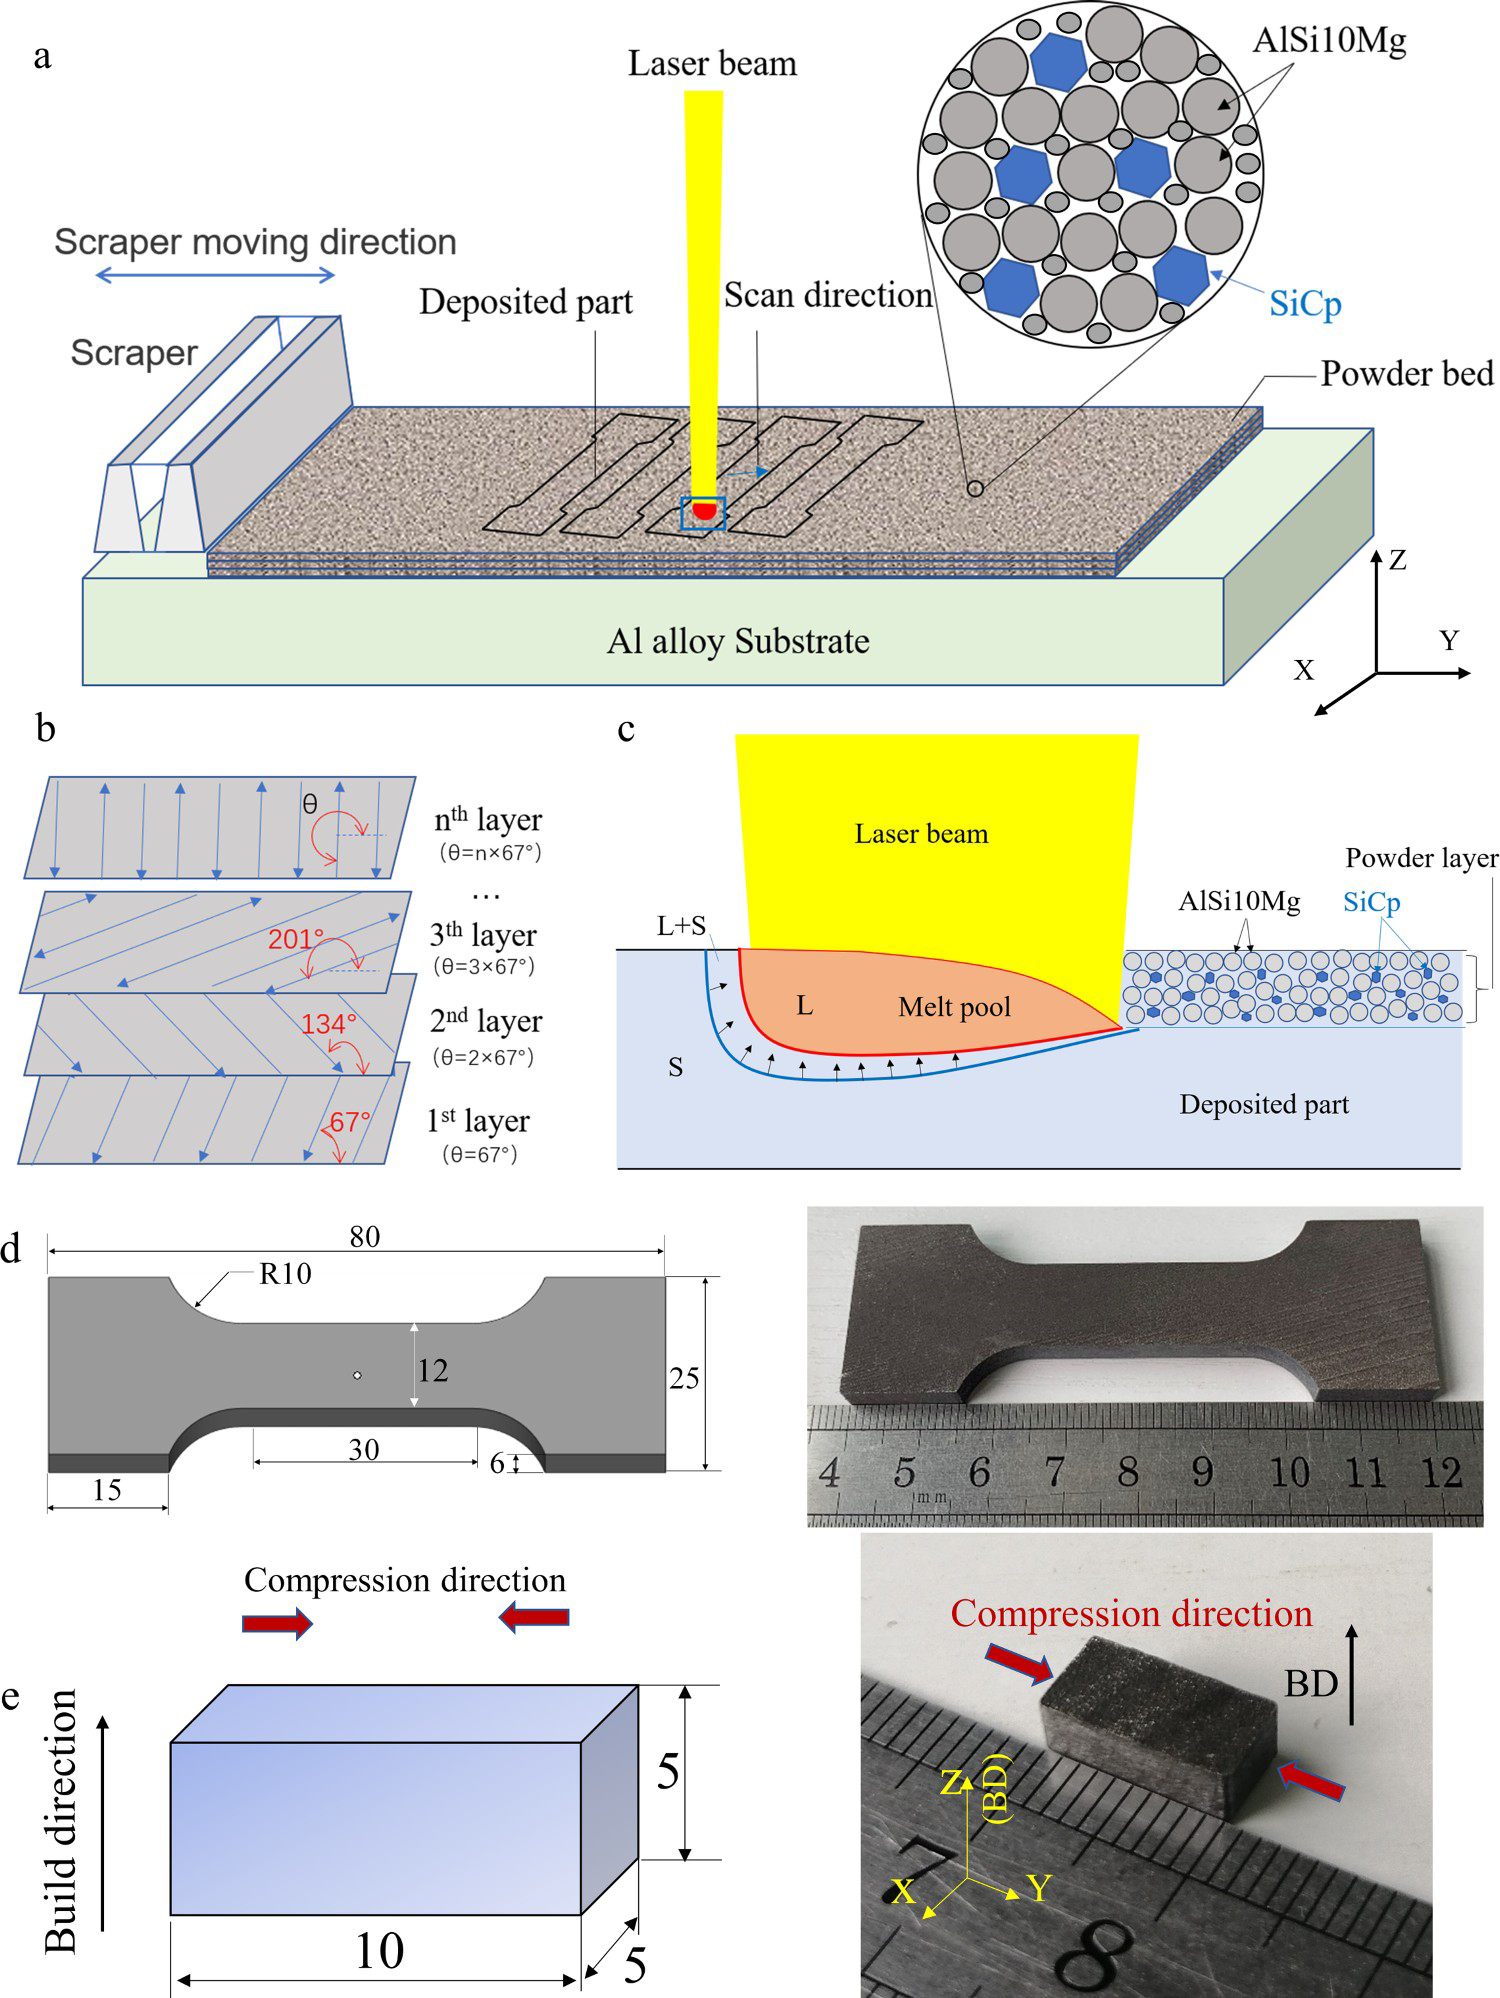
Characterization methods
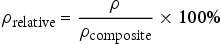
The density of deposited parts was measured by the Archimedes principle, and distilled water was used for the measurements in the experiments. The theoretical density of the composite part was calculated using Equation (2):

To detect the inner defects of the deposited composites, the X-ray micro-computed tomography (X-CT, GE Vtomex s) test was performed at a voltage of 100 kV and a current of 120 µA. This microfocus X-ray CT system has an additional 180 kV submicron X-ray tube and the high-contrast digital flat panel detector for the greatest possible versatility. Here, it's clear that the small geometry size (5 × 5 × 5 mm3) of the samples was employed. At the beginning of the detection test, three resolutions of the pixel (5, 10, 25 μm) were employed to detect the inner defect distribution. However, it was found that the defects distributed in the deposited composites could hardly be distinguished owing to the use of the high resolution (i.e. 5 and 10 µm). Thus, the relatively low resolution (25 µm) was adopted for detecting the defect distribution in this experiment. Moreover, it should be noted that the final statistics of the porosity percent basically remain constant under three kinds of resolution conditions.
The electronic universal testing machine (UTM 5105) was employed to test the compression strength of the composites. The geometry size of compressive samples is cubic (10 × 5 × 5 mm3). The hardness was measured by the Electronic Brinell hardness tester (THB-3000E, Beijing TIME High Technology Ltd., China) using the 5-mm diameter indenter carbide at 250 kgf load and the load dwell duration of 15 s. Each of the sample was measured five times. The tensile properties were tested by the universal tensile testing machine (MTS E45.105) at a tensile rate of 1 mm/min at room temperature. The tensile specimens (Figure 2d) and testing processes were performed in line with the national standard GB/T 228.1-2010 (Metallic materials - Tensile testing Part 1 - Method of test at room temperature, corresponding to ISO 6892-1-2009), while the compression samples (Figure 2e) and testing procedure were performed according to ASTM E9-2009 (Standard Test methods of compression testing of metallic materials at room temperature) at room temperature and at a speed of 0.5 mm/min.
The Nikon EPIPHOT 300 optical microscope (OM) and Hitachi S-4800 FE-SEM scanning electron microscope (SEM) were used to characterise the microstructure of the deposited composites after the samples were ground, polished and etched in a solution of Keller's reagent (2.5 ml HNO3, 1.5 ml HCl, 1.0 ml HF and 95 ml H2O) for 15 s. The acceleration voltage of SEM at 5.0 keV was employed to observe the microstructure. Moreover, an energy-dispersive spectroscope (EDS) was adopted for the chemical compositions, an accessory of the SEM at 5.0 keV, using an ultra-thin window sapphire detector. In addition, phase identification was conducted by the Bruker D8 Phaser XRD with Cu Kα radiation at 40 kV and 40 mA with a continuous scan mode at 1°/min.
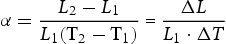
The thermal mechanical analyser (TMA, TMA/SDTA840) was adopted to measure the coefficient of the thermal expansion (α) using Equation (4):
Results
Relative density and defects of AlSi10Mg-10 vol.% SiCp composites deposited by LPBF
Generally, pores and porosity can strongly affect the relative density, tensile and fatigue properties of the deposited parts [21,22]. Thus, the relative densities of LPBF-deposited AlSi10Mg/SiCp composites at different deposition volumetric laser energy density conditions were investigated.
Figure 3a–c show micro-CT images of pore morphology in the L-PBF-deposited AlSi10Mg/SiCp composites. From the OM images of the deposited composites, several micropores were found in the three laser power (280, 320 and 360 W) samples (Figure 3d–f). To fully understand the inner defects of the deposited composites, the micro-CT test was performed. The results of micro-CT tests demonstrate that the number of micropores in the deposited composites firstly increases and then decreases when the volumetric laser energy density increases from 280 to 360 W. In addition, the pore spatial distribution and its 3D morphology are presented, showing unregular spherical shape pores in the deposited composites (Figure 3a–c). Furthermore, it is shown that the relative density of the composites measured by the micro-CT is higher than that of the Archimedes method, because the micro-CT test can only distinguish the holes larger than a certain size. The detailed values of relative density, void volume, and void percent in three laser powers measured by micro-CT tests are displayed in Table 2. The highest relative density of the deposited composites reaches 98.30% at the laser power of 320 W (Table 2).
Micro-pore and relative density of the LPBF-deposited AlSi10Mg/SiCp composites: (a)–(c) Micro-pores measured by micro-CT in the samples (the laser scanning speed = 1100 mm/s, the hatch spacing = 0.11mm, and the layer thickness = 0.03 mm) at the laser power of 280, 320 and 360 W, (d)–(f) OM images of pore morphology in the L-PBF-fabricated AlSi10Mg/SiCp composites (the laser scanning speed = 1100 mm/s, the hatch spacing = 0.11mm, and the layer thickness = 0.03 mm) at the laser power of 280, 320 and 360 W, (g) relative density measured by the Archimedes method in the samples at various hatch spacings (the laser power = 320 W, the laser scanning speed = 1100 mm/s, and the layer thickness = 0.03 mm), and (h) relative density measured by the Archimedes method in the samples at various laser powers and scanning speeds (the hatch spacing = 0.11mm, and the layer thickness = 0.03 mm). Porosity at different laser powers for samples of LPBF-deposited AlSi10Mg/SiC composites measured by micro-CT tests.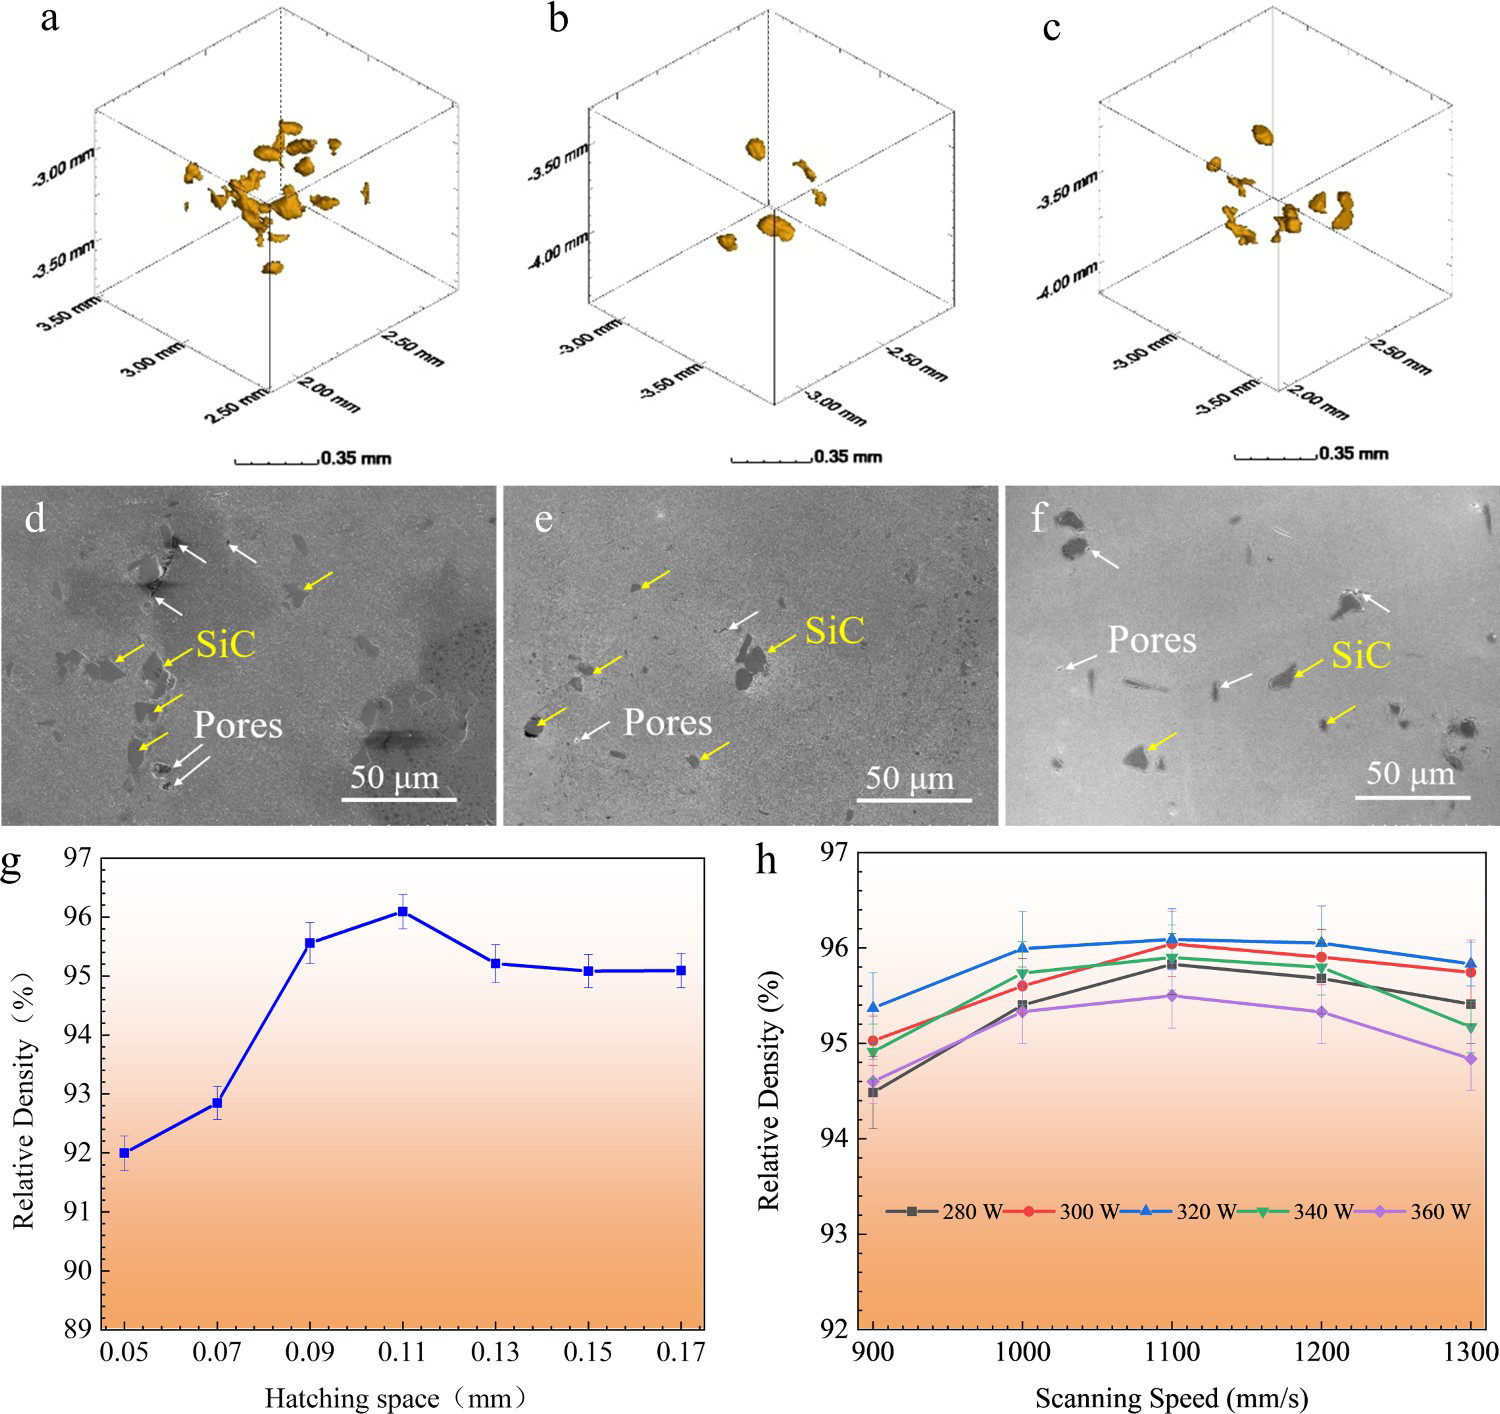
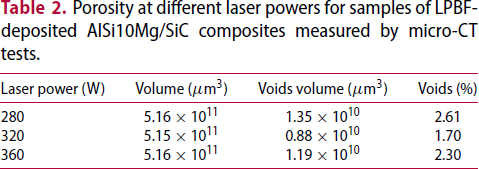
Figure 3 g describes the relationship between the relative density and the hatch spacing of the deposited composites at the laser power of 320 W and the laser scanning speed of 1100 mm/s. With an increase of the hatch spacing from 0.05–0.17 mm, the relative density firstly increases and then decreases, and the maximum relative density (∼ 96.09%) is achieved at the hatch spacing of 0.11 mm. Figure 3 h displays that the relative densities vary with laser scanning speeds at different laser powers. These results indicate that at a certain laser power condition, the relative density increases and then decreases as the laser scanning speed changes, and their peak values basically occur at the laser scanning speed of 1100 mm/s.
Microstructure of AlSi10Mg vol.% SiCp composites deposited by LPBF
Figure 4 shows the typical microstructure of AlSi10Mg-10 vol.% SiCp composites deposited by LPBF. The macrostructures of the deposited composites mainly exhibit the laser track segment with two cross directions at ∼67° (Figure 4a and b) in the horizontal view (i.e. perpendicular to deposition direction). Here, it's clear that this angle (∼67°) is well consistent with the deposition scanning strategy between two layers (see Figure 2b). In the vertical view (i.e. parallel to deposition direction), large number of melt-pool boundaries (see Figure 4c) are presented. As shown in Figure 4d, the melt-pool boundary displays the different microstructures from the interior melt pool. In the melt-pool regions, many un-melted irregular-shaped SiC powders and several micro-pores are found (Figure 4e). In a higher magnification, the transition region between the SiC phase and the matrix is also discovered (Figure 4f), indicating that partially-melted SiC particles exist in the deposited composites. In addition, several Al4SiC4 phases with long-and-sharp shapes are observed in the matrix (Figure 4 g). The EDS element content of the LPBF-deposited AlSi10Mg/SiCp composites is shown in Figures 4(g, h). From the EDS testing (from spot 39), the atom ratio of Al: Si: C is approximately close to 4: 1: 4, which indicates that the long-stripe phases are detected to be Al4SiC4 phases. The typical microstructure exhibits (Al + Si) eutectic phases and cell-like a-Al phases within the melt pool (Figure 4 g) as well as Al matrixes and nano-sized Si particles near the SiC particles. These findings prove the heterogeneous microstructures presented in the deposited composites.
Microstructure of the LPBF-deposited AlSi10Mg-10 vol.% SiCp composites (the laser power = 320W, the laser scanning speed = 1100 mm/s, the hatch spacing = 0.11mm, and the layer thickness = 0.03 mm): (a) Macrostructure morphology of the deposited composite viewed horizontally (i.e. perpendicular to the build direction, BD), (b) the magnified image of (a), (c) macrostructure morphology viewed vertically (i.e. parallel to the BD), (d) microstructure in the melt-pool boundary, (e) SiC particle morphology, (f) the transition region between the SiC phase and the matrix, (g) the SEM image of long-stripe phases, and (h) detailed element contents of the spot marked in (g).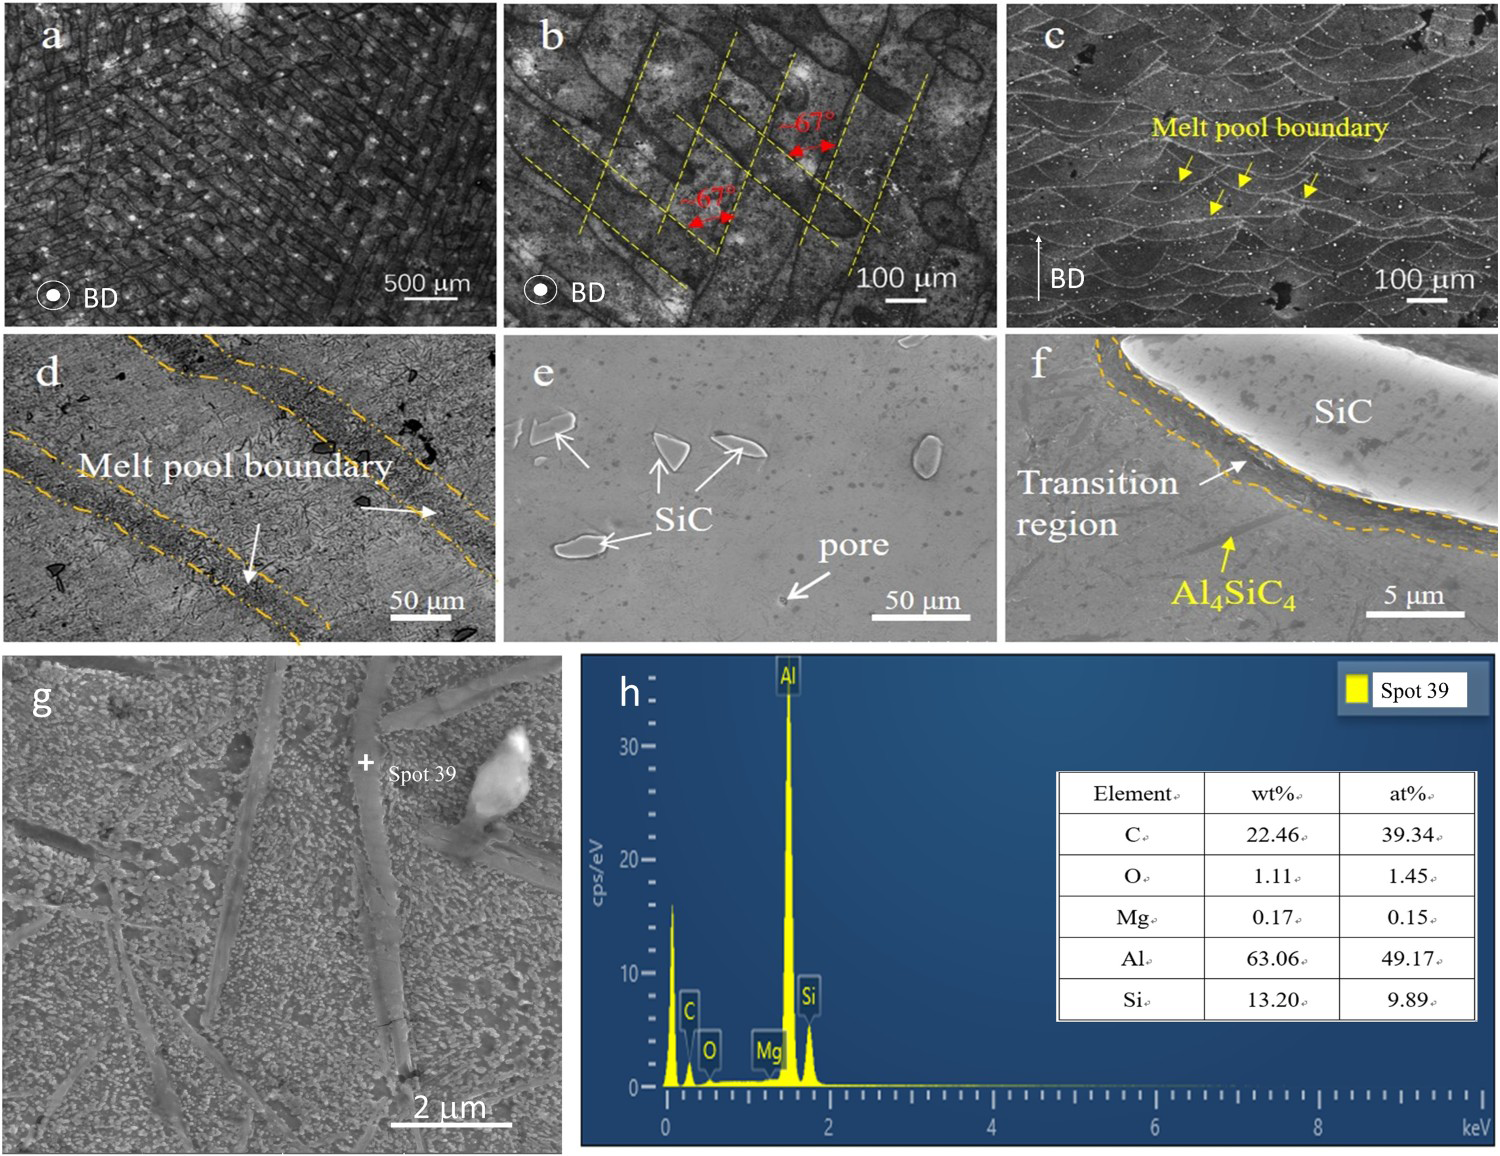
Effects of processing parameters on the microstructure and mechanical property of AlSi10Mg-10 vol.% SiCp composites deposited by LPBF
Figure 5 shows the XRD patterns of AlSi10Mg/SiCp composites under different laser power conditions. From the XRD patterns, the strong diffraction peaks contain Al, Si and SiC phases in the deposited samples (Figure 5a). In addition, the low diffraction peak intensity of Al4SiC4 phases is also detected in the deposited composite samples (Figure 5b–d). However, the detailed diffraction values of the LPBF-deposited AlSi10Mg-10 vol.% SiCp composites are listed in Table 3. The measured angles of the diffraction peaks are in line with the standard values of a specific phase, demonstrating that these calibrated phases are truly presented in the deposited composites. Furthermore, Figure 5e–m present that the content of Al4SiC4 in the sample increases with the increasing laser power.
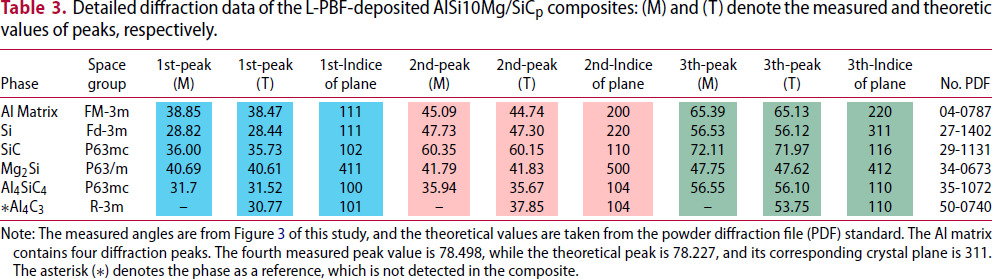
Effects of processing parameters on the structure of the LPBF-deposited AlSi10Mg/SiCp composites (the laser scanning speed = 1100 mm/s, the hatch spacing = 0.11mm, and the layer thickness = 0.03 mm): (a)–(d) XRD patterns, (e)–(g) morphology at the laser power of 280, 320 and 360 W; (h)–(f) the fracture morphology of tensile specimens at the laser power of 280, 320 and 360 W. Detailed diffraction data of the L-PBF-deposited AlSi10Mg/SiCp composites: (M) and (T) denote the measured and theoretic values of peaks, respectively. Note: The measured angles are from Figure 3 of this study, and the theoretical values are taken from the powder diffraction file (PDF) standard. The Al matrix contains four diffraction peaks. The fourth measured peak value is 78.498, while the theoretical peak is 78.227, and its corresponding crystal plane is 311. The asterisk (*) denotes the phase as a reference, which is not detected in the composite.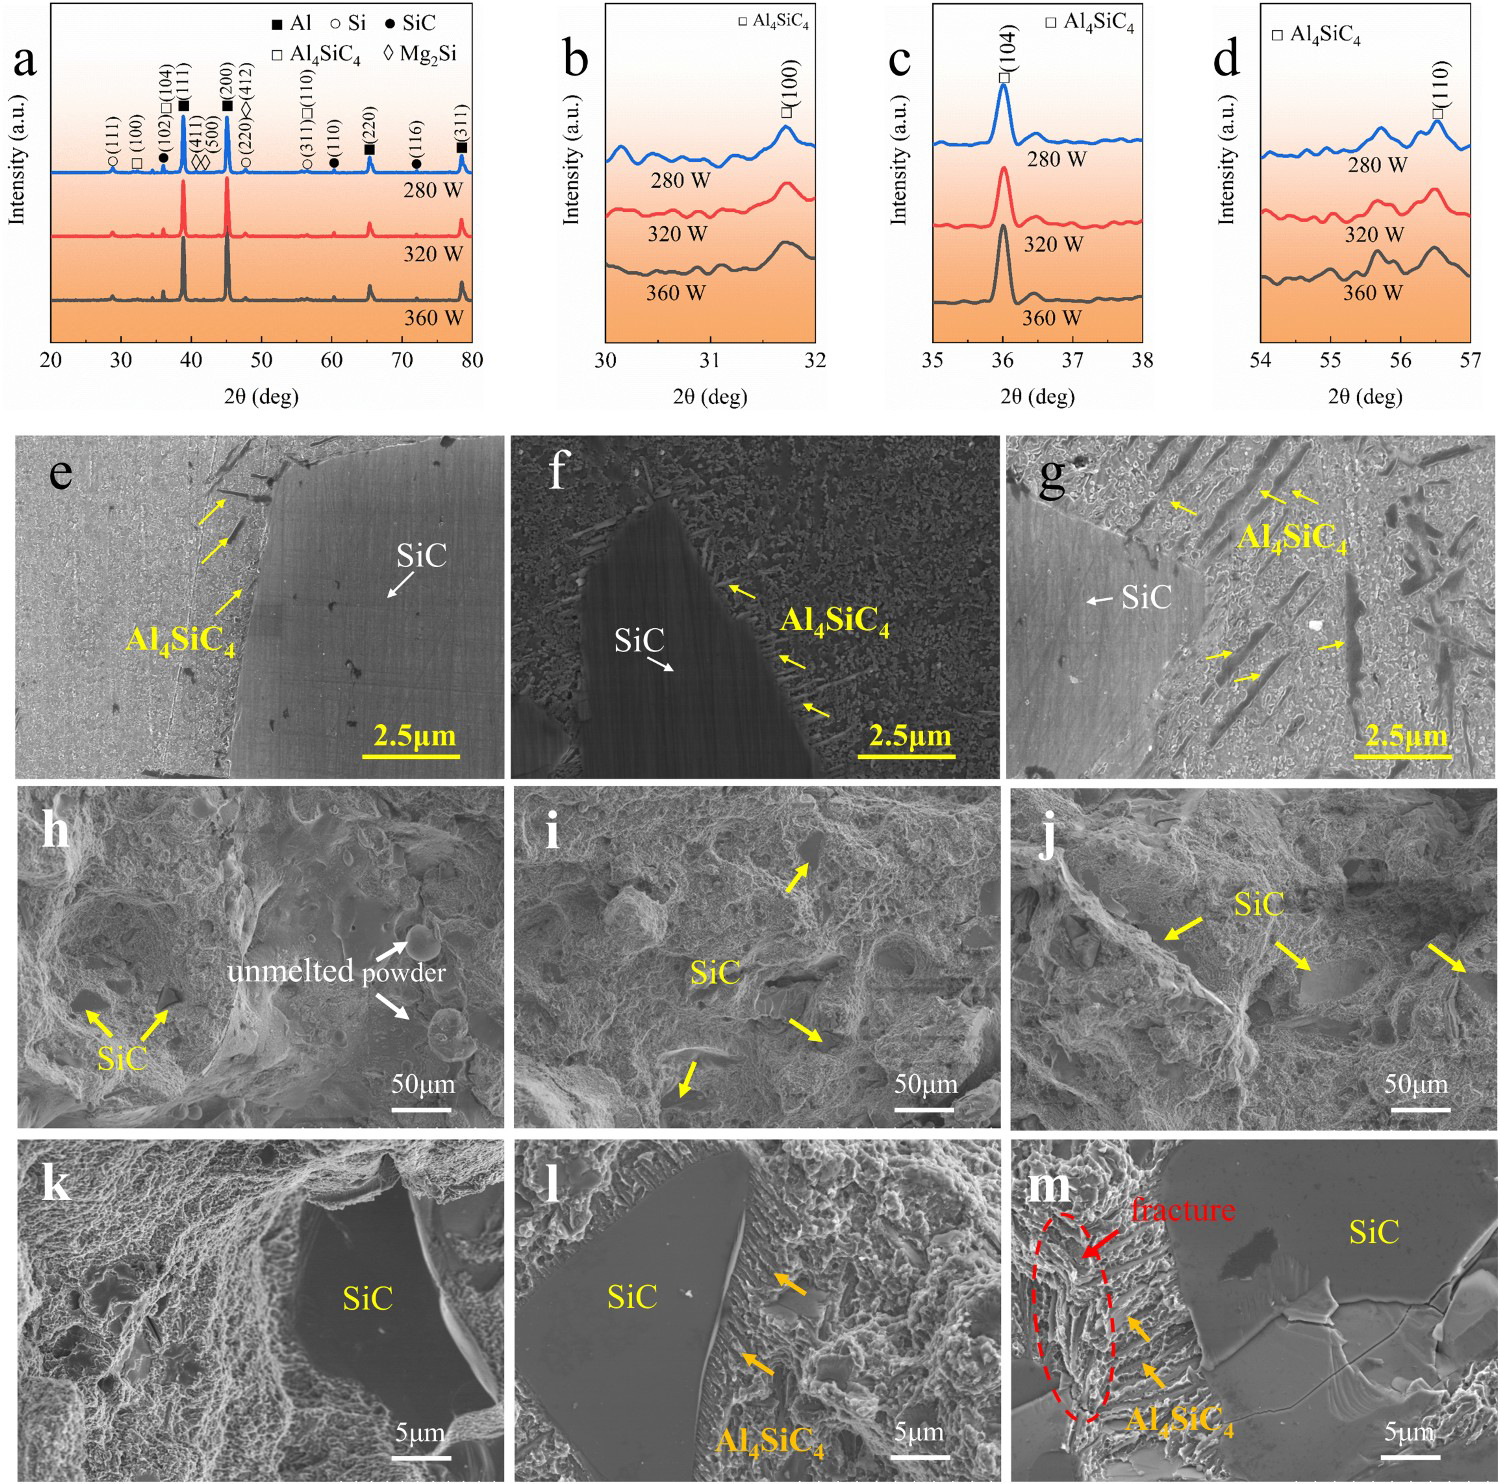
To clarify the effect of deposition parameters on the hardness of LPBF-deposited AlSi10Mg/SiCp composites, the hardness samples were conducted at different laser scanning speeds and laser powers. Figure 6a shows the relationship among Brinell hardness of the deposited composites, the laser scanning speed, and the laser power. With the increasing laser scanning speed, the Brinell hardness firstly increases and then decreases, and its peak hardness values basically appear at the laser scanning speed of 1100 mm/s. In addition, the results reveal that the Brinell hardness of the deposited composites at the laser power of 320 W is higher than that at other laser power (280, 300, 340 and 360 W) conditions. Moreover, the highest Brinell hardness of the deposited composites reaches approximately 203 HB (P = 320 W, v = 1100 mm/s).
Effects of processing parameters on the mechanical properties of LPBF-deposited AlSi10Mg/SiCp composites: (a) Brinell hardness (the hatch spacing = 0.11mm, and the layer thickness = 0.03 mm), (b) σb and δ5 (the laser power = 320W, the laser scanning speed = 1100 mm/s, the hatch spacing = 0.11mm, and the layer thickness = 0.03 mm), (c) typical compressive stress strain curves (the laser scanning speed = 1100 mm/s, the hatch spacing = 0.11mm, and the layer thickness = 0.03 mm); (d) compressive strength and modulus (the laser scanning speed = 1100 mm/s, the hatch spacing = 0.11mm, and the layer thickness = 0.03 mm).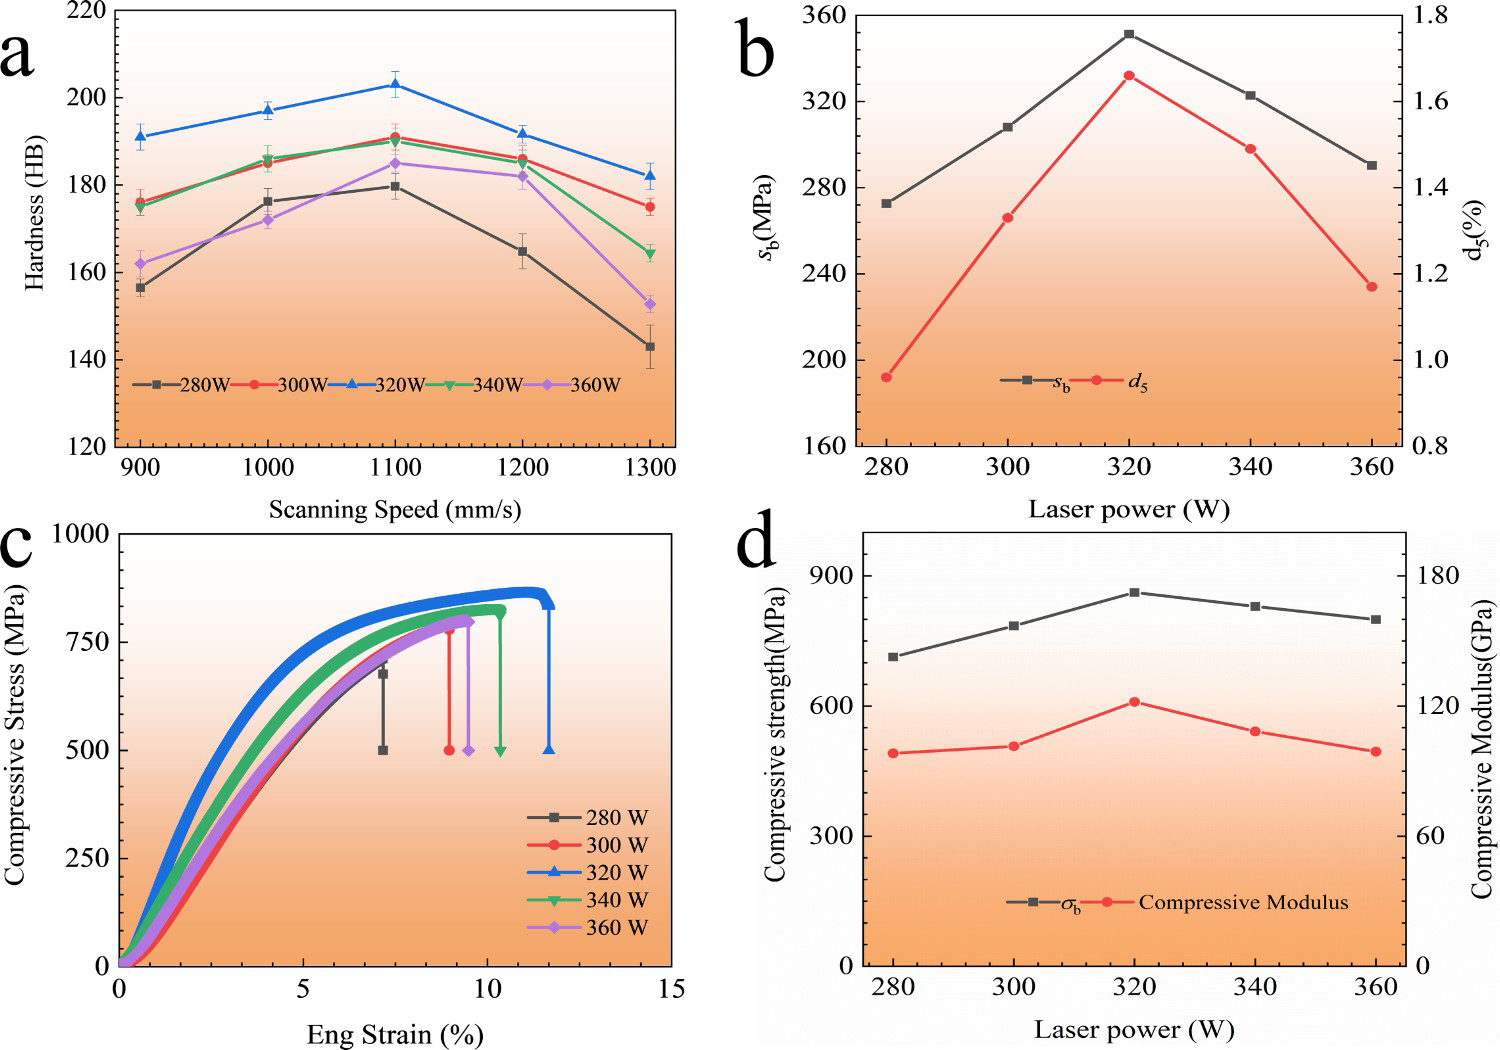
Figure 6b shows the tensile properties of LPBF-deposited AlSi10Mg/SiCp composites. Apparently, σb and δ5 firstly increase and then decrease with the increasing the laser scanning speed. When the laser power is 320 W and the laser scanning speed is 1100 mm/s, σb and δ5 are 351 MPa and 1.7%, respectively. Figure 6c and d present the compression properties of LPBF-deposited AlSi10Mg/SiCp composites at the laser power. The results demonstrate that the compressive strength and compressive modulus firstly increase and subsequently decrease with an increase of the laser power. At the laser power of 320 W and the laser scanning speed of 1100 mm/s, the compressive strength and compressive modulus are 861.9 MPa and 121.9 GPa, respectively.
Thermal expansion coefficient of AlSi10Mg-10 vol.% SiCp composites deposited by LPBF
Figure 7a presents the thermal expansion curves of AlSi10Mg alloys and AlSi10Mg-10 vol.% SiCp composites obtained at the heating rate of 5°C·min−1, while Figure 7b displays the thermal expansion coefficients based on thermal expansion curves. The results reveal that thermal expansion coefficients at the temperature from 50°C to 300°C for AlSi10Mg alloys and AlSi10Mg-10 vol.% SiCp composites are 9.42× 10⁻⁶∼24.96× 10⁻⁶°C−1 and 7.46× 10⁻⁶∼21.65× 10⁻⁶°C−1, respectively. The percentage of thermal expansion coefficients reduced by adding 10 vol.% SiCp into AlSi10Mg alloys as a function of temperature is shown in Figure 7b, where adding 10 vol.% SiCp into AlSi10Mg alloys can make the thermal expansion coefficient be reduced by 20.5%∼9.16% at the temperature from 50°C to 300°C.
The length change (a) and thermal expansion coefficient (b) of the AlSi10Mg alloy and the AlSi10Mg-10 vol.% SiCp composite at the heating rate of 5 °C·min−1 from 50°C to 300°C.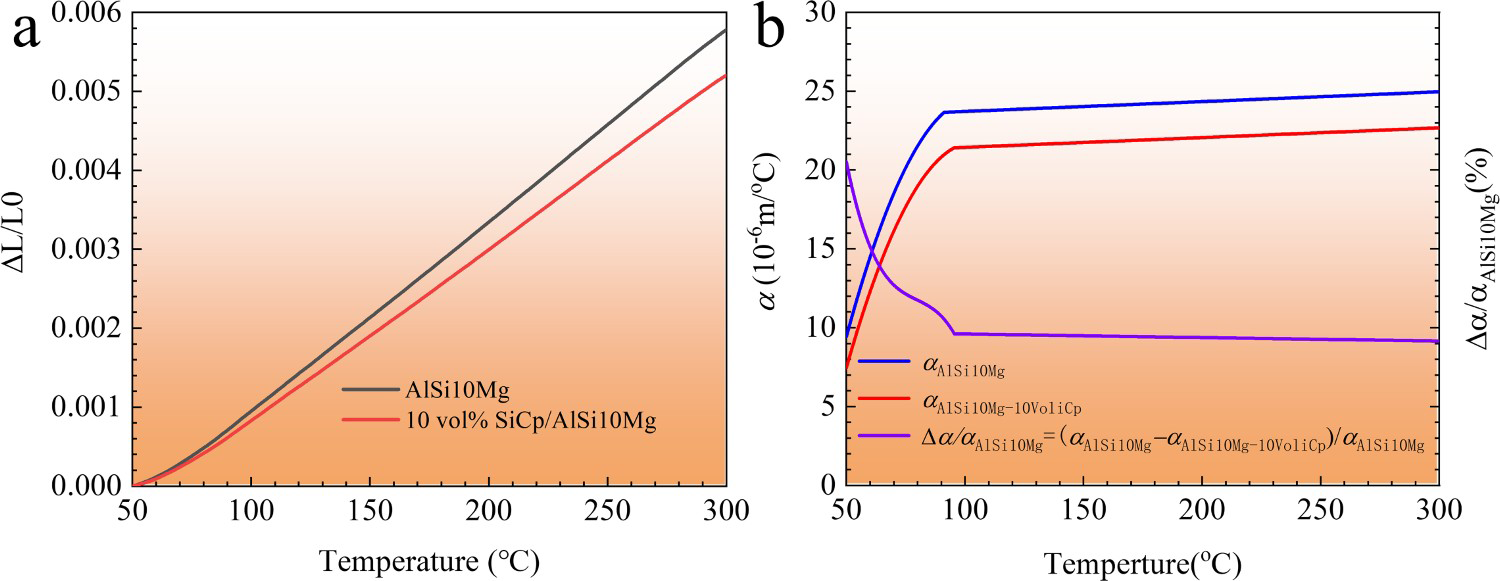
Discussion
Comparison of the properties of LPBF-deposited AlSi10Mg/SiCp composites reported with the present results
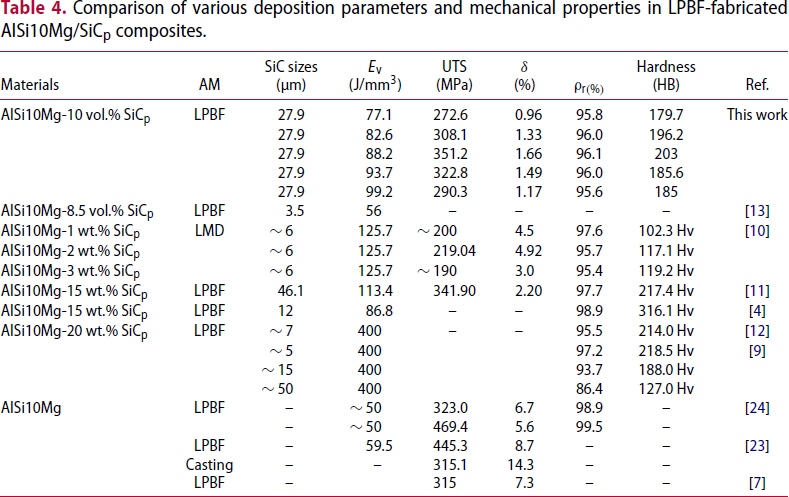
Comparison of various deposition parameters and mechanical properties in LPBF-fabricated AlSi10Mg/SiCp composites.
The relationship between relative density and deposition parameters
To understand the relationship between relative density and deposition parameters, the effect of the volumetric laser energy density (Ev) on the relative density of the deposited composites was investigated.
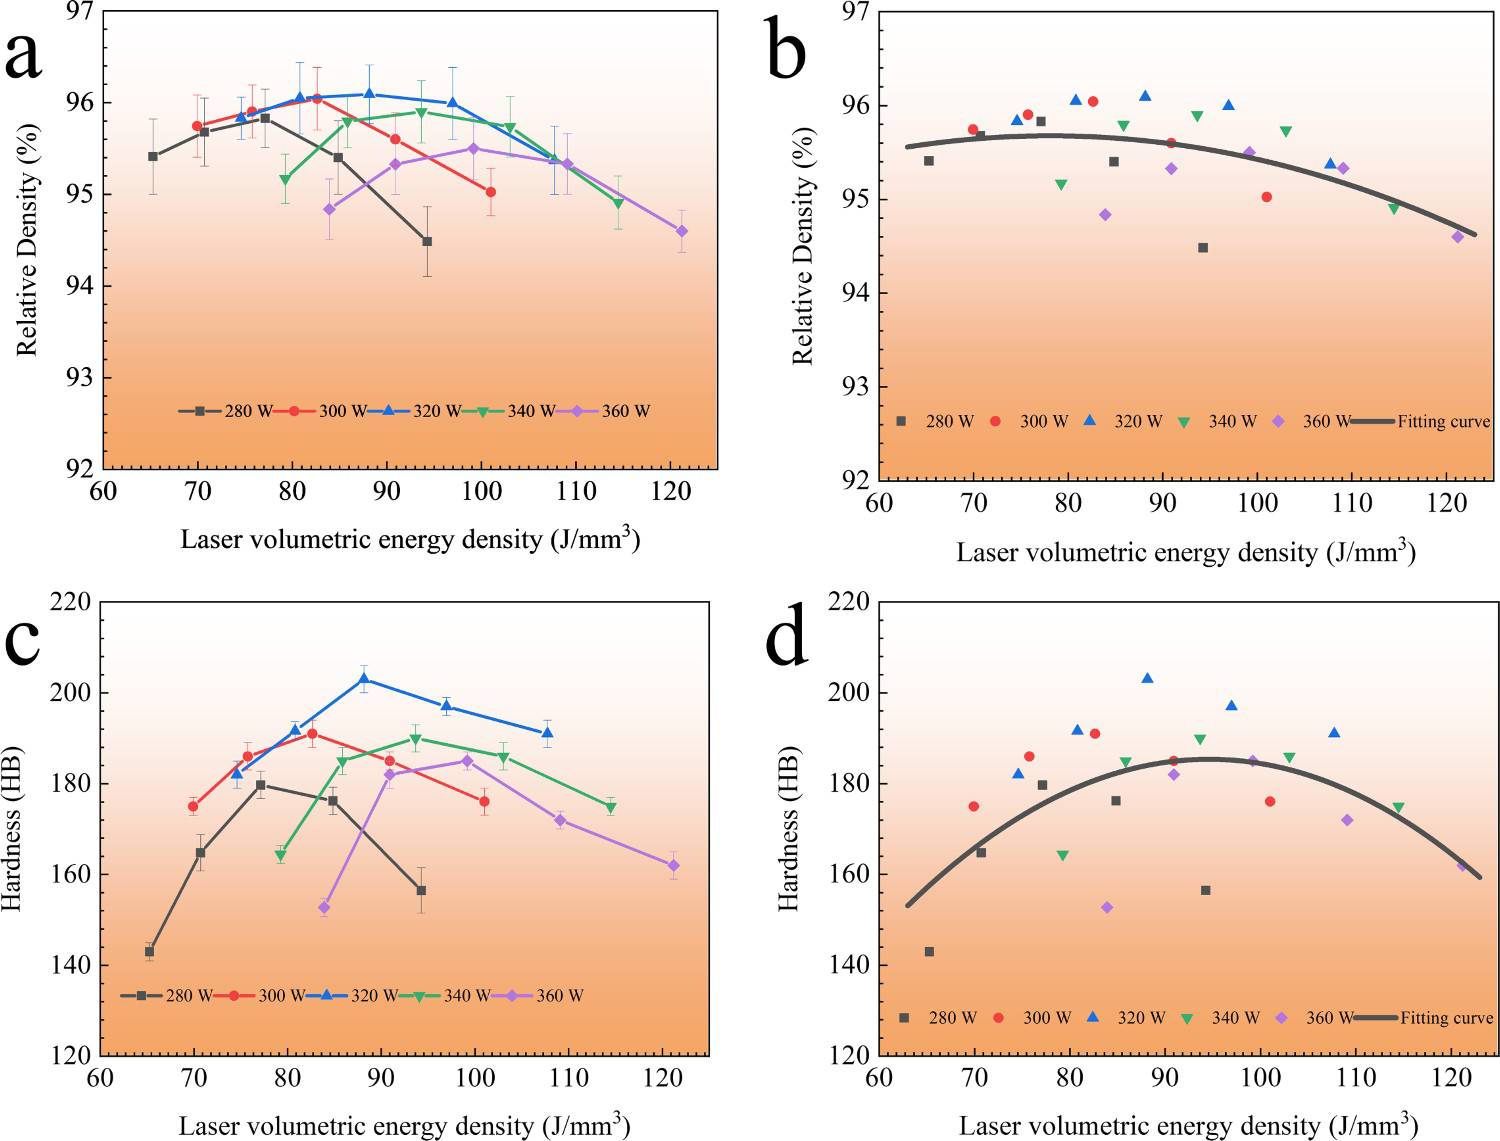
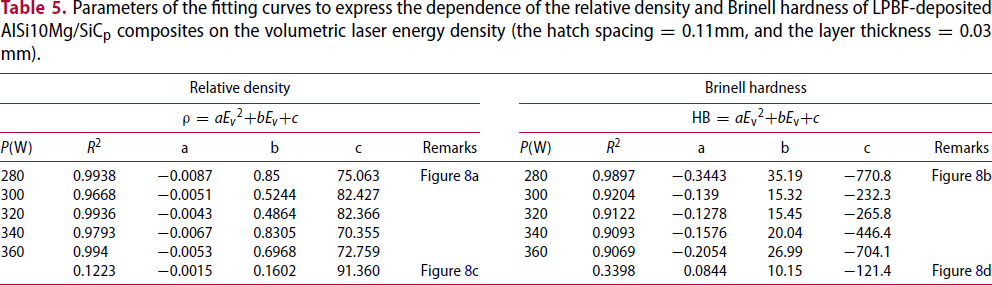
As displayed in Figure 8, the dependence of the relative density and Brinell hardness of the samplers (the hatch spacing = 0.11 mm, and the layer thickness = 0.03 mm) on the volumetric laser energy density can be observed, while the parameters of the fitting curves (y = ax2 + bx + c) are listed in Table 5. As shown in Figure 8a and b, the relative density and Brinell hardness at a given laser power firstly increase and then decrease with the increasing volumetric laser energy density, whereas R2 of the fitting curve is higher than 0.9 when the laser power, the hatch spacing and the layer thickness are constants. In addition, Figure 8c and d present the dependence of the relative density and Brinell hardness of the samplers (the hatch spacing = 0.11 mm, and the layer thickness = 0.03 mm) on the volumetric laser energy density when the laser power and the laser scanning speed are variates. Moreover, the fitting curve shows that the relative density and Brinell hardness also firstly increase and then lower with the increasing volumetric laser energy density. However, the value R2 of the fitting curves for the relative density and Brinell hardness are 0.2882 and 0.2982, respectively, indicating that the value of Ev based on Equation (3) can be employed to accurately evaluate the effect of LPBF parameters on the structure and mechanical property of LPBF-deposited AlSi10Mg/SiCp composites only when the variate in Equation (3) is one. Nevertheless, when the variate in Equation (3) is more than one, the use of the value of Ev based on Equation (3) to evaluate the effect of LPBF parameters on the structure and mechanical property of LPBF-deposited AlSi10Mg/SiCp composites is inaccurate. The fitting equations are shown in Equations (5) and (6):
Effects of the volumetric laser energy density on the relative density and Brinell hardness of the LPBF-deposited AlSi10Mg/SiCp composites (the hatch spacing = 0.11mm, and the layer thickness = 0.03 mm): (a) Dependence of the relative density on the volumetric laser energy density for samples at five given laser powers, (b) dependence of the Brinell hardness on the volumetric laser energy density for samples at five given laser powers, (c) dependence of the relative density on the volumetric laser energy density, and (d) dependence of the Brinell hardness on the volumetric laser energy density. Parameters of the fitting curves to express the dependence of the relative density and Brinell hardness of LPBF-deposited AlSi10Mg/SiCp composites on the volumetric laser energy density (the hatch spacing = 0.11mm, and the layer thickness = 0.03 mm).

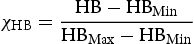
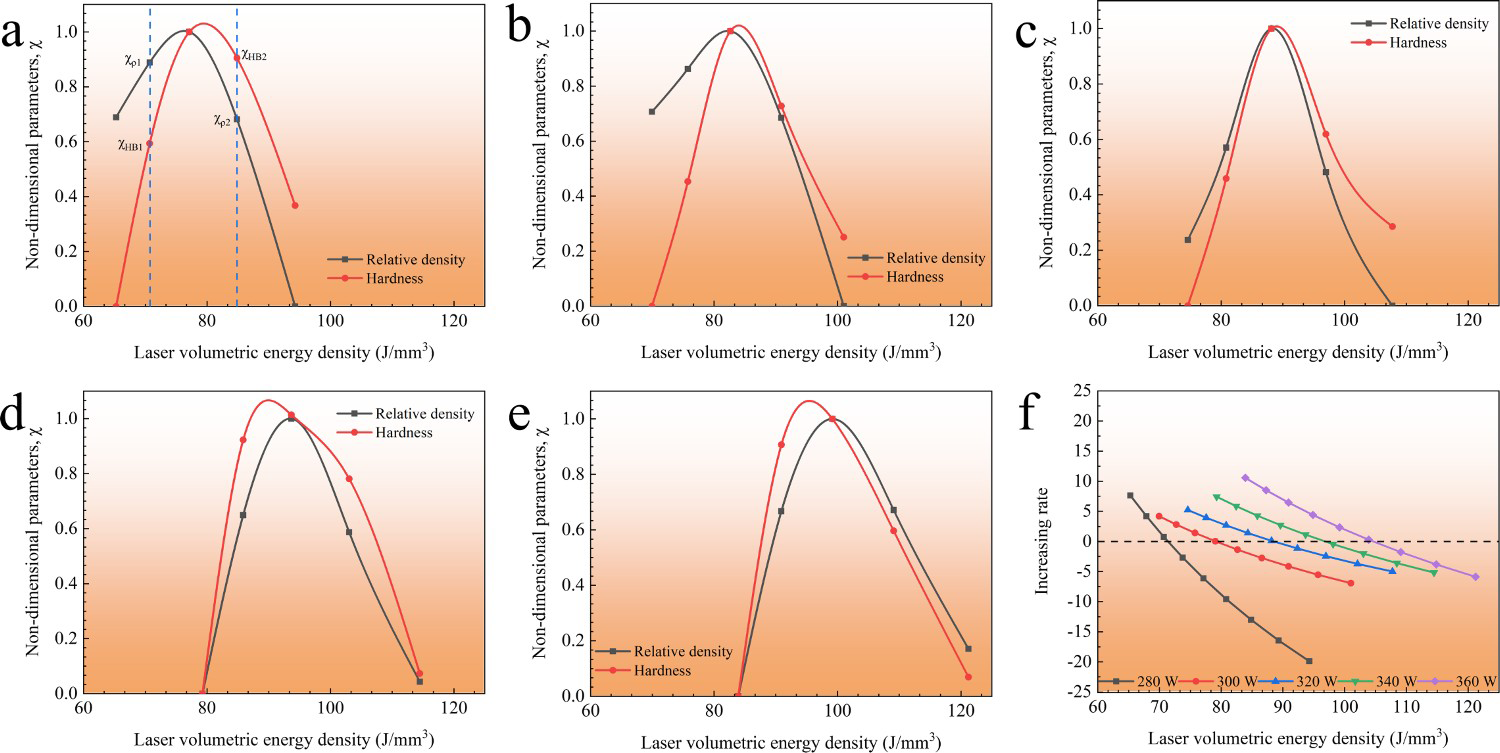
In general, the mechanical property is obviously affected by the structure and the defects (pores and lack-of-fusion) in the deposited part [3,29]. To evaluate the effect of the structure and the defects on the mechanical property of LPBF-fabricated AlSi10Mg/SiCp composites, Figure 9 shows the dependence of non-dimensional relative density ( Relations among the non-dimensional relative density, the non-dimensional Brinell hardness, the increasing rate of Brinell hardness and the volumetric laser energy density for LPBF-deposited AlSi10Mg/SiCp composites (the hatch spacing = 0.11mm, and the layer thickness = 0.03 mm): (a)–(e) dependences of the non-dimensional relative density and non-dimensional Brinell hardness on the volumetric laser energy density at the laser powers of 280, 300, 320, 340 and 360 W; (f) the increasing rate of Brinell hardness as a function of the volumetric laser energy density.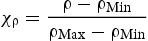
Furthermore, as shown in Figure 8, adjusting the laser power (from 280 W to 360 W) can make the HB and σb LPBF-deposited AlSi10Mg/SiCp composites be changed by 11.5% and 20.5% respectively. Nevertheless, the HB and σb LPBF-deposited AlSi10Mg composites are only changed by 5.4% and 9.9% accordingly, when the laser powers are adjusted from 250 W to 400 W [30]. The obtained results indicate that SiC has a decisive influence on the mechanical property of LPBF-deposited AlSi10Mg/SiCp composites.
Microstructural evolution and morphology
Generally, in SiC particle reinforced Al matrix composites, the direct reaction between SiC and Al matrixes typically occurs to form platelet-shaped Al4C3 phases [31]. However, in LPBF SiC reinforced Al matrix composites, two common phases (namely, Al4C3 phase and Al4SiC4 phase) are often reported in previous studies. For example, Chang and Gu et al. [9,13,32–34] and Xue et al. [4,11] found the presence of Al4SiC4 phases in the LPBF-deposited AlSi10Mg/SiCp composites. Nevertheless, Famodimu et al. [35] discovered Al4C3 phases in the LPBF-deposited AlSi10Mg/SiCp composites. In addition, the melting point of the SiC particles is higher when compared with the AlSi10Mg particles. Therefore, the difference in their melting point influences the diffusion of elements during the fast-cooling and heating in the LPBF process. Nevertheless, owing to the higher temperature will lead to the formation of pores, the temperature during the LPBF process is much lower than the melting point of SiC particles. The AlSi10Mg-matrix just reacted with the surface of SiC particles, and the SiC particles remained the raw-morphology in the composites. Thus, the type of the reinforcement phase needs to be clearly understood.
Based on the XRD detection data (Figure 5), Al4SiC4 phases in the deposited AlSi10Mg/SiCp composite parts were found in this study, which is consistent with the findings from Gu et al. [12,13], in which the reinforcing phases in the LPBF-deposited AlSi10Mg/SiCp composites included the un-melted SiC powders, the in situ formed micro-sized Al4SiC4 strips and in situ produced submicron Al4SiC4 particles. Generally, the Al4SiC4 phase is a ceramic phase with a high melting point, high strength, high hardness (1200 Hv), low density, low expansion coefficients and excellent resistance to hydration and oxidation [9]. During the LPBF process, two possible reaction mechanisms [20], namely, the melt theory and the reaction theory, are followed to account for the formation of the Al4C3 phase in the reaction of SiC particles to the AlSi10Mg matrix. According to Slipenyuk et al. [27], they adopted the thermodynamic calculation and experimental results for confirmation, finding that the equilibrium Si content needed to be at least 7 at.% when the matrix forms a liquid phase that can suppress the formation of Al4C3 in Al/SiCp composites. Thus, in the LPBF-deposited AlSi10Mg/SiCp composites, the presence of Si content can suppress the formation of Al4C3 phases.
From Figure 5e–f, it can be found that the content of Al4SiC4 in the sample increases with the increasing laser power, and the mechanical property of samples increases with the increasing laser power from 280 W to 320 W and the laser scanning speed of 1100 mm/s. This indicates that the formation Al4SiC4 phase is conducive to improving the wetting ability and the binding ability between the strengthening particle and Al matrix and the mechanical property of LPBF-deposited AlSi10Mg/SiCp composites under a certain condition. Nevertheless, as shown in Figure 5 g, the length of needle-like Al4SiC4 increases with the increasing laser power. As the long needle-like Al4SiC4 is prone to fracture during deformation, the mechanical property of LPBF-deposited AlSi10Mg/SiCp composites decreases with the increasing laser power when the laser power is higher than 320 W and the laser scanning speed is 1100 mm/s, which is confirmed by the fracture morphology. Furthermore, as shown in Figure 5(k-m), fractured needle-like Al4SiC4 is found in the sample formed at 360 W (Figure 5 m), while that is not observed in the sample formed at 280 W (Figure 5k) and 320 W (Figure 5 l). In combination with the previous experiments, the needle-like Al4SiC4 phase with oversize is harmful on the mechanical properties of the LPBF-deposited AlSi10Mg/SiCp composites.
Conclusions
The microstructures, porosity, and properties of micro-scale SiC particle reinforced AlSi10Mg composites deposited by LPBF were studied. The main conclusions are as follows:
Long-stripe and needle-like Al4SiC4 phases are found in LPBF-deposited AlSi10Mg/SiCp composites. The formation Al4SiC4 phases can improve the mechanical property of the composites under a certain condition. The thickness of long-stripe Al4SiC4 and the length of the needle-like Al4SiC4 increase with the increasing laser power and the decreasing laser scanning speed, and the oversize of Al4SiC4 is harmful on the mechanical properties of the LPBF-deposited AlSi10Mg/SiCp composites. The mechanical property of LPBF-depositedAlSi10Mg/SiCp composites decreases with the increasing laser power and the decreasing laser scanning speed when the laser power is higher than 320 W and the laser scanning speed is lower than 1100 mm/s. The ultimate tensile strength, compressive strength, compressive modulus, and the thermal expansion coefficient of LPBF-deposited AlSi10Mg-10 vol.% SiCp composites are 351, 861.9 MPa, 121.9 GPa and 18.23 × 10⁻⁶°C−1, respectively. The value of Ev can be employed to accurately evaluate the effects of LPBF parameters on the structure and mechanical property of LPBF-deposited AlSi10Mg/SiCp composites when only one parameter changes in the Ev equation.
Footnotes
Disclosure statement
No potential conflict of interest was reported by the author(s).