
Abstract
MONEL K-500 superalloy is difficult to manufacture precisely in traditional manufacturing processes like casting, forming and machining. The direct metal laser sintering (DMLS) process is one of the best metal additive manufacturing processes used in this work. In this work, Laser Power (LP), Scan Speed (SS), Hatch Distance (HD) and Layer Thickness (LT) are used as DMLS process parameters. L09 Orthogonal array is used for printing the MONEL K-500 metal parts. The performance characteristics like ultimate tensile strength (UTS) and surface toughness (Ra) are improved by 2% and 17% for the Taguchi optimum parameter levels. Contour plots explained the interaction effects of DMLS process parameters on performance characteristics. The better microstructural characteristics obtained the higher optimum parameter level.
Introduction
Metal additive manufacturing is a novel manufacturing process that has been widely used in various industries in recent years. Additive manufacturing can produce complex and intricate shapes easily. In the additive manufacturing process, raw materials are fabricated by adding them layer by layer using the 3D CAD model input. Therefore, good efficiency of material, accuracy, mechanical and corrosion resistance properties were obtained when compared with conventional manufacturing processes for developing components. Direct metal laser sintering (DMLS) is a good accuracy additive manufacturing method to fabricate the components from the 3D CAD input data [1]. In DMLS, the powder particles are heated up quickly by the delivered energy beyond the melting temperature. The sintering is controlled by the method of energy delivery to the powder. A better densification of powder material occurred with the increased laser energy. It was also affected by the powder properties. The product developed from the DMLS process with metal powder and a ytterbium laser source [2,3].
The major challenges in additive manufacturing are consistency of quality and scalability of products. Optimisation of process parameters help reduce material usage and resource loss. The orientation of metal printing in the DMLS process influences more mechanical properties. It is observed that the tensile samples printed in the x direction have better results than the z direction. Also, the largest differences in strain values were observed in the z direction rather than the x direction. High yield strength and hardness were achieved in a DMLSed 17-4 stainless steel through heat treatment at 755 K. The corrosive behaviour of heat-treated DMLSed Inconel 718 superalloy is better than that of conventionally manufactured superalloys because of the separation of more nickel, molybdenum and oxygen [4–8].
Hadadzadeh et al. [9] studied the mechanical properties and microstructure characteristics of AlSi10Mg fabricated by DMLS. The mechanical properties of DMLSed AlSi10Mg samples were much better than those of their cast counterparts. Also, TEM examination of the DMLSed AlSi10Mg samples showed cell-like structure. The selection of biomaterials depends upon the functional requirements of a particular application. Pure silver has challenges in SLM because of its inadequate laser energy absorption at the powder bed. It is rectified by powder bed fusion additive manufacturing with 400 W fibre laser system. The addition of Ag content in the CuAg alloy increased both the number of pores and the reduction in average pore size in both built and annealed samples. Pores obtained in SLMed printed Ti6Al4V bone scaffolds influence performances such as stiffness, strength and stress concentration [10–12–13]. Greitemeier et al. [14] compared the influence of Ra over the fatique properties in Ti6Al4V printed by EBM and DMLS. Surface roughness significantly affected the high cyclic fatigue. Therefore, DMLS produced specimens had better surface roughness values.
Lee et al. [15] reported that the EBSD tests for DMLSed stainless steel (15-5 PH) samples have ferrite and martensite phases combined with austenite. Also, changes in the scanning line with respect to the interval time from one layer to another cause higher hardness in the horizontal direction than in the vertical direction. In the DMLS metal additive manufacturing process, thermal loading and grain size affected the yield strength [16]. Alafaghani et al. [17] reported the effect of elevated temperature on the mechanical properties of Inconel 718 and stainless steel fabricated by the DMLS process. Stainless steel and Inconel 718 have low ductility at elevated temperatures. Zhang et al. [18] developed a one-way coupled thermal mechanical finite element model to simulate and predict the cracking and distortion in the DMLS samples. Thermal stress reaches its maximum at the support solid interface during the printing process. Cracking also occurred at the interface.
Xu et al. [19] revealed that additively manufactured Inconel 718 wire arc had better strength than the wrought Inconel 718. Lee et al. [20] investigated the microstructures and mechanical properties of heat resistant steel (Low-C 9-12Cr) fabricated by selective electron beam melting with Ar- and N- powders and showed better tensile strengths of 1300 and 1167 MPa, respectively. The microstructure study showed that M23C6 carbides precipitated with a tempered ferritic/structure as presented in the Argon component and Nitrogen built components. Zhang et al. [21] examined the SEM results that carbide particles and laves phases presented in the SLMed superalloy materials. Also, SLMed heat-treated materials have better strength and hardness than wrought materials. Sagar et al. [22] studied the stainless steel additive component and show that the impact energies obtained at low (77 K), room (298 K) and high temperatures (723 K) were 0.01, 6.78 ± 4.07 and 50.84 ± 3.39 J cm−2, respectively. The microstructure revealed that the steel exhibited brittle behaviour, transgranular fracture and microvoid coalescence at low, medium and high temperature ranges. Wang et al. [23] operated the selective electron beam melting with optimised speed function and focus effect parameters to fabricate 316L stainless steel. It resulted in SEBM built SS316L parts having better tensile strength than the wrought and cast parts, while the ductility was lower. A high percentage (3%) of nitrogen mixed with argon improves maximum hardness and ultimate tensile strength with very low scatter in additive manufacturing processes [24]. Long et al. [25] developed a 3D multitrack and multilayer thin wall model to investigate the crack generation and restriction of thin wall metal parts made using APDL programming on laser direct deposition shaping models. Most of the time, the Y-directional principal stress is comparatively low, less than 100 MPa. Li et al. [26] fabricated Cu–9Al–5Fe–5Ni alloy by the laser metal deposition (LMD) method with a hierarchical microstructure and good mechanical strength. The optimised process parameters of LMD fabricated alloy have yield strengths of 160%, 76% and 46% higher than those of the cast alloy, WAAM printed counterparts and SLM printed parts, respectively. Rafi et al. [27] compared the mechanical properties and microstructure characteristics of Ti6Al4V fabricated by SLM and EBM. The surface finish of the SLM is better than the EBM. In EBM, rough surface is formed due to the large particles adhering to the surface. SLM samples have better tensile strength than EBM whereas EBM samples have good ductility. Raghavan et al. [28] observed that columnar grain structures were present in SLMed Inconel 718 samples. Also, low strength and high ductility were exhibited in SLMed samples, whereas high strength and low ductility were observed in heat-treated samples. Holland et al. [29] observed that heat-treated SLM samples of Inconel 718 produced a lower wear rate and an increase in hardness while having better microstructure features. Moussaoui et al. [30] witnessed that the dentric microstructure was gone after heat treatment, and microhardness and tensile strength also increased for Selective Laser Melted Inconel 718. Xu et al. [31] compared the creep properties and microstructure of SLMed Inconel 718 with forged Inconel 718. Plasticity and low creep resistance were observed in SLMed material due to high residual stress, whereas plasticity and high creep resistance were observed in forged material due to low residual stress. Pei et al. [32] reported that the tensile strength was higher for the SLMed Inconel 718 sample than that of forged Inconel 718. Also, we found that the fatigue strength of the SLMed Inconel 718 sample was lower than that of the forged Inconel 718 sample. Carter et al. [33] optimised the energy density parameter to improve the mechanical properties. Strobner et al. [34] reported that the horizontally built specimens of Inconel 718 in the SLM process have better tensile properties with lower strain when compared with the vertically built specimens. Also, the formation of the intragranular δ phase and recrystallisation of the grains were observed in the heat-treated samples. Shuai et al. [35] examined the SEM result for the SLMed Inconel 718 sample and found that the molten pool consists of elongated columnar crystals. Deng et al. [36] observed a fine cellular dendritic microstructure in the selective laser melting of Inconel 718. It was also reported that lower tensile strength and higher ductility were observed in the vertically built samples than in the horizontally built samples. Salunkhe and Rajamani [37] discussed the opportunities in the aerospace applications for metal additive manufacturing processes. Kang et al. [38] studied the effect of solution aging and hot isostatic pressing on Inconel 718. AlMangour et al. [39] investigated the influence of laser conditions on the microstructure and mechanical properties of Co–Cr–Mo alloy fabricated by selective laser melting. In liquid propellant rocket engines additive manufacturing process technology replacing the conventional manufacturing process by shortening fabrication schedules, reducing number of joints and improve hardware performance. Resistance to the liquid and solid-state cracking plays an important role in additive manufacturability of nickel-based superalloys [40,41]. The scanning speed parameter of selective laser melting significantly affects the density and hardness of the materials, irrespective of the type. Also, the hardness, yield strength and tensile strength of SLMed Inconel 718 comparatively higher than those of the wrought alloy. But, the dimensional accuracy of the 7075 Aluminium alloy component obtained by the rapid cooling metal additive process and better process parameter selections. Further, the stochastic analysis and the finite element method are implemented to simulate the microstructure of superalloys by plasma rotation electrode processing. It is observed that laves phases significantly affect the mechanical properties [42–45].
From the various literatures, tensile, surface roughness and microstructural characteristics of DMLS fabricated MONEL K-500 superalloy were not found. MONEL K-500 powder has high stress, corrosion and oxidation resistance properties at an elevated temperature. Due to its better mechanical and micromechanical properties, it can be used in marine and nuclear-based industries. Hence, DMLS which has vacuum-based manufacturing techniques fabricated the MONEL K-500 component. The novelty of the present work is that additive-based DMLS is implemented to develop a new material like MONEL K-500 superalloy with better mechanical and microstructural characteristics.
Materials and experimental methodology
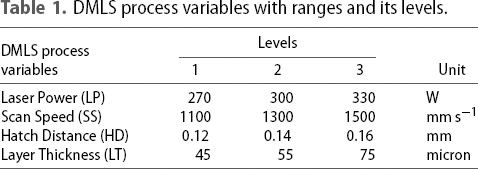
DMLS process variables with ranges and its levels.
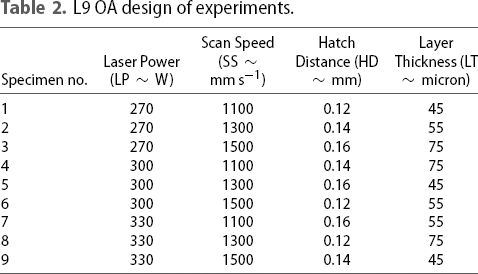
L9 OA design of experiments.
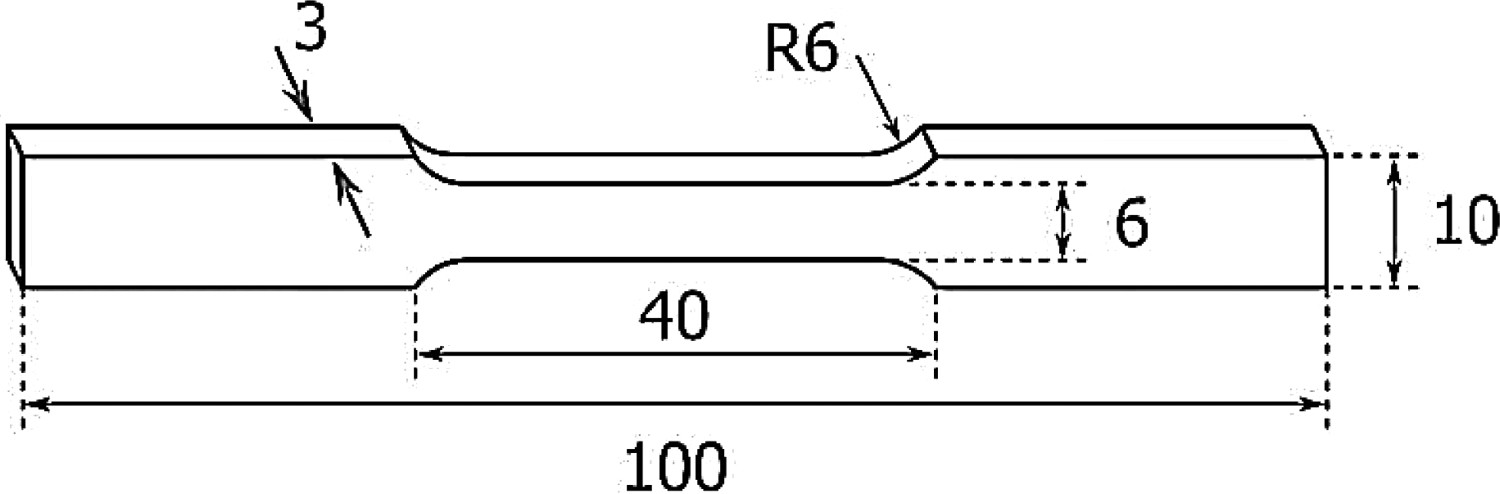
ASTM standard of tensile test (dimensions are in mm).
CAD data are fed into the DMLS which sets the other process variables at their optimal values. Selected MONEL K-500 powder was fed into the vacuum build area layer by layer, and a solid metal plate has been developed above the melting point range. Yb laser set at 200 W for melting the MONEL K-500 powder in the vacuum build area. The scanning of the powder was done with an F-theta lens, and the speed of the scanning process was 7 m s−1 during the sintering process. The laser intensity was focused at 500 µm and the laser beam diameter of 0.06 mm was maintained. The temperature of the vacuum bed metal build area was maintained at 80°C. The DMLS system operated with the safest nitrogen and argon gases. Hence, the optimum invariables and process variables of DMLS were maintained to develop the specimens. The chemical composition of DMLS fabricated MONEL K-500 material has 62.5 Ni, 30.05 Cu, 2.65 Al, 1.3 Mn, 1.85 Fe, 0.22 C, 0.65 Ti, 0.5 Si and 0.008 S. The developed specimens are used for further analysis such as tensile testing, roughness testing and microstructural analysis.
Tensile test
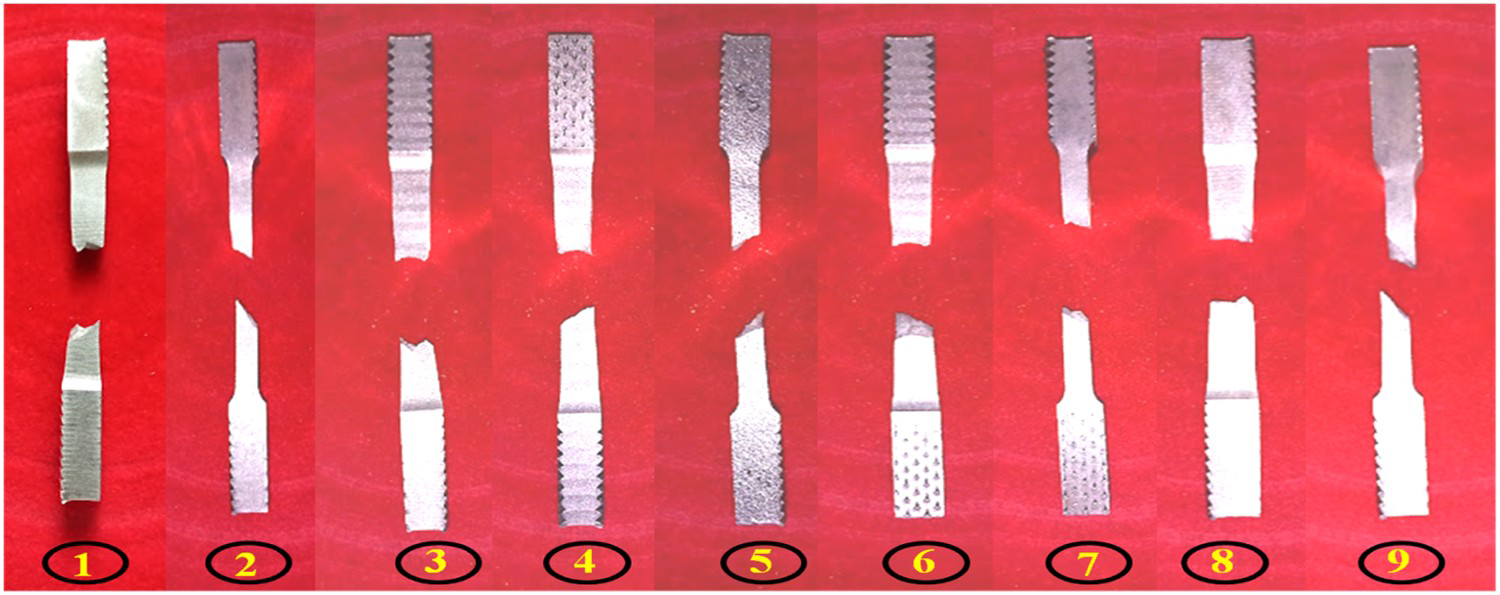
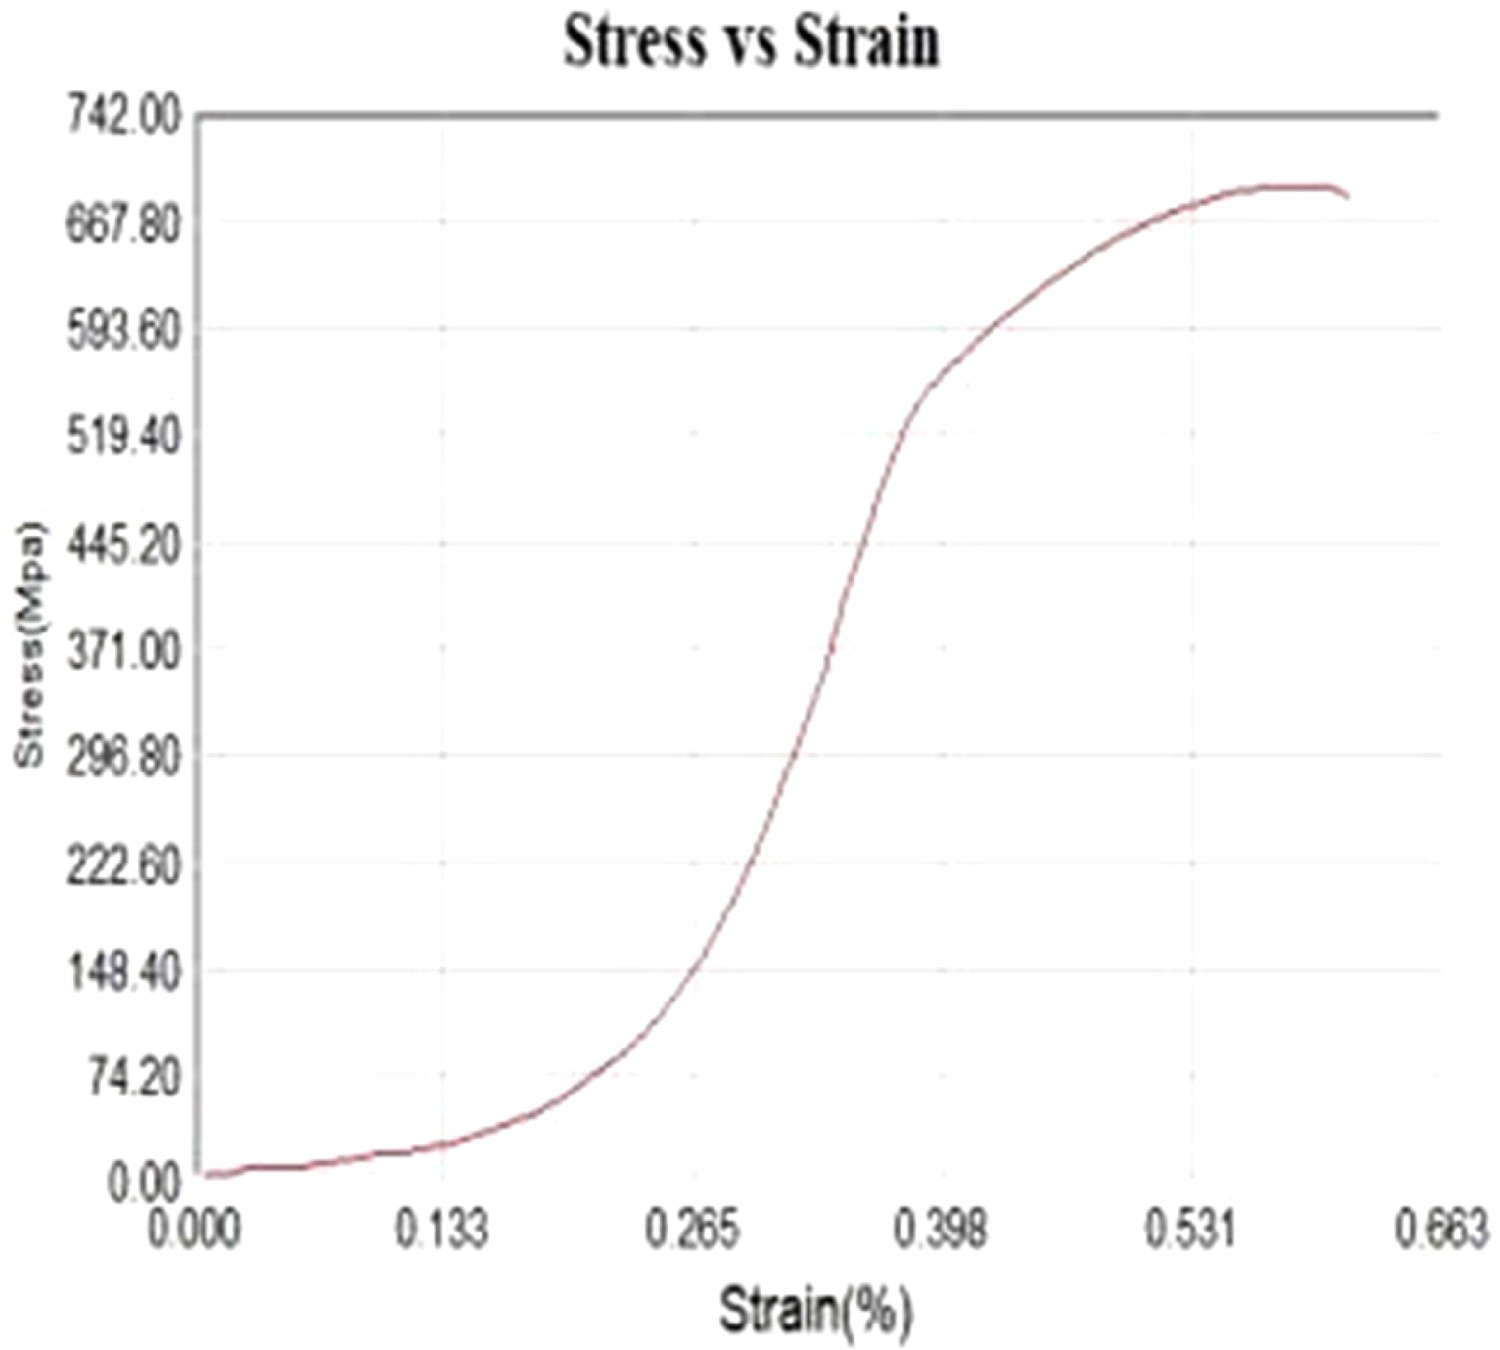
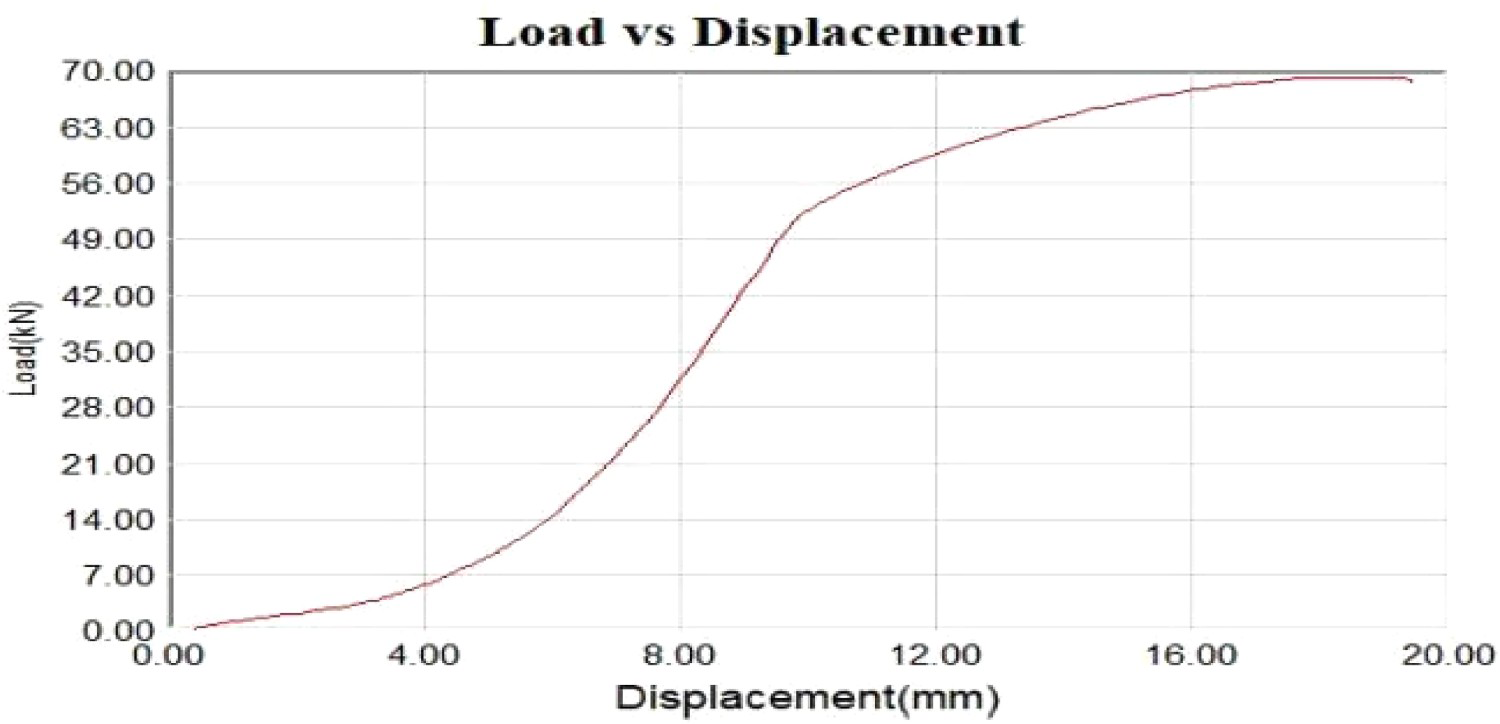
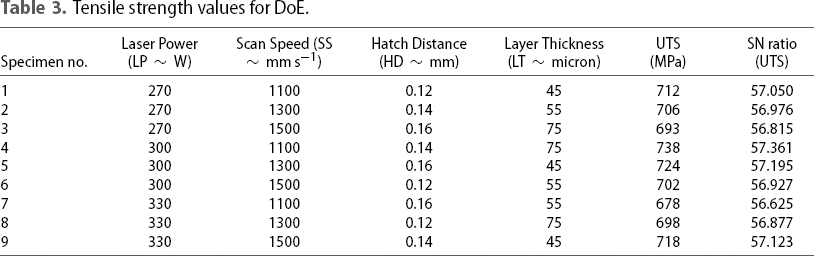
The computerised Aimil universal testing machine is used for testing the UTS for all nine specimens. The maximum peak load has been maintained at 70 KN to calculate the tensile strength for all the specimens. As per the DoE and ASTM standards, the specimens are developed to find the tensile strength values, and the results are shown in Table 3. The specimens before and after tensile tests are shown in Figures 2 and 3. Sample stress vs strain curve of specimen No. 3 is shown in Figure 4. The tensile strength of 693 MPa and the yield stress of 643.73 MPa are obtained at the maximum peak load of 70 KN. The maximum displacement at the yield point was 19.64 mm as shown in Figure 5.
Before tensile test specimens. After tensile tests specimens. Stress vs strain curve of Specimen No. 3. Force vs displacement curve of Specimen No. 3. Tensile strength values for DoE.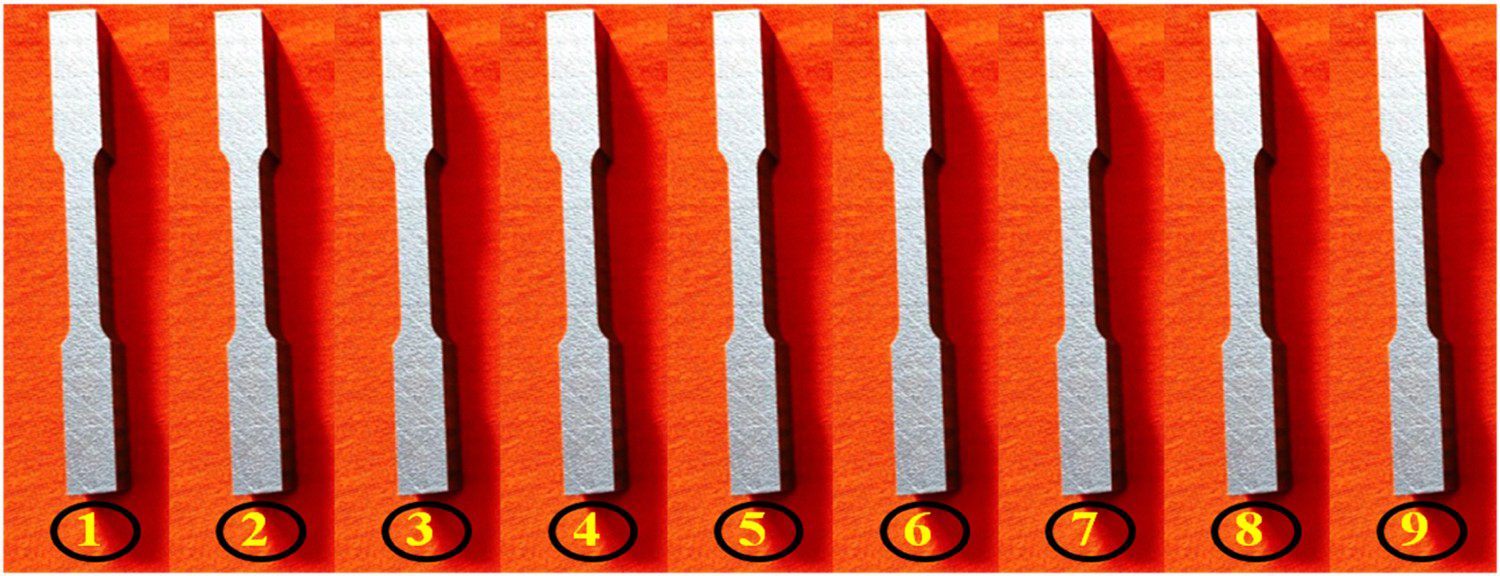
Surface roughness
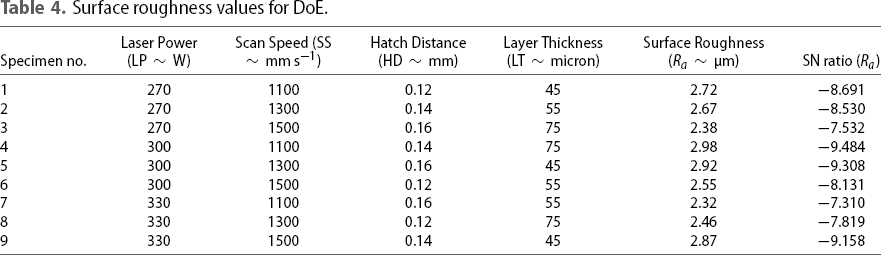
The surface roughness tester (Model: SJ210 Roughness Tester) is used to measure the surface roughness values for all nine specimens. The average roughness is the ratio of the peaks and valleys to the evaluation length of each specimen. It is expressed as µm. The sample image of specimen 1 average surface roughness measured is shown in Figure 6. The measured average surface roughness values of all nine experiments are listed in Table 4.
Surface roughness profile of Specimen No. 1. Surface roughness values for DoE.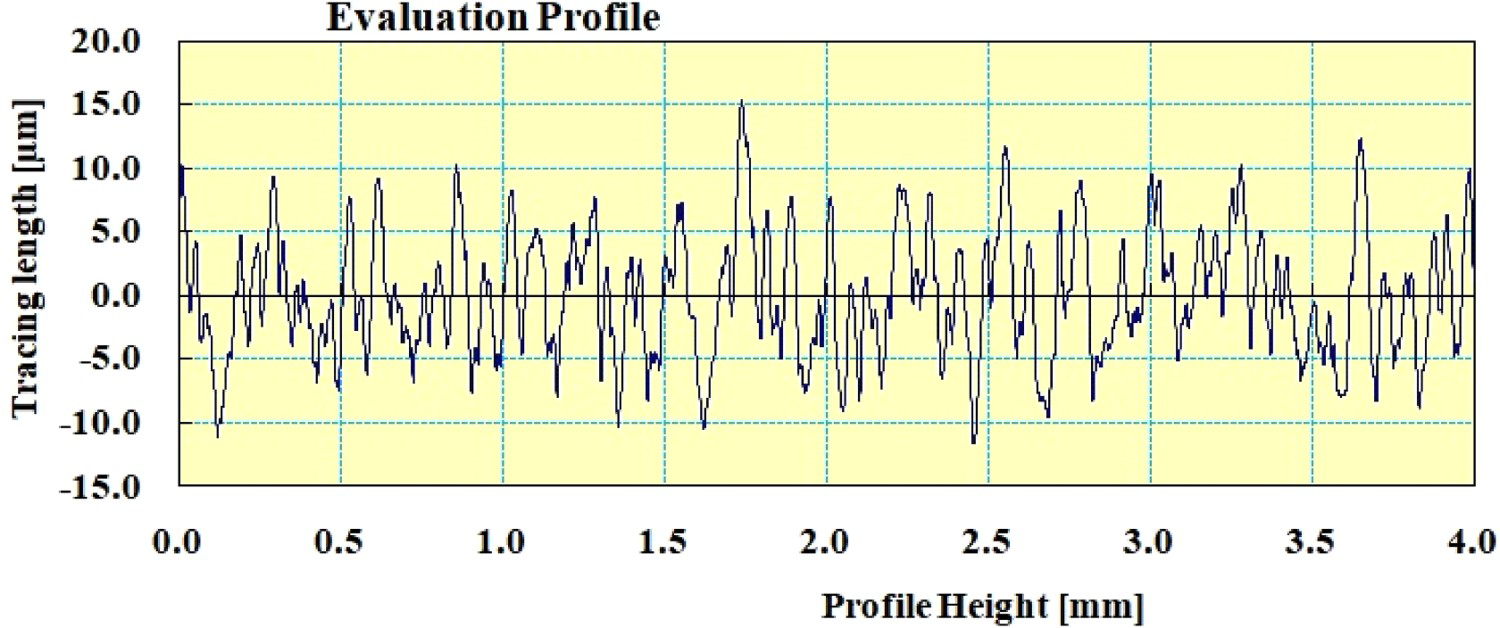
Results and discussion
The development of MONEL K 500 specimens is successful in the DMLS process. Further Taguchi analysis is used to find the optimum process parameters for the performance characteristics, which are detailed below. Also, the interactions and effects of the process parameters and microstructural characteristics study are explained below.
Taguchi analysis
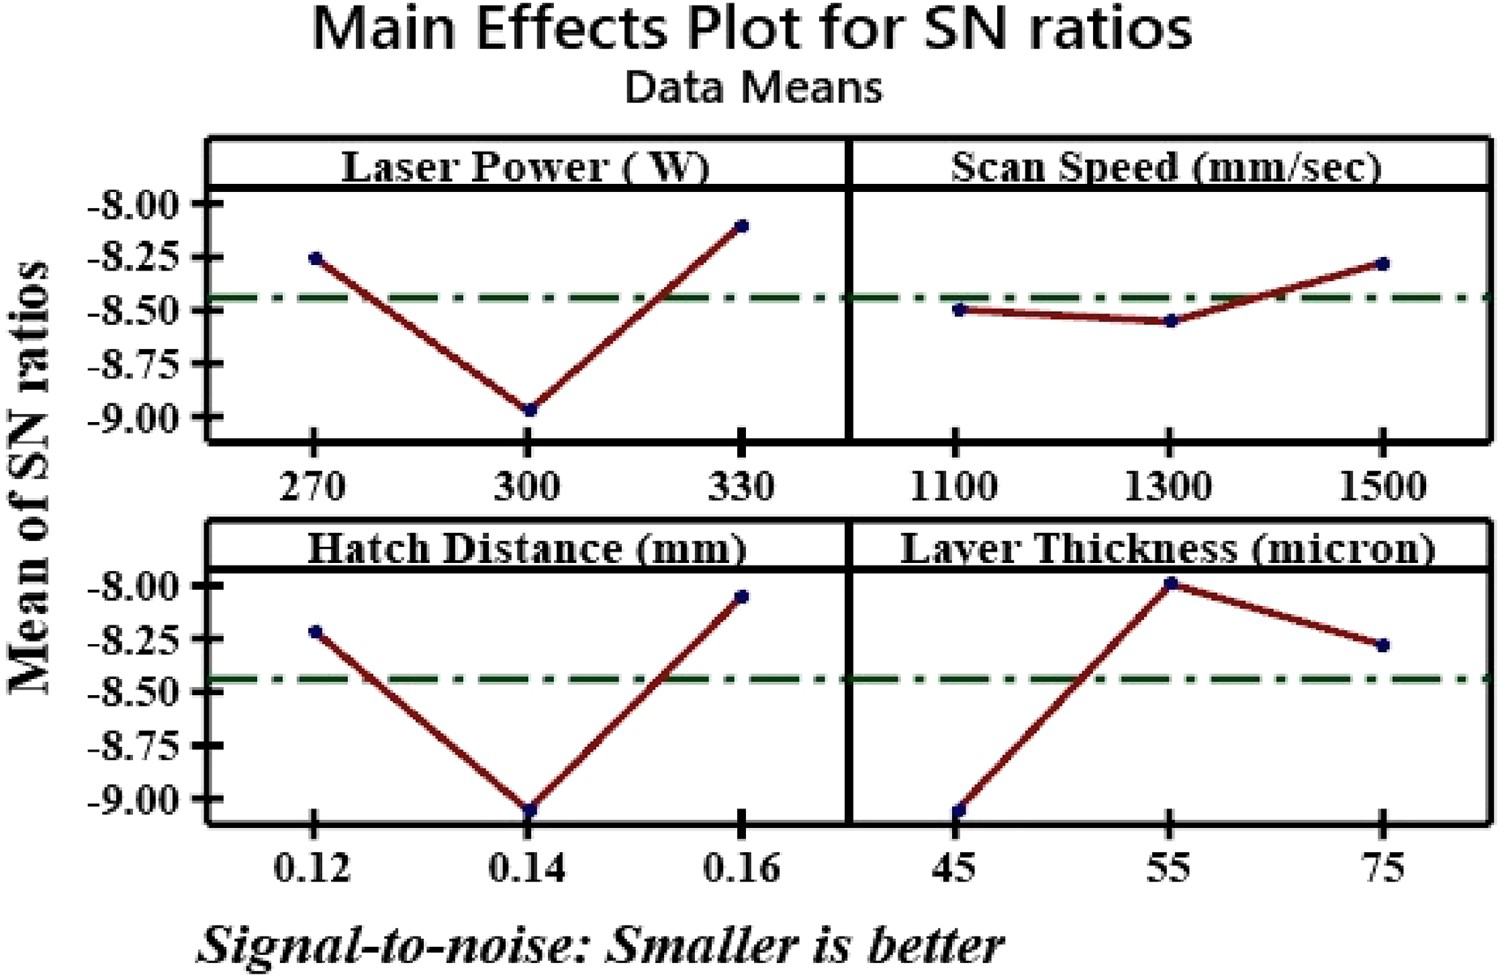
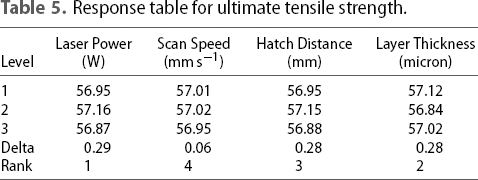
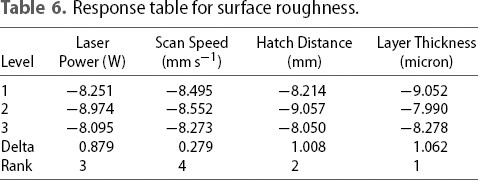
The Taguchi analysis of the DoE for the DMLSed MONEL K-500 superalloy was carried out using Minitab 19 software. The larger the signal-to-noise ratio, the better for UTS (MPa) and the smaller the signal, the better for Ra (µm) are found using Minitab 19 software. The SN ratio values for UTS and Ra are mentioned in Tables 3 and 4, respectively. The response table for ultimate tensile strength (MPa) with respect to the SN ratio values is shown in Table 5. From Table 5, it is indicated that the laser power (W) and layer thickness (microns) have the highest rank, which influence more the UTS values, whereas the hatch distance (mm) and scan speed (mm s−1) have the least rank and therefore very little influence on the UTS values. Similarly, the response table for surface roughness (µm) with respect to the SN ratio values is shown in Table 6. From Table 6, it is indicated that layer thickness (microns) and hatch distance (mm) are highly influencing parameters to reduce the surface roughness values (µm) whereas laser power (W) and scan speed (mm s−1) are less influencing parameters to reduce the Ra (µm) values. The main effect plot of the SN ratio of UTS (MPa) and Ra (µm) is shown in Figures 7 and 8. From Figure 7, the optimum DMLS process parameters for the UTS (MPa) found to be LP = 300 W, SS = 1300 mm s−1, HD = 0.14 mm and LT = 45 microns. Also from Figure 8, the optimum DMLS process parameters for the Ra (µm) found to be LP = 330 W, SS = 1500 mm s−1, HD = 0.16 mm and LT = 55 microns. The above-mentioned optimised process parameters (range and level) are fixed to print the samples for conformity tests further.
Main effect plot for SN ratio of ultimate tensile strength. Main effect plot for SN ratio of surface roughness. Response table for ultimate tensile strength. Response table for surface roughness.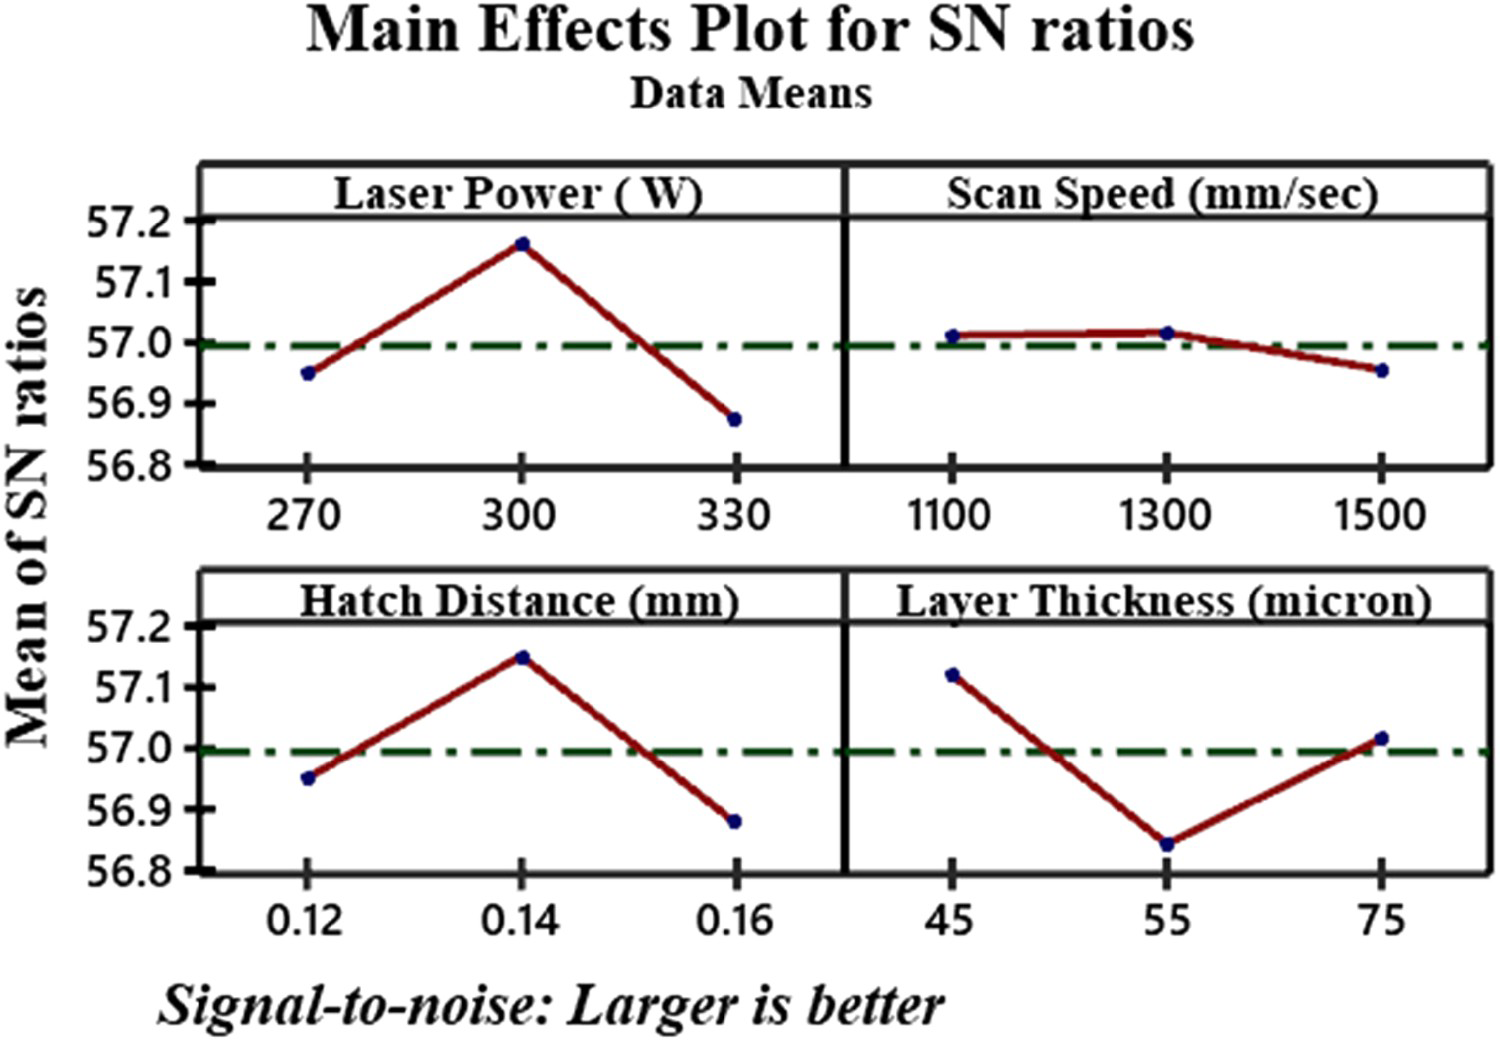
ANOVA for UTS (MPa) and Ra (µm)
ANOVA for UTS (MPa).
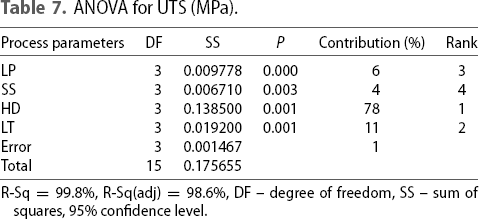
R-Sq = 99.8%, R-Sq(adj) = 98.6%, DF – degree of freedom, SS – sum of squares, 95% confidence level.
ANOVA for Ra (µm).
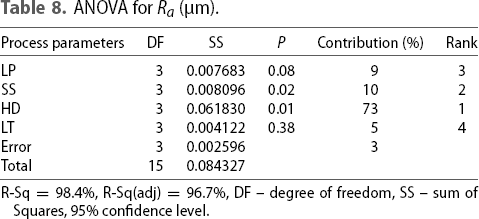
R-Sq = 98.4%, R-Sq(adj) = 96.7%, DF – degree of freedom, SS – sum of Squares, 95% confidence level.
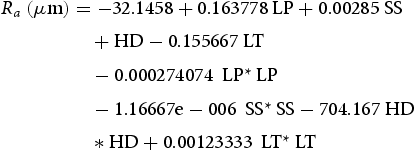
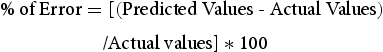
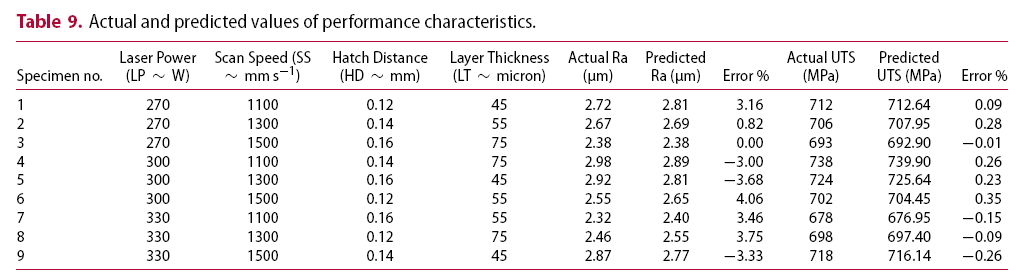
Mathematical model for UTS (MPa) and Ra (µm)
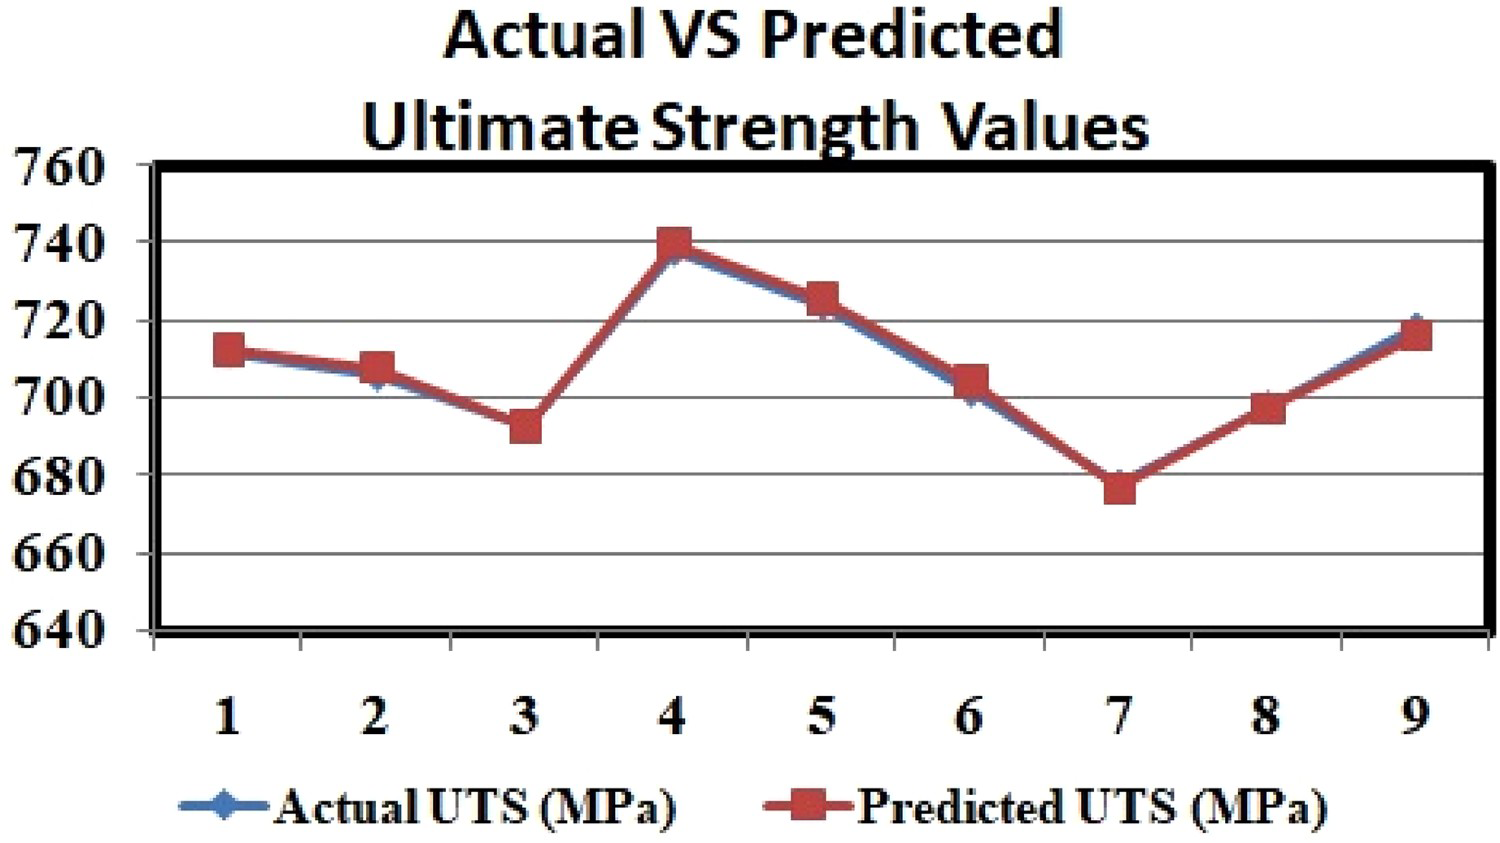
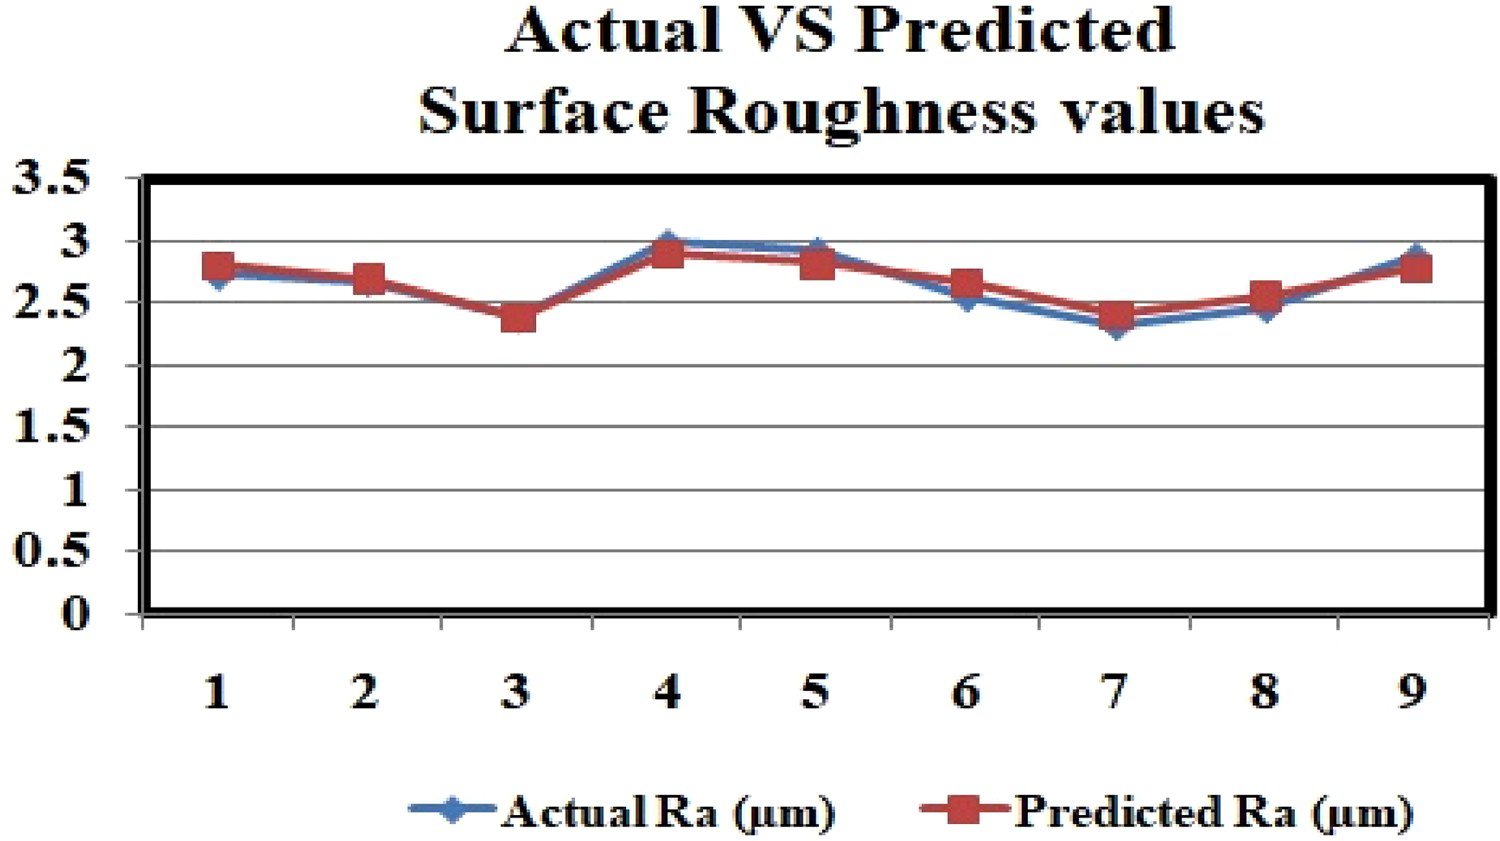
The Quadratic model for UTS (MPa) and Ra (µm) are developed using Minitab 19 software. ANOVA for UTS (MPa) and Ra (µm) with a 95% confidence level obtained the overall model as significant. The quadratic models for UTS (MPa) and Ra (µm) are shown in Equations (1) and (2). The regression coefficients of the quadratic model were R2 = 99.8% for UTS (MPa) and R2 = 98.4% for Ra (µm), respectively. The predicted and actual values of UTS (MPa) and Ra (µm) with error percentages are tabulated in Table 9. The error percentage of performance characteristics is calculated using Equation (3). Also, the predicted and actual values of UTS (MPa) and Ra (µm) are shown in Figures 9 and 10. The overall error percentages of UTS (MPa) and Ra (µm) were 0.08% and 0.58% which were +/−5%. Hence, the predicted quadratic model of UTS (MPa) and Ra (µm) was good and validated.
Actual and predicted values of UTS (MPa). Actual and predicted values of Ra (µm). Actual and predicted values of performance characteristics.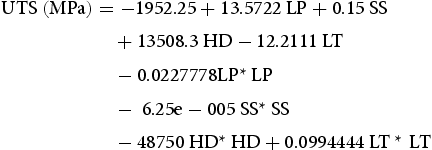
Conformity tests
The conformity tests are carried out to find improvements in the UTS (MPa) and Ra (µm) values. As per the ASTM standard shown in Figure 1, the dog bone shape is developed using CAD software. Now for conformity tests, the optimal results found using Taguchi analysis are considered. For sample 1, LP = 300 W, SS = 1300 mm s−1, HD = 0.14 mm and LT = 45 microns are set at the DMLS machine and the MONEL K-500 sample 1. Also, LP = 330 W, SS = 1500 mm s−1, HD = 0.16 mm and LT = 55 microns are set at the DMLS machine, and it printed sample 2. The same testing procedure for finding the UTS and Ra are carried out. Sample 1 gave a better ultimate strength value of 744 MPa at maximum load. Also, sample 2 had a better surface roughness value of 1.98 µm. Hence, the improvement of the ultimate tensile strength and surface roughness values is found using the Taguchi analysis.
Contour plots effects on UTS and Ra
The interaction effects of DMLS process parameters on ultimate tensile strength (MPa) and surface roughness (µm) are explained using contour plots as shown in Figure 11(a–f) and Figure 12(a–f). The contour plots are developed using Minitab 19 software. In Figure 11(a), it is clearly indicated that the ultimate tensile strength increases at the average value of the laser power and minimum scan speed. Also, ultimate tensile strength is decreased with increases in laser power and minimum scan speed. Figure 11(b) shows that maximum tensile strength is obtained at average values of hatch distance and laser power. In Figure 11(c), the tensile strength increases as the layer thickness increases. Figure 11(d) depicts that the tensile strength increases when the hatch distance is maintained at medium values. Also, tensile strength decreases greatly when the hatch distance increases. Figure 11(e) shows that the minimum ultimate tensile strength values can be obtained by maintaining average layer thickness values. But, it increases further by increasing the layer thickness values. Figure 11(f) shows that average ultimate tensile strength occurs at minimum layer thickness and hatch distance values. Hence, from Figure 11(a–f) it is clearly explained that the laser power parameter highly influences the ultimate tensile strength values, whereas scan speed influences less among the four selected parameters. The high intensity of the laser power beam, which solidifies the MONEL K-500 powder quickly into the metal component with more tensile strength.
(a–f) Contour plots of ultimate tensile strength vs DMLS process parameters. (a–f) Contour plots of surface roughness vs DMLS process parameters.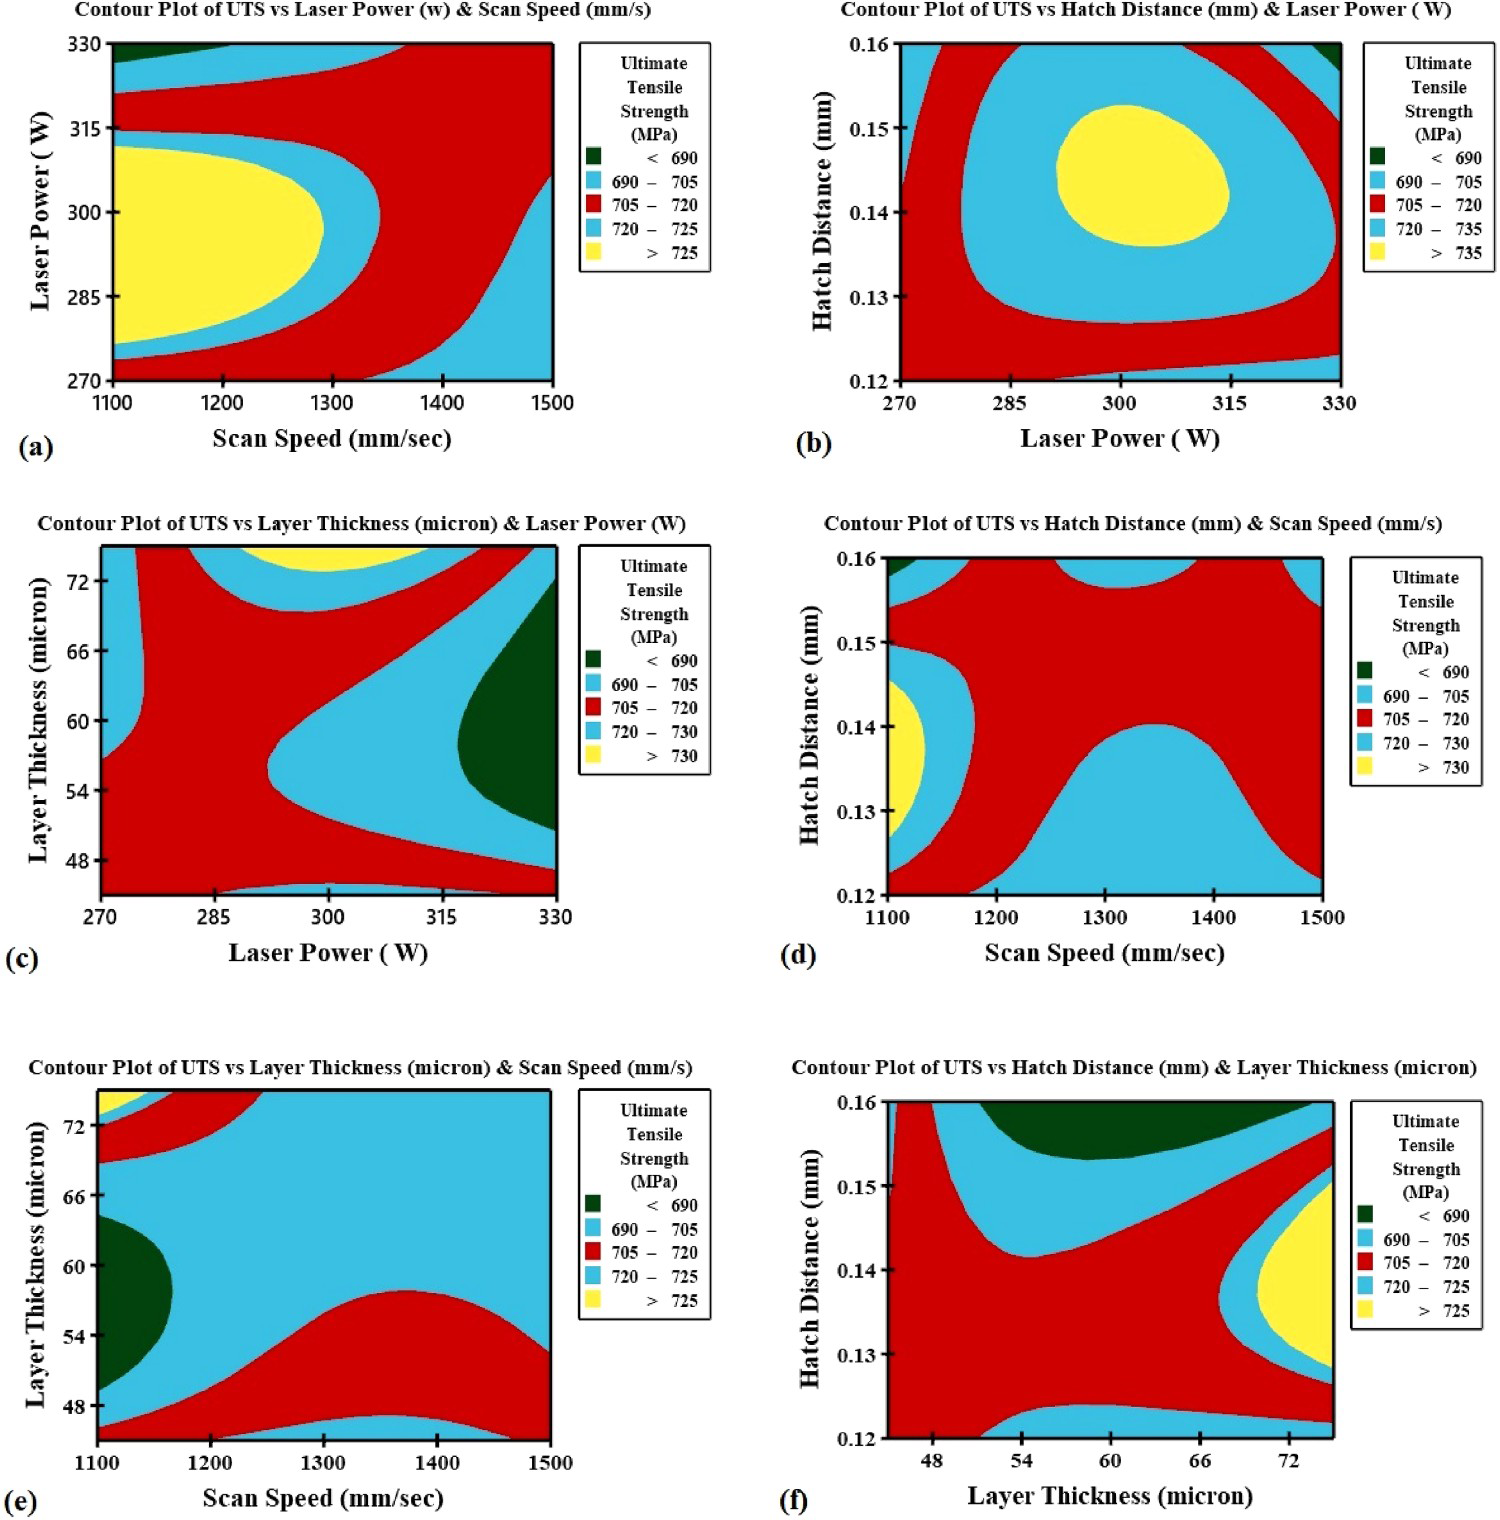
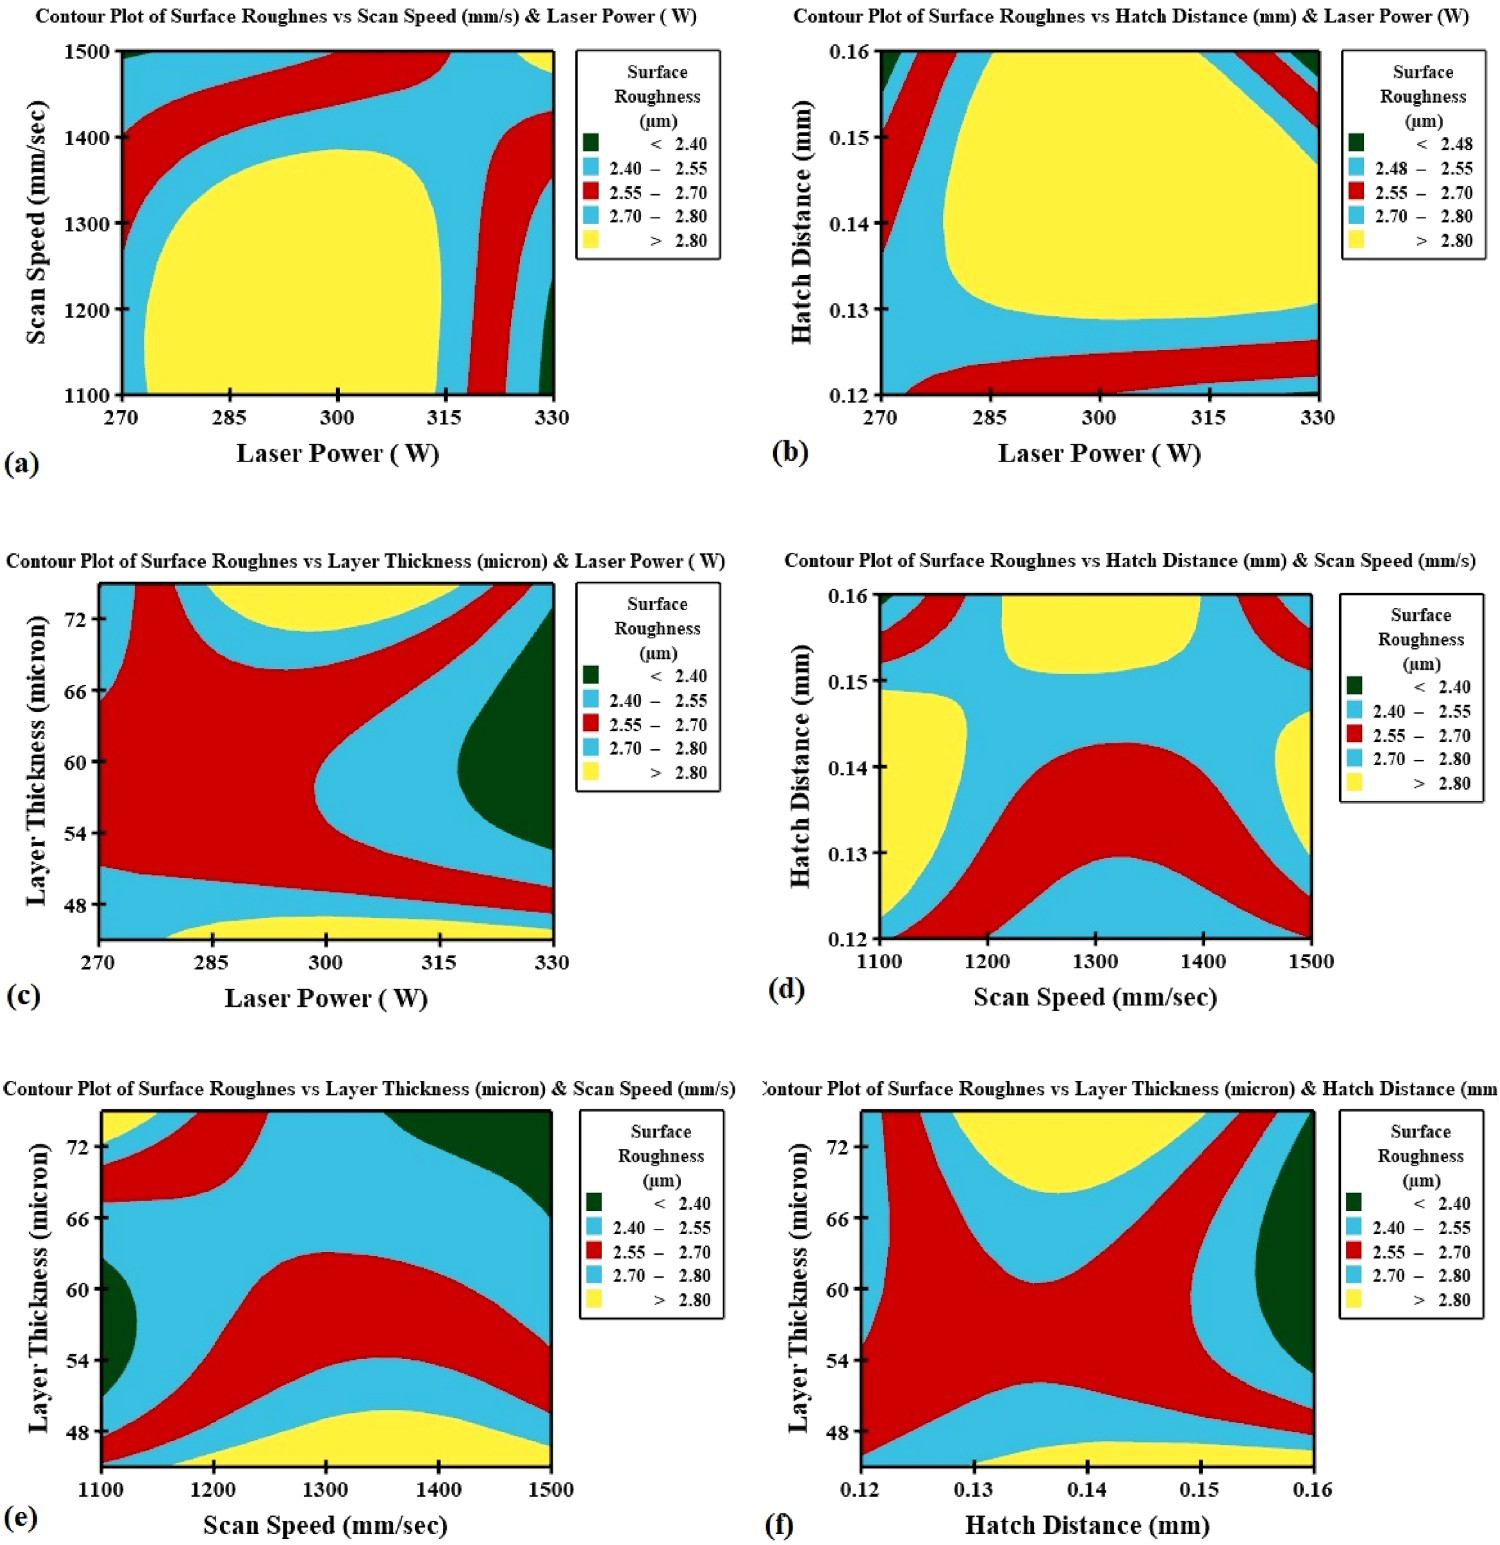
Similarly, from Figure 12(a), it is clearly shown that the minimum surface roughness can be obtained only by maintaining maximum laser power with a lesser scan speed, and vice versa. Figure 12(b) shows the maximum surface roughness obtained when increasing hatch distance with respect to the higher laser power values. From Figure 12(c), minimum surface roughness is obtained by increasing laser power with respect to the medium layer thickness. Figure 12(d) depicts that surface roughness gets higher with increasing scan speed with respect to the increasing hatch distance. Figure 12(e) shows clearly that better surface roughness is obtained when increasing the scan speed and layer thickness simultaneously. Figure 12(f) shows that medium roughness values were obtained only by maintaining the hatch distance and layer thickness at medium levels. Hence, as shown in Figure 12(a–f), the layer thickness parameter highly influences the surface roughness values, whereas the scan speed parameter influences very little among all the four parameters selected. The surface quality improved very much by maintaining the layer thickness parameter in the medium range.
Scanning electron microscope
The microstructural characteristics of the DMLS printed MONEL K-500 specimens are examined using a scanning electron microscope (Model: CARL ZEISSMERLIN). The range of magnification of the selected microscope is 4X to 200X. Here, the maximum surface roughness value obtained from the specimen and its SEM images are shown in Figure 13(a and b). Figure 13(a and b) shows the maximum Ra value specimens at 50 and 7X magnification, respectively. The DMLS parameters set ranges and levels of LP = 300 W, SS = 1100 mm s−1, HD = 0.14 mm and LT = 75 micron. Figure 13(a and b) depicts that more pores, precipitations, columnar grains and large laves are formed. The surface quality was highly affected due to the maximum layer thickness and intensity of the laser. Figure 13(c) shows the Taguchi optimum parameter for Ra taken for the SEM analysis. The optimum levels set at DMLS are LP = 330 W, SS = 1500 mm s−1, HD = 0.16 mm and LT = 55 microns, as shown in the sample 2 SEM image shown in Figure 13(c). It is observed that small laves and fine grains are formed. It is clearly indicated that good surface quality improved by maintaining the lower layer thickness and medium.
(a) Larger Ra value specimen at 50KX magnification, (b) larger Ra value specimen at 7 KX magnification and (c) optimum parameter for Ra specimen.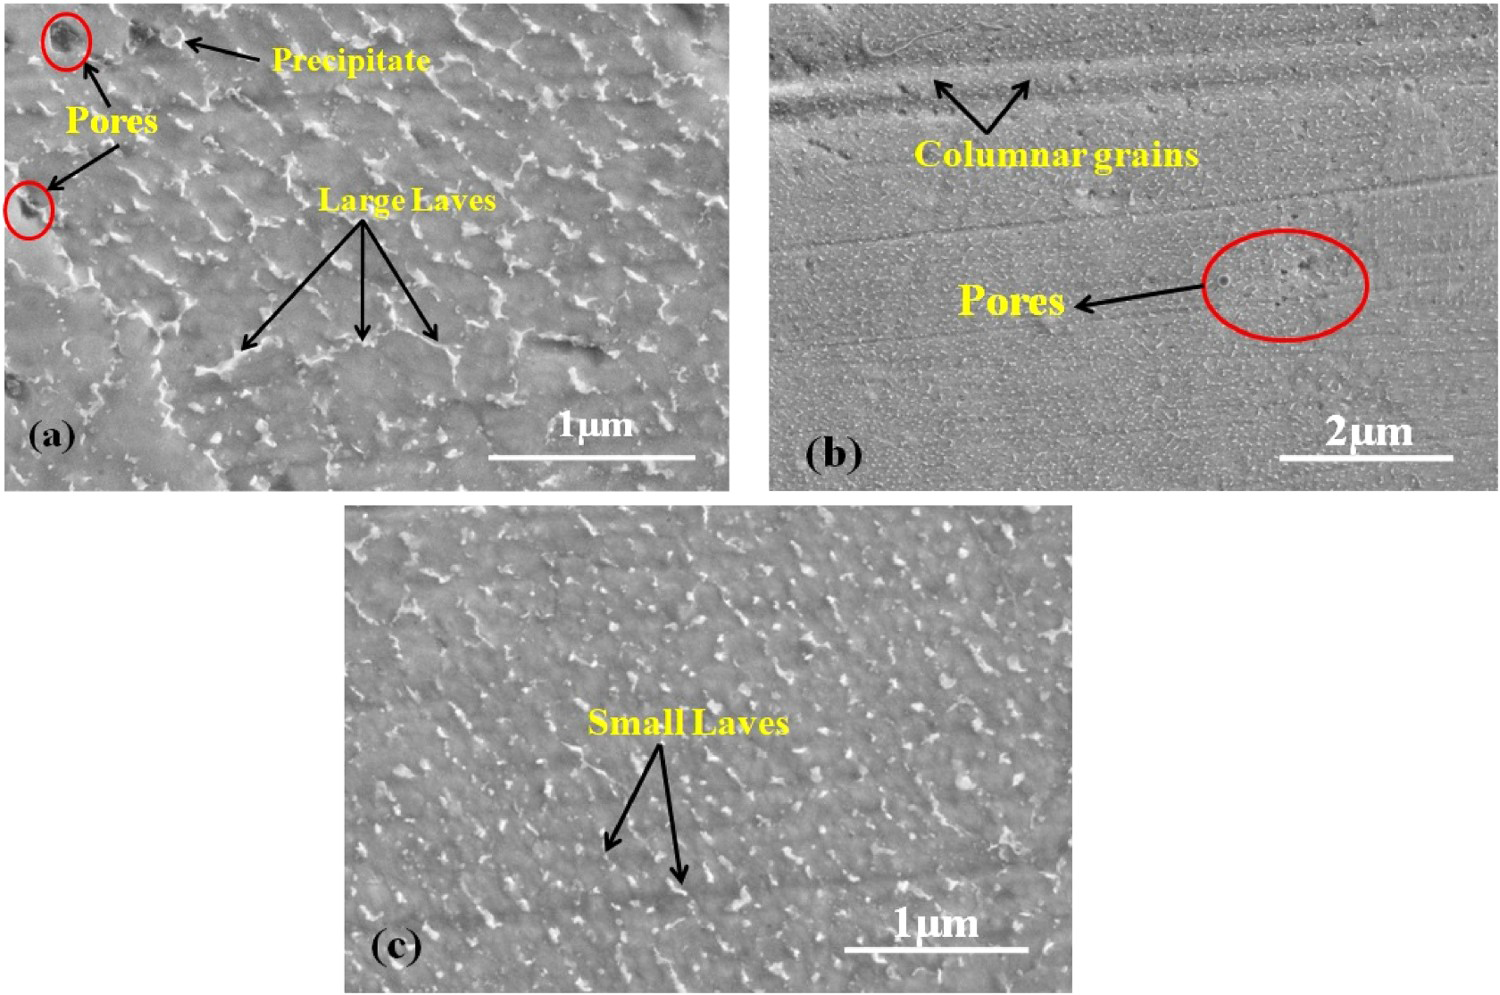
Conclusions
The investigations on DMLS printed MONEL K-500 superalloy were successfully carried out. The following conclusions are summarised below:
The optimum DMLS process parameters for ultimate tensile strength and surface roughness found using the Taguchi analysis are LP = 300 W, SS = 1300 mm s−1, HD = 0.14 mm, LT = 45 micron and LP = 330 W, SS = 1500 mm s−1, HD = 0.16 mm, LT = 55 micron respectively. The improvements in the UTS and Ra values are 744 MPa from 738 MPa and 1.98 µm from 2.32 µm. The improvements in UTS and Ra were 2% and 17%, respectively. The interaction effects of the DMLS process parameters on UTS and Ra found using the contour plots. It is observed that the high intensity of the laser power beam solidifies the MONEL K-500 powder quickly into the metal component with greater tensile strength. Also, surface quality improved greatly by maintaining the layer thickness parameter in the medium range. ANOVA revealed that HD and LT were the most significant process parameters, whereas LP and SS were the least significant process parameters on UTS (MPa). But, HD and SS were the most significant process parameters, whereas LP and LT were the least significant process parameters on Ra (µm). The optimum parameters setting sample gives the best microstructure characteristics.
Footnotes
Disclosure statement
No potential conflict of interest was reported by the author(s).