
Abstract
The Ti6Al4V is widely used in harsh working conditions where wear and tear are the common phenomena. In order to enhance its performance and life, the laser cladding took place using Ti6Al4V:WS2: Ni as the reinforcement material. The influence of scanning speed on mechanical and tribological properties like hardness, wear resistance, and microstructure of the cladding parts is discussed. The dendritic, white, and grey phased fine microstructures are observed. The micro-hardness of the clad is increased up to four times (∼1170 HV0.5) of the substrate material due to the formation of a hard Ni–Ti phase. The wear resistance of the clad is exhibited two times higher than that of the substrate. Also, the coefficient of friction is reduced to 0.25 as the adhesion wear mechanism becomes predominant over the abrasion.
Introduction
Industries like aerospace, biomedical, chemical, and manufacturing have various titanium alloy applications due to its high corrosion-resistant, high strength by weight ratio, low density, low modulus, etc. [1-4]. However, the main demerit of titanium alloys is their low hardness, low wear resistance, highly corrosive nature in a strong acid environment, and high-temperature abrasion. Hence, their uses are restricted to a few specific applications [5]. Researchers worldwide are trying to develop a layer over the surface of titanium to overcome the above-associated problems. For developing a high wear-resistant and hard layer over the different materials, techniques like Physical Vapor Deposition (PVD), Chemical Vapor Deposition (CVD), Thermal spraying, Tungsten Inert Gas (TIG) cladding, Electro Discharge coating, and Laser cladding are utilized around the world. Out of these methods, laser cladding is one of the effective techniques in terms of low dilution rate, control of coating layer, metallurgical bonding at the interface, etc. In laser cladding, high-energy beams are focused onto the surface, where coating materials are placed. Therefore, a molten pool is created, and on its solidification, an alloying layer over the substrate is developed.
Zhou et al. [6] developed a self-lubricating metal matrix composite (MMC) over the titanium alloy reinforcing Ni, B4C, graphite, and Si3N4 powders with the help of the laser alloying technique. The developed MMC had shown 3.7–4.5 times higher coating hardness and three times better wear resistance property compared to the substrate material. Wu et al. [2] constructed an anti-corrosive coating (Iridium coating) on titanium alloy using a double glow plasma discharge process. It was found that the corrosion potential was high, but the polarization resistance of the coating was low due to the presence of several defects. Farotade et al. [7] created a cermet coating of Ti–SiC–ZrBr on Ti6Al4V alloy and noticed that microstructure changes with the development of new phases by increasing the content of ZrBr. This ultimately increases the micro-hardness of the component up to four times higher than the substrate. Chen et al. [8] constructed an MMC coating of TiN and TiB on titanium alloy using the laser cladding technique and observed flower-like structures in the centre and rod or hollow tube-like structures at the edges of the coating. Nickel-based self-lubricating cladding is formed using B4C and SiN powders [6]. Further, Zhang et al. [9] fabricated CrAlTiCN coating on TC4 substrate using multi-arc ion plating technology and obtained refined microstructure (resemblance to weak columnar type), which enhanced the tribological performance. Behera et al. [10] constructed a hard coating of h-BN + B4C on titanium substrate using laser cladding. It was observed that the wear resistance and micro-hardness property of the coating were enhanced due to the presence of C3N4, B13C2, and TiCN phases. Ren et al. [11] fabricated anti-wear composite coating on titanium alloy and found the formation of some phases like TiC, TiWC2, CrS, Ti2CS, etc., which owing friction-reducing effect.
The above literature reveals that the researchers are still developing a cladding process to enhance the property of titanium alloy by using different powder compositions. An enhancement of surface self-lubricating property is required to introduce titanium alloy in abrasion, high impact conditions, and wear environment. In this regard, the low coefficient of friction (COF) of WS2 makes it a widely used solid lubrication coating, which can be performed satisfactorily in high pressure and temperature [12-16]. However, pure powder WS2 weakens the coating layer and causes poor performance [17]. Hence, in the present work, a mixture of WS2, Ti–6Al–4V, and Ni is used as precursor powder for enhancing the self-lubricating coating. The proposed work concentrates on the consequences of scanning speed for developing sub-surface microstructure, micro-hardness, and wear behaviour of the coating created by laser-assisted cladding method on titanium plate. This study is considered to find a suitable range of scanning speed for obtaining a self-lubricating composite coating powder. A detailed investigation of the wear failure mechanism of the coated surface is also carried out.
Materials and methods
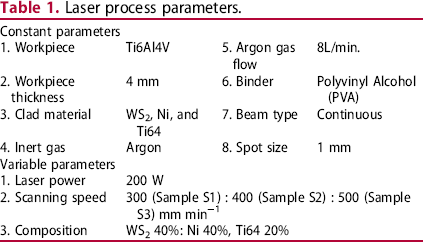
Laser process parameters.
For preparing WS2, Ni, and Ti6Al4V MMC clad layer over Ti6Al4V (TC4) substrate surface, SPI fibre laser [Make: Trump UK] has 400 W power and beam wavelength 1070 ± 10 nm was utilized. The experimentation setup consists of a laser source, infrared pyrometer, working chamber, laser head, SIEMENS controller (for executing the program during the laser cladding operation), and XYZ motion table for executing the laser cladding process (Figure 1).
Experimental setup and prepared samples (S1, S2, and S3).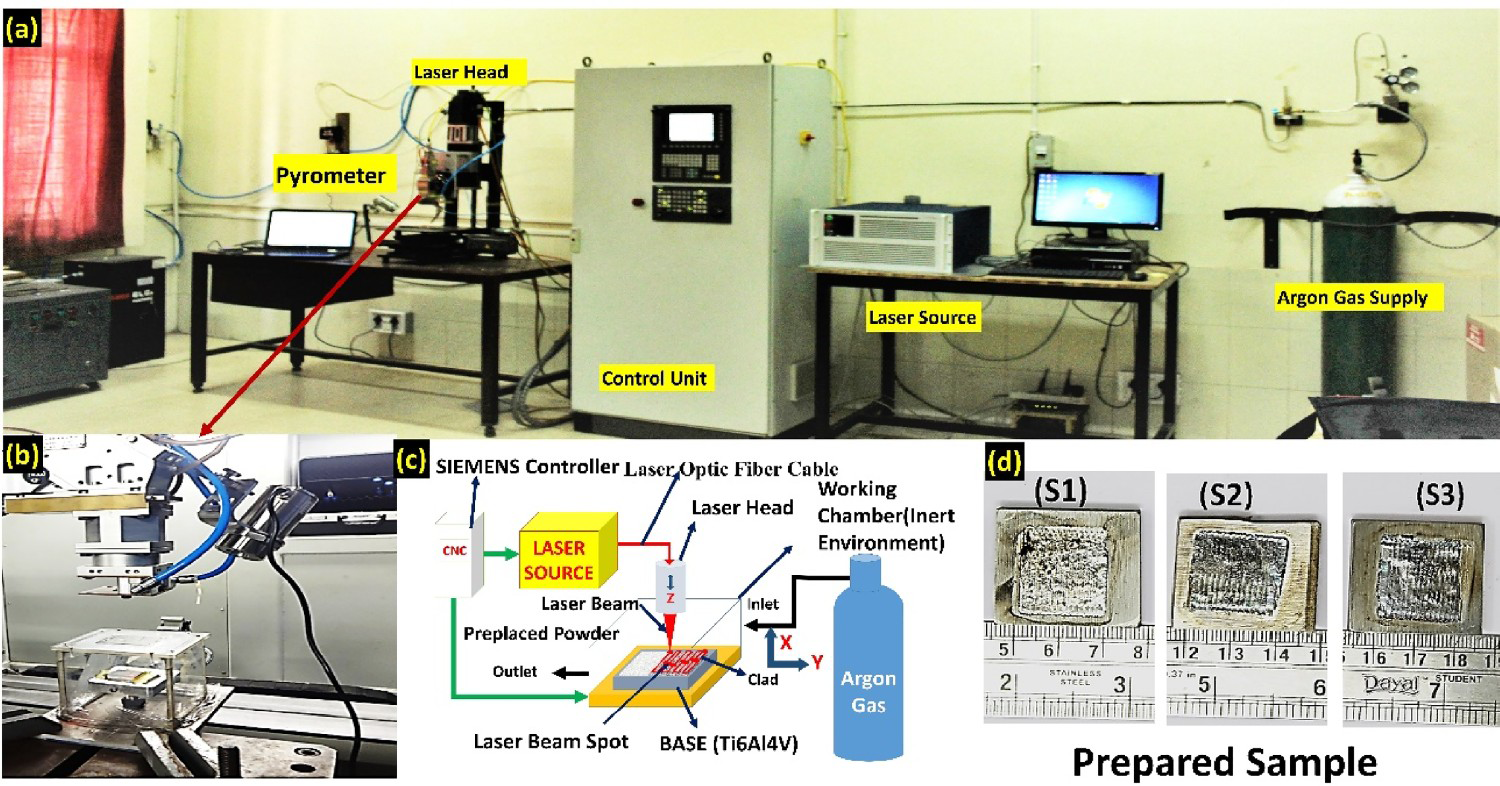
In this process, the laser beam is irradiated on the powder bed and moves in a defined path using the SIEMENS Controller. Therefore, the powders get fused and deposited over the substrate (TC4), causing the formation of cladding. For fabrication of the clad surface, the laser is moved in a specified path shown in Figure 1(c) by 50% overlapping the previously scanned path. The prepared samples (Figure 1(d)) were then brought to the Wire Electrical Discharge Machining (WEDM) set up and cut across the cross-section for further characterizations. The sectioned samples were then moulded and polished using emery papers having different girt sizes (400, 600, 800, 1200, 1500, and 2000 μm), followed by cloth and diamond polishing to get a mirror finish surface. Further, the polished samples were etched with Kroll's reagent. The samples were investigated using XRD (Make: Rigaku Japan) to identify the compound formation due to chemical bonding between precursor powder and substrate material. Coating morphology and elemental distribution were analysed by FESEM (Make: Zeiss Gemini Sigma, Germany). The sub-surface micro-hardness profile from the top cladding surface to substrate material was obtained by measuring its value in every 100-µm distance along the depth using a Vickers micro-hardness tester (Make: Mitutoyo, Chennai Metco). The wear behaviour of the self-lubricating coating was investigated utilizing a reciprocating wear testing machine (Make: R-Tec instruments). 3D Profilometer (Make: Zygo new view 9000) and FESEM were used to investigate the wear tracks and the wear mechanism.
Results and discussion
Temperature analysis
An optical pyrometer was used to record the temperatures during the cladding process for all the samples. Figure 2(a) shows the temperature–time graph of sample 2 (S2) prepared with 400 mm min−1 scanning speed. It indicates of A2 to B2 heating period and B2 to C2 cooling period. In the curve from point ‘d’ to ‘e,’ the material is fully in the liquid state. After point ‘e,’ it starts to change into a solid-state by liberation of the heat of solidification. It is in a solid–liquid equilibrium state up to point ‘f.’ After that, re-crystallization begins as the slope of the curve indicates the stiff decreasing trend. The slope of the cooling curve after the nucleation site is termed the ‘cooling rate.’ Figure 2(b) shows the comparative study of the temperature-time graphs of different coated samples. The graph shows that the slope of the cooling curve for the sample prepared with the scanning speed of 300 and 400 mm min−1 is the same. However, the sample prepared with a scanning speed of 500 mm min−1 shows a higher cooling rate. The cooling rate for different samples is depicted in the bar graph (Figure 2(c)). The observed cooling rate is further utilized to explain the coated samples’ wear resistance and micro-hardness properties in the subsequent subsections.
Thermal monitoring cycle: (a) molten pool life at 400 mm min−1, (b) temperature profile at scanning speed [300, 400, and 500 mm min−1], (c) cooling rate at scanning speeds of 300, 400, and 500 mm min−1.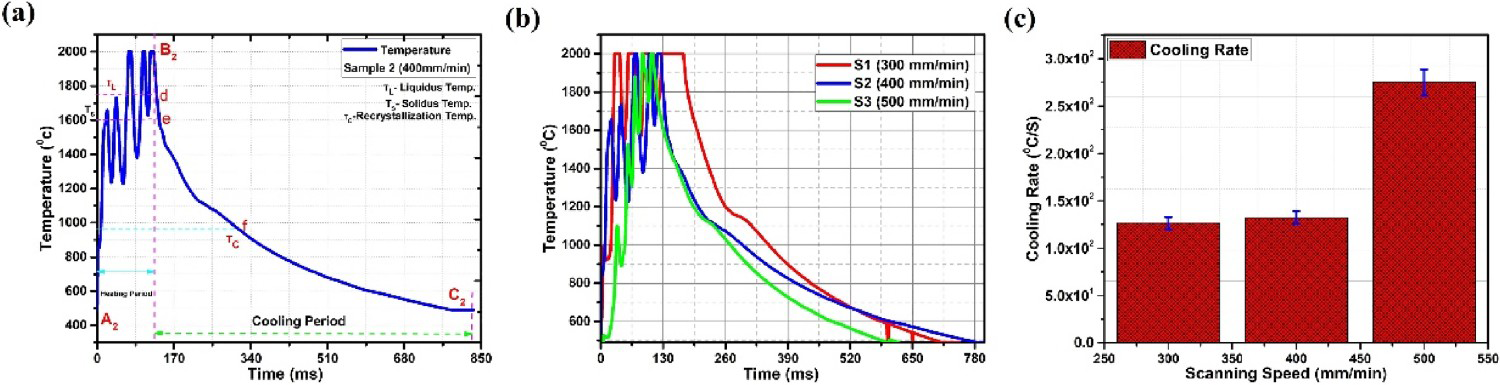
Phase analysis
XRD spectra of composite coating of WS2, Ni, and Ti–6Al–4V with varying scanning speeds are shown in Figure 3. It is observed that TiNi, Ti2S, NiS, WS2, and Al2S3 are the main compounds formed in the cladding process. TiNi, Ti2S, and WS2 are the most significant compounds for the up-gradation of the clad's tribological and solid lubricating properties.
XRD pattern of cladding layer at different scanning speeds of 300, 400, and 500 mm min−1 (S1, S2, & S3) at constant laser power of 200 W.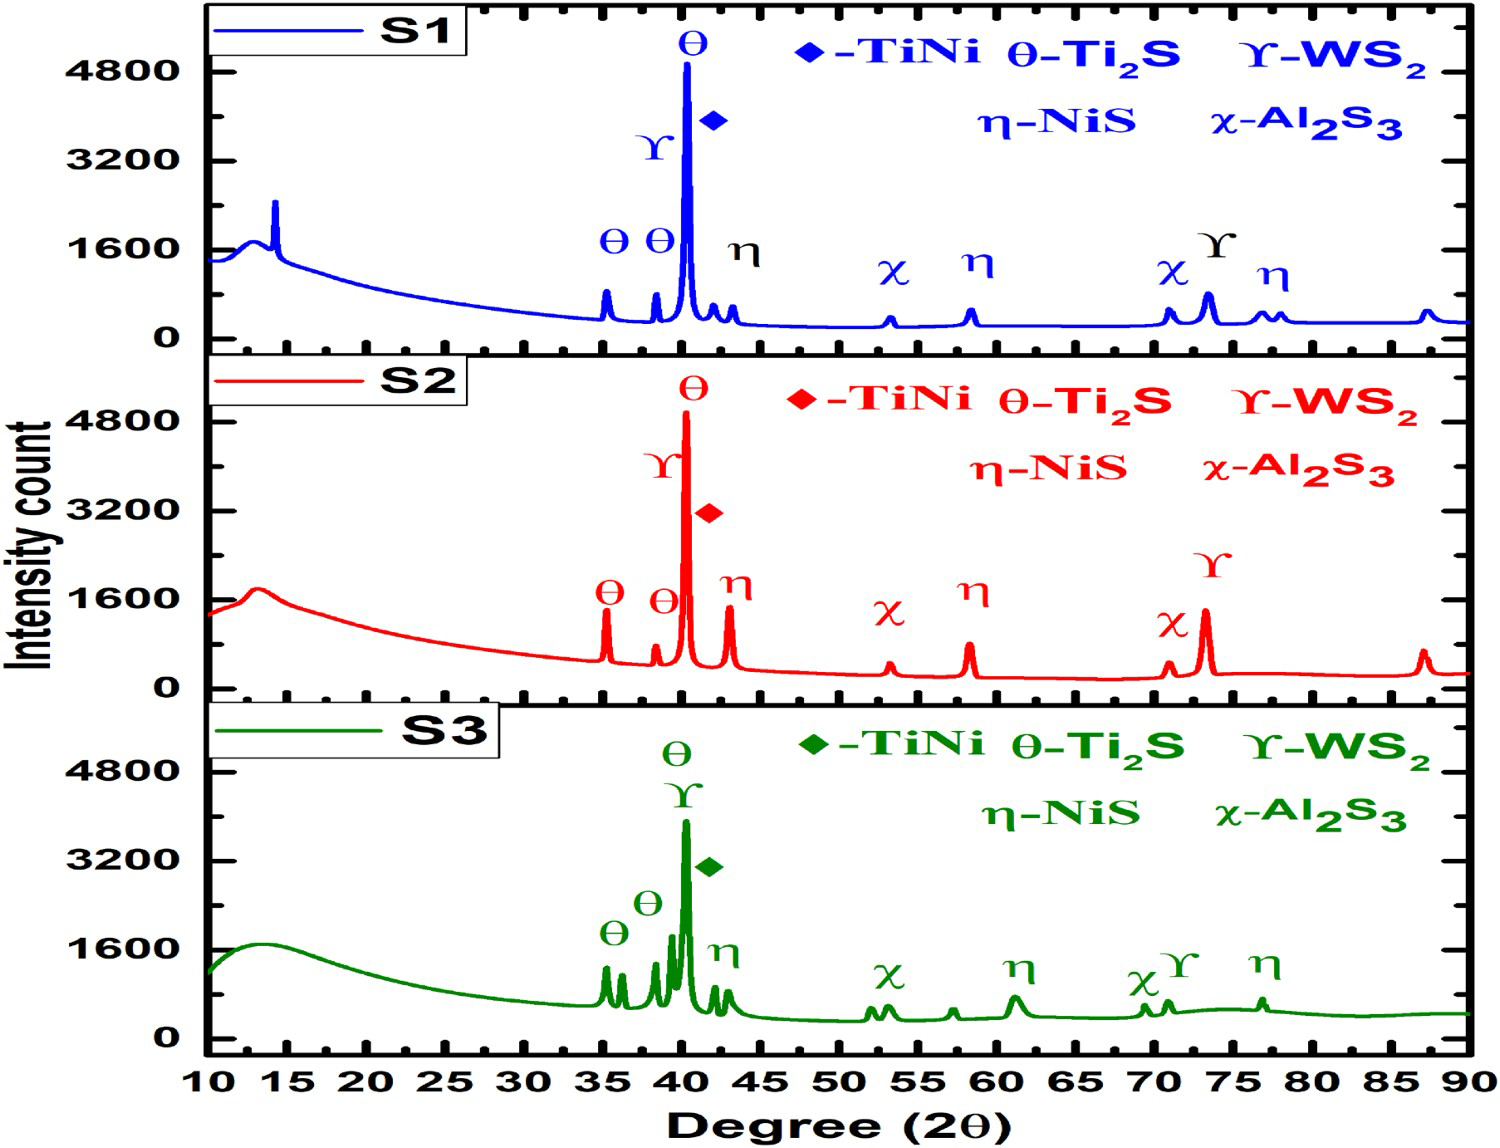
From Figure 3, the intensity of the sulphide peaks in the diffraction pattern of the coated surfaces changes with the variation of scanning speed. At the scanning speed of 400 mm min−1, the desired compound's intensity peaks are higher than the other scanning speeds chosen. The observation shows that at the higher scanning speed of 500 mm min−1, the laser beam travels quickly over the surface of the reinforcement, resulting in improper fusion and hence a lack of the intensity of phase formation. But in conjunction with a scanning speed of 400 mm min−1, the uniform high heat input promotes the precursor powders into the lattice. It has also been confirmed that the increase in scanning speed leads to an increase in cooling rate for the solidification of molten pools and phase formation [18].
Clad morphology
Figure 4(a–c) depicts the cross-sectional morphology of the cladding sample for various scanning speeds (300, 400, and 500 mm min−1) and at 200 W constant laser power. From the figure, strong intermetallic (metallurgical) bonding between the substrate and cladding part is observed at a laser scanning speed of 400 mm min−1. It might be due to the uniform mixing of reinforcement and substrate material. However, some micropores are visible in the coating (as shown in Figure 4(a–c)). It might be due to the inclusion of the gases during the cladding process [19-21]. Apart from the micropores, no other types of defects are observed in the coating-substrate interfaces and the clad portion. Figure 4(d–f) portrays the magnified images of the intersection zone. Uniform mixing and fine microstructure are identified at a 400 mm min−1 scanning speed compared to other scanning speeds. High melting and diffusion of material reinforcement at lower scanning speed cause dilution. At the same time, irregular grain orientations are observed at a higher scanning speed of 500 mm min−1. This may be followed because of improper cooling as higher scanning speed [22,23].
FESEM micrograph of cross-section and intersection zone of the clad (a,d) sample S1 (b,e) sample S2 (b,e) sample S3 (c,f).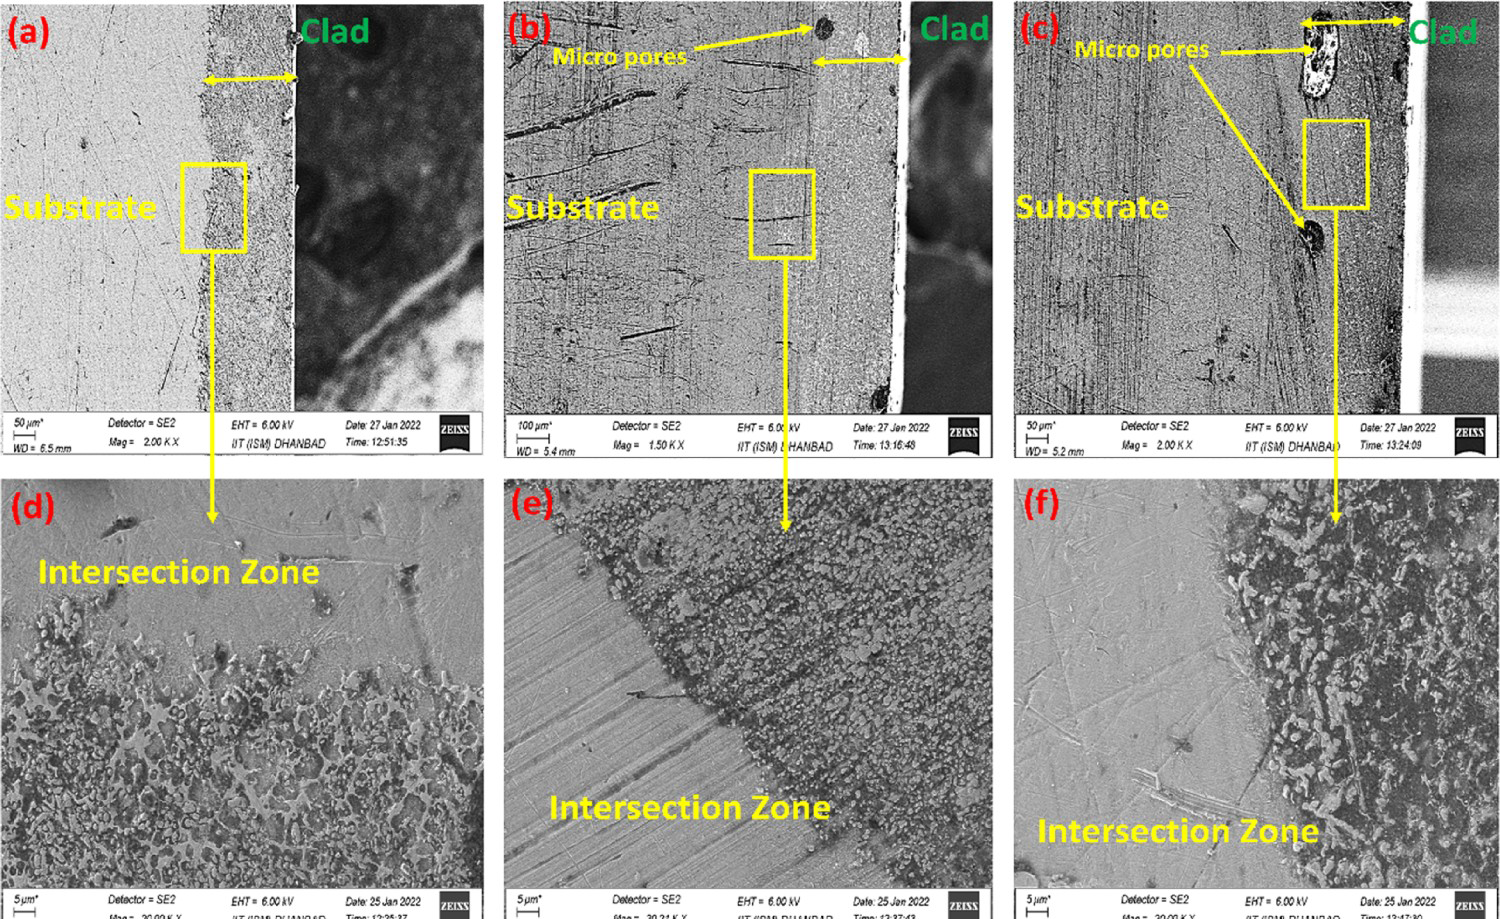
Microstructure
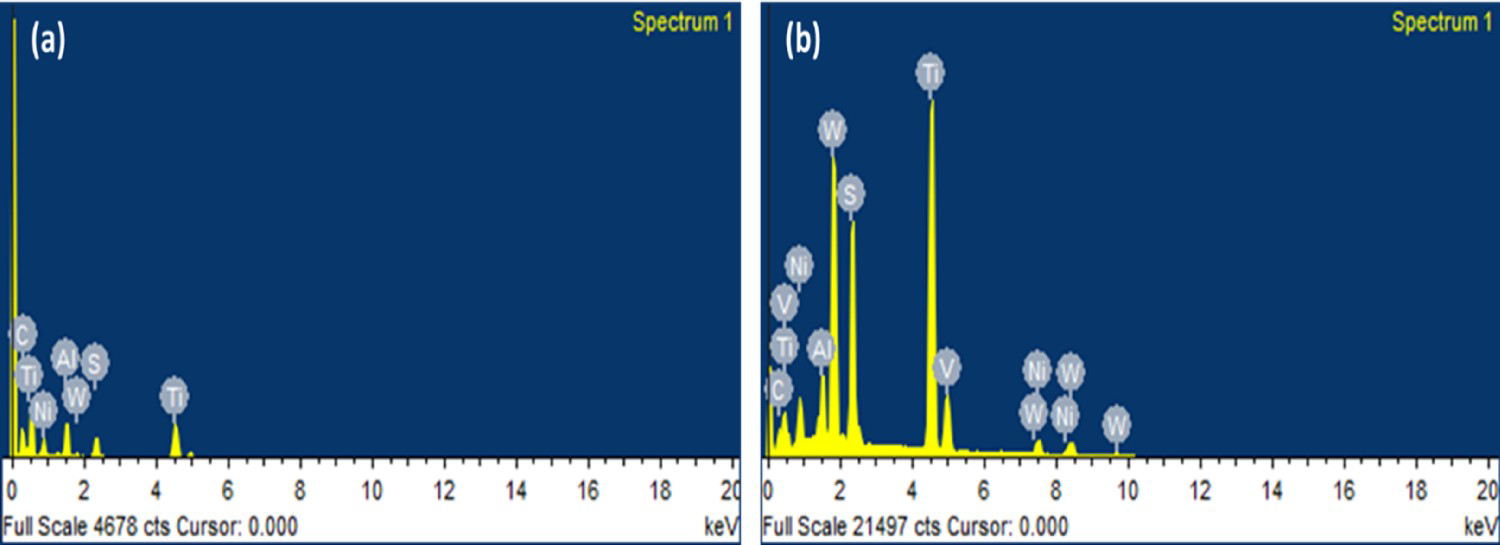
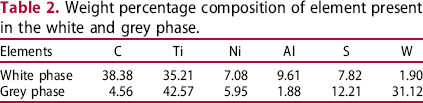
Figure 5(a–c) illustrates the FESEM images of the different coatings fabricated with varying speeds of scanning. A large amount of white phase and grey phase is observed. Figure 5(a) depicts the microstructure of coating made at a scanning speed of 300 mm min−1. It gives the view of the white granular phase, grey phase, and dendritic phase. With the increment of scanning speed from 300 to 400 mm min−1, the white granular phase becomes the white dendritic and short dendritic phase, whereas the grey phase becomes the grey granular phase (as shown in Figure 5(b)). Figure 5(c) shows that the white granular, grey, and short dendritic phases appear due to increased scanning speed. This observation explains the infusion of the molten pool into the substrate rapidly because of the higher rate of cooling [24,25]. The formation of the Ni–Ti compound in the coating is confirmed by identified dendritic phases, while the white phase and grey phase depict the formation of Ti2S, NiS, Al2S3, and WS2 compounds in the coating region. Figure 5(d–f) shows the magnified images to show the microstructure of the coated samples. Mainly lamellar phase, white acicular phase, and grey granular phase are identified by adding WS2 and Ni powder. On increasing the scanning speed, the white granular phase, and dendritic phase [26,27] increase simultaneously, enhancing the self-lubricating properties associated with the hard coating. The microstructure is refined at a scanning speed of 400 mm min−1. This would be because of uniform diffusion of reinforcement and proper cooling resulting in fine-grain structures, as shown in Figure 5(e). Figure 6(a,b) shows the Energy Dispersive Spectroscopy (EDS) spectrum of the clad, which is used to confirm the presence of elements that enhance the clad's solid lubrication and mechanical properties. The grey particles and smaller black particles consist of WS2 and a combination of Ni, respectively. The white and grey phase compositions are investigated through EDS analysis (Figure 6), and the identified alloying elements are presented in Table 2.
Cross-section microstructure of the clad zone of (a) sample S1 (b) sample S2 (c) sample S3 and corresponding higher magnifined image of a particular region of (d) sample S1 (e) sample S2 (f) sample S3. EDS spectra of the elemental composition of the white (a) and grey (b) phase. Weight percentage composition of element present in the white and grey phase.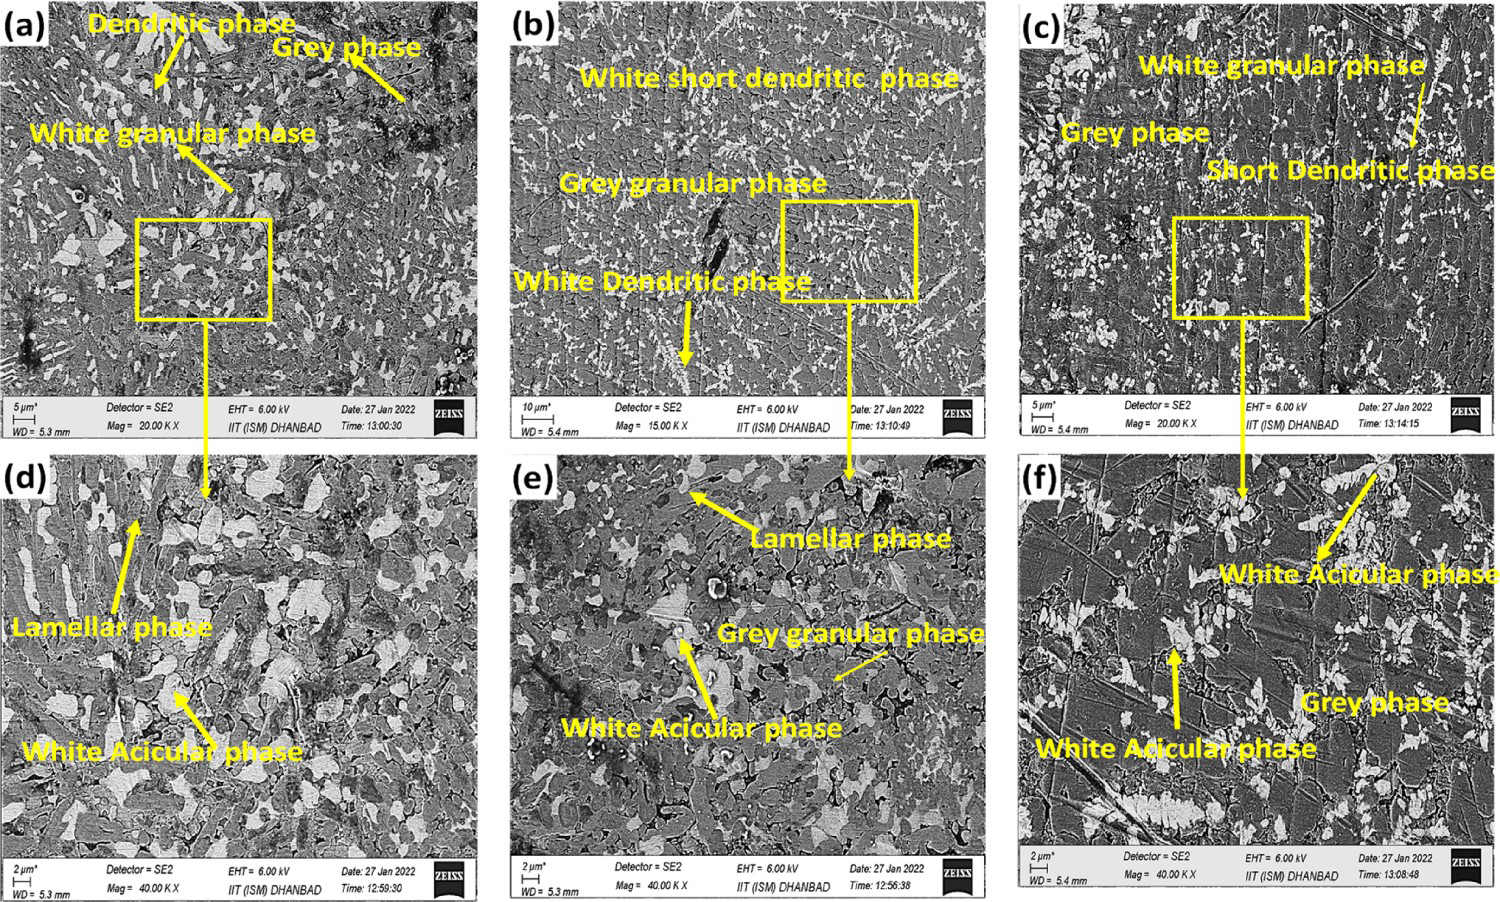
Micro-hardness analysis
The micro-hardness value across the cross-section of the clad has been investigated. Figure 7 shows the micro-hardness profile from the cladding surface to the substrate material, where different colours are used to denote the hardness profile for different scanning speeds. The micro-hardness values along the depth are non-uniform. The clad layer just beneath the surface shows the highest micro-hardness value. The hardness value remains almost constant up to the beginning of the interfacial zone, and thereafter, it suddenly decreases. On average, the interface zone hardness value is slightly higher (∼400 HV0.5) than the base material (∼358 HV0.5). With a scanning speed of 400 mm min−1, an average hardness beneath the surface is 1170 HV0.5, whereas the same values are ∼1000 HV0.5 and ∼900 HV0.5 for the cladding obtained at scanning speeds of 300 and 500 mm min−1, respectively. This observation is due to the proper heat accumulation and instant cooling at a suitable scanning speed. Further, microstructures are refined to fine-grain structures at a higher cooling rate and increases the micro-hardness of the cladding [7]. Also, the hard phase composite microstructure formation has a greater hardening capability and plastic reserving capacity, which significantly increases the cladding layer's micro-hardness [28,29].
(a) Micro-hardness variation of the sub-section of the clad, (b) Diamond indentation at the clad.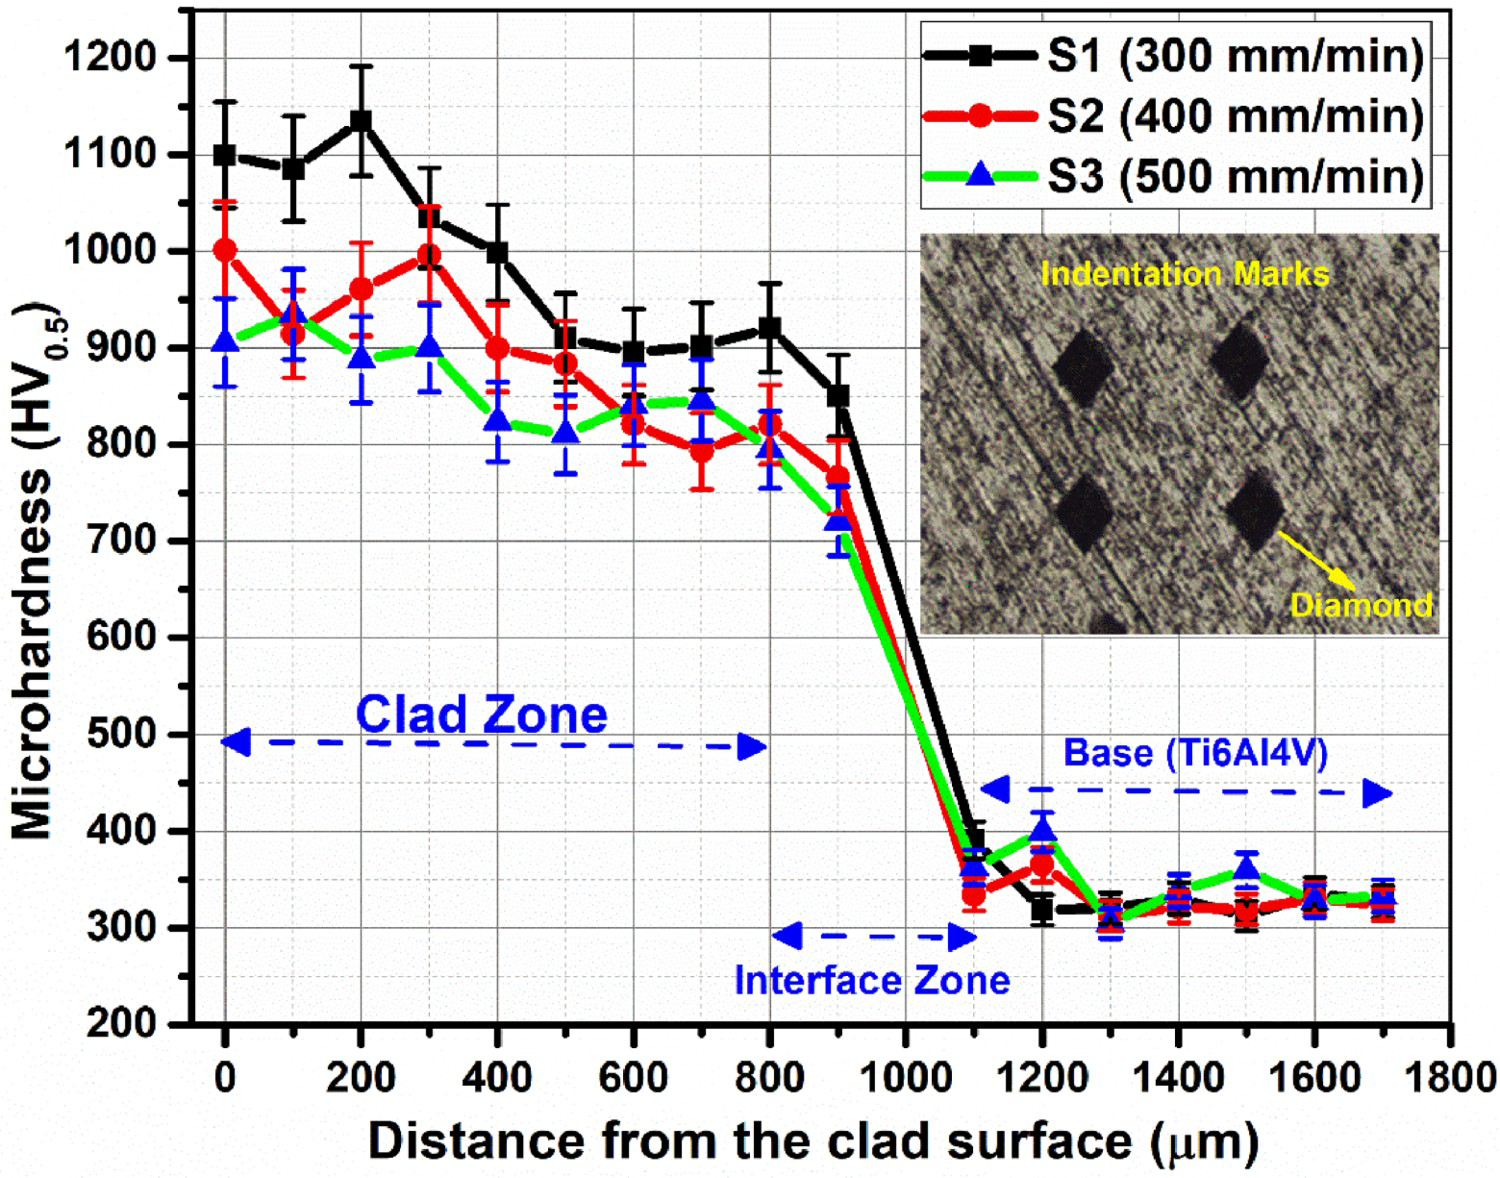
Wear behaviour analysis
To increase the service life of a workpiece, enhancing the wear resistance property of coating is of great significance. In this regard, wear tests have been performed at a load of 10 N for 5 min in a reciprocating tribometer. The wear track of the base material is deeper and wider compared to the cladding samples. However, the lower track profile depth is obtained for the sample at a scanning speed of 400 mm min−1. Figure 8 shows the COF of cladding made with various scanning speeds and the substrate material. The observation from the graphs shows that the cladding with a scanning speed of 400 mm min−1 has the least COF, which was around 0.25. In comparison, the observed COF values of cladding samples with scanning speeds of 300 and 500 mm min−1 are ∼0.32 and ∼0.28, respectively. However, cladding samples have shown lower COF values than the substrate [ i.e. ∼0.48]. This observation is supported by the microstructure analysis, where the presence of the solid lubricating phases [TiS, NiS, WS2, and AlS] are found.
Coefficient of frictions of base at 400 mm min−1 and clad surface at 300, 400, and 500 mm min−1 of scanning speed.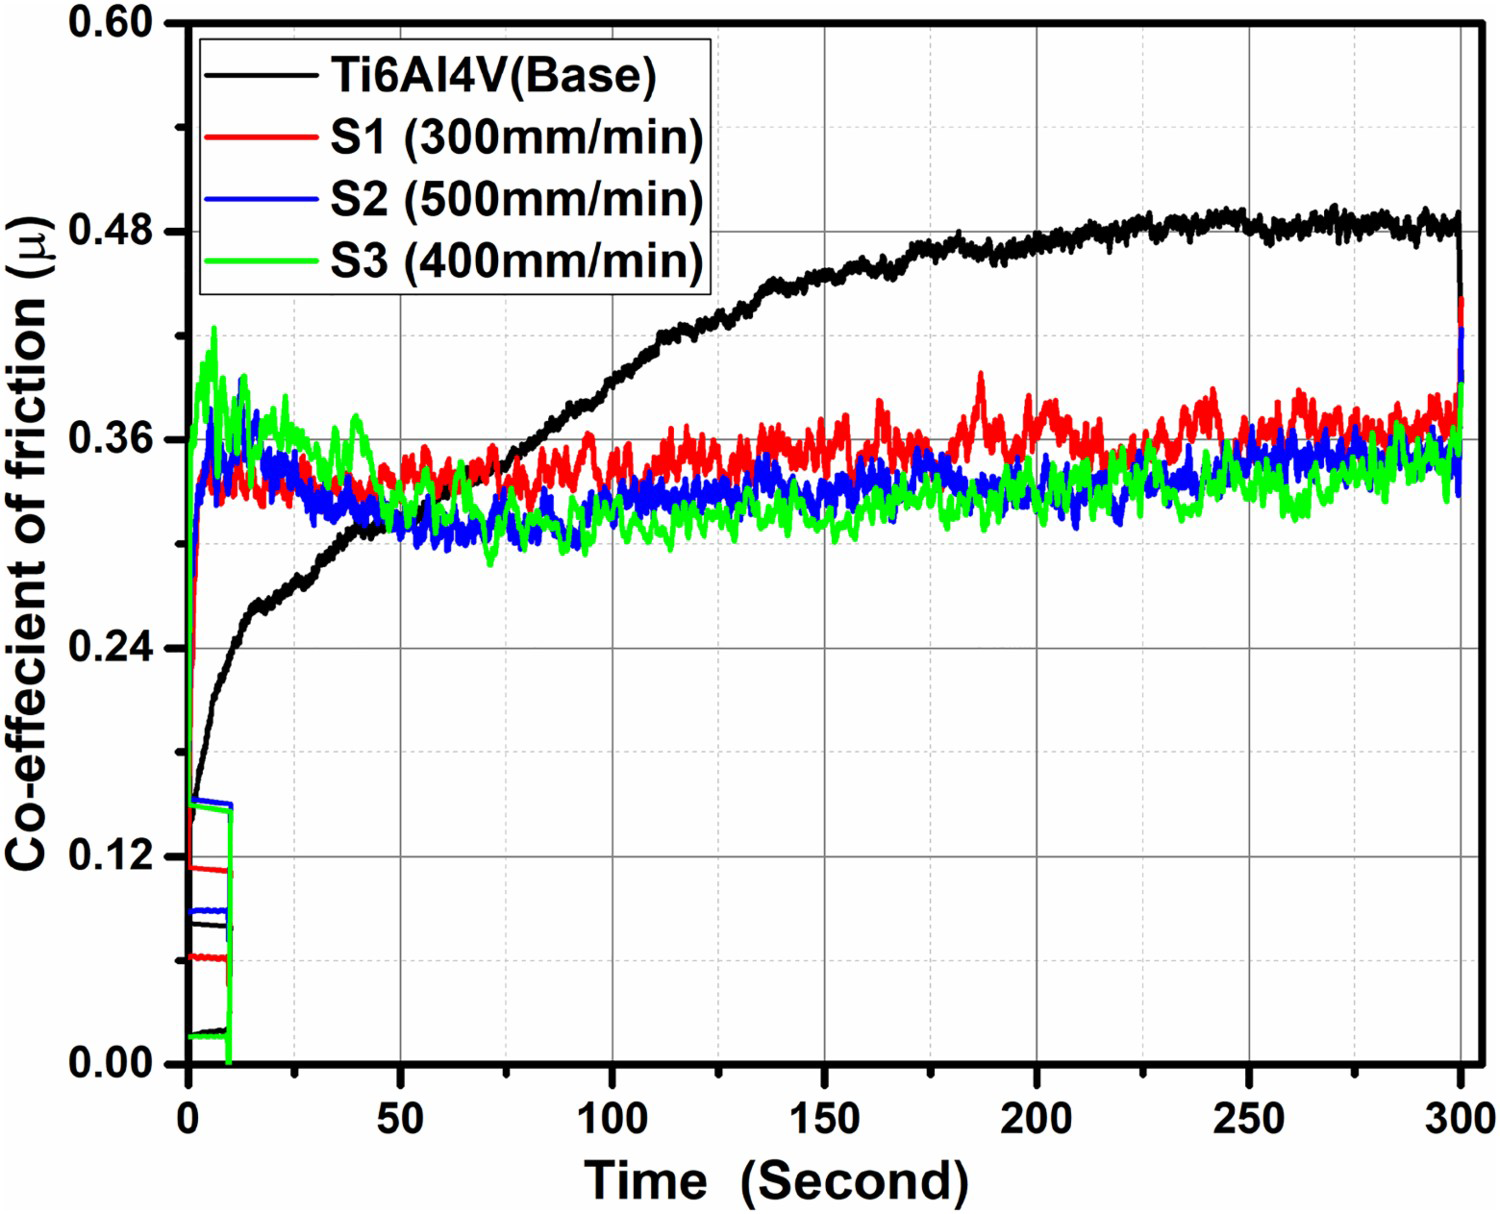
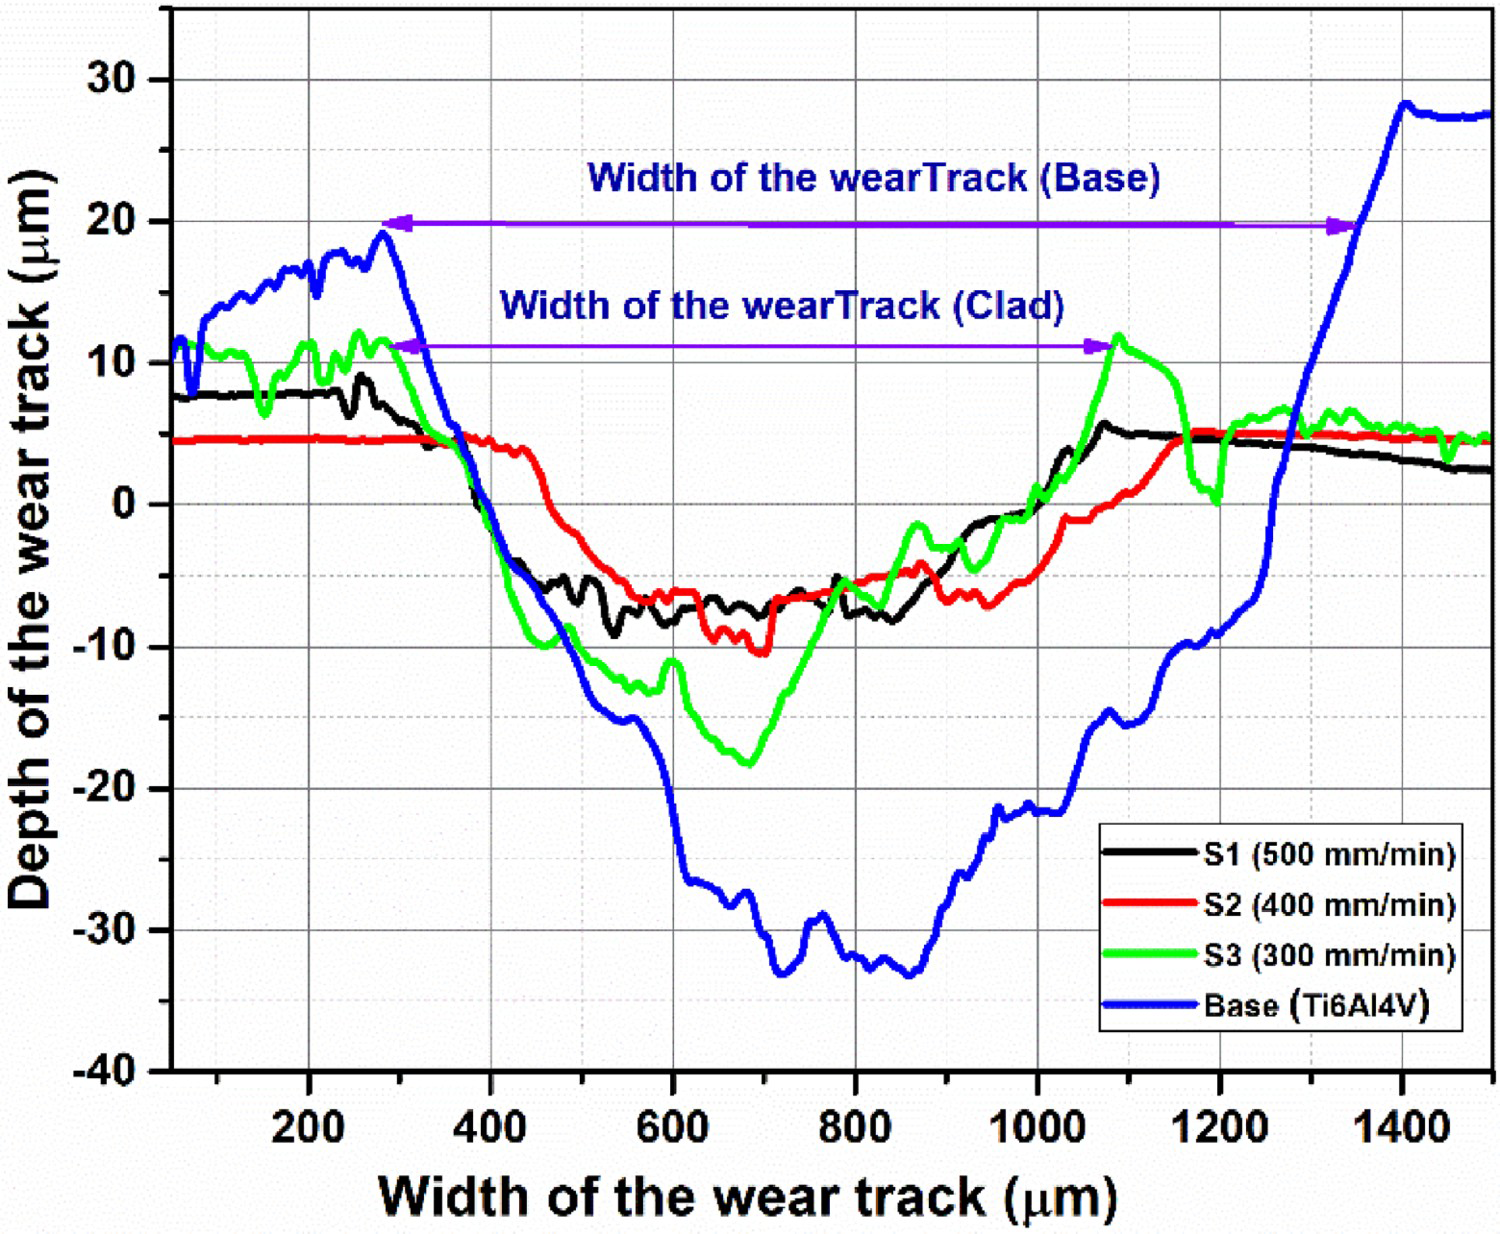
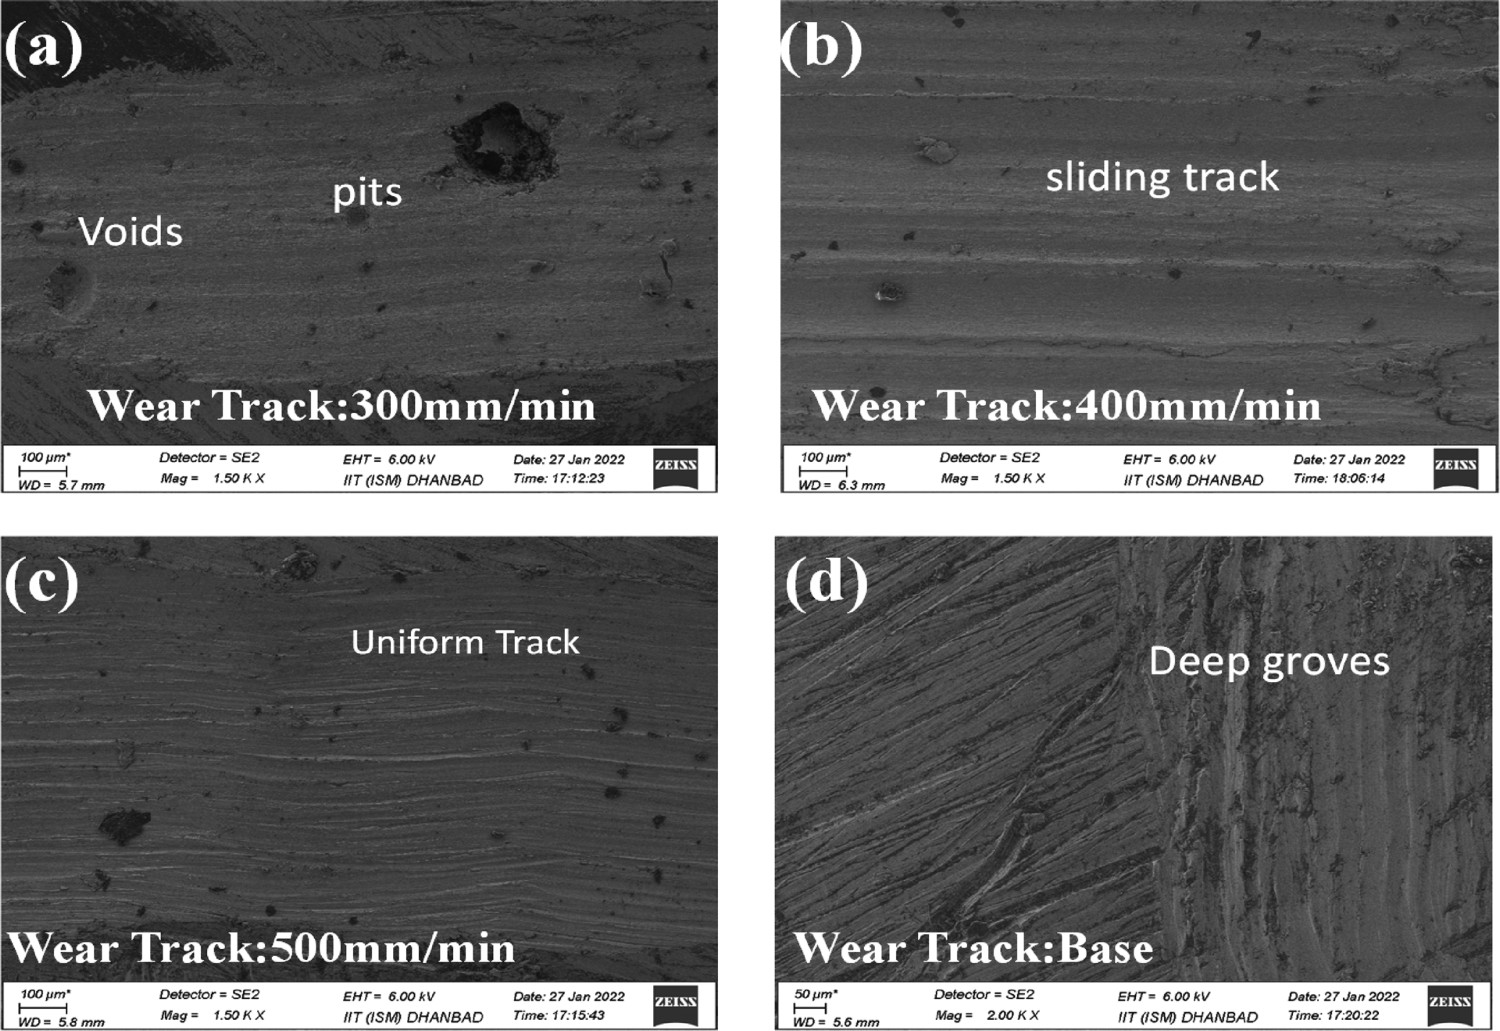
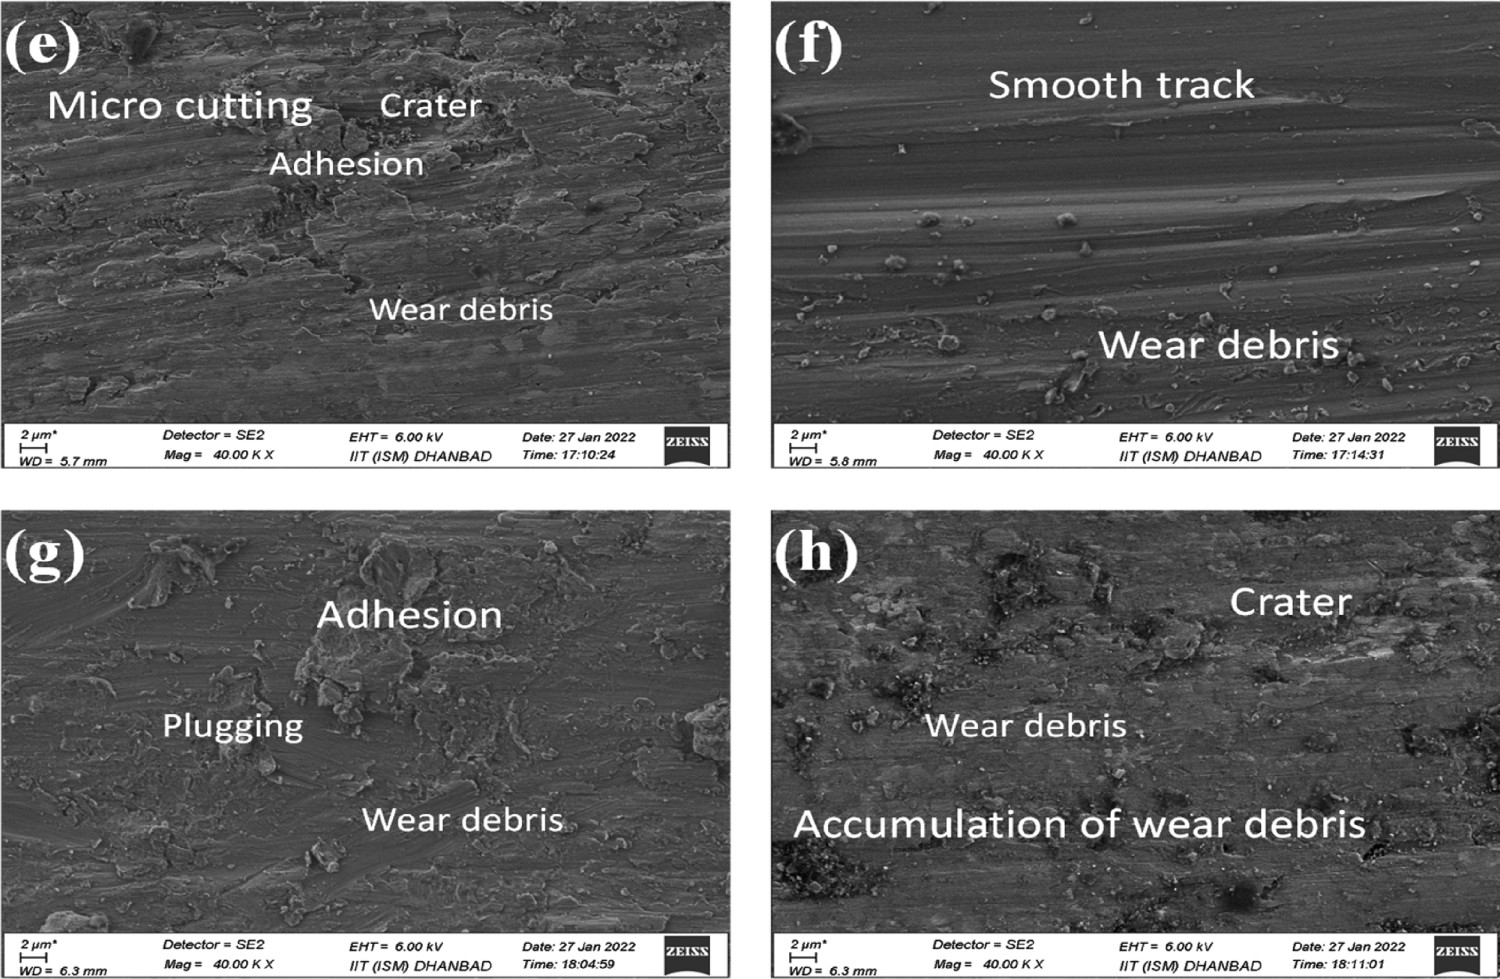
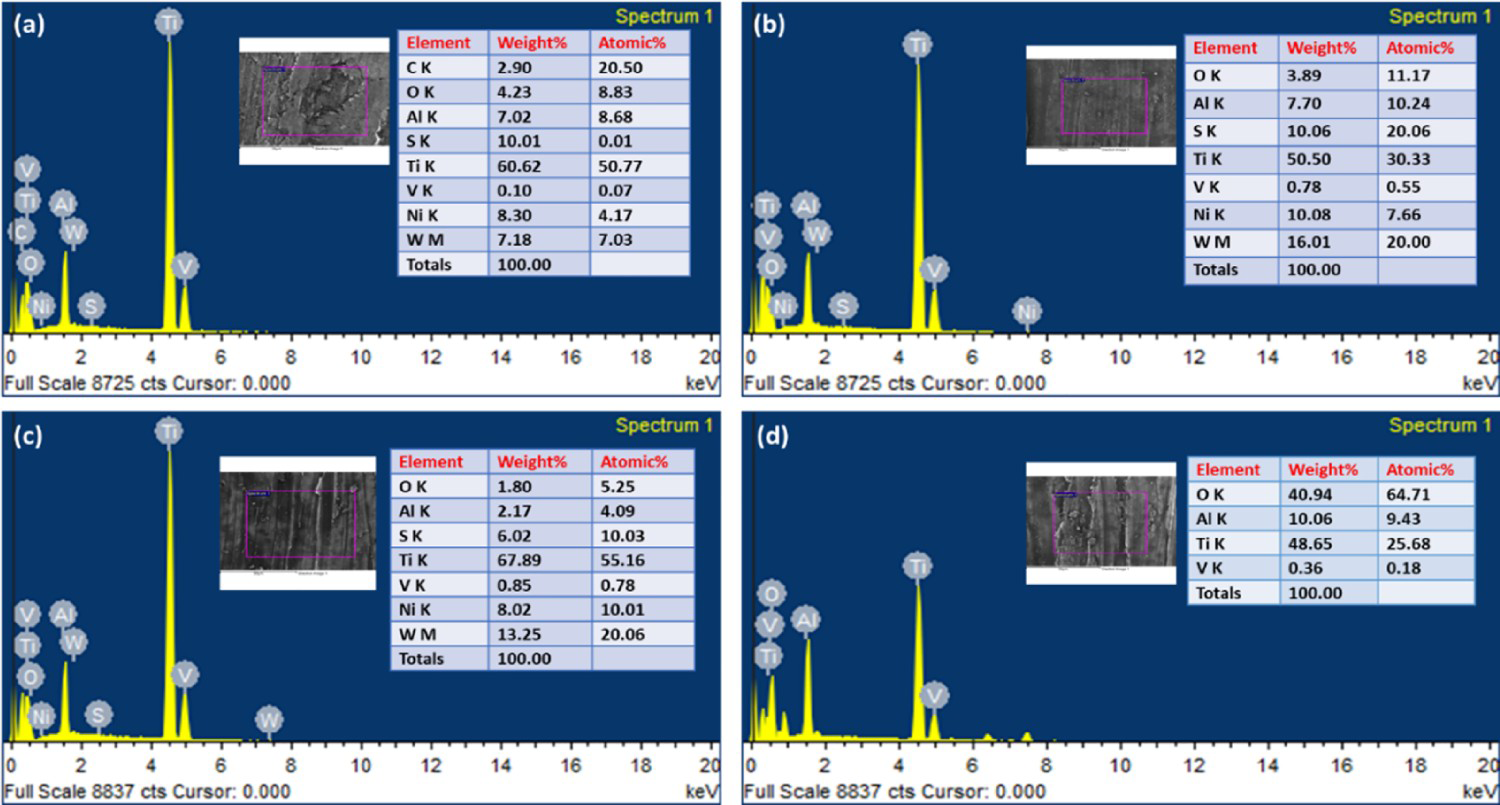
Figure 9(a–d) shows the 3D images of the wear track after reciprocating wear testing. It can be easily seen that the track width is maximum for the base material, and it has a smooth and minimum track width for the sample prepared with a scanning speed of 400 mm min−1. The corresponding wear depth and wear width of the various laser cladding samples are given in Figure 10. The wear track morphology (FESEM micrograph) of the laser cladding samples is given in Figure 11(a–d). In the given images, some voids and pits are seen for the sample with a scanning speed of 300 mm min−1, and deep grooves are observed in the substrate material. Whereas only sliding and uniform wear tracks are found in the cladding samples prepared with scanning speeds of 400 and 500 mm/min. Figure 12(e–h) shows the magnified FESEM micrograph of the wear tracks showing the mechanism of wear occurred. The primary damage phenomenon for the substrate is the accumulation of wear debris and the formation of small and big craters [30,31]. These aggregated debris results in the destruction of the surface of the parent material. Apart from the base material, the wear behaviour of the clad made by scanning speed of 300 mm min−1 mm min−1 contains micro-cutting, crater formation, adhesion to the surface, and wear debris accumulation which is non-desirable. The sample made through 500 mm min−1 of scanning speed has adhesion, plugging, and wear debris aggregation. The EDS spectra of the wear surface are shown in Figure 13 of samples S1, S2, and S3. The presence of S and W are confirmed in every track, which shows the lubricating characteristics of the clad. Oxygen is found in the track, which exhibits oxide formation in contact with the environment during the wear process. At a scanning speed of 400 mm min−1, the weight percentage of W (∼16%) and S (∼10%) are higher than the other cladding samples. This justifies the higher COF and wear resistance property of the cladding sample prepared with 400 mm min−1 laser scanning speed. Moreover, the coating with WS2, Ni, and Ti–6Al–4V made a lower COF because of their self-lubrication properties [30].
3D profile of the wear track (a) Sample S1, (b) Sample S2, (c) Sample S3, (d) Substrate. Wear track profile of the base material and coated samples. FESEM micrograph of wear track of (a) Sample S1, (b) Sample S2, (c) Sample S3, (d) Substrate. FESEM micrograph of wear track at high magnification showing wear mechanism for (a) Sample S1, (b) Sample S2, (c) Sample S3, (d) Substrate. EDS report of the wear track (a) 300 mm min−1 (S1), (b) 400 mm min−1 (S2), (c) 500 mm min−1 (S3), (d) base (Ti6Al4V) .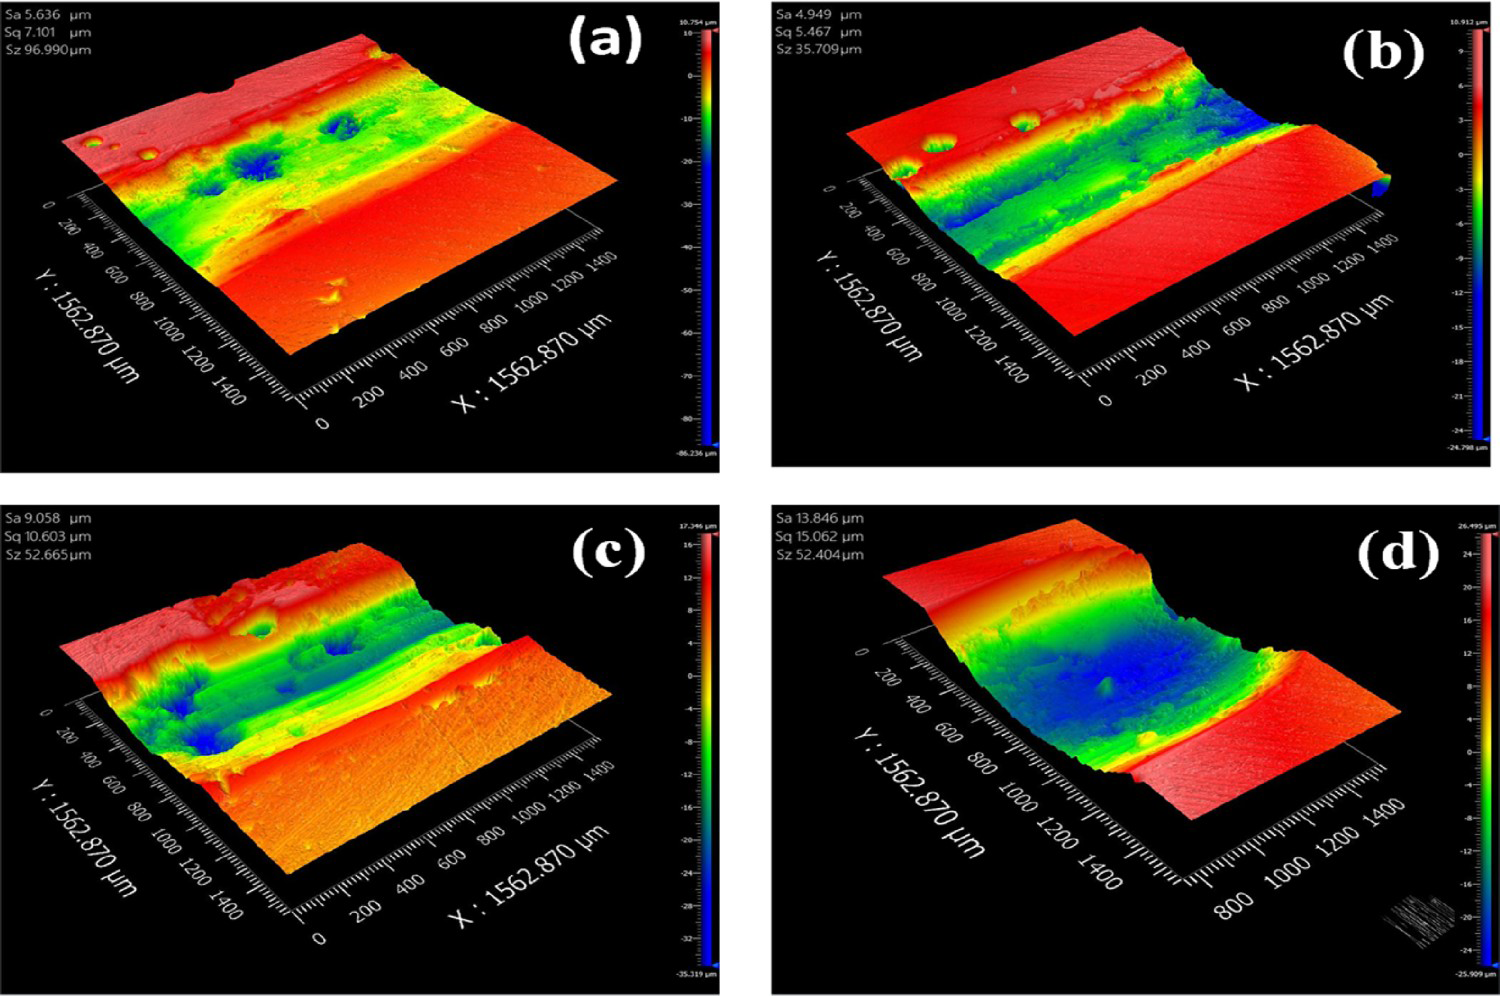
Conclusion
In the present research, the composite cladding of WS2, Ni, and Ti–6Al–4V over Ti–6Al–4V plate has been performed using laser processing technology at varying scanning speeds. The deposited coating obtained excellent anti-wear and self-lubricating properties besides higher hardness values. The conclusions of the work can be summarized as follows:
The composite cladding of WS2: Ni: Ti6Al4V was successfully fabricated by the laser cladding on titanium grade 5 alloy [Ti6Al4V]. The phases of TiS, TiNi, WS2, and AlS are present in all the cladding samples. The microstructure evolution is clearly observed in all the cladding samples where dendritic, white, and grey phase are present. Both the fine and coarse grain structures are found in the samples. However, a higher amount of fine grain structure is observed in the sample prepared with a laser scanning speed of 400 mm min−1. The intermetallic compounds like TiNi hard phase, WS2, TiS, and AlS solid lubricating phases are formed. These compounds play a crucial role in the fabrication of anti-wear and friction reduction cladding. The average micro-hardness of the cladding increases significantly. The highest hardness [∼1170 HV0.5] is achieved at 400 mm min−1 laser scanning speed. This is approximately four times the hardness of the base material [358 HV0.5]. The COF values of the cladding samples [∼0.48] are nearly half the base material's COF value [∼0.25]. The wear mechanism in the cladding samples is mainly adhesive. Therefore, the formation of the glaze layer is observed. Whereas mostly abrasive wear occurred in the base material, severe micro-cutting and plowing are noticed.
Footnotes
Disclosure statement
No potential conflict of interest was reported by the author(s).