
Abstract
A new kind of 3D material, reduced graphene oxide/ascorbic acid hydrogel (rGO/AAH), was used for the first time to recover the complex Au(CN)2− ion from aqueous solution. The as-prepared rGO/AAH was characterised by XRD, FT-IR, SEM and EDS. The experimental results indicate that the adsorption isotherm data of Au(CN)2− on rGO/AAH are well fitted by the Langmuir model, and the obtained maximum saturated adsorption capacity was up to 47.6 mg g−1. The adsorption kinetics was well described by the pseudo-second-order kinetic model, indicating that the overall rate of Au(CN)2− adsorption process is chemically controlled. In addition, the adsorption thermodynamics indicate that the adsorption process is spontaneous and exothermic. It is considered that the hexagonal rings of graphene in the rGO/AAH mainly contribute to the adsorption of the Au(CN)2− complex.
Introduction
Leaching of gold by cyanide is widely used in the minerals industry. The gold in ores is first dissolved by cyanide and transformed into complex ion Au(CN)2− in solution. Then, the Au(CN)2− complex is recovered via adsorption from the dilute metal solution. Activated carbon, resin and various adsorbents (Nakajima et al. 2003; Chang and Chen 2006; Lam et al. 2007; Tasdelen et al. 2009; Ok and Jeon 2014) have been used as adsorbents to recover the Au(CN)2−.
Graphene oxide (GO) is a new 2D carbon material and is the oxidised form of graphene. It is generally prepared by chemical oxidation of graphite resulting in extended graphene sheets decorated with epoxy and hydroxyl functional groups in the basal plane and carboxylic acid groups at the edge (Andre Mkhoyan et al. 2009). The oxygenous functional groups on GO make a significant contribution to its hydrophilicity and high negative charge density (Ramesha et al. 2011). GO is regarded as the most promising absorbent for various contaminants (Mishra and Ramaprabhu 2011; Zhao, Li, et al. 2011; Zhao, Ren, et al. 2011; Wang et al. 2013) due to its large theoretical specific surface area, surface hydrophobic π–π interaction, hydrophilicity, high negative charge density and the fact that it is easily synthesised on a large scale from natural graphite (Yang et al. 2012; Hu et al. 2013; Gu and Fein 2015). However, the high dispersibility of nano-sized GO makes it difficult to separate from water by conventional methods such as sedimentation, filtration and centrifugation. Thus, 3D graphene hydrogel has been developed to not only resolve the restacking problem of graphene sheets, but also facilitate the separation problem (Xu et al. 2010). Reduced graphene oxide/ascorbic acid hydrogel (rGO/AAH) is prepared by self-assembly of GO sheets with the assistance of ascorbic acid as bridging agent. In the process of synthesis, most oxygenous groups on rGO/AAH are reduced and the 2D sheets become 3D. Owing to the rich porous structure, residual oxygenous groups and large specific surface area, the structure of rGO/AAH is similar to activated carbon and, therefore, rGO/AAH may be a promising adsorbent for the Au(CN)2− complex. However, there has been no previous work investigating this.
In this work, the recovery of Au(CN)2− by adsorption using rGO/AAH was investigated. In particular, the as-prepared rGO/AAH was characterised by XRD, FT-IR, SEM and EDS and the adsorption behaviour of Au(CN)2− on rGO/AAH was explored by examining the adsorption kinetics, adsorption isotherm and adsorption thermodynamics.
Experimental
Reagents
Analytical grade potassium permanganate, 30% hydrogen peroxide aqueous solution, sodium nitrate and ascorbic acid were used. Reagent grade 98% sulphuric acid and 36% hydrochloric acid were used. Deionised water (18.25 MΩ cm) was employed in all the work.
Preparation of GrO and rGO/AAH
Natural flaky graphite with purity of >99% purity was used to prepare GrO using the Hummer's method (Hummers Jr and Offeman 1958). Next, the as-prepared GrO was dispersed in deionised water (2 mg mL−1) and stirred for 3 min by a mechanical stirrer to form a suspension. Then the GrO suspension was ultrasonically exfoliated using an ultrasonic processor (750 W and 20 kHz) with a 40% amplitude for 10 min to produce a GO suspension. Then, an amount of the GO solution was added to a flask and, after adding the desired amount of ascorbic acid (AA) into the GO suspension (GO:AA in the mass ratio of 1:1), the flask was placed in a water bath at 90°C for 5 h. Finally, the rGO/AAH was cooled to room temperature and washed with water four times at 2 h intervals to remove the residual ions then placed in a freezer dryer and dried to a constant mass.
Measurements
X-ray diffraction (XRD) patterns were obtained using an advanced diffractometer (D8, Bruker, Germany). Fourier transform infra-red (FT-IR) spectra were collected by Fourier transform infra-red spectrometer (Vector-22, Bruker, Germany). The microstructure and morphology of the rGO/AAH before and after adsorption were detected using a field-emission scanning electron microscope (FESEM) (S-4800, Hitachi, Japan) with an accelerating voltage of 15 kV, along with energy-dispersive X-ray spectroscopy (EDS). Atomic force microscope (AFM) images were acquired using a Bruker MultiMode 8 AFM with peak force tapping-mode.
Au(CN)2− adsorption
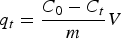
Au(CN)2− complex was used to prepare a 100 mg L−1 stock solution. The batch experiments of the adsorption of Au(CN)2− onto rGO/AAH were carried out in conical flasks which contained 20 mg of solid rGO/AAH. Fifty millilitres of solution was used for each experiment. After the solution was shaken thoroughly by a mechanical shaker at an agitation speed of 150 rev min−1 for a predetermined time, the broken-solid phase was separated from the solution using 0.22 μm membrane filter. The concentration of Au(CN)2− in the filtrate was determined using a Perkin–Elmer Analyst 700 atomic absorption spectrophotometer. The capacity of Au(CN)2− adsorbed onto the rGO/AAH was then calculated using the following equation:
Results and Discussion
Characterisation
Figure 1 shows XRD patterns of GrO and rGO/AAH. For GrO, a peak appeared at approximately 2θ = 10°, and the corresponding interlayer spacing was 0.88 nm. With respect to rGO/AAH, the peak shifted to 2θ = 25° and the corresponding interlayer spacing was 0.35 nm. This indicates that numerous oxygenous functional groups were removed during the formation of rGO/AAH. Figure 2 shows FT-IR spectra of GrO and rGO/AAH. For GrO, the peak at 3381 cm−1 represents −OH stretching vibration from hydroxyl group or water molecules. The peak located at 1726 cm−1 is ascribed to the stretching vibration of C = O, and the peaks at 1620, 1220 and 1051 cm−1 belong to the C = C, C–O–C and C–O stretching vibrations, respectively (Peng et al. 2016). With respect to rGO/AAH, the characteristic peaks are −OH stretching vibration from hydroxyl group or water molecules at 3395 cm−1, C = O stretching vibration at 1709 cm−1, C = C stretching vibration at 1559 cm−1, C–O–C and C–O stretching vibrations at 1180 and 1062 cm−1, respectively. In comparison, the intensities of all the peaks in rGO/AAH were lower than those in GrO, indicating that rGO/AAH was partially reduced in the preparation process.
XRD patterns of GrO and rGO/AAH. FT-IR spectra of GrO and rGO/AAH.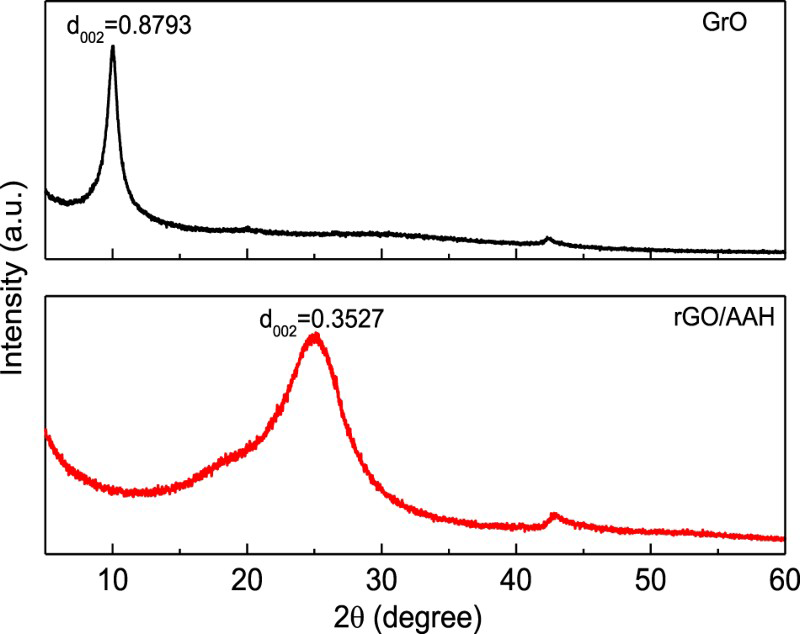
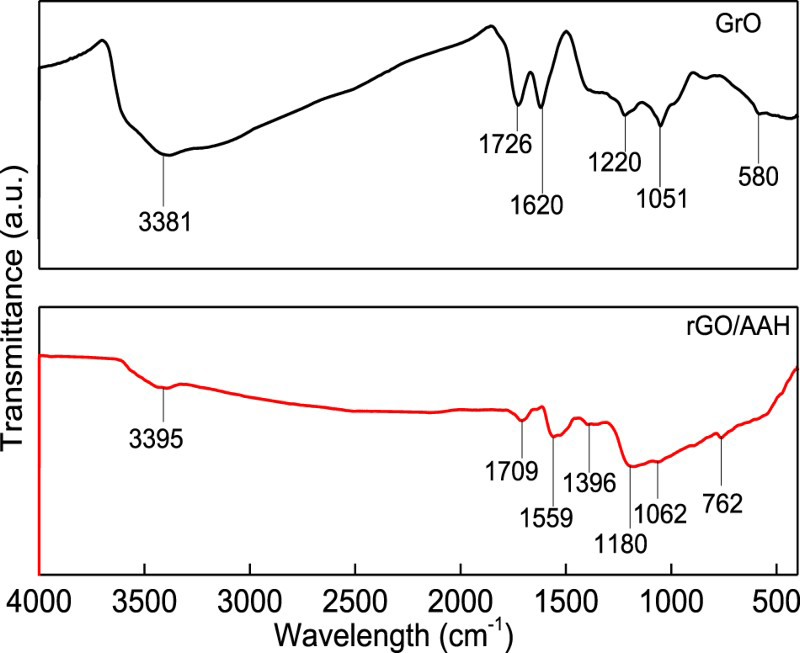
Figure 3 shows AFM images of GO, and digital and SEM images of rGO/AAH. It can be seen from Figure 3(a) that the sheets in the AFM images have almost in the same colour contrast, indicating that their thicknesses were nearly the same. The thickness of most sheets was about 1.0 nm, which is significantly greater than the theoretical thickness of graphene (0.335 nm) due to the presence of epoxy, carboxyl and hydroxyl groups on both sides of GO sheets (Schniepp et al. 2006; McAllister et al. 2007). Figure 3(b) shows that the rGO/AAH had a bulky columnar structure with numerous pores. As shown in Figure 3(c), the sheets of rGO were stacked randomly, leaving a lot of pores.
AFM images. (a) GO; (b) digital image of rGO/AAH; (c) SEM image of rGO/AAH.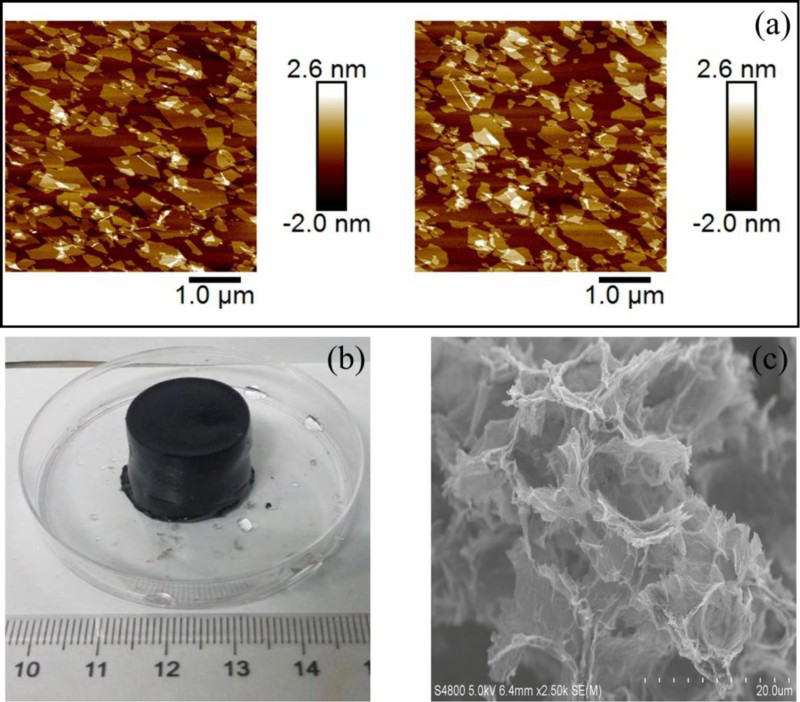
Adsorption isotherms
Adsorption isotherm can provide the most important parameters for designing a desired adsorption system. The Langmuir and Freundlich adsorption models were used to examine the solid–liquid adsorption system. The Langmuir (Equation (2)) and Freundlich (Equation (3)) isotherm equations are expressed as follows (Freundlich 1906; Langmuir 1918):
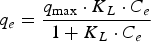
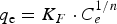
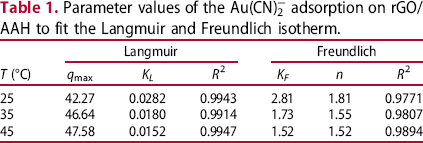
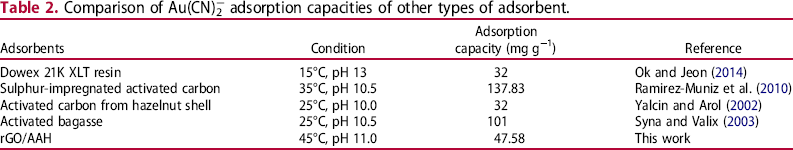
Figure 4 shows the adsorption isotherms of Au(CN)2− onto rGO/AAH at various temperatures and Table 1 lists the relevant calculated adsorption isothermal parameters. By comparing the values of the regression correlation coefficients (R2) in Table 1, it is apparent that the experimental data fits the Langmuir model better than the Freundlich model. It has been suggested that the adsorption sites on rGO/AAH are occupied by Au(CN)2− ions in the form of a monolayer and that all the sites on rGO/AAH surface have almost the same adsorption energy (Ramirez-Muñiz et al. 2012). The maximum adsorption capacities (qmax) of Au(CN)2− calculated from the Langmuir model are about 42.3, 46.6 and 47.6 mg g−1 at 25, 35 and 45°C, respectively. For comparison, the adsorption capacities of Au(CN)2− on other types of adsorbent are listed in Table 2. Though the adsorption capacity of Au(CN)2− on rGO/AAH is lower than those of modified activated carbons, it is better than those of resin and activated carbon prepared from plant matter. Greater improvement of adsorption capacity may be possible if modification of rGO could be performed. This requires further study.
Langmuir (a) and Freundlich (b) adsorption isotherms of Au(CN)2− onto rGO/AAH in aqueous solution. Parameter values of the Au(CN)2− adsorption on rGO/AAH to fit the Langmuir and Freundlich isotherm. Comparison of Au(CN)2− adsorption capacities of other types of adsorbent.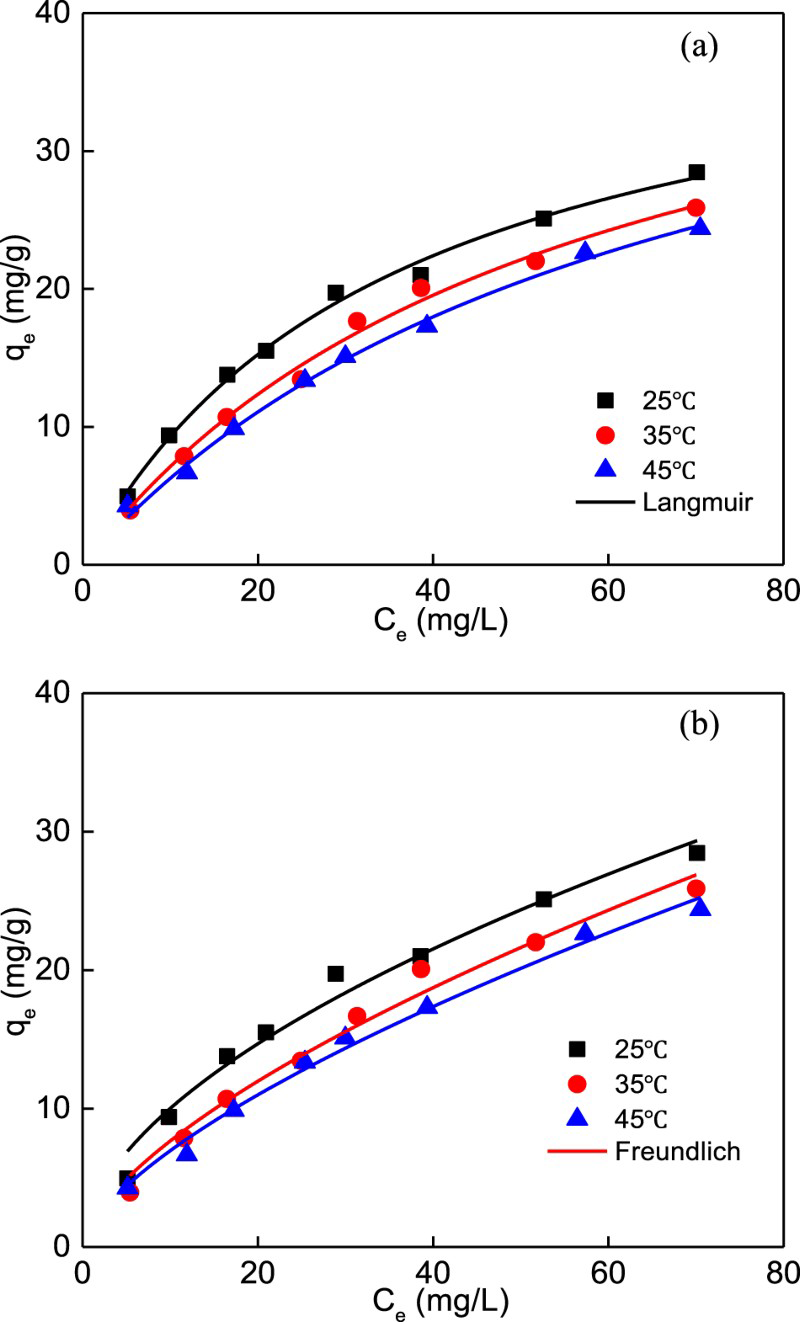
Adsorption kinetics
In order to explore the mechanism of adsorption, the pseudo-first-order (Equation (4)) and pseudo-second-order (Equation (5)) kinetic models were used, and the kinetic parameters of Au(CN)2− adsorbed on rGO/AAH were calculated. The equations of the kinetic models are expressed as (Bhattacharyya and Sharma 2005)

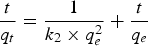
Plots of
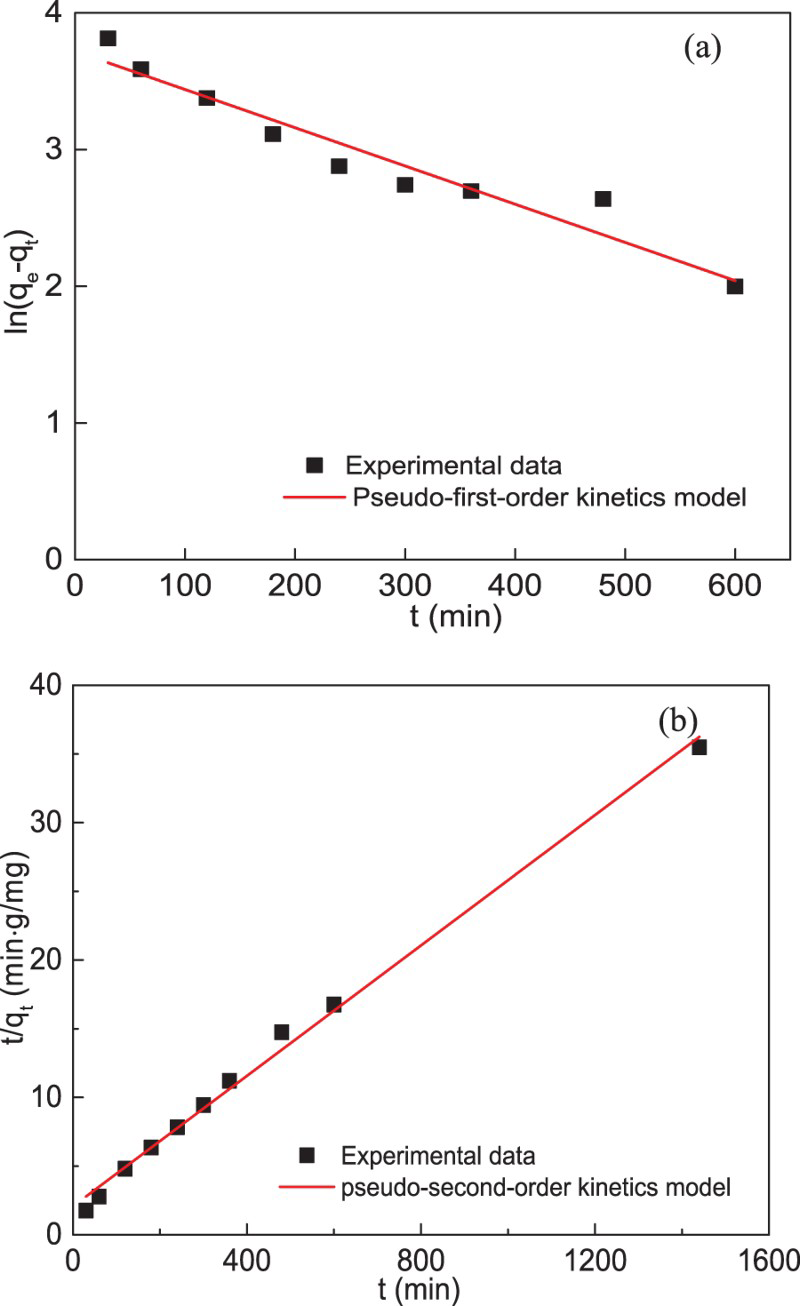
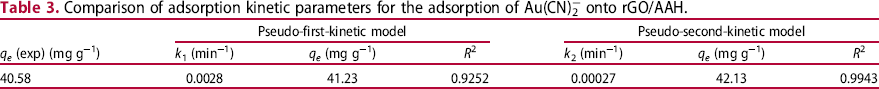
Pseudo-first-order (a) and pseudo-second-order (b) adsorption kinetics of Au(CN)2− in aqueous solution onto rGO/AAH. Comparison of adsorption kinetic parameters for the adsorption of Au(CN)2− onto rGO/AAH. versus time and t/qt versus time are shown in Figure 5(a, b), respectively. The relations are linear and values of the kinetic parameters obtained by the linear fitting are summarised in Table 3. The regression coefficients (R2) of the pseudo-first-order and pseudo-second-order models are 0.9252 and 0.9943, respectively, suggesting that the pseudo-first-order model is inapplicable. This indicates that the adsorption did not occur exclusively onto one site per ion (Nuhoglu and Malkoc 2009). According to the mechanism of second-order kinetic model, the overall rate of Au(CN)2− adsorption process is chemically controlled through sharing of electrons or covalent forces though exchange of electrons between Au(CN)2− and rGO/AAH (Ho 2000), as reported previously for absorption onto activated carbon (Ibrado and Fuerstenau 1992; Jia et al. 1998; Fleming et al. 2011).
Adsorption thermodynamics
The thermodynamic parameters Gibbs energy of adsorption (ΔG0), enthalpy of adsorption (ΔH0) and entropy of adsorption (ΔS0) can be calculated by the following equations, respectively.
Plot of ln kd versus 1/T for the adsorption of Au(CN)2− onto rGO/AAH in aqueous solution. Thermodynamic parameters for Au(CN)2− adsorbed by rGO/AAH.
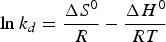


The values of energy ΔG0 vary from −15.267 to −15.788 kJ mol−1 at the three tested temperatures, indicating that the adsorption process is spontaneous. The negative value of ΔH0 indicates that the adsorption of Au(CN)2− onto rGO/AAH is exothermic. The positive value of ΔS0 represents the increase in the system's randomness due to the adsorption of Au(CN)2− ions (Wang et al. 2013).
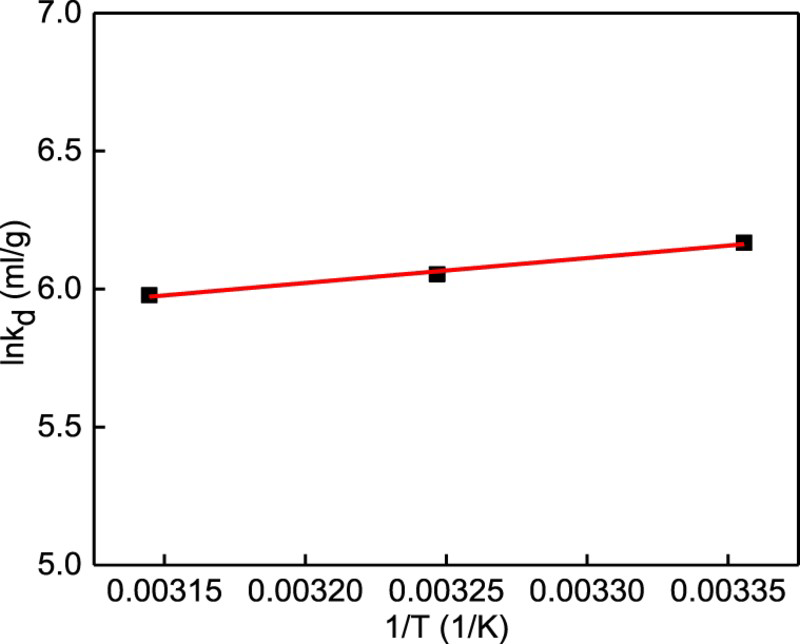
The density and distribution of the adsorbed Au(CN)2− ions on rGO/AAH were evaluated by quantitative energy-dispersive X-ray spectroscopy (EDS) mapping, and the results are shown in Figure 7. The Au was not only found to be homogeneously distributed over the whole surface but also appeared in the inside walls of the pores, indicating that the Au(CN)2− complex indeed adsorbed onto the rGO/AAH. Furthermore, the C, O and N were also uniformly distributed on the surface of rGO/AAH, and the Au was associated with N (Figure 7(b)), which indicates that Au(CN)2− was adsorbed on the surface of rGO/AAH in the form of a complex.
Quantitative EDS element mapping of (a) Au; (b) C, O, N and Au.
Conclusions
In this work, rGO/AA hydrogel was synthesised and characterised. The results indicate that the rGO/AAH had a porous structure, making it a promising adsorbent material. Compared with GrO, numerous oxygenous groups on rGO/AAH were removed during the process of hydrothermal reaction. The adsorption of Au(CN)2− onto rGO/AAH agreed well with the Langmuir isothermal and pseudo-second-order kinetic models, indicating the adsorption process was chemically controlled. The amount of Au(CN)2− adsorbed onto rGO/AAH reached 40.58 mg g−1. Thermodynamic calculations results indicate that the adsorption process is spontaneous and exothermic.
Footnotes
Disclosure statement
No potential conflict of interest was reported by the authors.