
Abstract
Low-cost superfine down particles (SDP) were evaluated as an adsorbent for the removal of acid brilliant scarlet 3R (ABS-3R) dye from aqueous solutions. Scanning electron microscopy, particle size distribution, Brunauer–Emmett–Teller specific surface area, X-ray diffraction, Fourier transform infrared spectroscopy, and amino-acid analysis were used to characterize the structural characteristics of the adsorbent material. The effects of adsorption process parameters, including initial pH, adsorbent dose, initial dye concentration, adsorption time, and temperature, were systematically studied in batch adsorption experiments. Further, adsorption equilibrium data were modeled by Langmuir, Freundlich, and Dubinin–Radushkevich isotherms. The adsorption process followed the Langmuir isotherm model and the maximum adsorption capacity was 158.23 mg/g at 318 K. Kinetic studies at different temperatures showed that the pseudo-second-order kinetic model fitted well in correlation to the experimental results in comparison to the pseudo-first-order model. The activation energy of the adsorption process was 59.52 kJ/mol, using the Arrhenius equation, which indicated the chemisorption nature of ABS-3R adsorption onto SDP. Thermodynamic study showed that adsorption of ABS-3R was a spontaneous and endothermic process. In summary, SDP was found to be an efficient and eco-friendly adsorbent, which might be suitable for the removal of dyes from aqueous solutions.
Synthetic dyes are widely used in a number of industries such as textiles, leather, paper, printing, food, cosmetics, paints, pigments, petroleum, solvents, rubber, plastics, pesticides, wood preserving chemicals, and pharmaceuticals. Consequently, large volumes of dyestuffs wastewater are generated every year.1,2 The discharge of such wastewater into the hydrosphere without proper treatment not only affects living organisms owing to its carcinogenicity, genotoxicity, mutagenicity, teratogenicity, and toxic nature, but also interferes with the transmission of sunlight into the hydrosphere, resulting in a reduction in the photosynthesis action. Most importantly, the hazardous effects of synthetic dyes may be passed on to future generations. 3 Therefore, the development of methods for the removal of dyes from the industrial wastewater is crucial.
Over the past few decades, many techniques, such as chemical oxidation,4–7 ion exchange, 8 coagulation/flocculation,9,10 electrochemical, 11 photochemical treatment,12–16 biodegradation,17,18 and adsorption,19–25 have been applied for the removal of dyes from industrial effluents. Among them, the adsorption process is considered to be one of the most efficient and economically viable treatment methods, owing to its simple design, ease of operation, low initial investment costs and energy consumption, insensitivity to toxic substances, and complete removal of pollutants even from dilute solutions. 19 However, a number of previously published studies have shown that many of the high-performance and high-efficiency adsorbents are expensive and difficult to regenerate. While industrial wastes and byproducts, such as luffa cylindrical, 26 teak leaves, 27 sewage sludge, 28 waste apricot, 29 rice husk, 30 orange peel,31,32 carbon nanotubes,33,34 activated carbon, 35 and de-oiled soya and bottom ash,36–39 have been used as cost-effective adsorbents for the removal of dyes, their adsorption capacities are limited. Therefore, new cost-effective, easily available, and high-performance adsorbents are still being investigated. Mittal et al. employed hen feathers as a biological adsorbent for the removal of brilliant yellow, amido black 10B, brilliant blue FCF, malachite green, and erythrosine from colored wastewater.40–44 Hen feathers act as an effective adsorbent for such a wide variety of dyes, owing to the large number of functional groups (carboxyl, hydroxyl, and amine groups) both on the backbone and side chains of the polypeptide molecules present in the hen feathers. 45 However, their low adsorption capacity has limited their practical commercial applications.
In the present study, we have prepared superfine down particles (SDP) from the down fibers of ducks, which are expected to have higher adsorption capabilities than hen feathers.
The aim of this work is to explore the possibility of utilizing SDP for the removal of acid brilliant scarlet 3R (ABS-3R) from aqueous solutions. To understand the mechanism of adsorption of ABS-3R onto the surface of SDP, equilibrium adsorption isotherms and kinetic processes were studied by using conventional theoretical methods.
Materials and methods
Materials
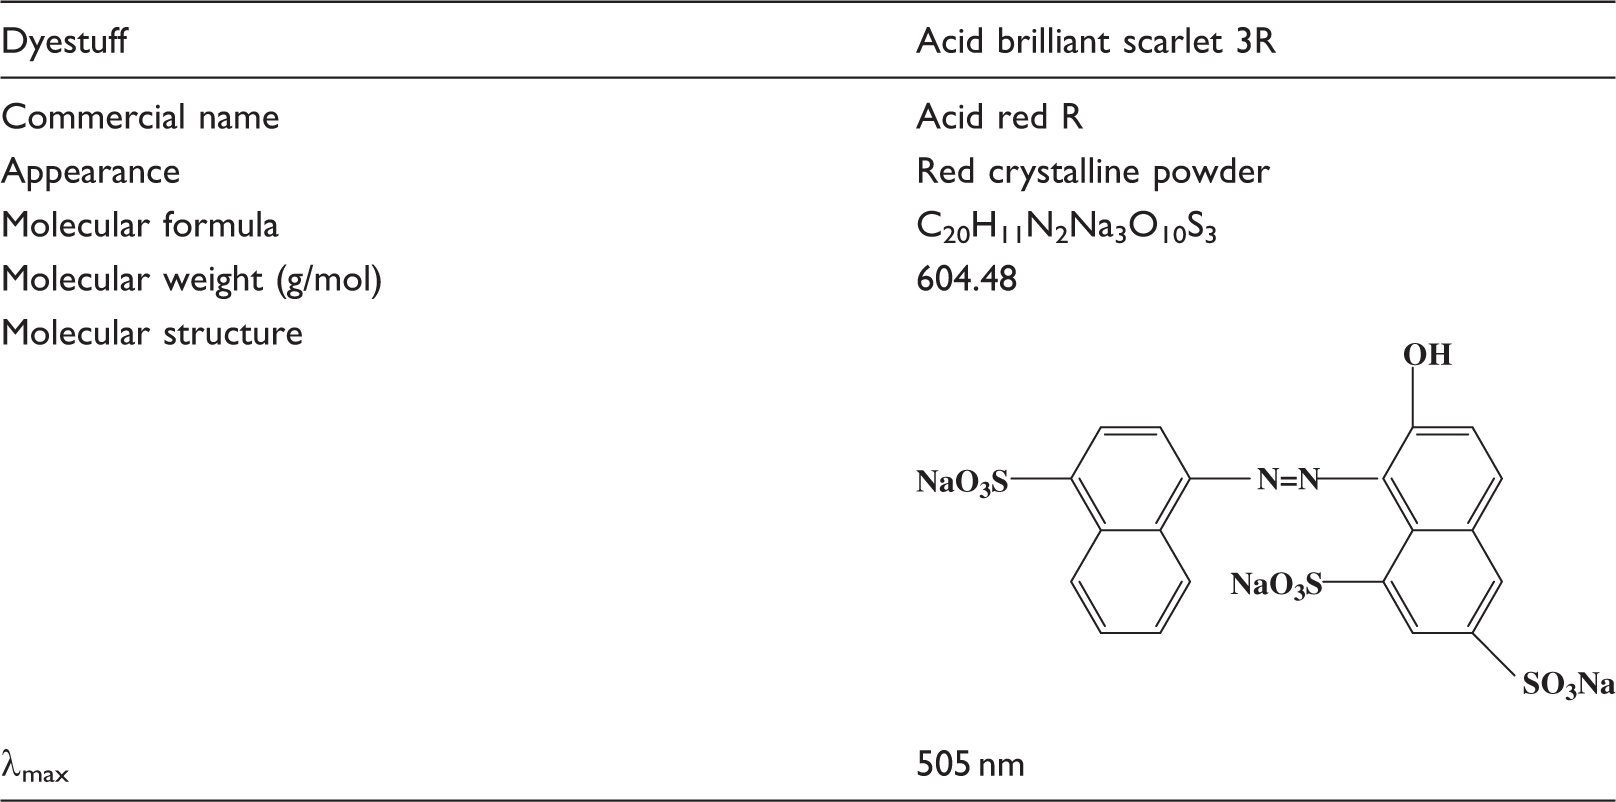
Details of the dye used in this study
Preparation of SDP
The SDP used as the adsorbent in this study were prepared from the down fibers of ducks by a four-step fabrication process. In the first step, the collected down fibers were washed thoroughly (3–4 times) with deionized water to remove any dirt and other granular impurities. In the second step, the washed fibers were cut into short pieces (about 3 mm in length each) with a rotary blade. In the third step, the fiber pieces were placed in 30% hydrogen peroxide solution (analytical reagent grade; Sinopharm Chemical Reagent Co., Ltd) at room temperature for 24 h. The soaked pieces were then washed with deionized water and dried at 383 K for 3 h. Finally, the fiber pieces were pulverized under the mechanical action using a machine developed previously. 46 The SDP thus prepared were stored in a closed bottle for use in the subsequent adsorption studies.
Characterization of SDP
The surface morphologies of the down fibers and SDP were observed by a scanning electron microscope (SEM; JSM5610LV and JSM7600F, JEOL Ltd, Japan) at an electron acceleration voltage of 25kV. Prior to scanning, the adsorbent was mounted on a stainless steel stab with double stick tape and coated with a thin layer of gold in a high vacuum condition. The particle size distribution of SDP was recorded by a laser particle analyzer (Malvern Corporation, England). The porous structures of SDP were determined by adsorption/desorption of nitrogen at 77K using a Micromeritics ASAP 2020 analyzer (Mike Corporation, USA). X-ray diffraction (XRD) analysis of the SDP was carried out using a Miniflex XRD spectrometer with a Cu Kα radiation source at 30 kV and 15 mA; diffraction angles ranged from 5° to 60° with a scan speed of 5°/min. Fourier transform infrared (FTIR) spectra were recorded using a Nicolet 5700 FTIR spectrometer (Thermo Nicolet Corporation, United States) in the wavenumber range 4000–400 cm−1 at ambient conditions. Amino-acid analysis was carried out with a Hitachi 835-50 amino-acid analyzer at CCTCC (China Centre for Type Culture Collection).
Adsorption studies
All of the adsorption experiments were conducted in the batch mode. The effects of various factors such as pH, adsorbent dosage, initial dye concentration and contact time on the adsorption characteristics of the down-fiber particles were evaluated. The experiments were conducted in 50 mL conical flasks with 25 mL of working volume. The flasks were agitated at a constant speed of 200 r/min in a SHZ-82 isothermal water-bath shaker. The pH values of the solutions were adjusted using 0.1 mol/L HCl or NaOH and the adsorption experiments were carried out at temperatures of 298, 308, and 318 K.
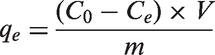
The supernatant liquid was separated from the solution by centrifugation at 12,000 r/min for 10 min at predetermined time intervals. The residual dye concentrations in the supernatant liquid sample were determined using a UV/visible spectrophotometer (Shimadzu, UV-2550) by measuring the absorbance at a wavelength of 505 nm. The dye removal percentage (%) was calculated using the following equation:

In order to ensure the reproducibility of results, all the experiments were conducted three times and the average values were used in data analysis.
Results and discussion
Characterization of the SDP
The morphologies and structures of down fibers and SDP are presented in Figure 1.
SEM image of down fiber (a, b), photograph of SDP (c), and SEM image of SDP (d).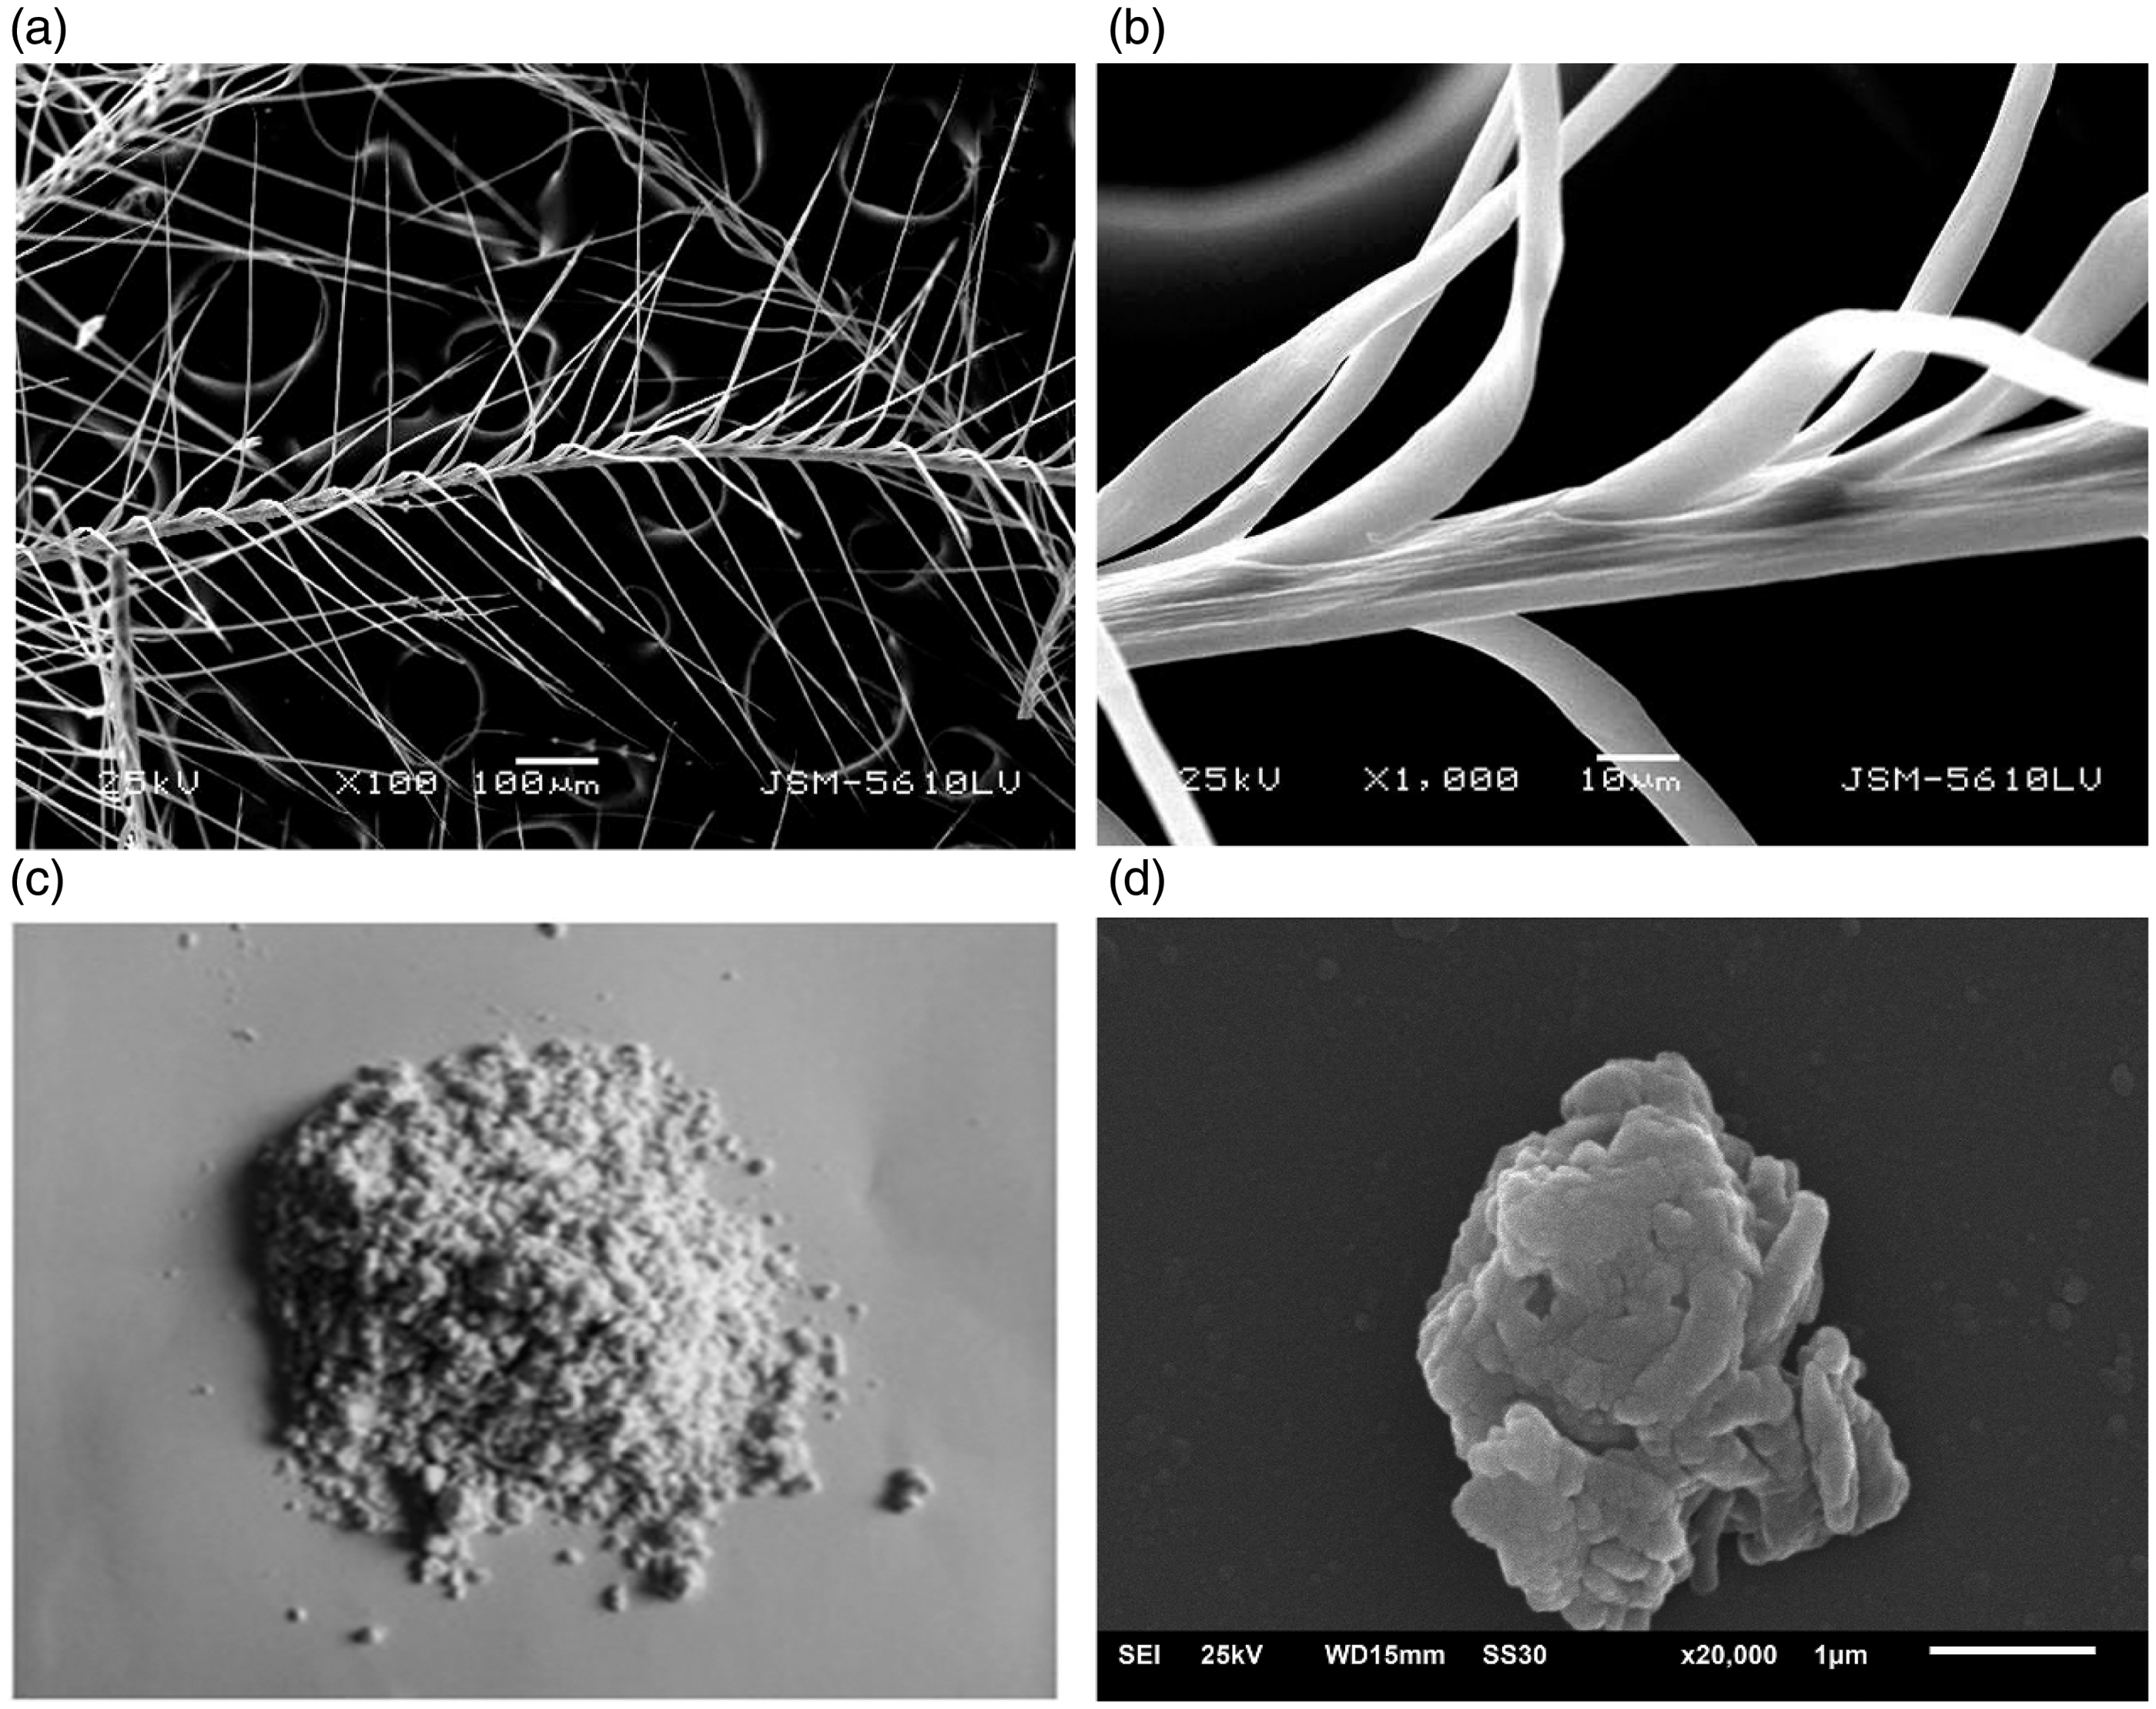
It can be seen that down feathers are highly ordered, hierarchical branched structures, which contain short or vestigial rachis (shaft), few barbs, and barbules that lack hooks (Figure 1(a) and (b)). Meanwhile, we noted that the SDP exhibit a white color just like that of natural down fiber (Figure 1c), which suggests that the native properties of down fiber was not damaged and preserved well during the manufacturing process. Figure 1(d) shows that SDP are an irregular sphere; the surface of SDP is very rough and has many pores, which could provide a large exposed surface area for the adsorption of dyes.
The particle size distribution and parameters related to pore structure of the SDP are presented in Figure 2.
The particle size distribution and pore structures parameters of SDP.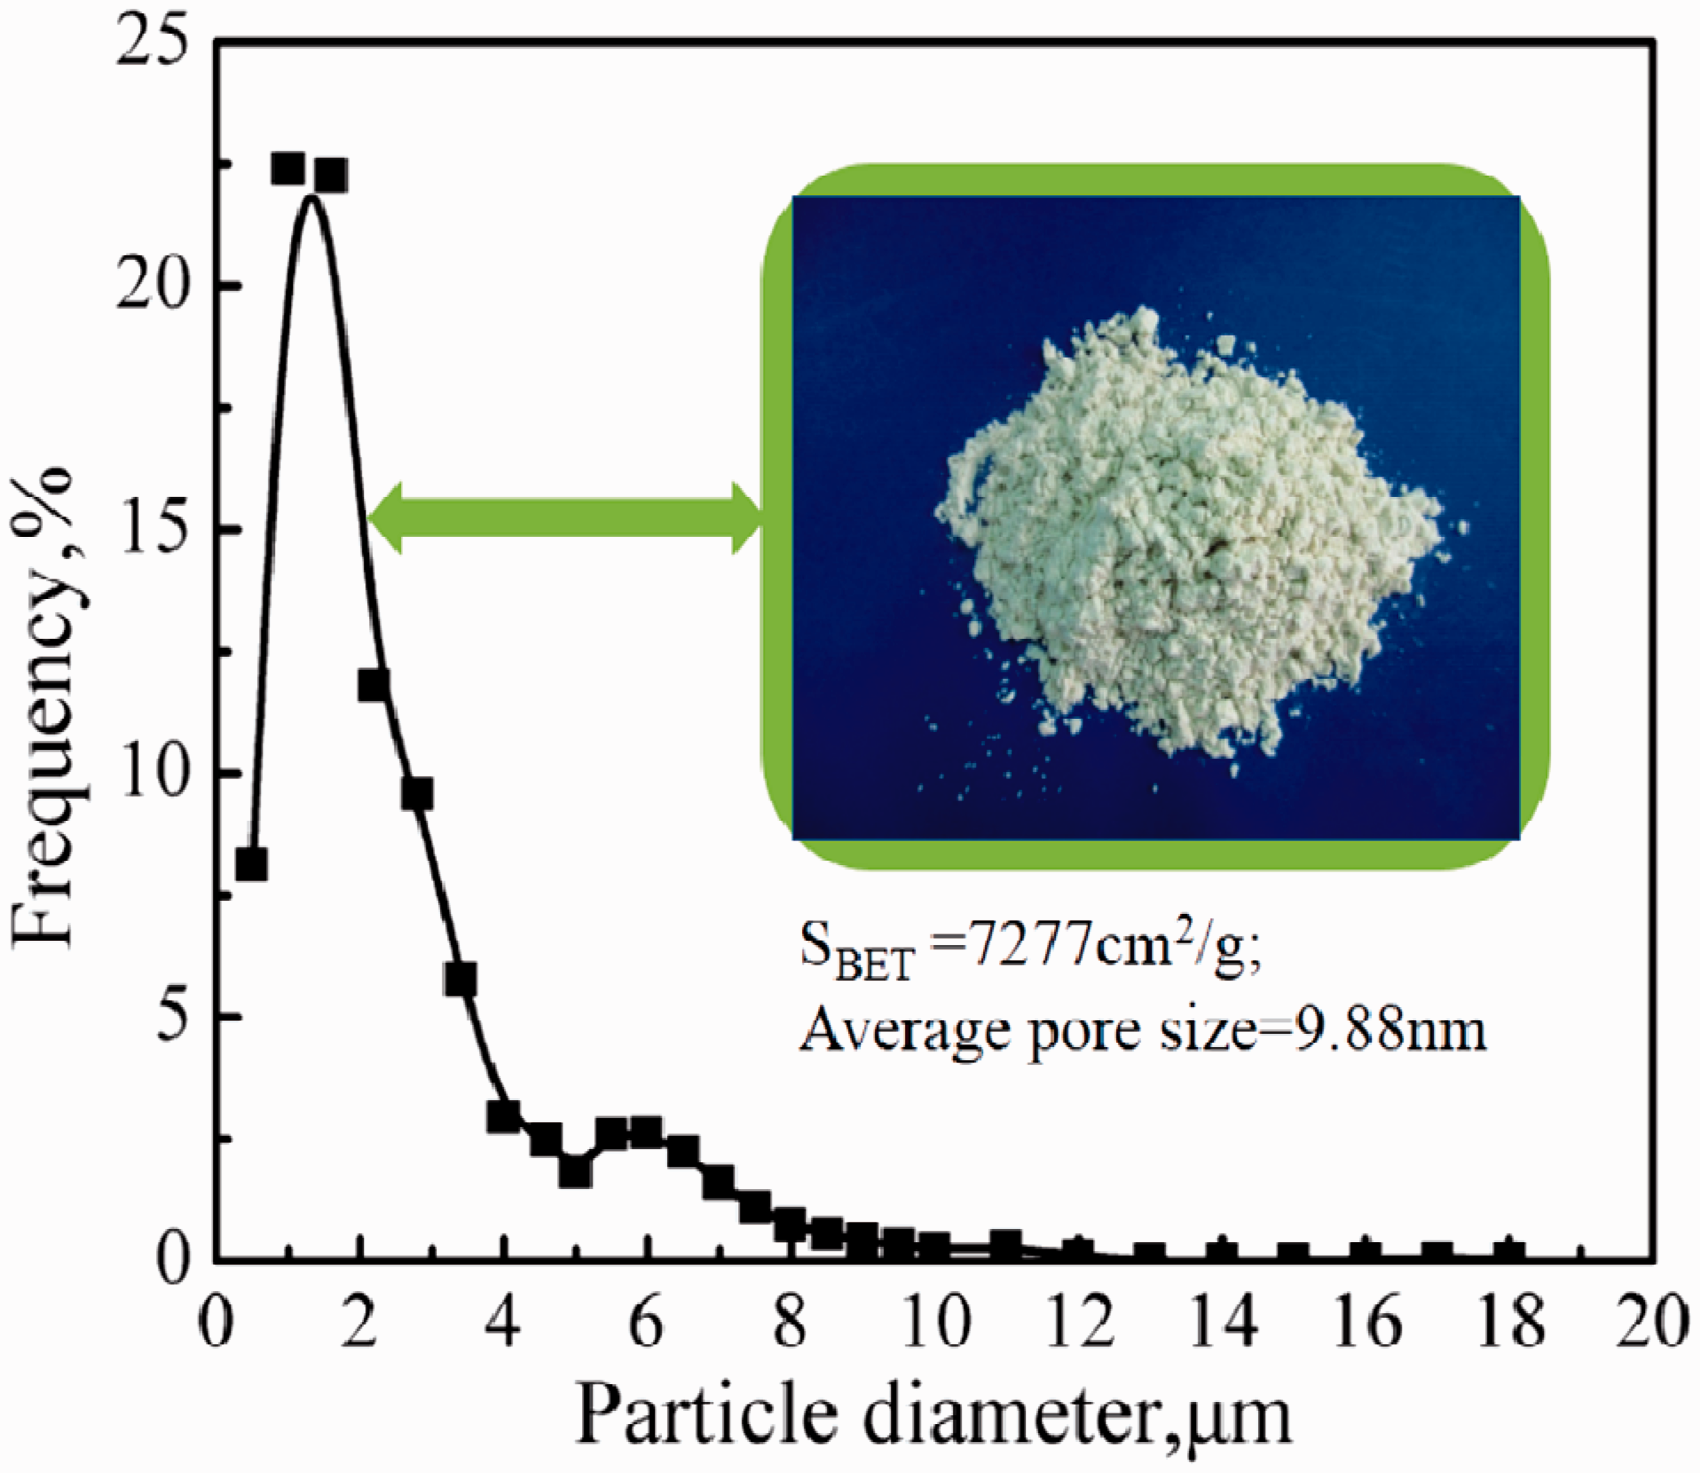
The particle size of the SDP was found to be in the narrow range of 0.2–18 μm, with 80% of the particles being smaller than 4 μm. The average particle size was around 2.34 ± 0.26 μm, which agreed well with the results obtained by the SEM image (Figure 1). Furthermore, the Brunauer–Emmett–Teller (BET) specific surface area of SDP and the average pore size from the N2 adsorption/desorption isotherms were determined to be 0.7277 m2/g and 9.88 nm, respectively, which suggests that SDP comprise a mesoporous adsorbent material.
To investigate the crystalline nature and the functional groups present on the surface of SDP, XRD and FTIR measurements were carried out and the results are as shown in Figure 3.
XRD pattern (a) and FTIR spectrum (b) of SDP.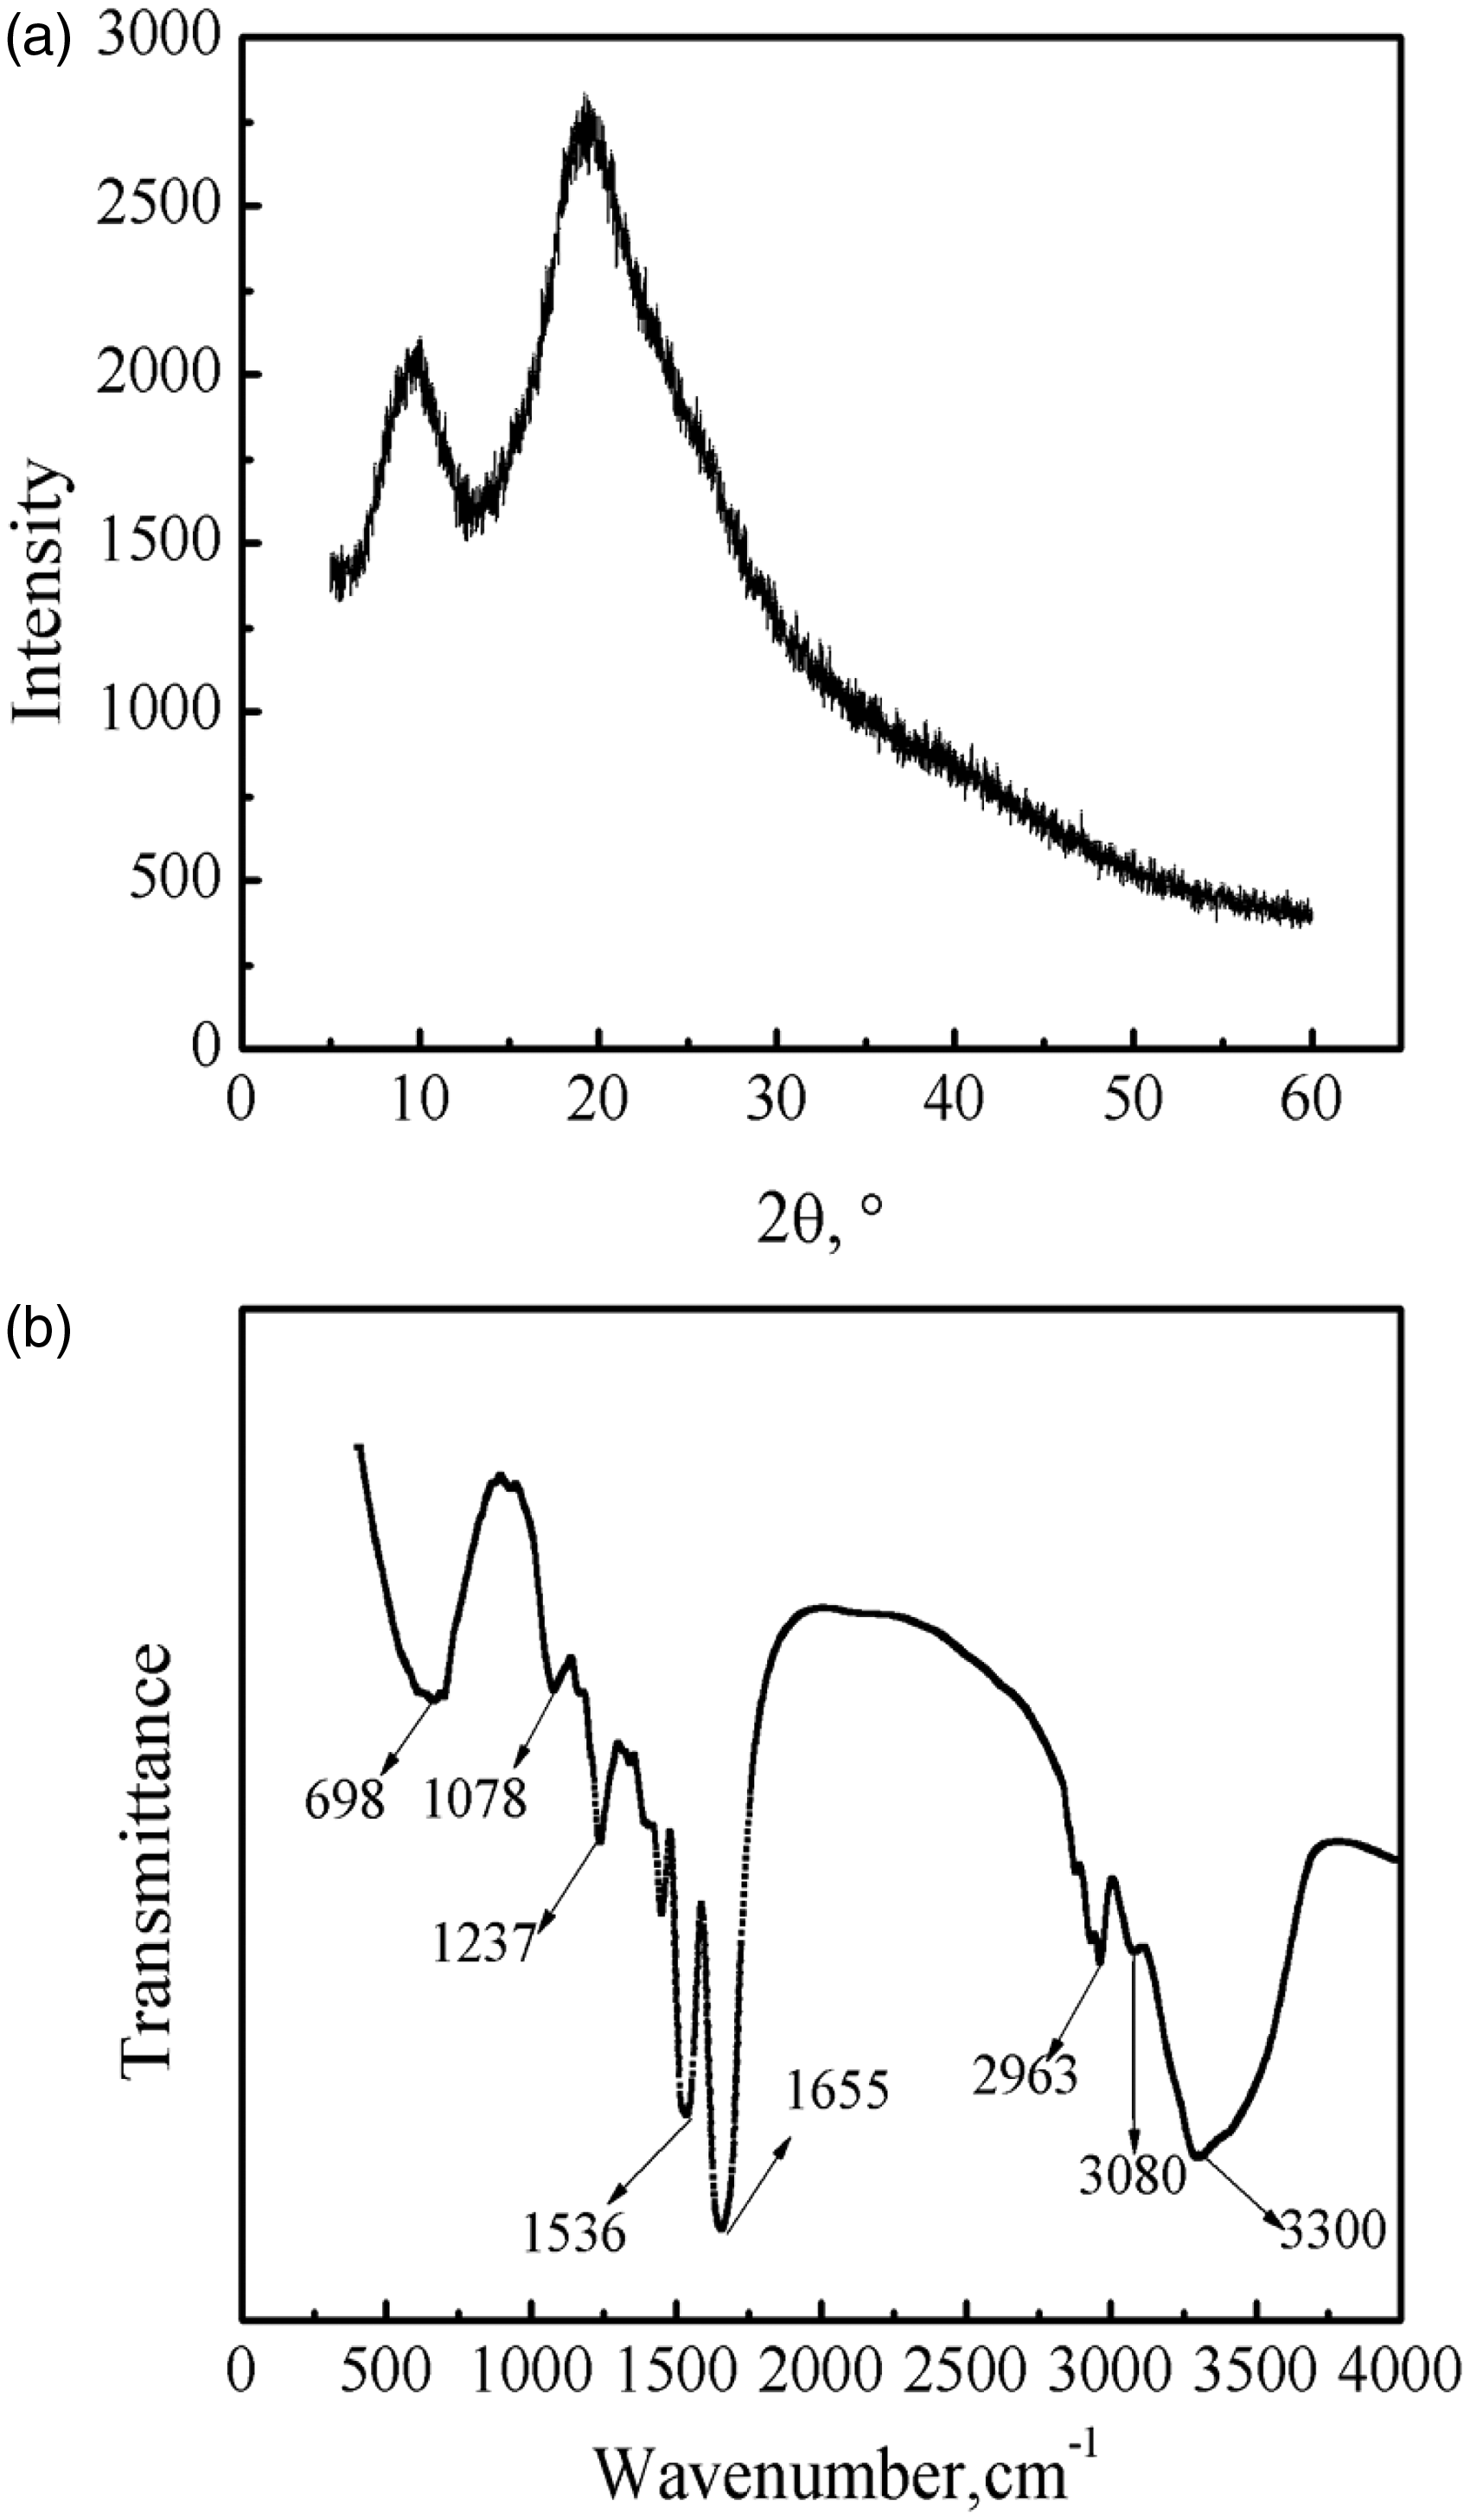
The chemical composition of SDP
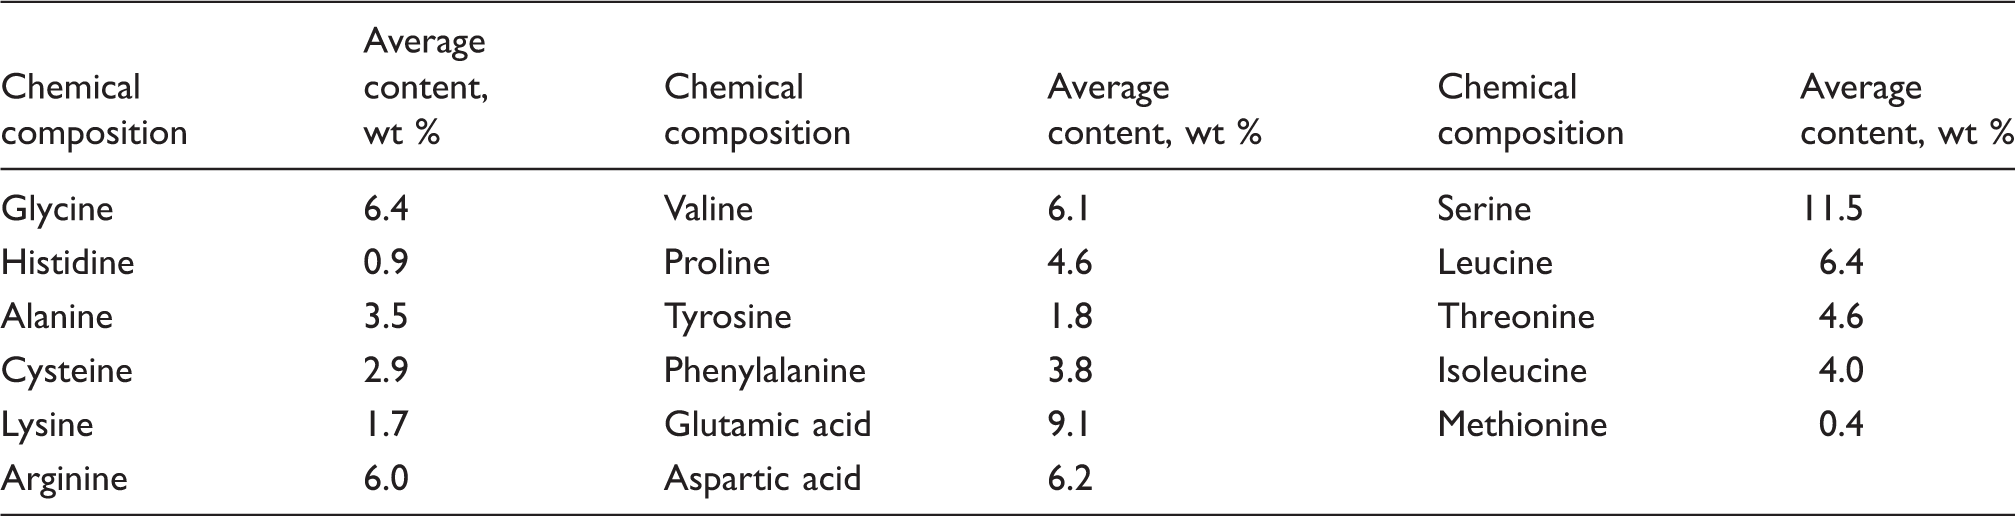
As can be seen from Table 2, SDP contains almost all the amino acids that are present in plants and animal bodies; the proportion of basic amino acids accounted for 51.19% of total amino acids, which provide a potential possibility for the adsorption of dyes.
Effect of various operating parameters on adsorption
The adsorbent dose, pH, initial dye concentration, and contact time are very important factors that can affect the dye adsorption process. Figure 4(a) shows the effect of the initial solution pH on the dye removal percentage by the adsorption of ABS-3R onto SDP. It can be seen that the adsorption of ABS-3R was strongly dependent on pH in the range 2.0–5.0, as is evident from the sharp decline in the dye removal percentage with an increase in pH from 2.0 to 5.0. On the other hand, the dye removal percentage was independent of pH in the range 5.0–10.0. In the range of pH values studied, the maximum dye removal percentage of 98.52% was achieved at a pH of 2.0. Hence, the optimal pH for the adsorption of ABS-3R on SDP was determined to be 2.0 and this value was used in subsequent studies. The higher adsorption of the ABS-3R at lower pH may be due to enhanced protonation by neutralization of negative charge at the surface of the SDP. This helps in the preferential adsorption of the dye over active sites and facilitates the diffusion process in the working solution.
42
Effect of different operating parameters on adsorption of the ABS-3R onto SDP at different temperatures. (a) pH (experimental conditions: C0, ABS-3R: 500 mg/L; adsorbent dose: 5 g/L; adsorption time: 6 h; temperature: 298 K; agitation speed: 200 r/min). (b) Adsorbent dose (experimental conditions: C0, ABS-3R: 500 mg/L; pH: 2; adsorption time: 6 h; agitation speed: 200 r/min). (c) Initial dye concentration (experimental conditions: pH: 2; adsorbent dose: 5 g/L; adsorption time: 6 h; agitation speed: 200 r/min). (d) Adsorption time (experimental conditions: C0, ABS-3R: 600 mg/L; pH: 2; adsorbent dose: 5 g/L; agitation speed: 200 r/min).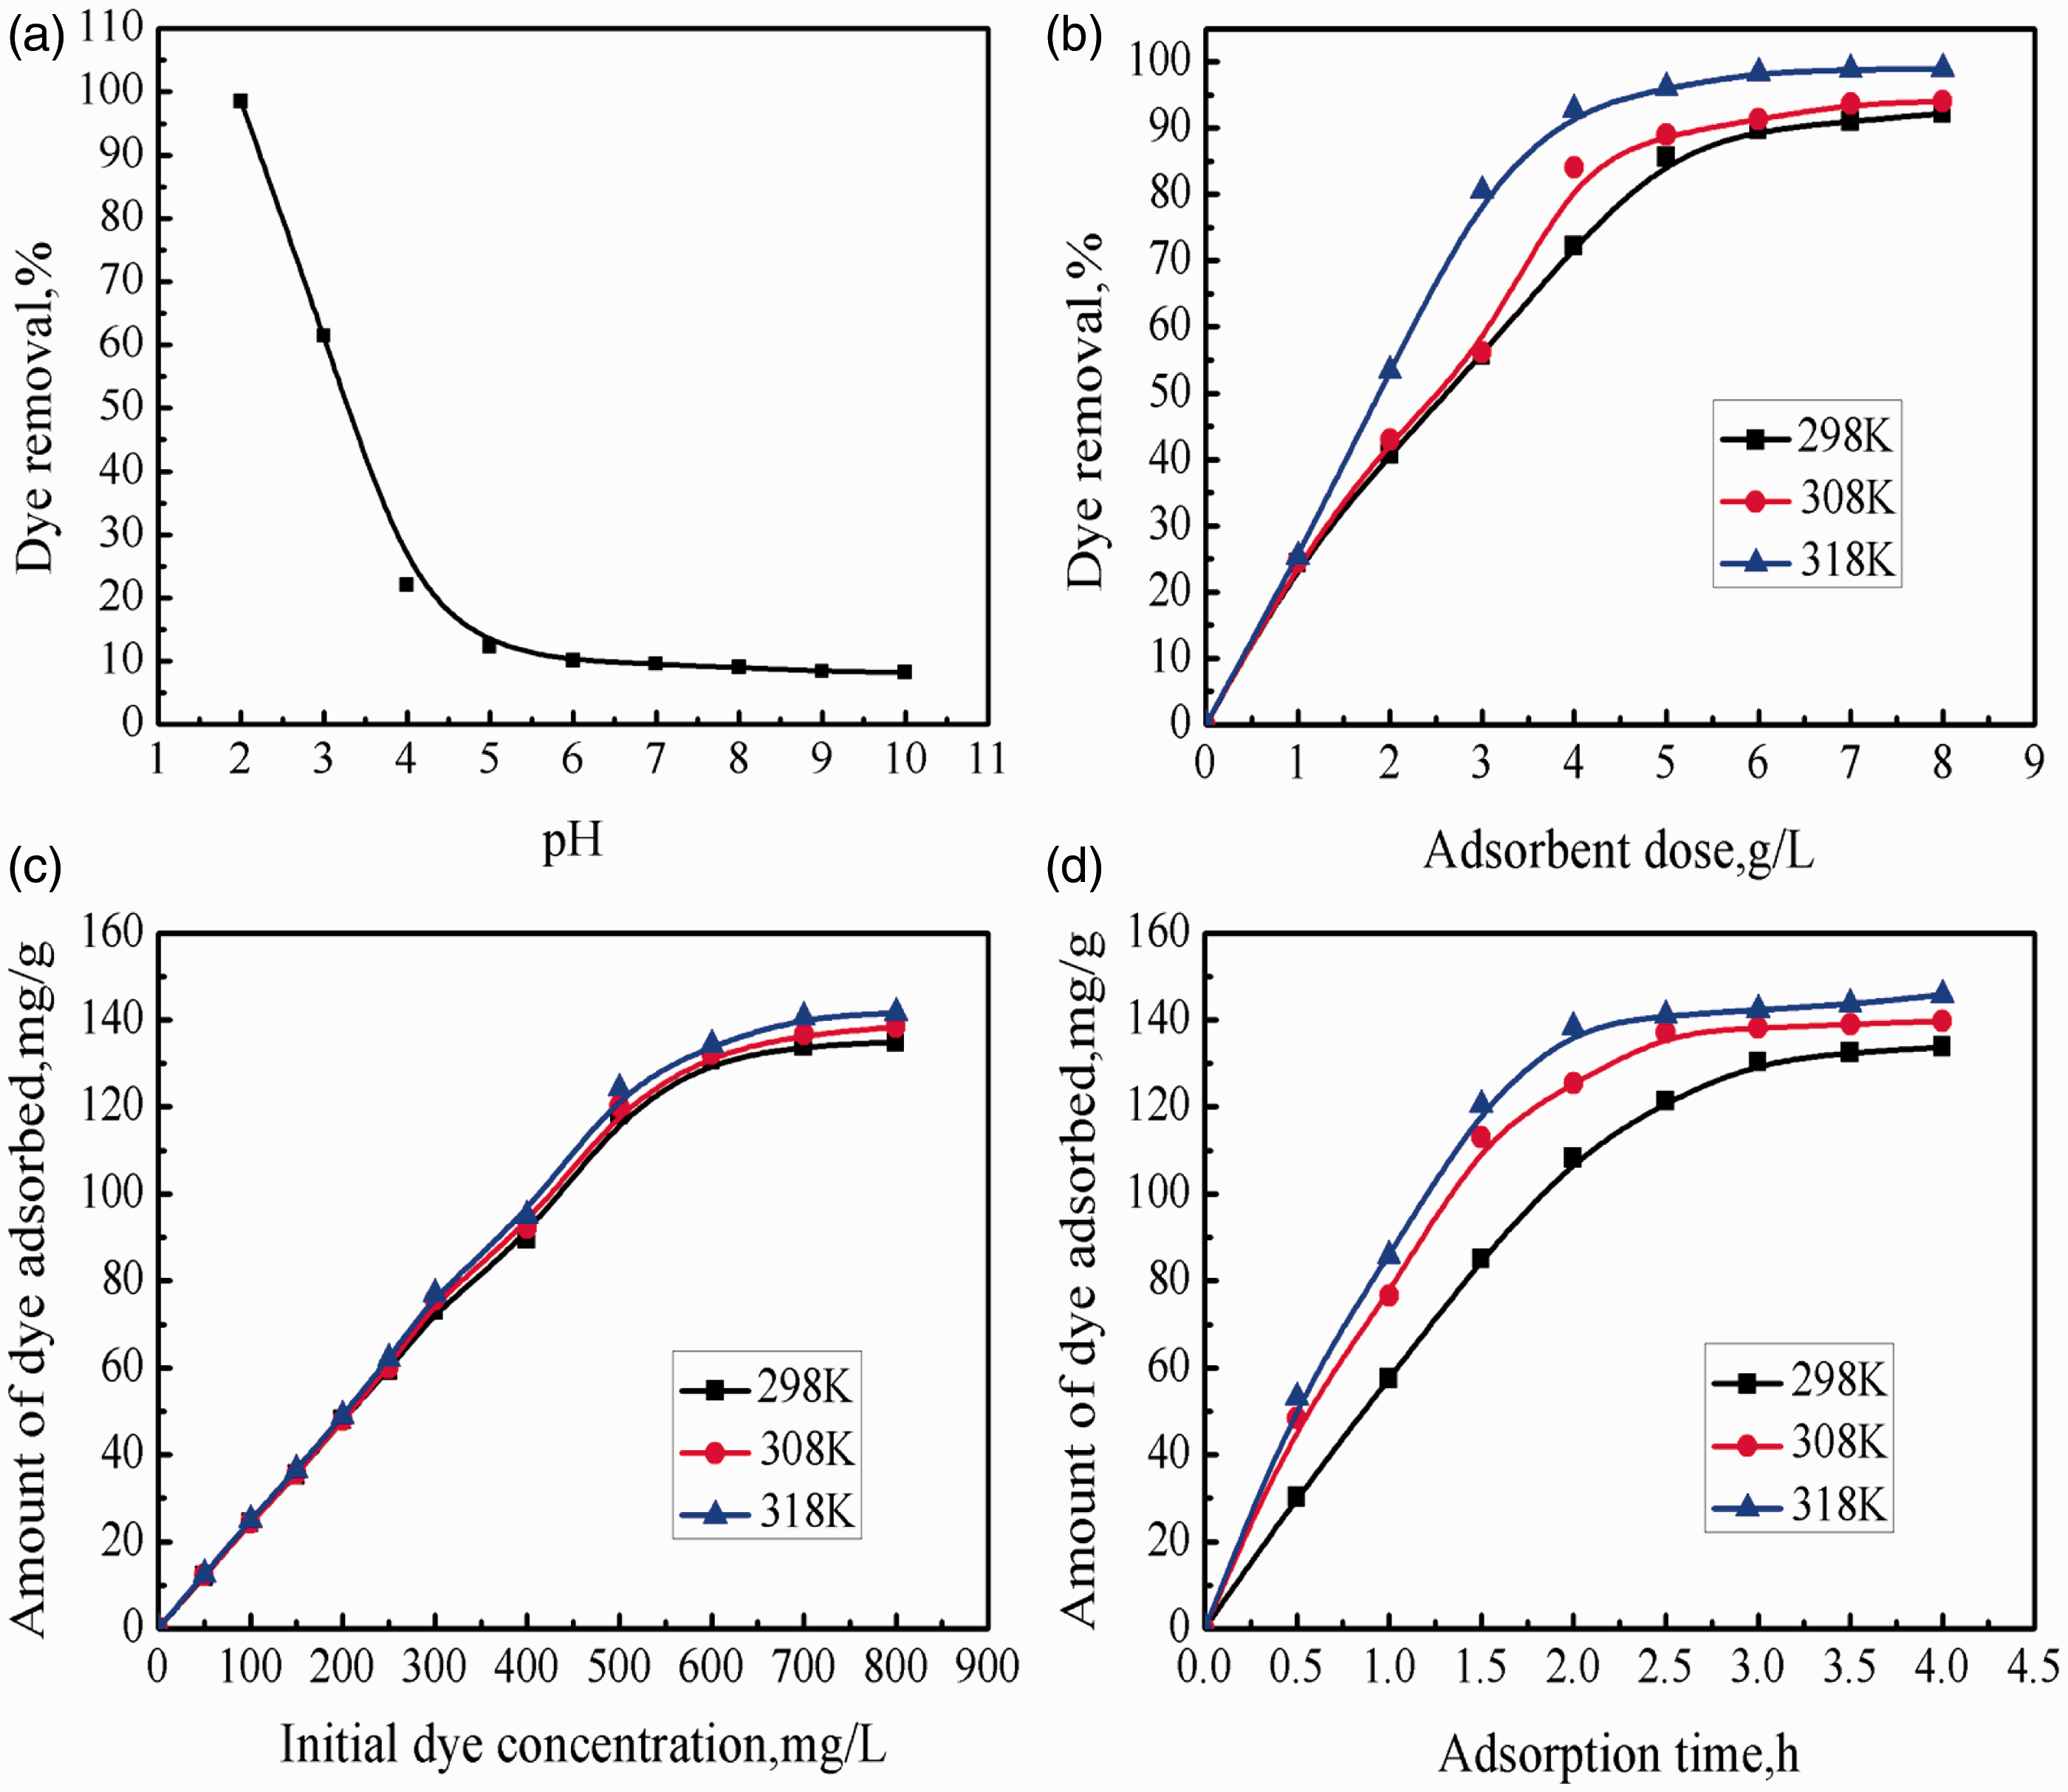
Figure 4(b) shows the effect of adsorbent dose on the adsorption of ABS-3R onto SDP. The dye removal percentage was found to increase with an increase in the adsorbent dose, which could be attributed to the increase in the surface area of the adsorbent and greater availability of adsorption sites. Maximum dye removal percentage was observed at an adsorbent dose of 5 g/L. Further increase in the adsorbent dose did not significantly change the adsorption yield, which might be due to the binding of almost all of the dye molecules to the adsorbent surface and the establishment of adsorption equilibrium in the solution. 49 Therefore, the optimal adsorbent dosage of 5 g/L was used in the subsequent studies.
Dye adsorption experiments with initial dye concentrations of 100–800 mg/L were carried out at 298, 308, and 318 K. As shown in Figure 4(c), the amount of dye adsorbed on SDP increased with an increase in the initial dye concentration, since the initial dye concentration provides the driving force required to overcome the resistances for the mass transfer of the dye molecules between the adsorbent and adsorption medium, until the adsorbent is saturated. 50 In contrast, once the adsorbent surface is saturated above a certain dye concentration, the adsorption of the dye leveled off, owing to the limited availability of active sites. In addition, when the concentration of the dye in the solution was high and, the active sites of the adsorbent were surrounded by a large number of dye molecules, the adsorption phenomenon occurred more efficiently. Consequently, the value of q e increased with an increase in the initial dye concentration. 51 Meanwhile, the adsorption of ABS-3R onto SDP was also found to increase with an increase in temperature, indicating that the adsorption process was endothermic in nature. The effect of adsorption time on adsorption of the ABS-3R onto SDP at different temperatures is presented in Figure 4(d). The amount of dye adsorbed per unit mass of SDP increased sharply with an increase in the adsorption time and temperature. Rapid adsorption in the initial stages was probably due to the availability of a large number of vacant sites at the beginning of the process as well as the large concentration gradient in the solution. However, the rate of adsorption decreased slowly with increasing time until equilibrium was reached, owing to the limited mass transfer of the dye molecules from the bulk solution to the surface of the adsorbent, and a subsequent slower internal mass transfer within the adsorbent. The equilibrium time for maximum dye adsorption capacity is 3 h at 298 K, whereas it was achieved at 2 h at a temperature of 318 K. After this equilibrium period, the amount of dye adsorbed does not show time-dependent change.
Adsorption isotherms
Adsorption isotherms describe the equilibrium relationship between the adsorbate concentration in the solution and on the surface of the adsorbent under given conditions. They form the thermodynamic basis for the adsorption separation processes and determine the extent to which a material can be adsorbed onto a particular surface under specific conditions. In order to optimize the design of an adsorption system for the adsorption of dye, it is necessary to establish the most appropriate correlations for the equilibrium curves. Figure 5 illustrates the ABS-3R adsorption isotherms on SDP. The adsorption capacity of ABS-3R on SDP exhibited a sharply increase-firstly, and then reached a plateau with an increase in the equilibrium concentration of dye solutions.
The adsorption isotherms of SDP in the temperature range 298–318 K.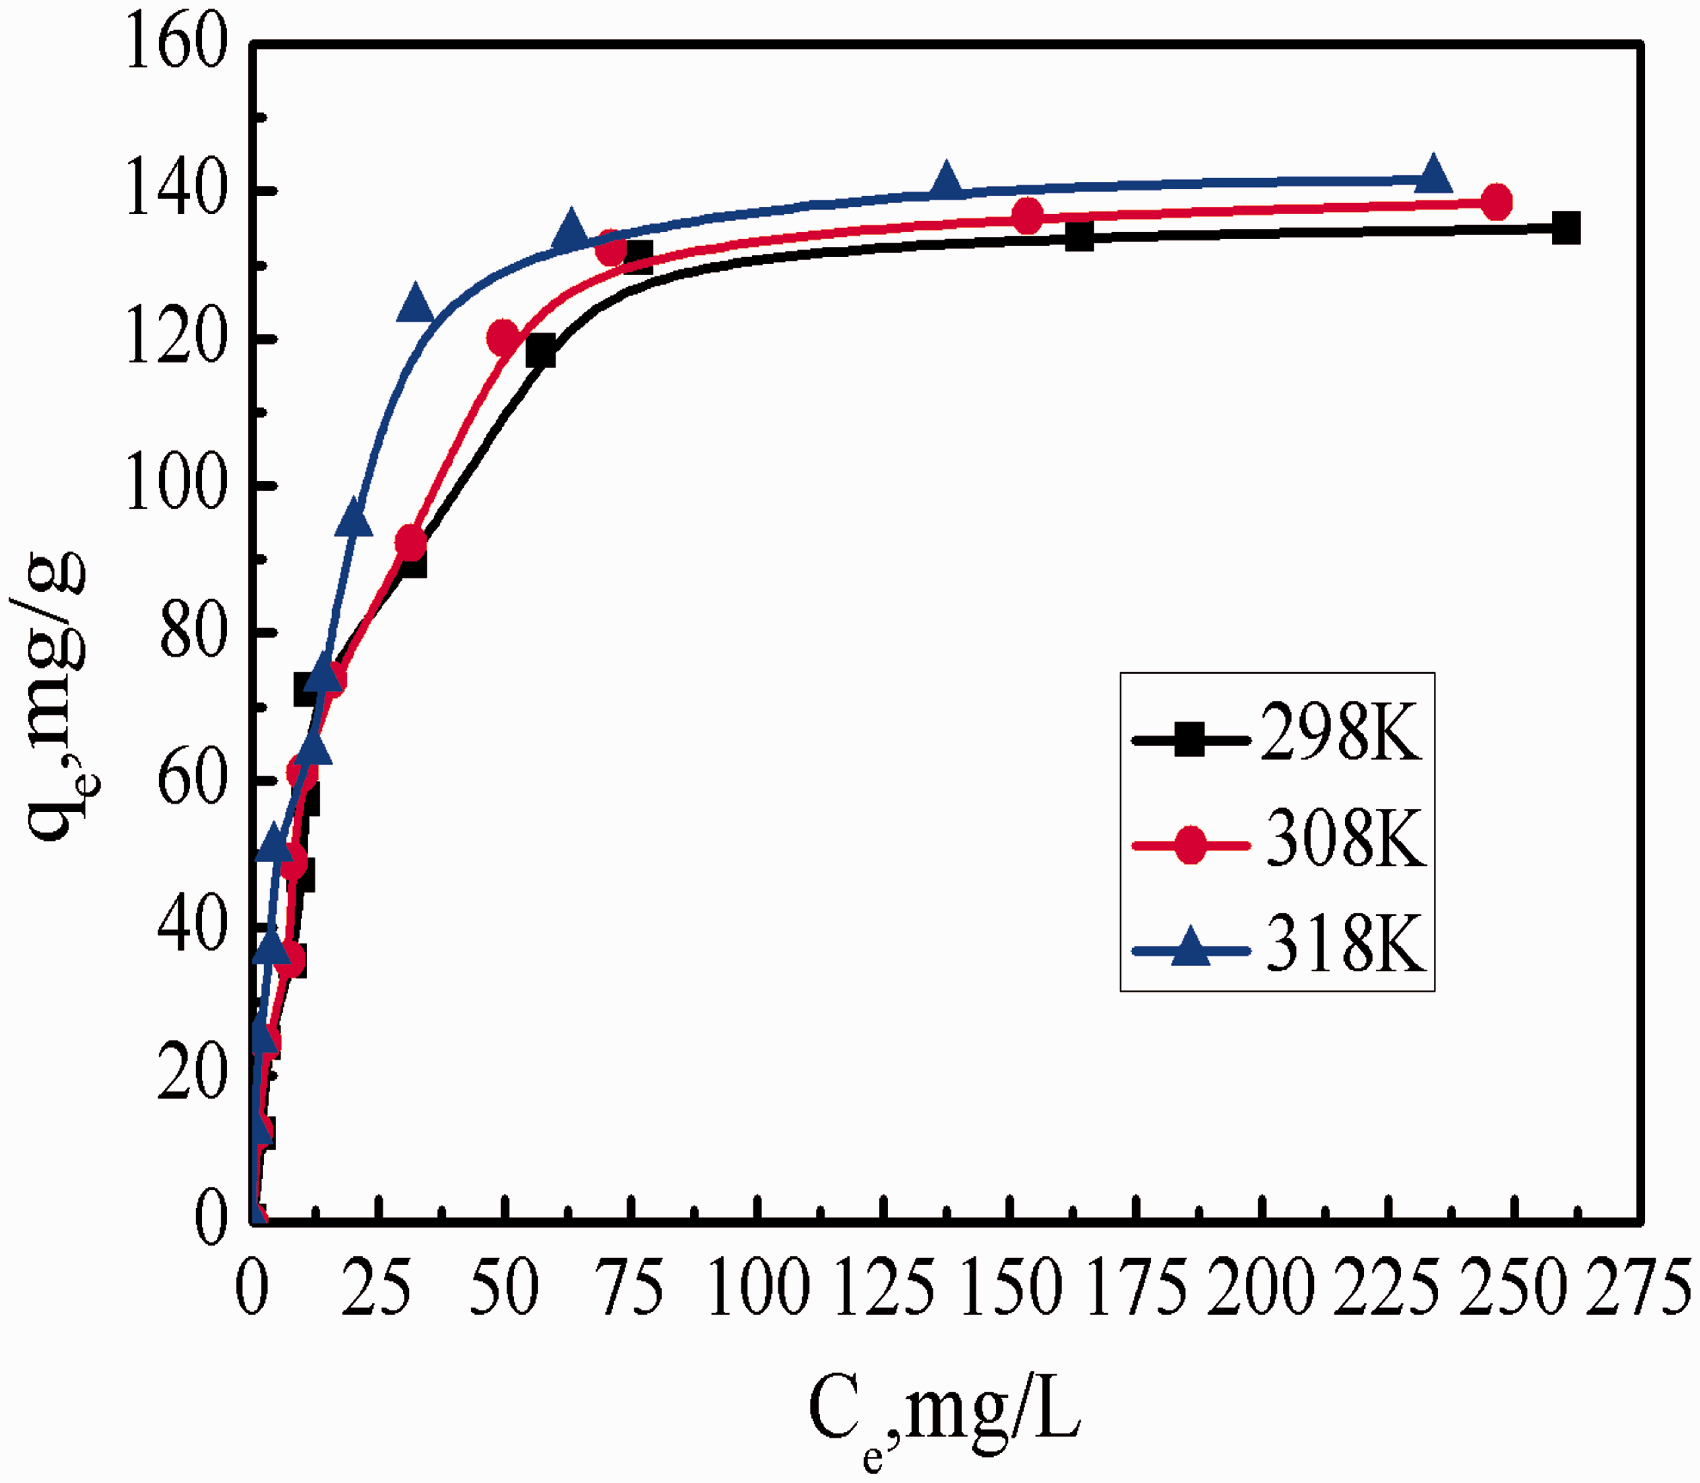
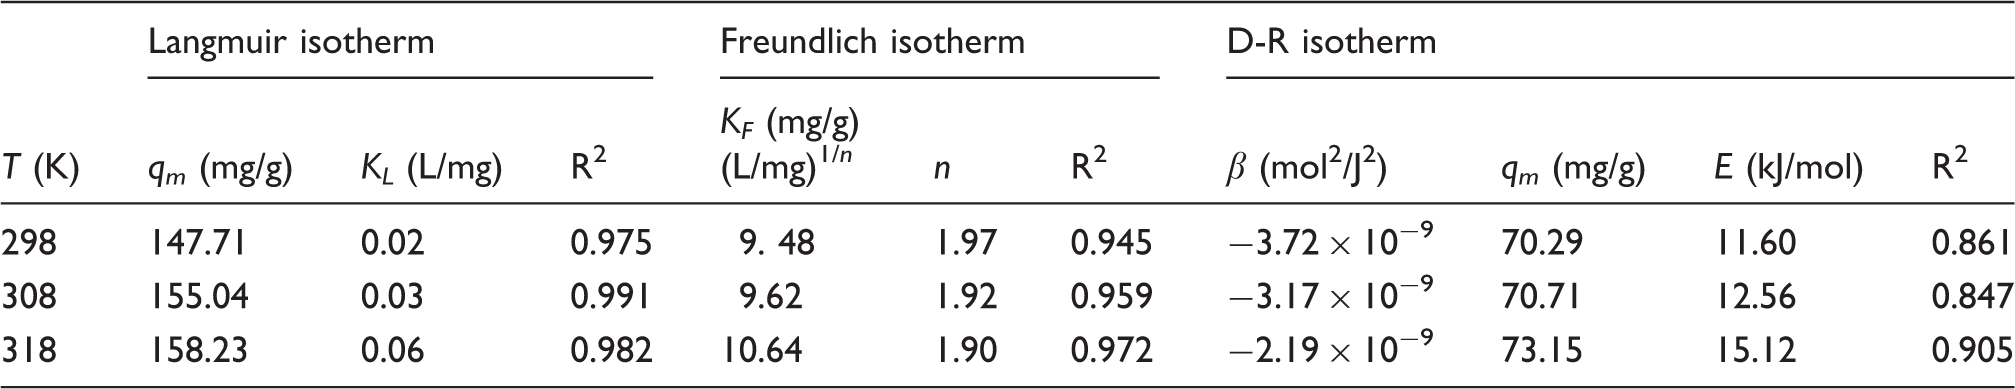
Adsorption isotherm constants for adsorption of ABS-3R onto SDP at different temperatures
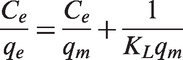
The experimental results indicate that the adsorption of ABS-3R onto SDP follows the Langmuir model.
Next, the experimental data were fit to the Freundlich isotherm model. The linear form of the Freundlich isotherm can be expressed by the following equation:
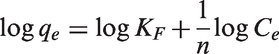
In the above equation, K F (mg/g) (l/mg)1/n and n are the Freundlich adsorption equilibrium constants related to the adsorption capacity and adsorption intensity, respectively. As indicated by the correlation coefficients R2, the dye adsorption process follows the Langmuir isotherm. The Freundlich adsorption equilibrium constants, K F and n were also calculated and their values at different temperatures are summarized in Table 3.
In order to estimate the porosity apparent free energy and the characteristics of adsorption, the D-R isotherm was also applied to analyze the adsorption data. The D-R equation can be defined by:53,54
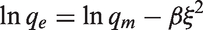
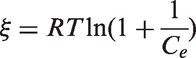
The free energy of adsorption (E, kJ/mol) may be estimated from the value of β using:
55
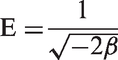
The values of the parameters obtained using the above equations are summarized in Table 3. The adsorption capacity (q m ) increased as the temperature was increased from 298 to 318 K. The E values were in the range 11–16 kJ/mol, which indicates that the adsorption process may be dominated by chemisorption. 56
Comparison of the maximum monolayer adsorption capacities of various low cost adsorbents reported in the literature including SDP at ambient temperature
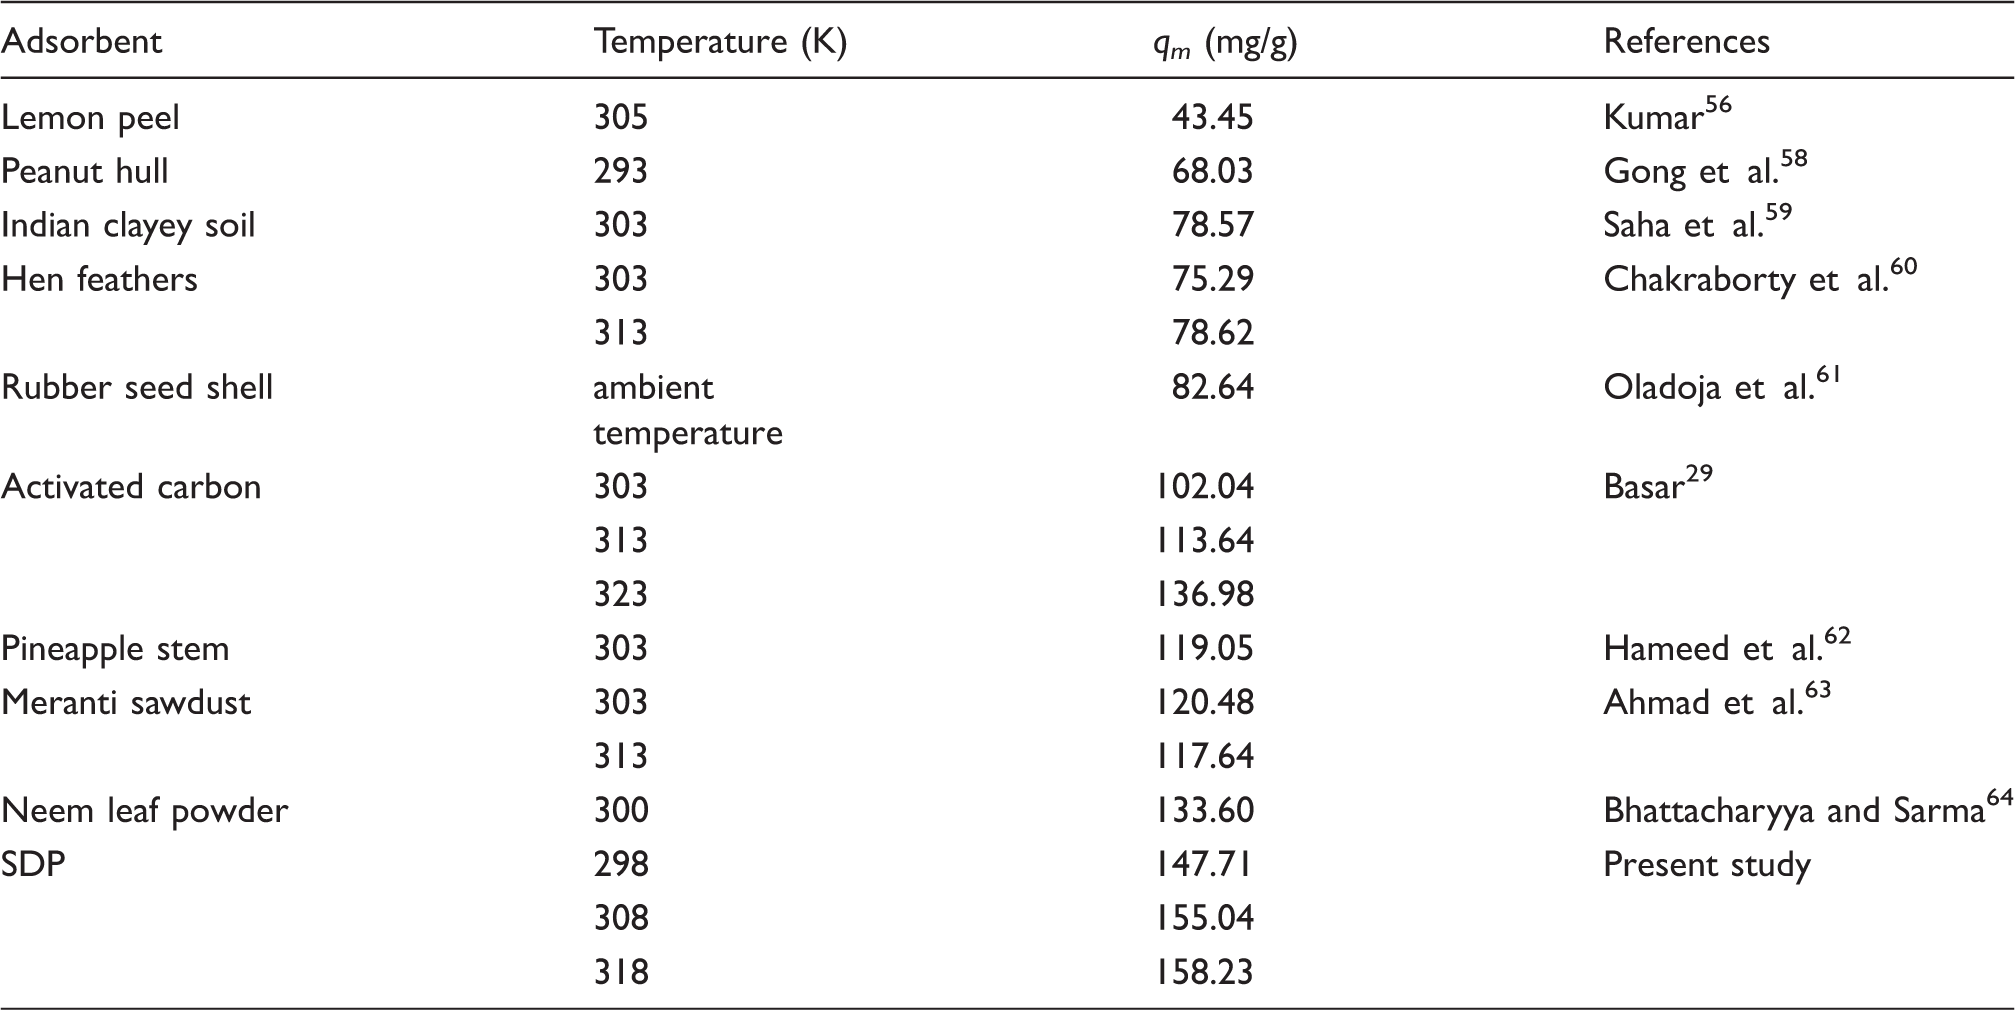
As listed in Table 4, it can be seen that SDP showed the higher adsorption capacity compared with other low-cost adsorbents due to the porous and irregular surface texture of the adsorbent. This fact suggests that ABS-3R could be easily adsorbed on SDP. Therefore, SDP are an efficient, eco-friendly, and promising adsorbent for the removal of ABS-3R from aqueous solutions.
Adsorption kinetics
In order to investigate the mechanism of the adsorption process and determine the rate-controlling steps, kinetic models (i.e. pseudo-first-order and pseudo-second-order models) were applied to analyze the experimentally determined equilibrium data.
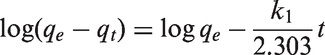
The pseudo-first-order equation, which is widely used for describing the adsorption of a solute from a liquid solution,
65
is represented by
In the above equation, q
e
and q
t
are the adsorption capacities of the adsorbent (mg/g) at equilibrium and at time t (h), respectively, and k1 (h−1) is the rate constant for the pseudo-first-order adsorption equation. Linear plots of log(q
e
− q
t
) versus t were constructed at temperatures of 298, 308, and 318 K (Figure 6(a)) and the values of k1, determined from the slope of the plots, are summarized in Table 5. From the values of the linear correlation coefficient (R2), it was evident that the pseudo-first-order equation did not accurately fit the experimental data.
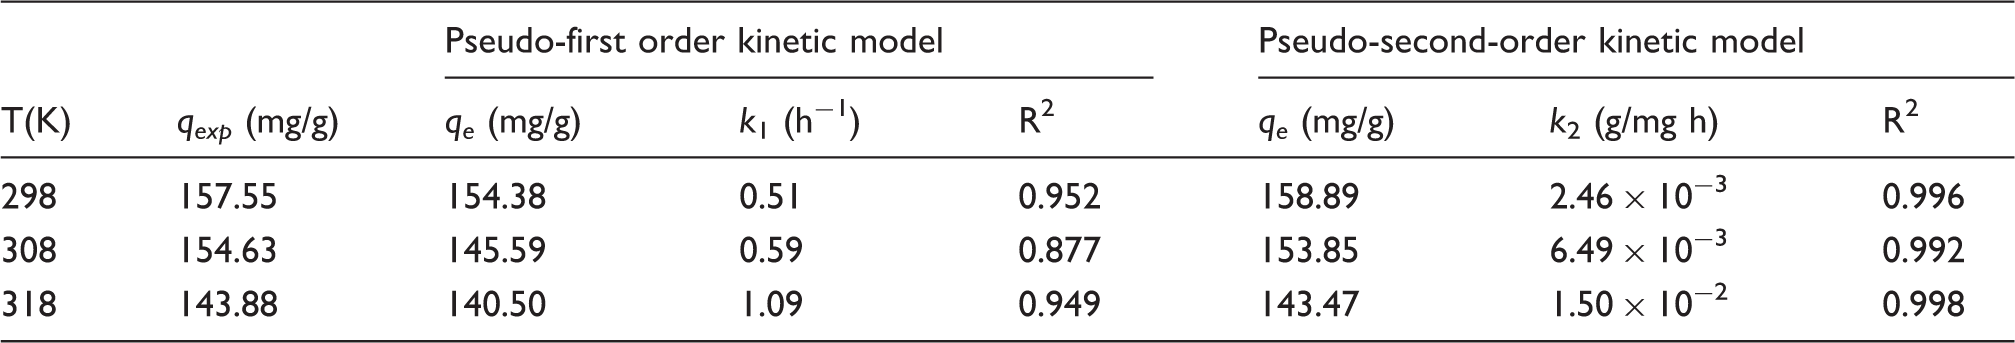
The kinetics for adsorption of ABS-3R onto SDP at different temperatures. (a) Pseudo-first-order; (b) Pseudo-second-order. Kinetic parameters for adsorption of ABS-3R onto SDP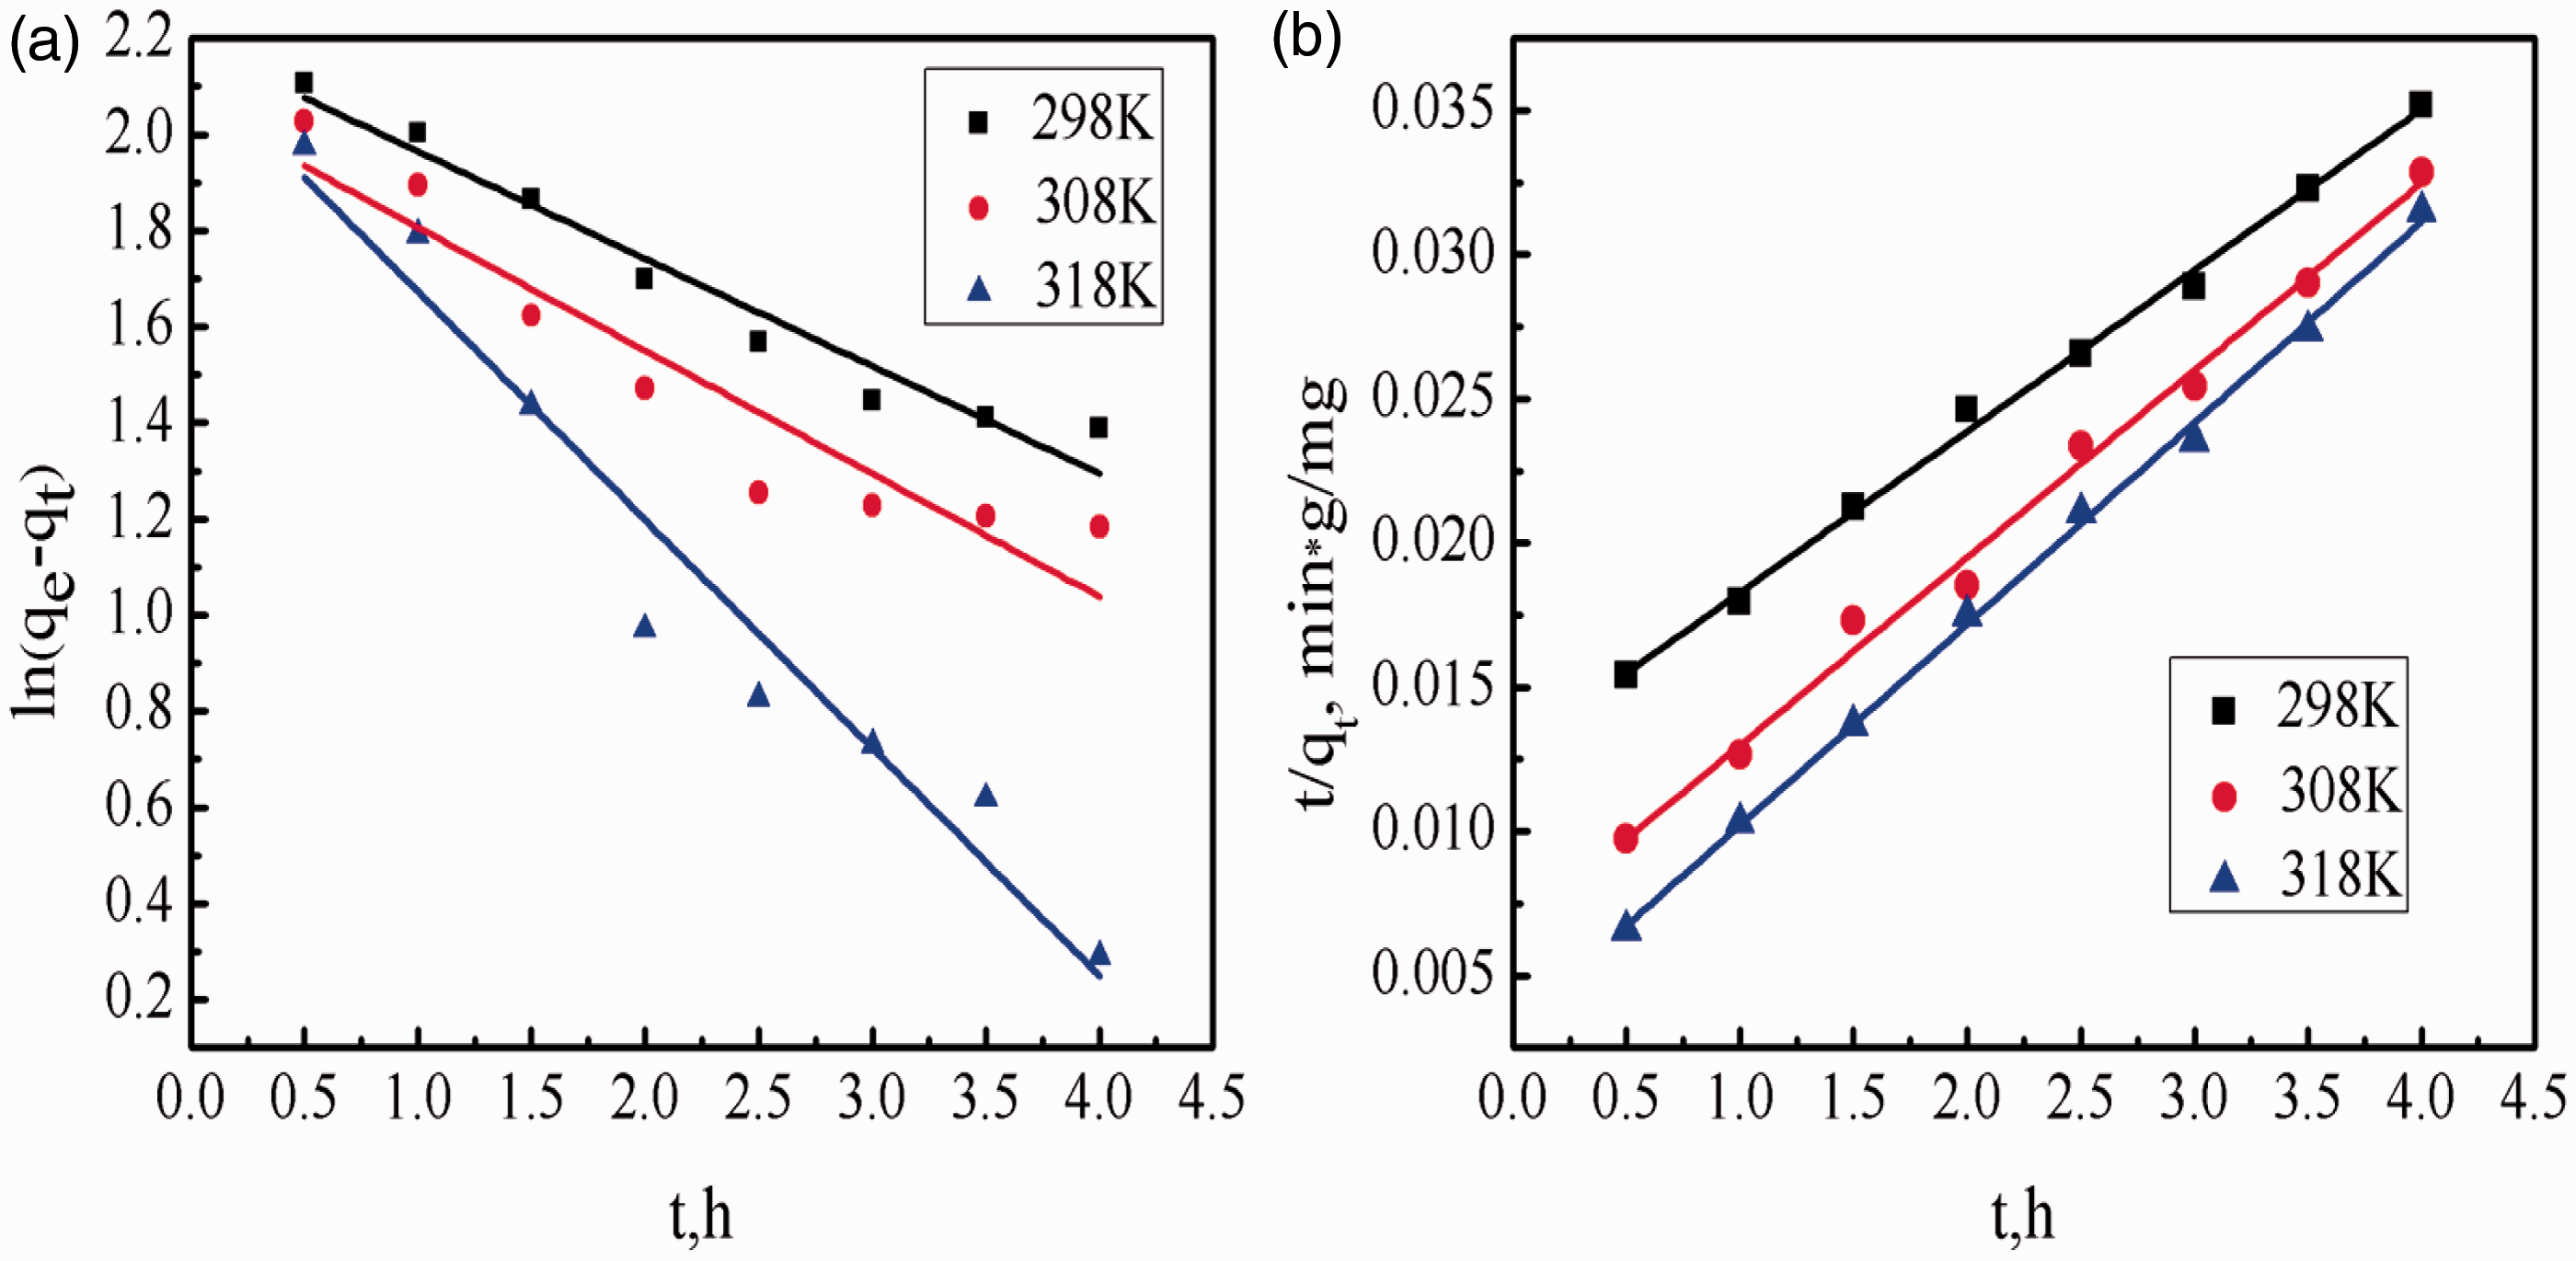
The pseudo-second-order equation based on the adsorption capacity can be expressed as follows:
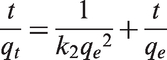
In the above equation, k2 (g/(mg h)) is the rate constant from the pseudo-second-order adsorption equation.
The q
e
and k2 values were estimated from the slope (1/q
e
) and intercept (1/k2
From Table 5, it is evident that the experimental data fit excellently to the pseudo-second-order equation at all the temperatures studied. Further, the equilibrium q e values calculated using this kinetic model were close to the experimental q e values. Therefore, it may be concluded that the adsorption process follows the pseudo-second order mechanism and not the pseudo-first-order mechanism. The good fit to the pseudo-second-order kinetics also implies that the rate limiting step of the adsorption process may be chemisorption involving valence forces from the sharing or exchange of electrons. 66 In addition, the values of k2 calculated from the experimental data increased as the temperature increased, indicating that the adsorption of ABS-3R onto the surface of SDP was an endothermic process.
Adsorption thermodynamic parameters
Activation energy
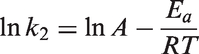
From the pseudo-second-order rate constant k2 values (Table 5), the activation energy (Ea) for the adsorption of ABS-3R onto SDP was determined using the Arrhenius equation:
Thermodynamic parameters
To determine the effect of temperature on ABS-3R adsorption, the thermodynamic behavior of adsorption of ABS-3R onto SDP was evaluated in terms of thermodynamic parameters such as Gibbs free energy change (ΔG0), enthalpy change (ΔH0), and entropy change (ΔS0). The parameters were calculated using the following equations:
Plot of ln K
c
versus 1/T. Thermodynamic parameters for adsorption of ABS-3R onto SDP

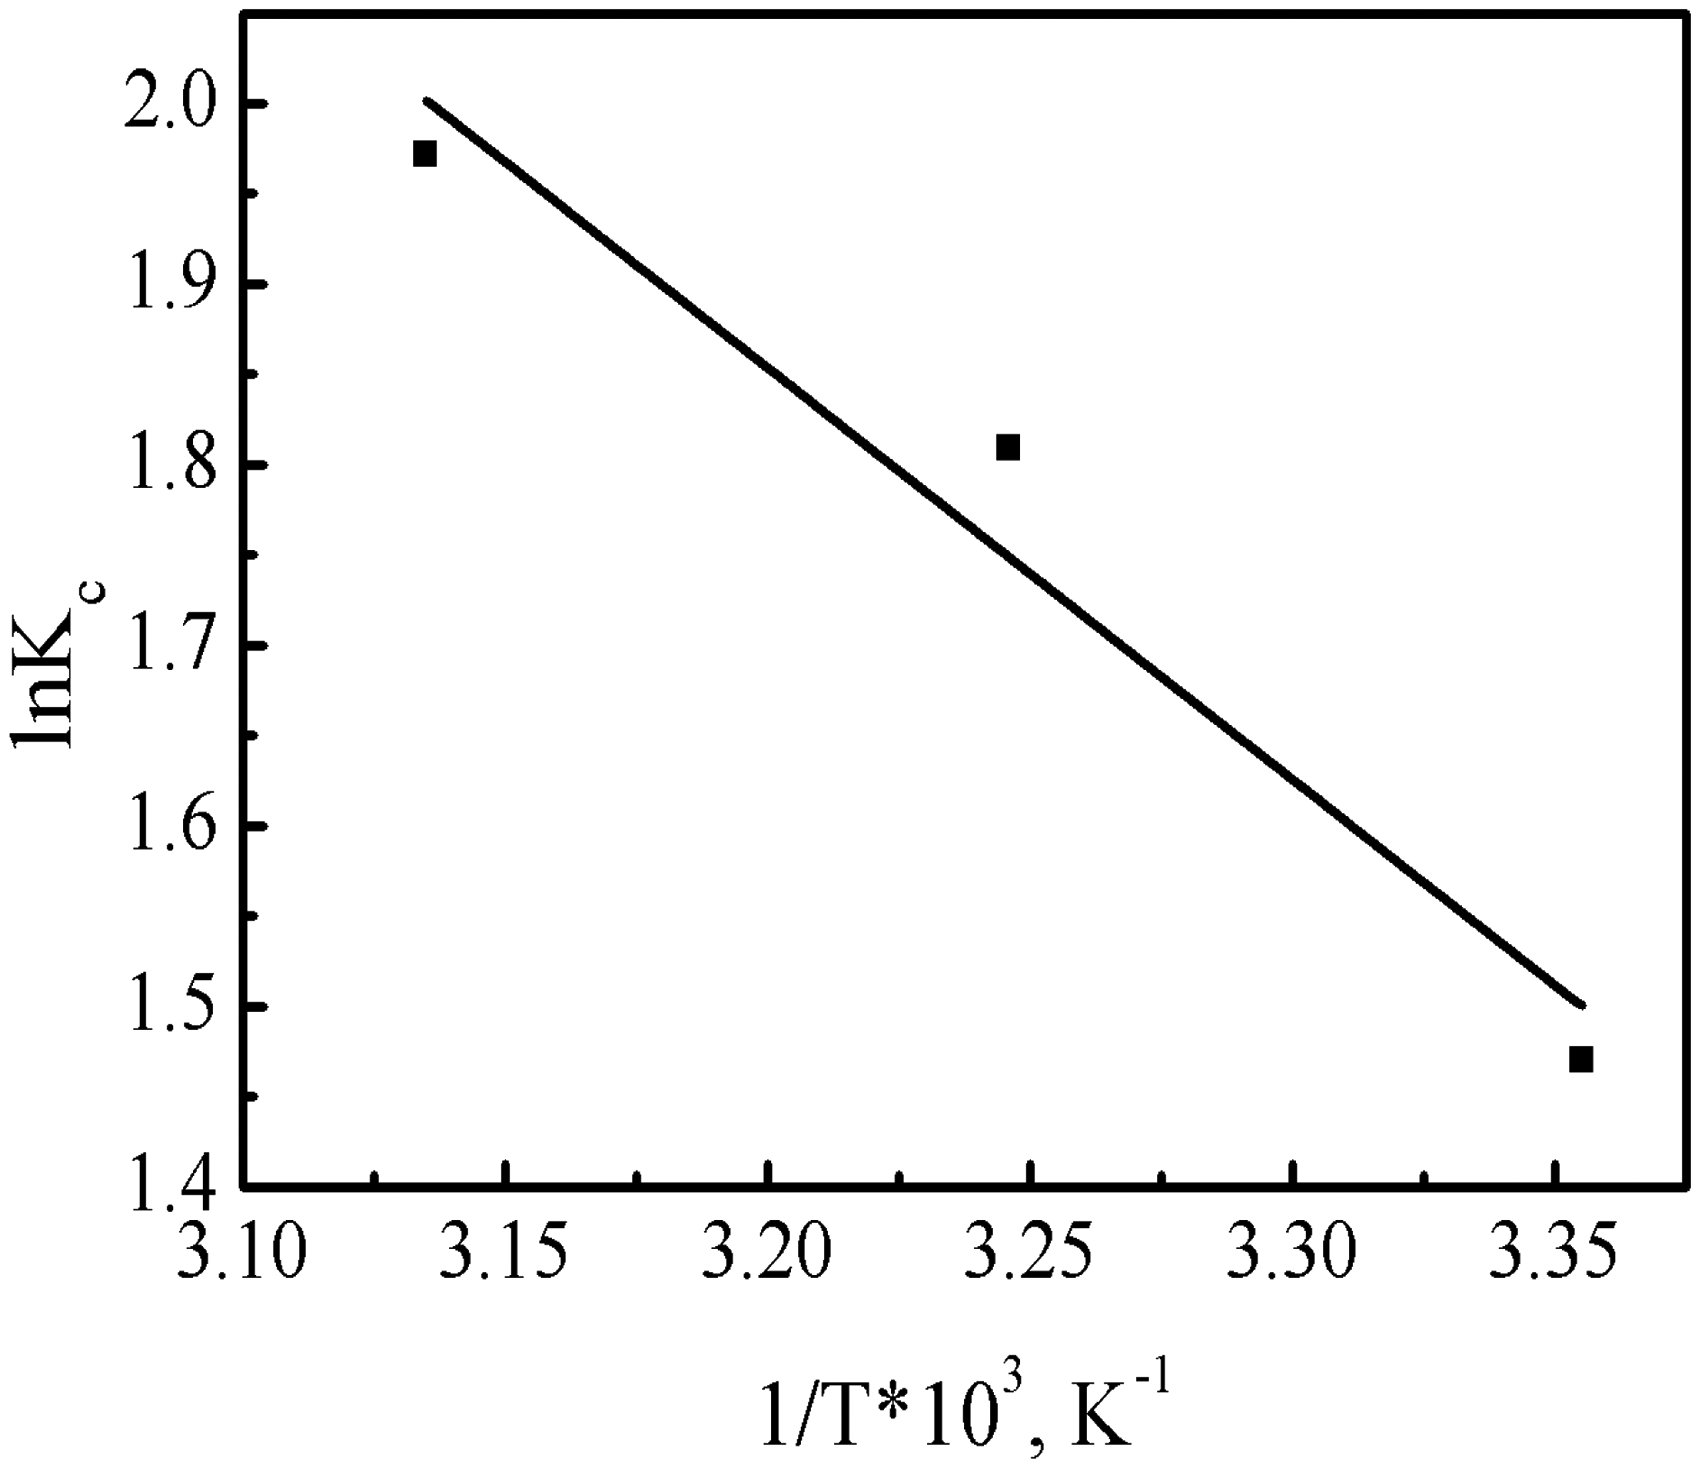
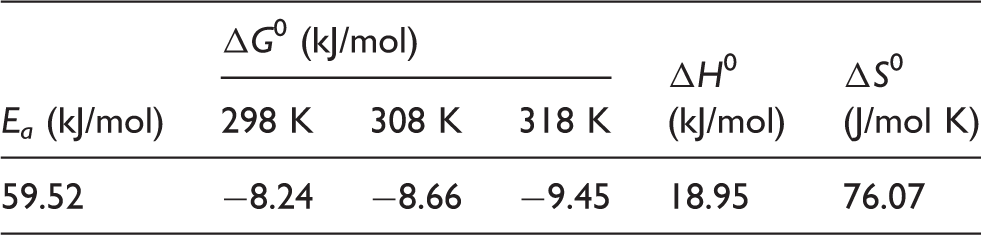
As can be seen in Table 6, ΔG0 values for adsorption of ABS-3R onto SDP were found to be −8.24, −8.66, and −9.45 kJ/mol for 298, 308, and 318 K, respectively. The negative value of ΔG0 at all temperatures confirms the spontaneous nature of ABS-3R adsorption onto SDP. The positive value of enthalpy change (ΔH0) indicated that the adsorption was an endothermic process, which is consistent with the conclusions made from the Langmuir monolayer capacity results. The positive value of ΔS0 revealed that the adsorption caused increased randomness at the solid/solution interface with some structural changes in the adsorbate and adsorbent. They also suggested good affinity of SDP towards the ABS-3R dye.
Conclusions
In this study, SDP, which were prepared from the down fibers of ducks, were evaluated as an adsorbent for the removal of ABS-3R from aqueous solutions. The adsorbent was characterized using SEM, particle size distribution, BET specific surface area, XRD, FTIR spectroscopy, and amino-acid analysis. The effects of various operating parameters on the adsorption process were investigated systematically in batch adsorption experiments and the results indicate that the adsorption was strongly dependent on initial pH, adsorbent dose, initial dye concentration, adsorption time, and temperature. The adsorption equilibrium data obtained at different temperatures provided a best fit with the Langmuir isotherm model, indicating monolayer adsorption on a homogeneous surface. The maximum adsorption capacity was found to be 158.23 mg /g at 318 K, which is considerably higher than that of many other adsorbent materials reported in the literature. Kinetic studies at different temperatures showed that the adsorption of ABS-3R onto SDP followed a pseudo-second-order rate equation. The activation energy calculated using the Arrhenius equation further confirmed that the adsorption involved chemisorption. Thermodynamic study showed that adsorption of ABS-3R was a spontaneous and endothermic process. In summary, the results suggest that SDP can be used as an efficient, economical, and eco-friendly adsorbent for the removal of ABS-3R from aqueous solutions.
Footnotes
Acknowledgements
The authors are grateful to Ph.D. Dongzhi Chen (School of Materials Science and Engineering, Wuhan Textile University) for English language editing.
Declaration of Conflicting Interests
The authors declared no potential conflicts of interest with respect to the research, authorship, and/or publication of this article.
Funding
The authors disclosed receipt of the following financial support for the research, authorship, and/or publication of this article: This work was supported by the National Science Fund for Distinguished Young Scholars (grant number 51325306), the National Natural Science Foundation of China (grant number 51203124), the Program for Middle-aged and Young Talents from Educational Commission of Hubei Province (grant number Q20120103).