






Abstract
The solid-state bonding of ultralow-carbon steels was conducted by hot pressing and subsequent isothermal holding at low temperatures ranging from 873 to 923 K. The evolution of the interfacial strength was found to consist of two stages; the first stage, where the increase in interfacial strength is rapid and significant, and the second stage, where the increase is gradual. The evolution of strength in the first stage primarily takes place in contact regions produced by hot pressing. In the second stage, on the contrary, the evolution seems to result from the increase in the contact regions due to the shrinkage of voids. A molecular dynamics simulation was performed to clarify the atomic behaviour at the interface during the first stage. The results revealed that the disordered atomic arrangement caused by compression was rearranged with increasing isothermal holding time, leading to improved coherency between the contact regions and increased interfacial strength.
Keywords
Introduction
Solid-state bonding is a joining process that induces the coalescence of constituent base materials below their melting temperature, providing several useful characteristics and advantages over traditional fusion welding such as the ease of precision control and the absence of hazardous heat-affected zone. To explain the main mechanisms of the improved interfacial strength in solid-state bonding, Derby and Wallach1, 2 and Takahashi and Inoue 3 suggested that atoms at a void surface and in the contact area move to the void tip through surface and interface diffusion, respectively, thus increasing the bonded area and interfacial strength. Several other hypotheses have been proposed for the mechanisms, which involve recrystallisation, an energy barrier 4 and an oxide film. 5 All hypotheses indicate that a high bonding temperature and deformation are favoured for attaining high interfacial strength. However, a high temperature and long bonding time induce the excess diffusion of atoms across the interface, potentially causing the microstructure degradation of the bonded materials 6 and the formation of brittle intermetallic compounds at the interface, 7 which reduce the interfacial strength and deteriorate the mechanical properties. To avoid these problems, solid-state bonding at relatively a low temperature is more attractive.
In our previous study, 8 surface-activated roll-bonding between type 304 stainless steel and nickel was conducted at relatively low temperatures of 723–873 K, to achieve high bonding interfacial toughness. It was found that the evolution of interfacial toughness consists of two stages with much faster evolution in the first stage than in the second stage. Accordingly, the first stage is a promising means of attaining high interfacial strength at a low temperature with low deformation, although the dominant mechanism for the evolution of the interfacial strength in the first stage remains unclear. Therefore, the aim of the present study is to examine the mechanism for evolution of interfacial strength in the first stage in the solid-state bonding of ultralow-carbon, interstitial-free (IF) steels at relatively low temperatures. To overcome the limitations of our experimental investigation on the atomic behaviour at the bonding interface, a molecular dynamics (MD) simulation 9 was attempted and the results were compared with experimental observations.
Research procedure
Experimental procedure
Chemical composition of the IF steel used (wt-%)

A pair of degreased surface-prepared specimens were stacked and hot-pressed together by a thermo-mechanical process in vacuum atmosphere, as shown in Fig. 1. After being heated up at a rate of 20 K s−1 to the targeted bonding temperature, which was varied from 873 to 923 K, the specimens were momentarily compressed by 5% compressive strain, and then isothermally held for a given time, which was followed by cooling at rate of 5 K s−1. Then, the bonded specimens were machined to a flat cuboid with 12-mm length, 8-mm width and 1.5-mm thickness. The interfacial strength was measured at room temperature by performing a tensile test perpendicular to the bonding interface with a crosshead speed of 5.56 × 10⁻⁶ m s−1. The macrostructure and microstructure of the bonding interface were examined by scanning electron microscopy (SEM) and transmission electron microscopy (TEM).
Thermo-mechanical process used in the experiment
The increase in the contact area and the quality of the bonding interface were also examined by four-probe resistivity measurement with a probe spacing of 1 mm, as shown in Fig. 2. The specimens used for resistivity measurement had 5-mm width and 1-mm thickness. The resistivity across the bonding interface was measured at room temperature with a DC voltage of 0.1–1 mV for specimens that were bonded at 873 K and isothermally held for different times.
Four-probe resistivity measurement with 1-mm probe spacing
MD simulation methodology


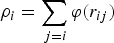

 and
and
 ,
,
 is the total electronic charge density at the site of atom i, which is constructed by the superposition of atomic charge densities
 ,
,
 is the binding energy,
 ,
,
 and
and
 are constant parameters used for fitting experimental data, c and d are cut-off parameters assumed to lie corresponding to a location between the second- and third-nearest-neighbour atoms and
 is the maximum value of
 . The parameters for iron are as listed in Table 2.
10
In this study, the temperature was normalised by the melting point corresponding to the original FS potential for bcc iron of 2400 K,
11
which is significantly different from the experimentation.
. The parameters for iron are as listed in Table 2.
10
In this study, the temperature was normalised by the melting point corresponding to the original FS potential for bcc iron of 2400 K,
11
which is significantly different from the experimentation.
Parameters of FS potential for iron–iron bond


In the simulation, the leapfrog method was used with a time step of 5.0 fs. Assuming a periodic boundary, the number of atoms, which was 60 000–65 000 atoms, the simulation volume and the temperature were controlled to be constant during each time step. In this study, the lattice parameter of bcc iron was assumed to be 2.8665 Å at 0 K. The simulated bonding specimens consisted of two parts; the lower lattice, whose [010] and [001] directions are parallel to the y-axis and z-axis, and the upper lattice, whose [010] and [001] directions are tilted by 25° relatively to the y-axis and z-axis, respectively, while the [100] direction is parallel to the x-axis. Thus, the bonded specimens have high-angle boundary at the bonded interface after compression and isothermal holding. The dimensions of the simulated specimens are as illustrated in Fig. 3.
Simulated bonding specimen with the lower lattice, whose [010] and [001] directions are parallel to the y-axis and z-axis, and the upper lattice, whose [010] and [001] directions are tilted by 25° relative to the y-axis and z-axis, respectively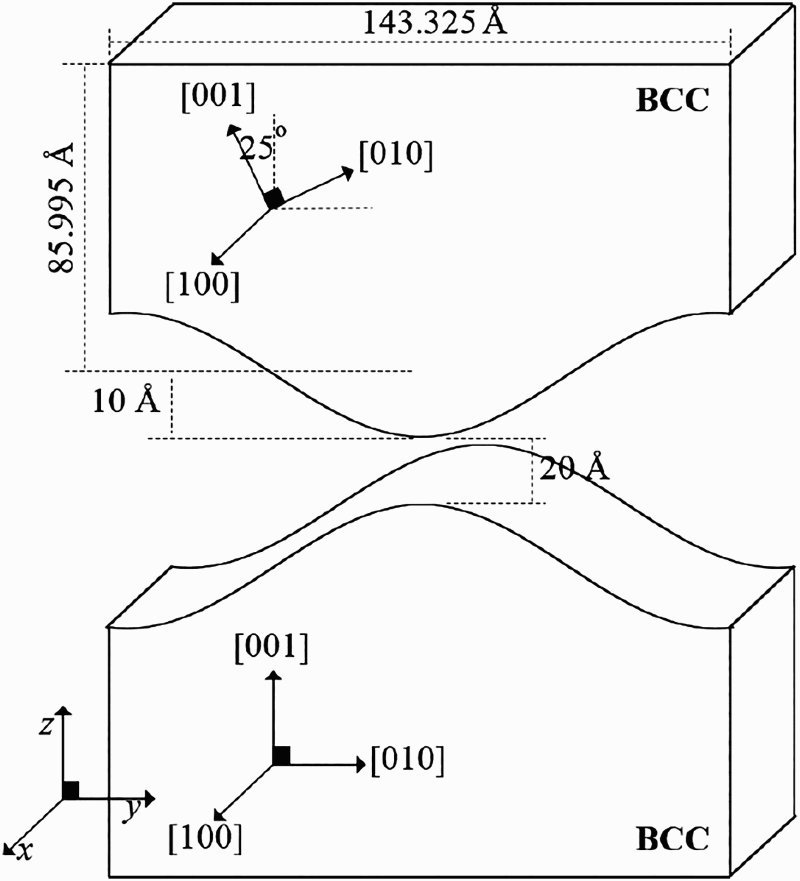
The thermal history of the thermo-mechanical process used in the simulation is as shown in Fig. 4. A bcc lattice structure was prepared at 0 K, then heated to 0.364Tm (Tm: melting temperature
11
) at a rate of 8.73 × 10¹³ K s−1. Compression by 40 Å was then conducted to induce bonding with a strain rate of 5.26 × 10⁶/s, which was followed by heating and isothermal holding at 0.5Tm for up to 500 ps. The bonding temperature was chosen to be lower than the isothermal holding temperature to minimise the arrangement of atoms during the compression and to observe the rearrangement of atoms during the isothermal holding. The isothermal holding temperature of 0.5Tm was relatively analogous to the experimental annealing temperatures.
Thermo-mechanical process used in the MD simulation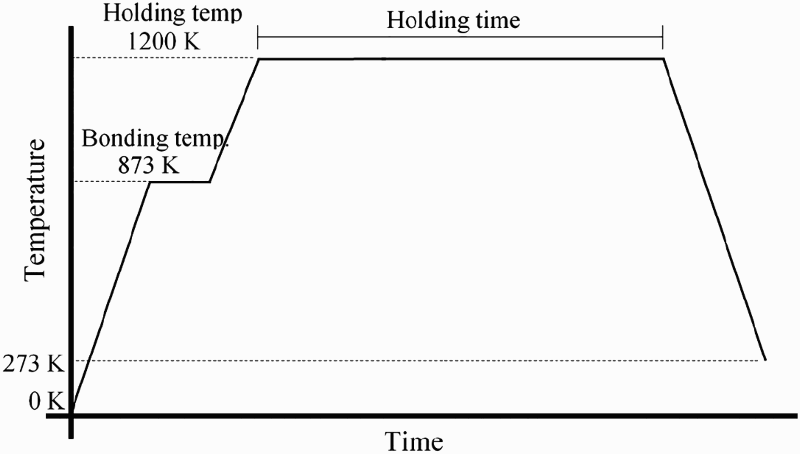
Results and discussion
Experiments
Evolution of interfacial strength
Figure 5
a shows the evolution of the interfacial strength with the isothermal holding time after the compression to induce the bonding. It is clearly observed that the evolution of strength can be divided into two stages; the first stage with a faster increase in interfacial strength starting from a very low strength, which appears to start immediately after the compression and the second stage with a slower increase in strength. From Fig. 5
a, the rate of increase in the interfacial strength in both the stages becomes more rapid with increasing isothermal bonding temperature. Therefore, the evolution of strength in both stages is considered to be controlled by thermally activated processes. After a period of isothermal holding, the first stage is replaced by the second stage at a certain strength. This is probably due to a decrease in the driving force of the first-stage mechanism, which is discussed later. Regarding the interfacial strength of the specimen held at 923 K, it can be seen that the first stage is limited to within 10 s, and when the isothermal holding temperature exceeded 923 K, the first stage was too rapid to observe.
a Evolution of interfacial strength with isothermal holding time for specimens bonded at 873, 898 and 923 K. b Relationship between isothermal holding time and interfacial strength on logarithmic scale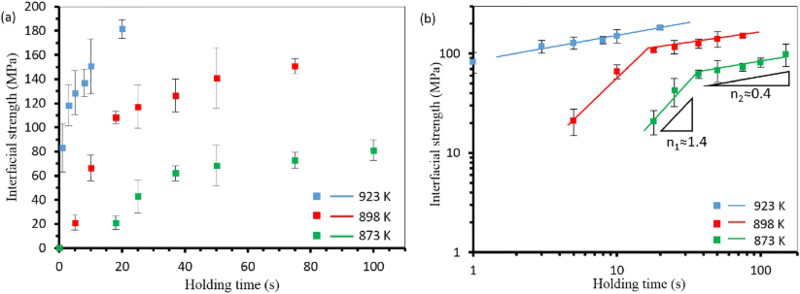
Figure 5
b illustrates the relationship between the isothermal holding time and the interfacial strength on a logarithmic scale. The interfacial strength in both the first and second stages can be expressed as a polynomial function of time in the form of

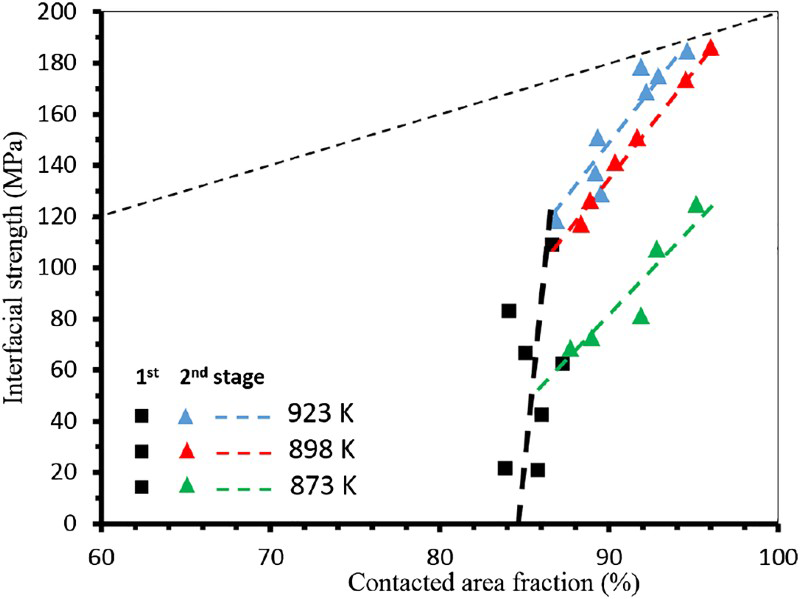
As shown in Fig. 6, as a result of the compression to induce bonding, contact areas are formed and these areas are deformed elastically and/or plastically, while areas not in contact remain as voids and gaps. Thus, two distinct areas are related to the mechanism for the evolution of interfacial strength. Figure 7 shows the relationship between the contact area fraction and the interfacial strength of the specimens during isothermal holding, where the contact area fraction was determined by SEM observation of the cross-section of the bond interface. In the figure, the dashed line is the estimated interfacial strength, assuming that the contact area has the same tensile strength as the IF steel employed. The relationships can be seen to have two stages distinguishable by the slopes, which correspond to the stages in the relationship between the strength and isothermal holding time as shown in Fig. 5
b. For all the bonding temperatures (873–923 K) examined, the interfacial strength during the first stage increases from almost zero and approaches the dashed line with little change in the contact area, where the onset of this increase is the contact area fraction originally achieved by the compression. During the second stage, on the other hand, the interfacial strength tends to increase with increasing contact area, towards the dashed line. The slope in the first and second stages appears to be almost independent of the bonding temperature, as shown in Fig. 7.
Schematics of bonding interface a before compression and b after compression, showing distinctive voids and deformed contact areas Relationship between contact area fraction and interfacial strength of specimens bonded and isothermally annealed at 873, 898 and 923 K
In summary, the interfacial strength of the as-compressed bonding interface is very low, but it immediately increases in the first stage as a result of rapid kinetics, which takes place only within the deformed contact areas. In other words, the evolution of the strength in the first stage is strongly related to the deformation caused by the compression. The first stage changes to the second stage after a certain interfacial strength is achieved, and the evolution of the interfacial strength in the second stage is driven by slower kinetics probably due to the diffusion of atoms and the reduction of the noncontact area since the degree of the function with time in the second stage is close to 0.5.
Interface microstructure
Figure 8 shows the bonding interface microstructure observed by TEM for two specimens bonded at 898 K, one of which was interrupted at the end of the first stage, specimen I, and the bonding of the other was interrupted during the second stage, specimen II. The voids and gaps at the interface in specimen I are still flat, having sharp edges and appearing almost identical to those in the as-compressed condition, as shown in Fig. 8
a. This indicates that long-range atomic diffusion did not occur at the bonding interface during the first stage. Furthermore, the degree of the function for the first-stage mechanism, estimated from Fig. 5
b, is 1.4, which is considerably different from that of the diffusion-controlled function of 0.5. In contrast, the gaps and voids’ edge of specimen II, as shown in Fig. 8
b, rounded, implying that diffusion occurs and the noncontact area decreases during the second stage. This observation supports the discussion of the second stage in Fig. 7.
Bonding interface microstructure and void shapes, observed by bright-field TEM, for specimens annealed at 898 K for a 18 s (specimen I) and b 50 s (specimen II) after compression
Evolution of interface microstructure and electrical resistivity
The electrical resistivity was measured across the bonding interface on bond area to clarify the relationship between the quality of the bonding interface and the interfacial strength. In previous studies,12, 13 it was shown that the electrical resistivity greatly increases with increasing number of defects such as vacancies, dislocations and misorientation. Figure 9 shows the change in electrical resistivity across the bonding interface with the duration of isothermal holding at 873 K. The result reveals that the as-compressed bonding interface has significantly higher resistivity than the specimen body and that the resistivity decreases rapidly with increasing isothermal holding time, converging to that of the specimen body. Note that the time required for the resistivity across the bonding interface to decrease to that of the specimen body is close to the duration of the first stage, as shown in Fig. 5
a. This suggests that the disorder and the number of defects at the bonding interface decrease during the first stage, leading to increased interfacial strength. It appears that short-range atomic rearrangement without long-range diffusion is responsible for the increase in strength owing to the limited time of the first stage. Akatsu et al.
14
pointed out that short-range atomic movement may also be a reason for the unique arrangement of the atoms at the bonding interface in Al/Al surface-activated solid-state bonding.
Electrical resistivity, measured by four-probe method, across the bonding interface (red) and for specimen body (black) as a function of isothermal holding time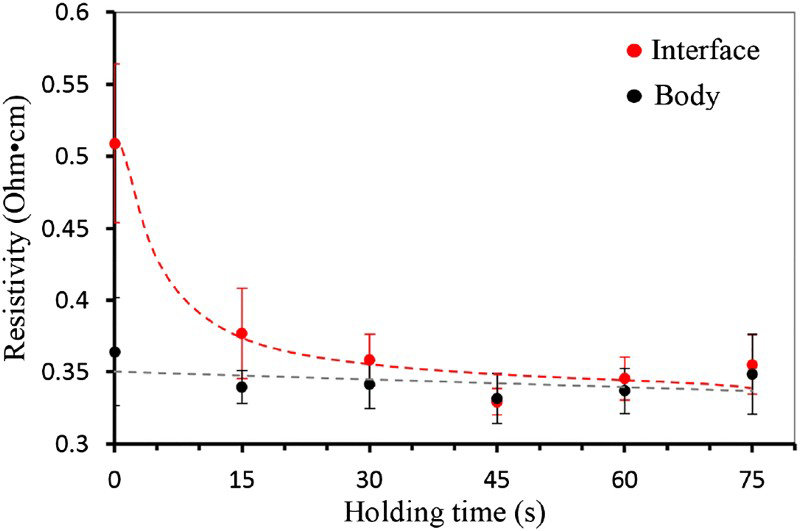
Numerical analysis by MD simulation
Macroscopic view of bonding interface and potential energy evolution
To investigate the atomic behaviour at the bonding interface in the first stage of the solid-state bonding process, an MD simulation was performed with a constant number of atoms, system volume and step temperature. Figure 10
a shows the change in potential energy of the atoms in the bonding interface during isothermal holding (the energy per atom is given in the figure). In the as-compressed specimen, atoms possess high potential energy, which decreases rapidly upon isothermal holding after the bonding. Afterward, the potential energy appears to decrease with smaller gradient and it becomes completely saturated after 500 ps isothermal holding time, called ‘ts’ in this paper. The compression causes significant disordering of the atoms in the bonding interface, as shown in Fig. 10
b, and thus the driving force for the rearrangement of atoms to more stable positions is high particularly at and near the bonding interface.
a Change in total potential energy during isothermal holding. b–e Macroscopic views of lattices annealed at 0.5Tm after compression: b as-compressed, c after 0.07ts, d after 0.1ts and e after 0.2ts, where 0.07, 0.1 and 0.2ts are the times given in Fig. 11 a. Note that the bonding interface with voids is located at the centre of the figures
Figure 10 b–e shows the changes in the atomic structures in the bonding interface with isothermal holding. The severe disordering of atoms and the distortion of grains can be clearly observed in both the upper and lower lattices under the as-compressed condition (Fig. 10 b), but it is revealed that the disordered atoms are rearranged and the distorted small grains are agglomerated with increasing isothermal holding time in Fig. 10 c–e. The atomic rearrangement clearly corresponds to and thus explains the decrease in the atomic potential energy in Fig. 10 a. Note that the rearrangement is achieved only by the short-range movement of atoms within a short time; no long-range diffusion of atoms was observed.
Atomic behaviours at bonding interface
Figure 11
a–c shows the atomic arrangement at the newly formed interface between the upper and lower lattices in the y–z plane during the isothermal holding. At 0.07ts, a disordered atomic layer with a thickness of a few nanometres and distorted small grains can be observed at the bonding interface, with little direct contact between the upper and lower lattices (Fig. 11
a), where some of the characteristics of the as-compressed bonding interface still remain. At 0.2ts, atoms in the disordered layer rearrange themselves into the bcc crystal structure in both the upper and lower lattices, gradually forming some coherent or semicoherent boundaries (Fig. 11
b). At 0.8ts, the coherence of the boundaries is improved by the creation of an extra lattice plane (Fig. 11
c). Figure 11
d shows the projection of trajectories of atoms from 0.07 to 0.2ts in the y–z plane, which corresponds to the region surrounded by the solid red line in Fig. 11
a and b. It is found that the atoms rearrange themselves by short-range movements though thermal oscillation without long-range diffusion. The projection of the trajectories from 0.2 to 0.8ts is shown in Fig. 11
e, which indicates that the degree of atomic rearrangement decreases with increasing isothermal holding time, in agreement with the behaviour of the potential energy in Fig. 10
a.
Atomic arrangement at bonding interface after a 0.07ts, b 0.2ts and c 0.8ts. d–e Projection of the trajectories of atoms surrounded by the solid red line in the y–z plane during d from 0.07 to 0.2ts and e from 0.2 to 0.8ts, where black points are initial positions of atoms and grey lines are atomic movements
Mechanisms of the evolution of interfacial strength
From the experimental and simulation results, it can be concluded that two distinct mechanisms sequentially occur in the compressive bonding and subsequent isothermal holding at relatively low temperatures. In the first stage, the interfacial strength increases rapidly from almost zero to a certain level, which is attributed to the evolution of the strength at the contact area caused by compression. Figure 7 indicates that there is little increase in the contact area while the bonding strength increases. In addition, the MD simulation results as shown in Figs. 10 and 11 suggest that the evolution of the strength is achieved through the atomic short-range rearrangement at and in the vicinity of the bonding interface. The first stage changes to the second stage, where long-range diffusion transports atoms to the tips of the voids to shrink the voids, increasing the contact area and the interfacial strength. Note that the initial contact area in Fig. 7 is determined by the compressive strain in the bonding and the surface conditions of the specimens employed. Surface roughness of pre-bonded specimens seems to significantly affect the fraction of contact area after the compression as well as deformation at the contact area. Further investigation will be made on the effect of surface roughness and will be published elsewhere.
From Fig. 5 b, the two stages can be distinguished by their different gradients in the logarithmic strength-time relationship. Each stage appears to have its own gradient, so the evolution of the strength in each stage is dominated by its own specific mechanism. In Fig. 5 a, the rate of the strength evolution in the first and second stages increase with increasing isothermal holding temperature, and the increase in rate of the strength evolution is more significant in the first stage, which suggests that the strength evolution kinetics in the first stage is more temperature-dependent than that in the second stage. Meanwhile, the interfacial strength at which the transition from the first state to the second one takes place increases with increasing temperature. This implies the mechanism of the first stage becomes more dominant than that of the second stage.
Conclusions
The evolution of the microstructure and strength at the steel/steel interface bonded by compression and isothermal holding at relatively low temperatures was examined experimentally and numerically. The main conclusions that can be drawn from the present study are as follows:
During the isothermal holding after hot compression, the evolution of interfacial strength of the bond involves two stages. The first stage starts immediately after the compression, during which the strength increases rapidly, then the strength more slowly increases in the second stage. The deformed contact area produced by compression has low interfacial strength under the as-compressed condition, but the strength increases during the isothermal holding in the first stage with little increase in the contact area. The evolution of the strength in the first stage is considered to be achieved by atomic rearrangement involving short-range atomic movement at and near the bonding interface which decreases the disorder of the atoms and the number of distorted grains and increases the coherence of the bonding boundary.