This paper suggests an approach to evaluate the material properties of the nugget zone in resistance spot-welded DP980 steel joints at various strain rates ranging from 0.001 to 100 s−1. Two kinds of micro-specimens are prepared for the tests: one cut from the centre of the welded nugget zone; and the other cut at 1 mm away from the welded nugget centre. Test results show that the welded nugget zone has little discrepancy in the material properties depending on sampling location and that the flow stress of the nugget zone is relatively high compared with that of the base metal at each strain rate tested. It is confirmed from microscopic observation that the differences are mainly caused by the formation of coarse martensite phase in the welded nugget zone due to the rapid cooling after the resistance spot-welding process.
Over the decades, advanced high-strength steel (AHSS) has gained attention from the automotive industries with the certain issue to fulfil the intense demand for lightweight structures of the auto-body while guaranteeing improved passenger safety and fuel efficiency [1]. As application of the AHSS to the auto-body is expected to increase, particular attention also has been drawn for the assembling process of the AHSS. Resistance spot-welding process (RSWP) is one of the most widely used electro-mechanical joining techniques on assembly lines of the auto-body since the modern auto-body typically contains several thousands of spot welds. The joint region typically consists of three distinct microstructural zones: the welded nugget zone (or fusion zone); the heat-affected zone (HAZ); and the base metal (BM) zone. In-depth understanding of the mechanical behaviour in the spot-welded zone, therefore, is of great importance for the safe design of the auto-body concerning the crashworthiness. This is crucial because the overall performance of the auto-body depends not only on the mechanical properties of sheets but also on the mechanical behaviour of spot-welded joints which is significantly affected by various welding conditions experienced [2-4].
At the early stage of the research, researchers had mainly focused on constructing a constitutive relation between the stress–strain response of the BM and the evolution of a hardness profile of the HAZ due to the lack of an effective testing methodology to evaluate the hardening behaviour at the HAZ [5, 6]. These approaches, however, require a complicated conversion process of the experimental data for acquisition of the tensile properties and there still remains a question whether the predicted values represent its inherent mechanical properties accurately. To resolve this issue, LaVan and Sharp [7] developed a testing system so as to measure the material properties such as the yield stress, the ultimate tensile strength, and the stress–strain response using the micro-specimen cut from the weld metal directly. Markiewicz et al. [8] introduced an alternative methodology to identify the material behaviour of the spot-welded joint using a heat-simulated specimen showing similar hardness level and microstructural characteristics to an actual melting zone. To investigate the inhomogeneous mechanical properties at the spot-welded joint in a more detailed manner, Nakayama et al. [9] conducted tensile tests using micro-specimens with a gauge length of 1 mm cut from the BM, the HAZ and the welded nugget zone, respectively. Tong et al. [10] performed an in-depth observation on extensive test results of miniature tensile specimens cut from each distinct zone. The above research works, however, mainly focused on the evaluation of the inherent mechanical properties and on establishing an effective testing technique especially in the quasi-static state. Song and Huh [11] conducted failure tests of spot welds with the variation of different loading angles to evaluate failure loads as well as failure modes at each angle. As a consequence, they proposed a failure criterion in terms of the axial and shear loads to describe the failure behaviour of spot welds. A review of the literature showed that considerable research works have been mostly carried out for the solid understanding of the material behaviour of the spot-welded joint at the quasi-static state. Meanwhile, there remains a significant challenge to establish a new methodology to measure the dynamic material properties of the spot-welded joint. An accurate measurement of rate-dependent material properties is more than necessary because the material behaviour, in general, has a strong dependence on the strain rate. Furthermore, a trustworthy evaluation can be fulfilled only if the accurate rate-dependent material properties are provided in finite element analysis during crashworthiness simulation for the design process of the auto-body.
The present paper mainly focuses on suggesting a novel technique to measure rate-dependent material properties at the nugget zone in the spot-welded joint with the development of a static and a dynamic micro-material testing machine. Two types of micro-specimens are directly cut from the centre of the nugget zone (termed Specimen A) and at 1 mm away from the nugget centre (termed Specimen B), respectively, to confirm the discrepancy in the tensile properties at the nugget zone. Tensile tests are then conducted at various strain rates of 0.001, 0.1, 1, 10 and 100 s−1.
Experimental techniques
Specimen preparation
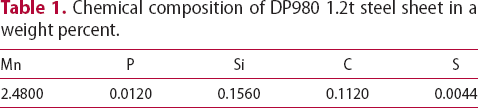
DP980 1.2t steel sheet supplied by POSCO was chosen as a base metal in this paper considering rate-dependent material properties at the nugget zone in the spot-welded joint of the AHSS sheet. A chemical composition of DP980 1.2t steel sheet is listed in Table 1, which was analysed by the energy dispersive X-ray spectrometer.
Chemical composition of DP980 1.2t steel sheet in a weight percent.
Mn
P
Si
C
S
2.4800
0.0120
0.1560
0.1120
0.0044
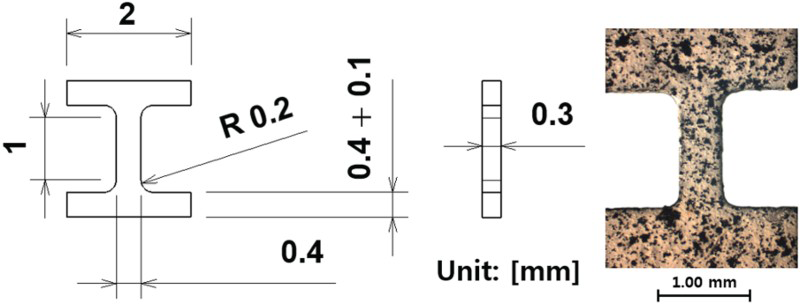
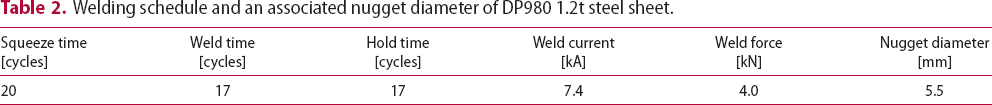
In preparation for conducting the RSWP, the specimen surface was cleaned with a weak acetone solution using cloth for the purpose of removing dirt and grease from its surface. Two identical DP980 1.2t steel plates of 120 mm long by 30 mm wide were then overlapped with each other. Afterwards, the RSWP proceeded using a static spot/projection welding machine by the welding schedules summarised in Table 2. After generating spot-welded joints, micro-specimens were cut from the centre of each welded nugget zone and at 1 mm away from the welded nugget centre with a thickness of 0.3 mm using a wire electrical discharge machine. The sampling location of the micro-specimen was designed to check the discrepancy in the material properties at the nugget zone. The gauge length of a micro-specimen was set to 1 mm which is 2.5 times larger than the width of the micro-specimen. The overall dimensions of the micro-specimen are represented in Figure 1(a).
Dimensions of the micro-specimen and the micro-specimen with a fine speckle pattern.
Welding schedule and an associated nugget diameter of DP980 1.2t steel sheet.
Squeeze time [cycles]
Weld time [cycles]
Hold time [cycles]
Weld current [kA]
Weld force [kN]
Nugget diameter [mm]
20
17
17
7.4
4.0
5.5
Strain measurement
Unlike the macro-specimen at the millimetre or larger size scale, it is impossible to measure the axial strain of the micro-specimen using the conventional extensometer or the strain gauge due to its extremely small dimensions. For this reason, the digital image correlation (DIC) method was employed to measure the strain field on the surface of the micro-specimen during the tests. In preparation to facilitate the DIC method for the strain measurement, the speckle pattern was generated on the surface of the micro-specimen coated by white spray paint with a black toner powder blown by an air gun instead of using a black spray paint to obtain the sufficient resolution for an accurate DIC analysis. Figure 1(b) shows the surface of the micro-specimen with the fine speckle pattern generated. The size of black particles was measured as the range of about 17–67 μm at the gauge region. The FASTCAM SA4 motion analysis camera was utilised at a frame rate up to 20,000 fps to obtain sequential deformation images during high-speed material tests. Grayscale digital images, 256 by 336 pixel, were captured during each tensile test with the spatial resolution of 8.5 μm pixel−1. The AF Micro Nikkor 60 mm F2.8D lens set was used for magnification with an extension tube of 70 mm. The axial strain was then computed in the gauge section using a virtual extensometer of the commercial DIC software, ARAMIS, after analysing the deformation images captured during the tests.
Micro-material testing apparatus
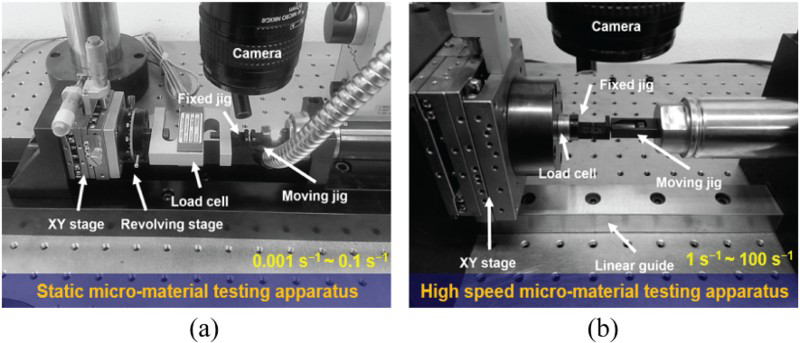
Experimental methods to evaluate the material properties of the conventional (macro-sized) specimen have been firmly established over the past few decades with the universal testing machine, high-speed material testing machines (HSMTMs) [12] and split-Hopkinson pressure bar apparatus [13]. Material testing techniques for the micro-specimen have been mainly developed under the quasi-static deformation state with various approaches using mechanical [14], piezoelectric [15, 16] or electromagnetic actuators [17-19]. Recently, the research of high-speed material testing techniques for the micro-specimen has received significant attention with increasing concerns on the structural reliability of micro-formed parts and MEMS. To investigate the material properties of the micro-specimen at high strain rates, Kim and Huh [20] developed a high-speed micro-material testing machine (HSMMTM). Kwon et al. [21] introduced a static micro-material testing machine (SMMTM) and the improved HSMMTM in consideration of accurate alignment between a specimen and the jig system and the gripping mechanism for convenient reliable testing. On the basis of the above material testing techniques, micro-material testing machines are newly developed by taking account of acquisition of the proper load and the gripping system for a target specimen of spot weld. Micro-material testing apparatus developed consists of a load measuring system, a loading actuator, a gripper, and a strain measurement system as shown in Figure 2. For high-speed micro-material tests, the material testing machine developed is designed to conduct tensile tests at the nominal strain rate ranging from 1 to 100 s−1 concerning the micro-specimen proposed with a gauge section of 1 mm in length. The servotube actuator, XTA3810 from Dunkermotoren Co., was employed to obtain a sufficient acceleration performance during tests with a maximum acceleration of 391 m s−2, a load capacity of 1860 N, and a maximum speed of 2.6 m s−1. It is worth to mention that tensile loading have to be applied after the actuator reaches to a target constant velocity. A gripping mechanism of a slack adapter type was employed for this reason in developing the high-speed micro-material testing machine.
In high-speed material tests, a non-uniform distribution of the transmitted load takes place at the specimen, the jig, and the load cell due to the influence of the inertia and stress wave propagation through the testing equipment. This gives rise to oscillation in the load signal acquired from the load cell bringing about the inaccurate evaluation of the material properties. This phenomenon, called the load ringing, can be resolved by increasing the natural frequency of the fixed jig or by measuring the load from the specimen directly using the strain gauge [12]. The former was considered in this paper since the size of the micro-specimen is too small to attach the strain gauge onto it. The natural frequency of the fixed jig designed is calculated as 14,460 Hz similar to that of the HSMTM which has great load measuring performance in the high-speed material testing with slight load ringing. The load cell utilised was a piezoelectric-type dynamic force sensor, PCB 201B02, with a maximum load capacity of 444.8 N.
For the static micro-material tests, the parts of testing equipment developed are generally similar to those of a high-speed micro-material testing machine developed except the loading system. The micro actuator MA-35 DCG-1 MLS from PI micos Co. was utilised for a loading actuator with a maximum speed of 2.5 mm s−1, a load capacity of 500 N, and a travel range of 52 mm. The load cell utilised was the strain gauge type static force sensor, SSM-250 from INTERFACE Co., with a maximum load capacity of 1000 N. For the sake of simplicity, the material testing machines developed will be hereinafter called as the SMMTM and the HSMMTM with the same name before improvements.
Rate-dependent material properties of the nugget zone
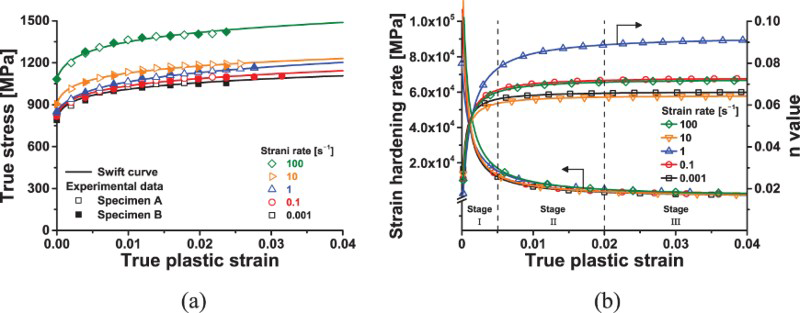
In aid of the SMMTM and the HSMMTM developed, the tensile properties of the nugget zone in the resistance spot-welded DP980 steel joint were evaluated at various strain rates of 0.001, 0.1, 1, 10 and 100 s−1. Two kinds of micro-specimens were tested to confirm the discrepancy in the tensile properties of the nugget zone: the one cut from the centre of the welded nugget zone (termed Specimen A); and the other cut at 1 mm away from the welded nugget centre (termed Specimen B). To evaluate the stress–strain response, the load–time data measured by DAQ system synchronised with the strain–time data analysed by the DIC method. Figure 3(a) shows rate-dependent stress–strain responses of Specimen A and B in the range of uniform elongation, respectively. The experimental result reveals that there is little discrepancy in the tensile properties of the welded nugget. Representative flow stress curves obtained were fitted by the Swift hardening model,
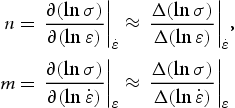
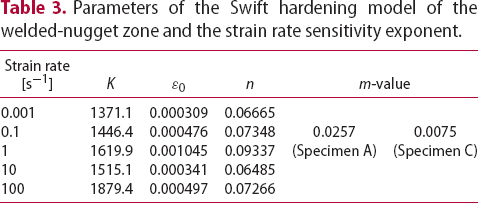
, in aid of the tensile test results up to the minimum uniform elongation at each strain rate. The parameters of the Swift hardening model are summarised in Table 3. The strain hardening exponent of n and the strain rate sensitivity exponent of m were evaluated and analysed according to the plastic deformation based on definitions as given below:
Rate-dependent mechanical properties: (a) flow stress curves evaluated from the center of the welded nugget zone (Specimen A) and at 1 mm away from the welded nugget centre (Specimen B); (b) strain hardening rate and strain hardening exponent.
Parameters of the Swift hardening model of the welded-nugget zone and the strain rate sensitivity exponent.
Strain rate [s−1]
K
n
m-value
0.001
1371.1
0.000309
0.06665
0.1
1446.4
0.000476
0.07348
0.0257
0.0075
1
1619.9
0.001045
0.09337
(Specimen A)
(Specimen C)
10
1515.1
0.000341
0.06485
100
1879.4
0.000497
0.07266
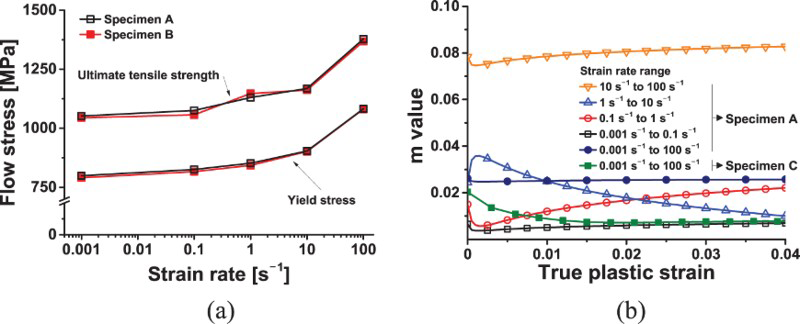
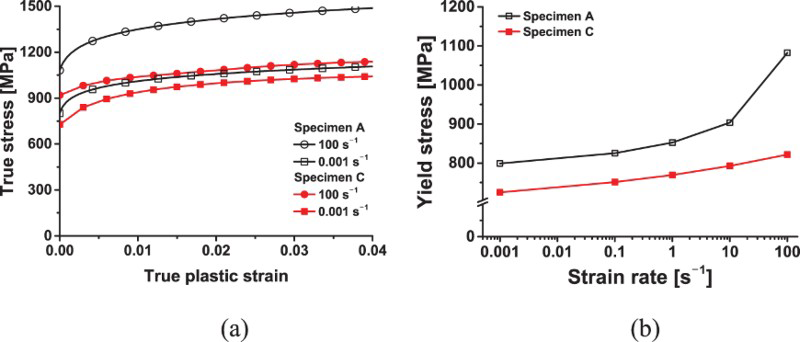
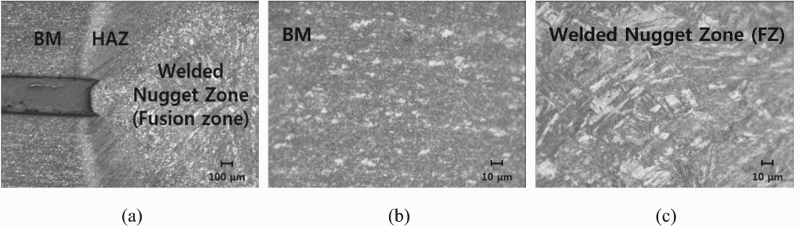
The work hardening of the nugget material has three notable stages distinguished by a change in the strain hardening rate as well as in the instantaneous strain hardening exponent as shown in Figure 3(b). In the first stage where there shows rapid work hardening rates, residual stresses due to the formation of coarse martensite phase are eliminated and back stresses are generated in the ferrite matrix, which corresponds to the flow stress curve below the true plastic strain of 0.5%. The second stage is mainly involved in the process of work hardening related to the constrained deformation of the ferrite matrix resulting from the presence of rigid martensite phase. This stage corresponds to the portion of the flow stress curve between the true plastic strains of 0.5 and 2.0%. After the second stage, the work hardening is then proceeded by the formation of dislocation cell structures, further deformation of the ferrite, and yielding of the martensite phase. Experimental results also reveal that the strain rate sensitivity exponent of m varies according to the strain rate range evaluated as well as the amount of plastic deformation as shown in Figure 4(b). Commonly, the strain rate sensitivity exponent for conventional metals belongs to 0.02−0.2 and it generally decreases in the case that the material exhibits the high strength. In the present article, the strain rate sensitivity, m, of the welded nugget zone was evaluated as around 0.0275. The strain rate sensitivity exponent obtained are summarised in Table 3, which are evaluated in an average sense by the slope of a natural logarithmic linear regression fit to the whole plastic strain range measured. The yield stress and the ultimate tensile strength show a strong dependence on the strain rate as shown in Figure 4(a). The yield stress and the ultimate tensile strength at the strain rate of 100 s−1 were 1081.4 and 1378.1 MPa, which are 35% and 31% higher than those at the strain rate of 0.001 s−1, respectively. A dramatic increase in the flow stress is observed at the plastic strains ranging from 0 to 0.01, and thereafter the strain hardening rate gradually decreases as the plastic strain increases at each strain rate. The rate-dependent material properties of the welded nugget zone were also compared with those of the base metal (termed Specimen C) as shown in Figure 5. It is confirmed that the welded nugget zone shows a notable increase in both the strain hardening and the strain rate hardening compared with that in the base metal, especially at the strain rate of 100 s−1 as shown in Figure 5(a). An increase in both strain hardening and the strain rate hardening of the welded nugget zone can be likely due to an increase in the volume fraction of the martensite and a change in the dislocation structure with the variation of strain rates. The volumetric expansion of martensite phase leads to an increase in the overall strength by introducing the residual stresses in the ferrite matrix to accommodate the martensite volume expansion: this gives rise to a high dislocation density at the ferrite–martensite interface. With respect to the increase in flow stress as the strain rate increases, Huh et al. [22] discussed the mechanism of the strain rate hardening by observing that round half-loop dislocations are replaced by straight and crossing dislocations especially at the high strain rate of 100 s−1. They noticed that straight and cross dislocations construct the dislocation-net and accelerate dislocation tangling with precipitations and other mobile dislocations. In addition, it is also shown that the dislocation density significantly increases at the high strain rate. The mutual influence of these strengthening mechanisms will impede the motion of dislocations more severely and bring about the increases in both strain hardening and strain rate sensitivity of the welded nugget zone compared with those of the base metal. Figure 4(b) supports this possible strengthening mechanism by demonstrating the increasing tendency in the strain rate sensitivity as the strain rate increases. Figure 6 shows the microstructure around the welded area which was captured by an optical microscope of Olympus BX51M TRF model.
Strain rate sensitivity evaluated from the centre of the welded nugget zone (Specimen A) and at 1 mm away from the welded nugget center (Specimen B): (a) yield stress and the ultimate tensile strength; (b) strain rate sensitivity of the welded nugget zone and the base metal (Specimen C).
Comparison of rate-dependent stress–strain responses evaluated from the welded nugget zone (Specimen A) with the base metal (Specimen C): (a) flow stress curves at the strain rates of 0.001 and 100 s−1; (b) yield stress according to the strain rate.
Cross-sectional optical micrographs of the resistance spot-welded DP980 steel joint: (a) overview of a spot-welded joint; (b) base metal; (c) welded nugget zone.
Conclusions
The rate-dependent material properties of the welded nugget zone in the resistance spot-welded DP980 steel joint were precisely evaluated at various strain rates of 0.001, 0.1, 1, 10 and 100 s−1 with the testing machines of SMMTM and HSMMTM developed. From the test results, the following conclusions were reached:
The material properties in the nugget zone could be considered as uniform since the rate-dependent material properties evaluated from each sampling location at the welded nugget zone have little difference in the entire range of strain rates.
The high strain rate sensitivity on the flow stress is observed while there is no remarkable difference in the amount of the strain hardening at each strain rate.
The flow stress evaluated from the welded nugget zone is higher than that of the base metal at each strain rate and a dramatic rise of the yield stress is observed especially at the strain rates ranging from 10 to 100 s−1 compared with that at the strain rates ranging from 0.001 to 1 s−1.
The welded nugget zone shows a notable strain hardening at each strain rate compared with that in the base metal especially at the strain rate of 100 s−1.
An increase in both strain hardening and the strain rate hardening of the welded nugget zone results from an increase in the volume fraction of the martensite and a change in the dislocation structure with the variation of strain rates, which should be further investigated more in detail.
Footnotes
Disclosure statement
No potential conflict of interest was reported by the authors.
References
1.
SchultzRA, AbrahamAK. Metallic material trends for North American light vehicles. Paper presented at: Great Designs in Steel; 2009 May 13; Southfield, MI, USA.
2.
LiY, ZhangY, LuoZ. Microstructure and mechanical properties of Al/Ti joints welded by resistance spot welding. Sci Technol Weld Join. 2015; 20:385–394. doi: 10.1179/1362171815Y.0000000028
SawanishiC, OguraT, TaniguchiR, Mechanical properties and microstructures of resistance spot welded DP980 steel joints using pulsed current pattern. Sci Technol Weld Join. 2014; 19:52–59. doi: 10.1179/1362171813Y.0000000165
5.
HaggagFM, BellGEC. Measurement of yield strength and flow properties in spot welds and their HAZs at various strain rates. Paper presented at: The ASM 3rd International Conference on Trends in Welding Research; 1992 June 1–5; Gatlinburg, TN, USA.
6.
ZunigaSM, SheppardSD. Determining the constitutive properties of the heat affected zone in a resistance spot weld. Modell Simul Mater Sci Eng. 1995; 3:391–416. doi: 10.1088/0965-0393/3/3/007
MarkiewiczE, DucrocqP, DrazeticP, Material behaviour law identification for the various zones of the spot-weld under quasi-static loadings. Int J Mater Prod Technol. 2001; 16:484–509. doi: 10.1504/IJMPT.2001.001277
9.
NakayamaE, OkamuraK, MiyaharaM, Prediction of strength of spot-welded joints by measurements of local mechanical properties. Detroit, MI, USA: SAE Internatinal; 2003. (SAE Technical Paper; no. 2003-01-2830)
10.
TongW, TaoH, ZhangN, Deformation and fracture of miniature tensile bars with resistance-spot-weld microstructures. Metall Mater Trans A. 2005; 36:2651–2669. doi: 10.1007/s11661-005-0263-4
11.
SongJH, HuhH. Failure characterization of spot welds under combined axial–shear loading conditions. Int J Mech Sci. 2011; 53:513–525. doi: 10.1016/j.ijmecsci.2011.04.008
12.
HuhH, LimJH, ParkSH. High speed tensile test of steel sheets for the stress–strain curve at the intermediate strain rate. Int J Automot Technol. 2009; 10:195–204. doi: 10.1007/s12239-009-0023-3
SharpeWN, YuanB, EdwardsRL. A new technique for measuring the mechanical properties of thin films. J Microelectromech Syst. 1997; 6:193–199. doi: 10.1109/84.623107
15.
SharpeWN, PulskampJ, GianolaDS, Strain measurements of silicon dioxide microspecimens by digital imaging processing. Exp Mech. 2007; 47:649–658. doi: 10.1007/s11340-006-9010-z
16.
LeeSJ, HanSW, HyunSM, Measurement of Young's modulus and Poisson's ratio for thin Au films using a visual image tracing system. Curr Appl Phys. 2009; 9:S75–S78. doi: 10.1016/j.cap.2008.08.048
17.
EmeryRD, PovirkGL. Tensile behavior of free-standing gold films. Part I. Coarse-grained films. Acta Mater. 2003; 51:2067–2078. doi: 10.1016/S1359-6454(03)00006-5
18.
HuhYH, KimDI, KimDJ, Application of micro-ESPI technique for measurement of microtensile properties. Adv Nondestruct Eval. 2004; 270–273:744–749.
19.
HuhYH, KimDI, KeeCD. Measurement of continuous micro-tensile strain using micro-ESPI technique. Adv Fract Strength. 2005; 297–300:53–58.
20.
KimJS, HuhH. Evaluation of the material properties of an OFHC copper film at high strain rates using a micro-testing machine. Exp Mech. 2011; 51:845–855. doi: 10.1007/s11340-010-9395-6
21.
KwonJB, HuhH, KimJS. Specimen and grain size effects of Al1100 on strain and strain rate hardening at various strain rates for Al1100. Exp Mech. 2014; 54:987–998. doi: 10.1007/s11340-014-9870-6
22.
HuhH, YoonJH, ParkCG, Correlation of microscopic structures to the strain rate hardening of SPCC steel. Int J Mech Sci. 2010; 52:745–753. doi: 10.1016/j.ijmecsci.2010.01.006

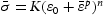 , in aid of the tensile test results up to the minimum uniform elongation at each strain rate. The parameters of the Swift hardening model are summarised in Table 3. The strain hardening exponent of n and the strain rate sensitivity exponent of m were evaluated and analysed according to the plastic deformation based on definitions as given below: