
Abstract
The higher hot cracking tendency during fusion welding in traditional high-strength 7000 series alloys has been an obstacle for its further application. In this study, the cracking susceptibility can be suppressed by fabricating Al–Mg–Zn–Cu alloys with Zn/Mg≤1 and Cu/Mg≤0.25 while simultaneously maintaining the high strength. A T-shaped device combined with non-equilibrium solidification is developed to simulate the solidification during fusion welding, and it is effective to predict the shrinkage load, temperature and solid fraction. The effect of solidification temperature range, the amount of eutectics at the terminal stage of solidification and the shrinkage load during solidification on the hot cracking susceptibility are discussed in detail.
Keywords
Introduction
The 7000 and 2000 series alloys are widely used in the field of aeronautics due to their high strength [1-3]. However, the high hot cracking susceptibility of these alloys using conventional fusion welding limited its further development. Laser welding [4] and friction stir welding [5, 6] have been successfully applied to the welding of Al alloys and are effective to suppress the hot cracking. However, the hot cracking susceptibility is a function of alloy composition [7], which provides the idea for alloy design based on the suppression of welding hot cracking while maintaining the high strength.
To develop the new alloy, the formation of hot cracking during welding needs to be explained. Strain theory [8] assumed that the grains are separated by liquid membrane at the end of solidification, and cracking will occur when the highly localized strain in the liquid membrane exceeds the critical strain. The prominent Rappaz-Drezet-Gremaud (RDG) model [9] believed that the pressure drop in the mushy zone led to the formation of microcracks caused by solidification shrinkage and tensile deformation. Recently, Kou put forward the index
 for hot cracking during solidification, where T and fs stand for the temperature and fraction solid, respectively [10-12]. However, the strain and even stress during welding solidification cannot be quantitatively measured. Therefore, it is necessary to develop a new device to record temperature, load, i.e. stress and solid fraction to quantitatively characterise the welding hot cracking susceptibility.
The authors have designed precipitation of hardened Al–Mg–Zn alloys with Zn/Mg ≤1 [13, 14]. Although the weldability of such alloy is good, the strength is not enough compared with traditional high-strength 7000 series alloys (Zn/Mg≥2.0 strengthened by MgZn2) and 2000 series alloys (Cu/Mg≥2.0 strengthened by Al2Cu or Al2CuMg). In this study, the authors developed new type of high-strength and weldable Al–Mg–Zn–Cu alloys. The welding hot cracking susceptibility of the novel alloy is simulated by the T-shaped device. Finally, the prediction based on the results of the modified T-shaped device combined with the non-equilibrium solidification behaviours are discussed in detail.
Experimental procedures
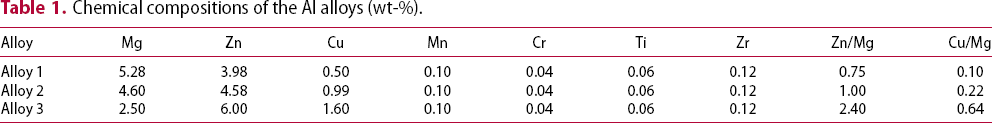
Chemical compositions of the Al alloys (wt-%).
The tensile test specimens were taken in the rolling direction with a gauge length of 25 mm and a width of 6 mm followed by ASTM E8 standards. Each reported tensile testing value was the average of three individual tests at a tensile rate of 2.0 mm min−1, which is consistent with our previous study [13, 14]. The welding specimens were taken in the rolling direction with 76 mm length and a width of 44 mm. Tungsten inert gas (TIG) welding were carried out on a universal AC/DC welding machine without using filler material. The welding current and welding speed were 100 A and 240 mm min−1, respectively, with an Ar shielding flow rate of 15 l min−1. The arc length and arc voltage were 4 mm and 12 V, respectively. The constant welding current and welding speed were used to ensure the stability of the arc. The microstructure of solidification cracks was observed using a scanning electron microscope (SEM). Image pro plus 6.0 software is used to count the percentage of microcracks in the total number of pixels among the whole SEM image. The solid fractions of alloys plotted as functions of temperature were calculated using Factsage 7.1 software based on the Scheil-Gulliver model [10-12, 15-17].
The improved T-shaped device is based on the device to simulate the solidification during DC casting. The modifications were necessary to study the load development during the welding solidification process. Here, the original linear displacement sensor was replaced with a load cell in contrast to the technique developed by Eskin et al. [18, 19] and Zhang et al. [19]. The T-shaped graphite mould was replaced with bronze, and the bottom hole was replaced by a side hole to accelerate the cooling rate compared with the device developed by Li et al. [20, 21]. The improved evaluation set-up consisted of the following major parts: a T-shaped bronze mould (A) with a moving wall (B), a water-cooled bronze base (C) and a load cell (E). To measure the load development during solidification, a special set-up (D) was used for fastening the load cell, as shown in Figure 1(a). The accuracy of the load cell is 0.05 pct of full-scale output. A K-type thermocouple (F) was used to measure the temperature evolution during solidification, which is located on the side of the T-shaped model and 5 mm below the side top of the mould. The alloys were melted in a graphite crucible with a capacity of 1 kg using an electrical resistance furnace, and cast into the T-shaped set-up. When the melt was poured into the centre of the T-shaped mould, the melt solidified at both ends first, one end was limited to the T-shaped mould end, and the other was fixed by the bolt connecting the sensor. The temperature/time/load parameters were recorded by the data acquisition system at a frequency of 20 points per second per channel, as shown in Figure 1(b). Another group of experiment without a thermocouple was used to determine whether the alloy cracks under the specific composition, as shown in Figure 1(c).
(a) The improved T-shaped device, (b) temperature and load data versus time measurements and (c) hot cracking measurement.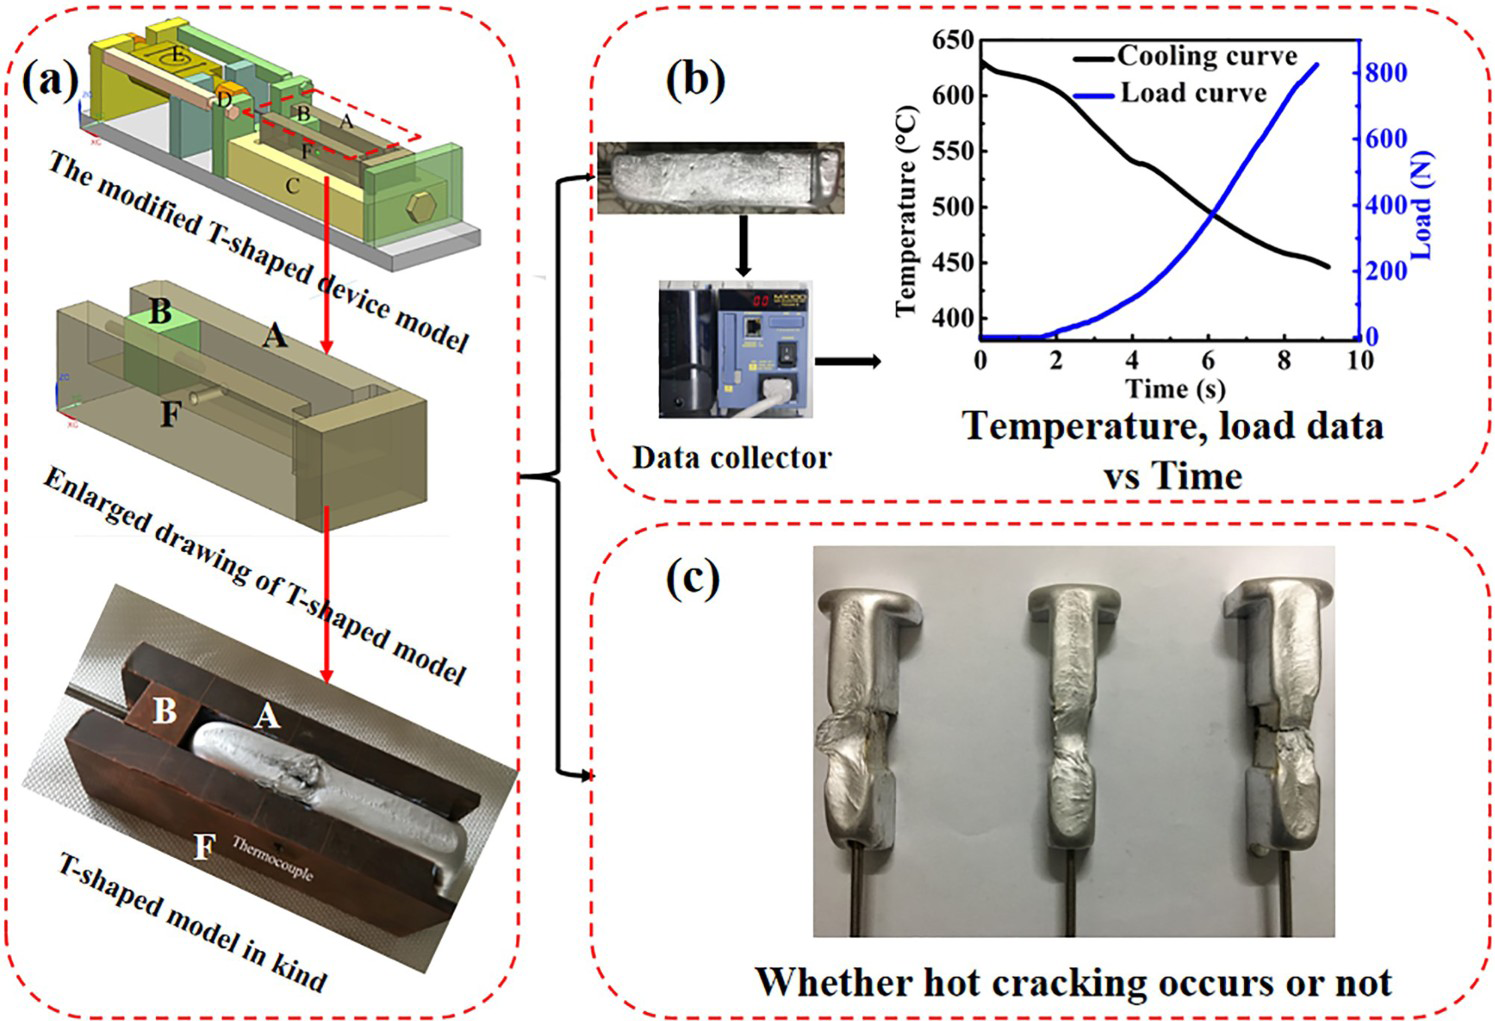
Results
Mechanical properties of the alloy
The engineering stress–strain curves, mechanical properties and specific strength of the Al–Mg–Zn–Cu alloys are shown in Figure 2. The ratio of tensile strength to apparent density of a material is called specific strength. The results show that both the tensile and yield strengths increase gradually with an increase of Zn/Mg and Cu/Mg ratios, while the elongation decreases. The tensile strength of the novel alloys can be up to 571 MPa, which is similar to that of Alloy 3. It means that the novel alloy has the same strength level compared with 7000 series alloys. The specific strength of Alloys 1 and 2 is equal to or even higher compared with Alloy 3, which is beneficial for further weight loss.
(a) The engineering stress–strain curves, (b) mechanical properties and (c) the specific strength of the alloys.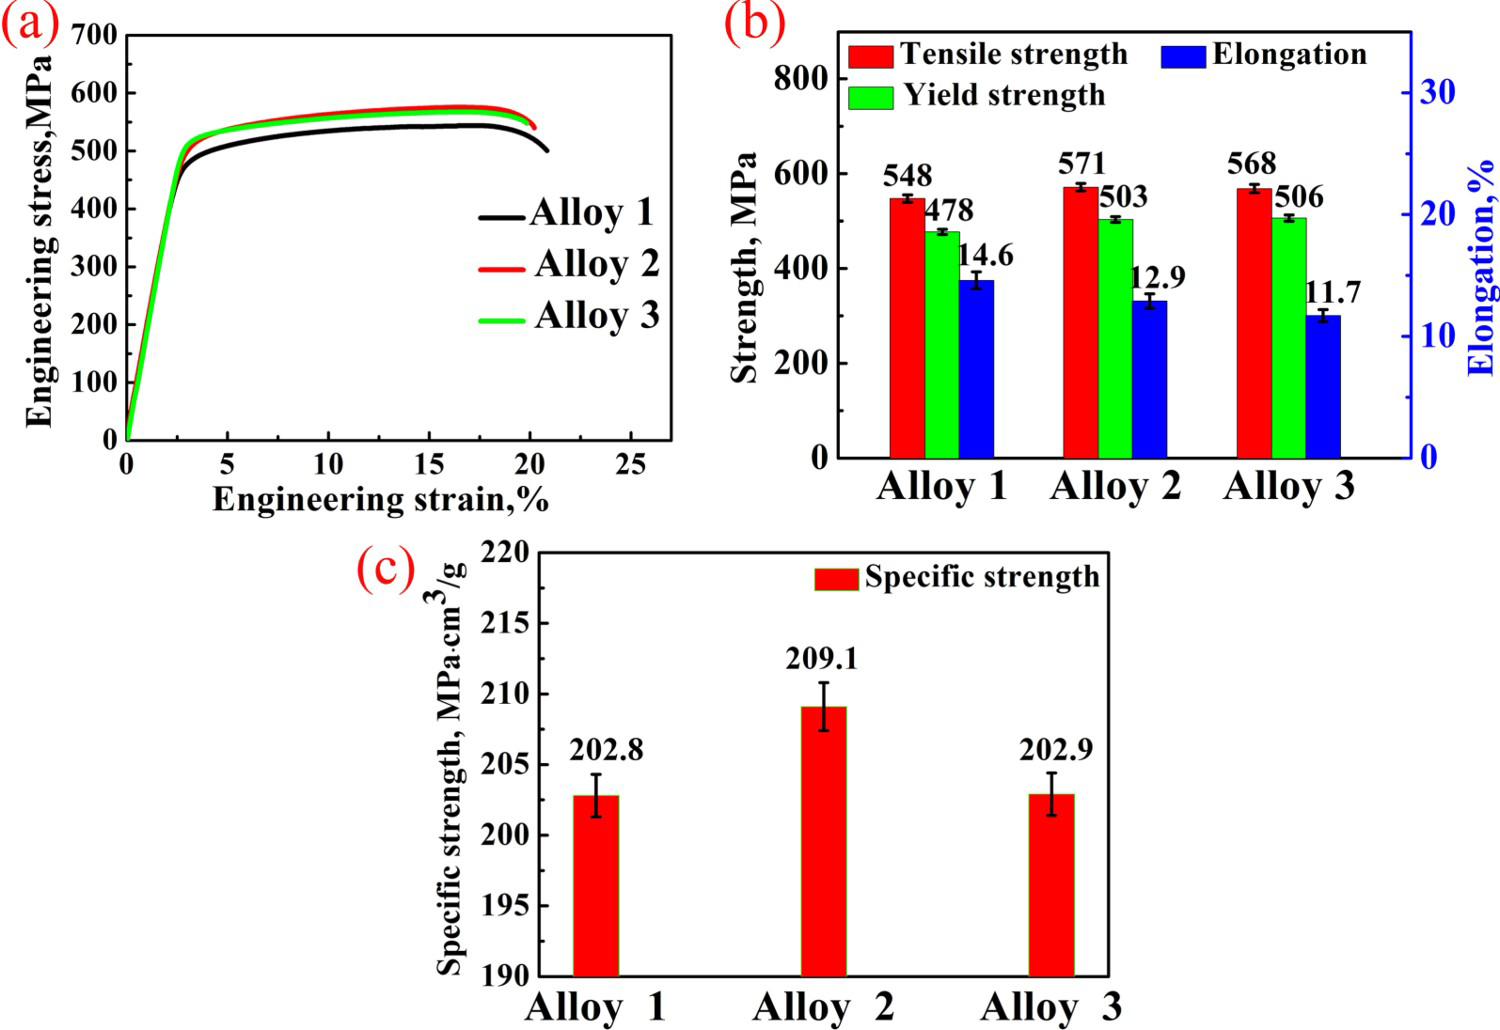
Hot cracking behaviour during TIG welding
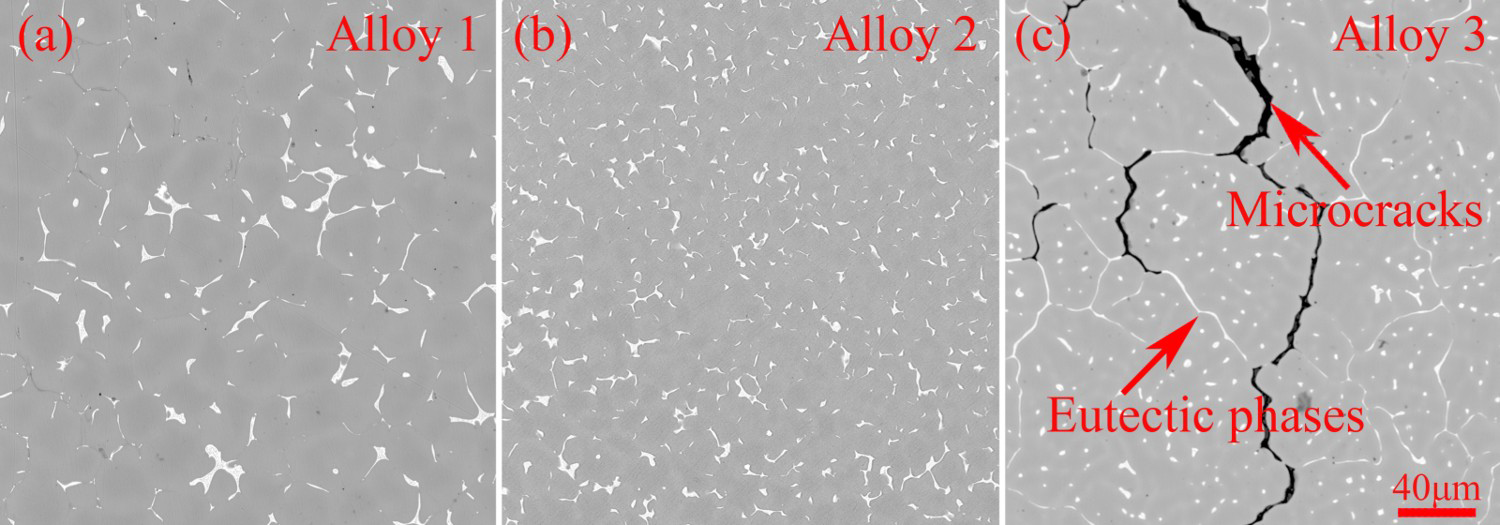
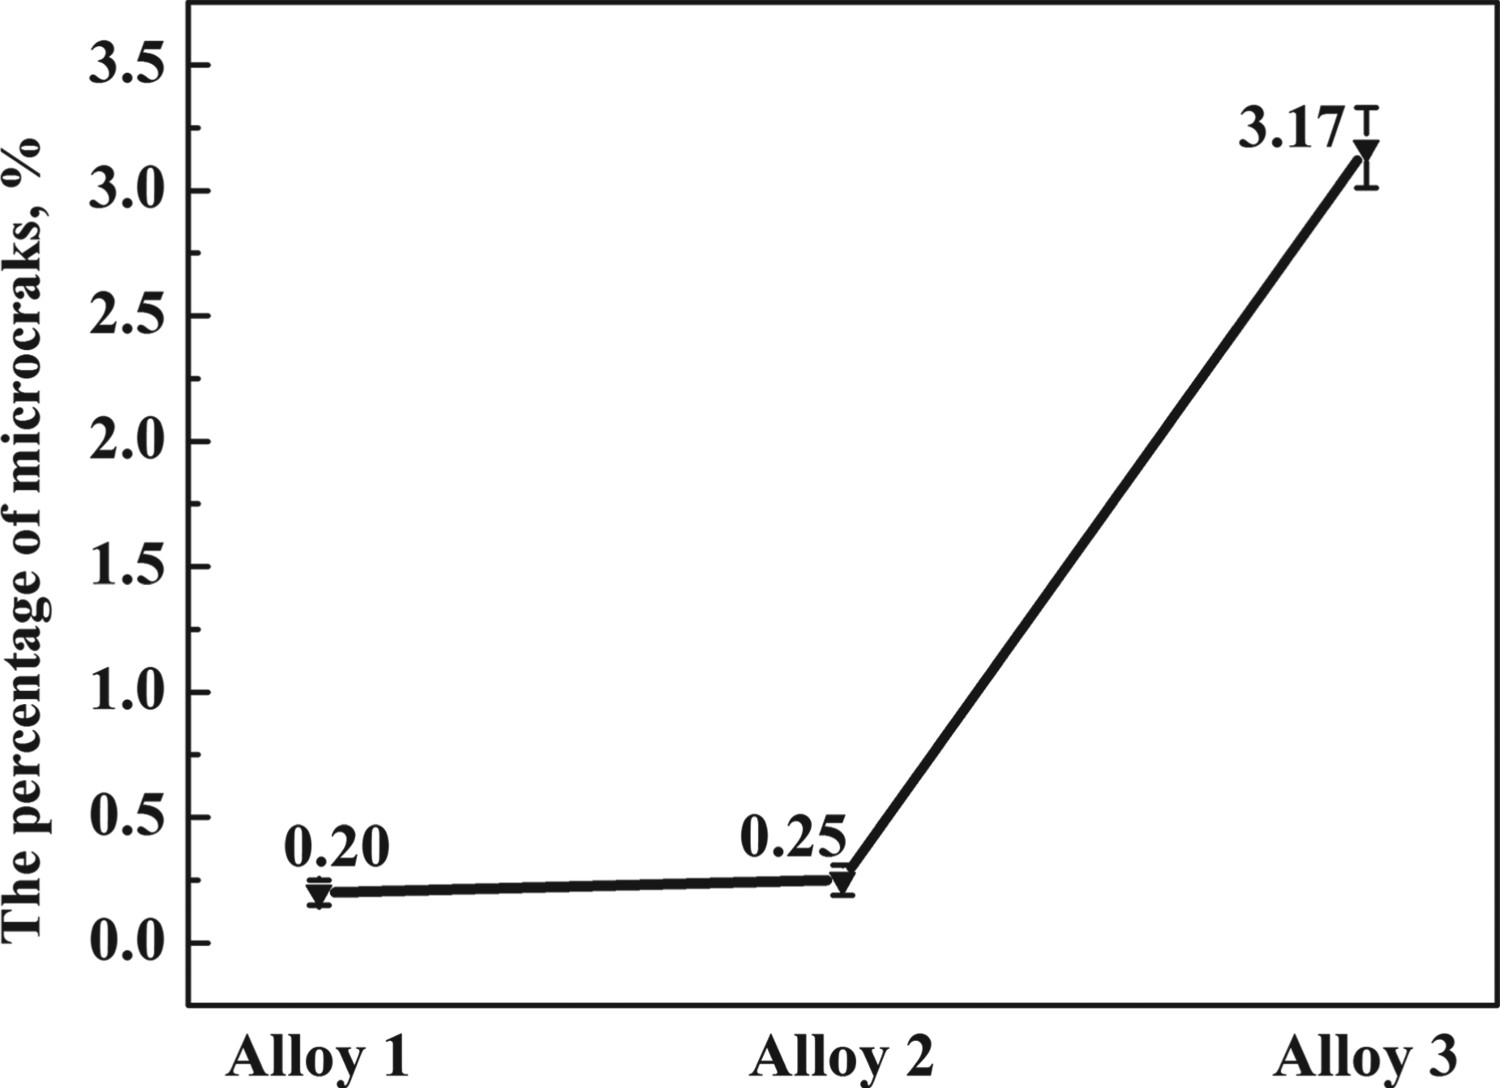
Figure 3 shows the TIG welds of the alloys. Macro-cracks do not occur in Alloys 1 and 2, while solidification cracking occurs in Alloy 3 with a crack length of about 75% of the specimen. For Alloys 1 and 2, we cannot find obvious difference just from their macro-morphology. Figure 4 shows the SEM image of the welds. Microcracks are almost invisible in Alloys 1 and 2. The hot cracking sensitivity of Alloy 3 is the worst due to the existence of a continuous eutectic phase at grain boundaries. Microcracks initiate large-scale tearing and even macro-cracks at the end of solidification. The eutectic phase of Alloy 3 is more continuous than that of Alloys 1 and 2. The number of microcracks, as shown in Figure 5, increases rapidly with an increase in the Zn/Mg ratio especially when the Zn/Mg ratio is greater than 1.0, which supports the higher hot cracking susceptibility during fusion welding in 7000 series alloys. The order of hot cracking susceptibility is as follows: Alloy 1<Alloy 2<<Alloy 3.
TIG welds of the alloys. The cross-section morphologies of the welds. The percentages of the microcracks in the welds.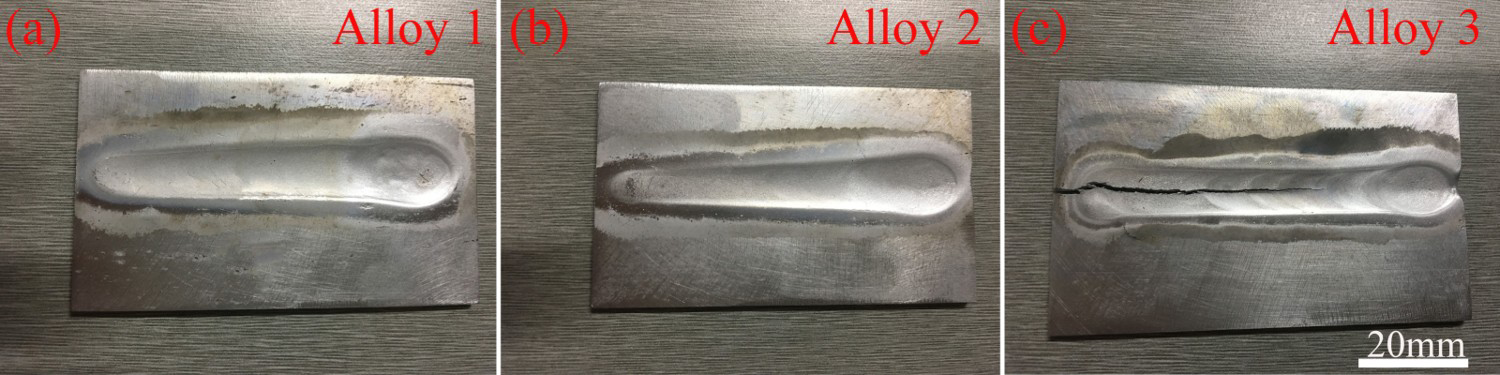
Non-equilibrium solidifications during fusion welding
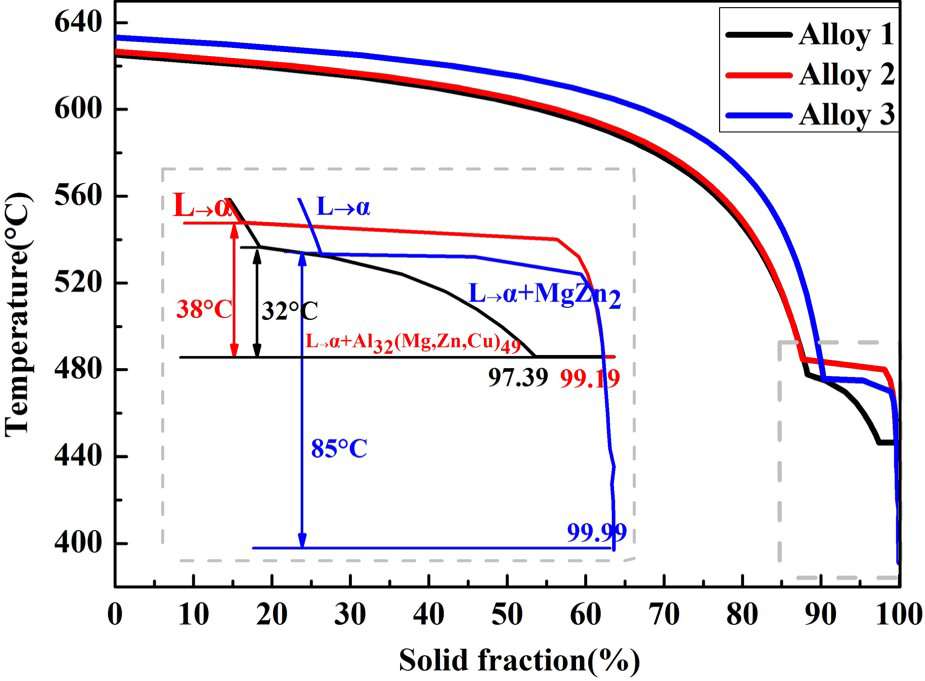
The non-equilibrium solidification behaviour was calculated by the Scheil-Gulliver model based on the following assumptions: (1) there is no diffusion in the solid phase, (2) the liquid phase is uniformly mixed, (3) the solid–liquid interface is in a local equilibrium state and (4) solidus and liquidus lines are straight lines. The derived equation [22] is as follows:
Solid fractions of alloys as a function of temperature.
 and
and
 represent the composition of solid and liquid phases at the solid–liquid interface, respectively, and the corresponding mass fractions are fS and fL. dfSand
 represent the increase in the solid phase at the interface and the remaining liquid phase. When the boundary condition fS = 0 is satisfied, k0
=CS*/CL*, and CS*=k0
C0, where C0 is the original composition of the alloy
represent the increase in the solid phase at the interface and the remaining liquid phase. When the boundary condition fS = 0 is satisfied, k0
=CS*/CL*, and CS*=k0
C0, where C0 is the original composition of the alloy

Simulated welding experiment through the improved T-shaped device
The experiment as shown in Figure 1(c) measured the hot cracking of the alloys, and the results are shown in Figure 7. It can be seen that Alloy 3 is more sensitive to hot cracking than the novel Alloys 1 and 2, which is consistent with the results of cracking behaviour in TIG welding. In addition, the measured cooling rate in the improved T-shaped device is between 11 and 24°C s−1, and it is not much different from that of the molten pool in the welding cooling stage [23]. Thus, we assume the cooling rate of the T-shaped device meets that of the molten pool during the welding process. Therefore, the hot cracking during welding can be well explained by the date acquired from the improved T-shaped ?>equipment.
The simulated welding experiment by the improved T-shaped device.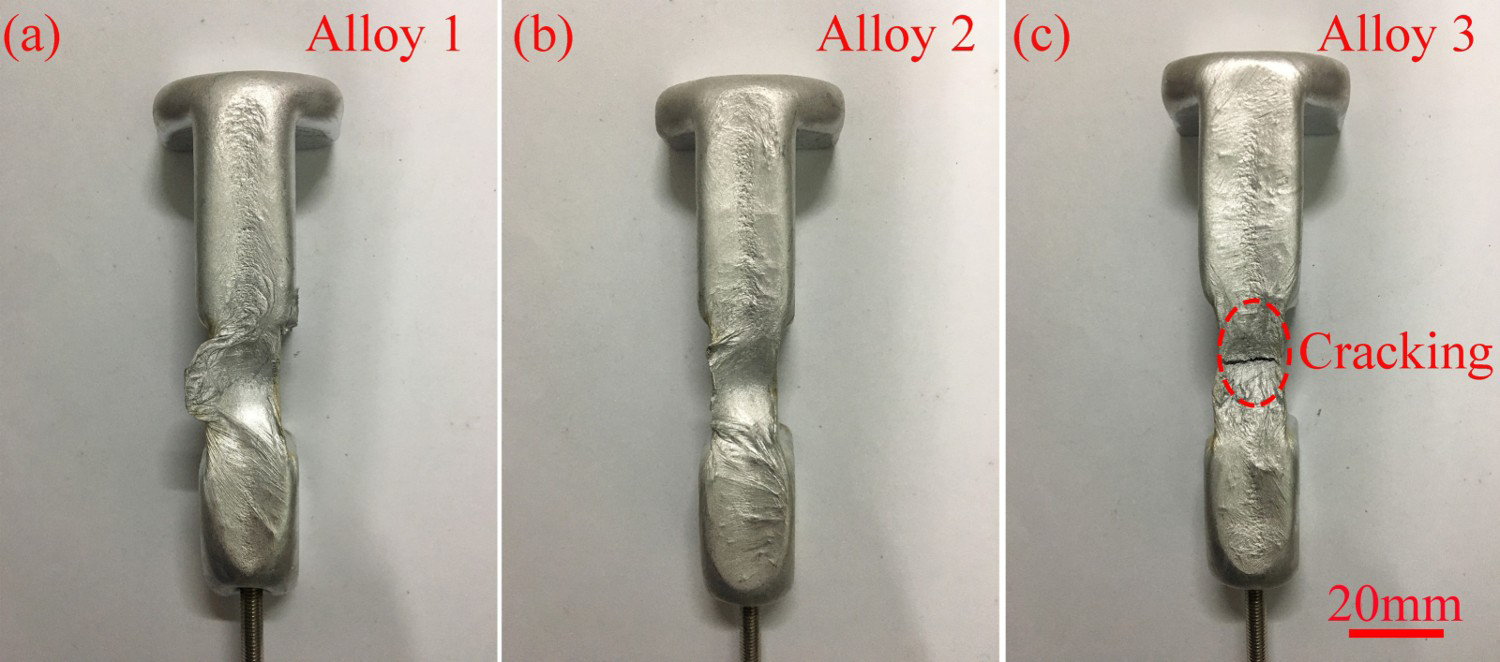
The load, temperature and the corresponding solid fraction during solidification are shown in Figure 8. With the extension of time, the load and solid fraction increase continuously during the solidification cooling process. The load relaxation phenomenon appears when hot cracking occurs. The mark on the load curve of Alloy 3 is that the appearance of load relaxation indicates the formation of hot cracking. It is obvious from the curve that hot cracking occurs in Alloy 3 while it does not occur in Alloys 1 and 2, and consistent with the results of Figures 3 and 7.
The load, temperature and solid fraction versus time for (a) Alloy 1, (b) Alloy 2 and (c) Alloy 3.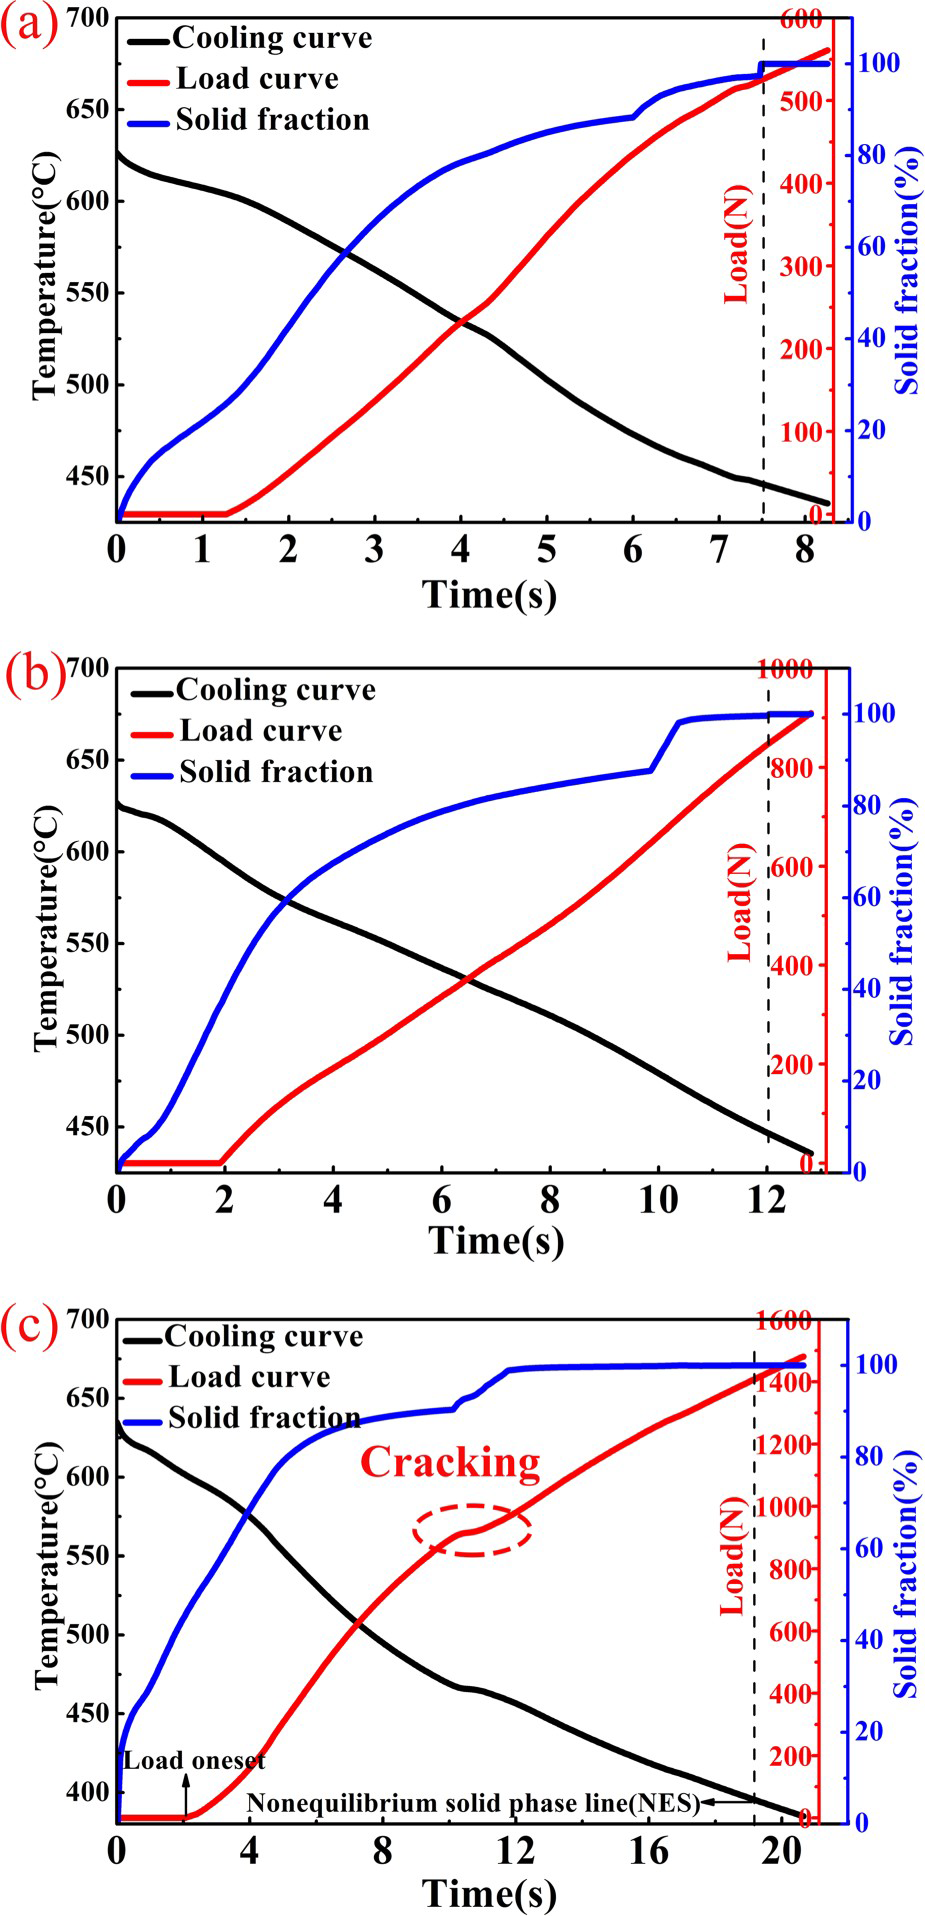
Figure 9 summarizes the load onset temperatures, the corresponding solid fraction and load at the non-equilibrium solid phase line (NES) of the alloys. The load onset began at about 600°C, and the variation of the load onset temperatures of all alloys are within 10°C. The corresponding solid fraction increases from 0.24–0.50 for all alloys. The loads of all alloys at NES are 520, 850 and 1420 N, respectively. A sharp increase of the corresponding solid fraction at the load onset temperatures and load at NES is observed in Alloy 3.
Load onset temperatures, corresponding solid fraction and load at NES of the alloys.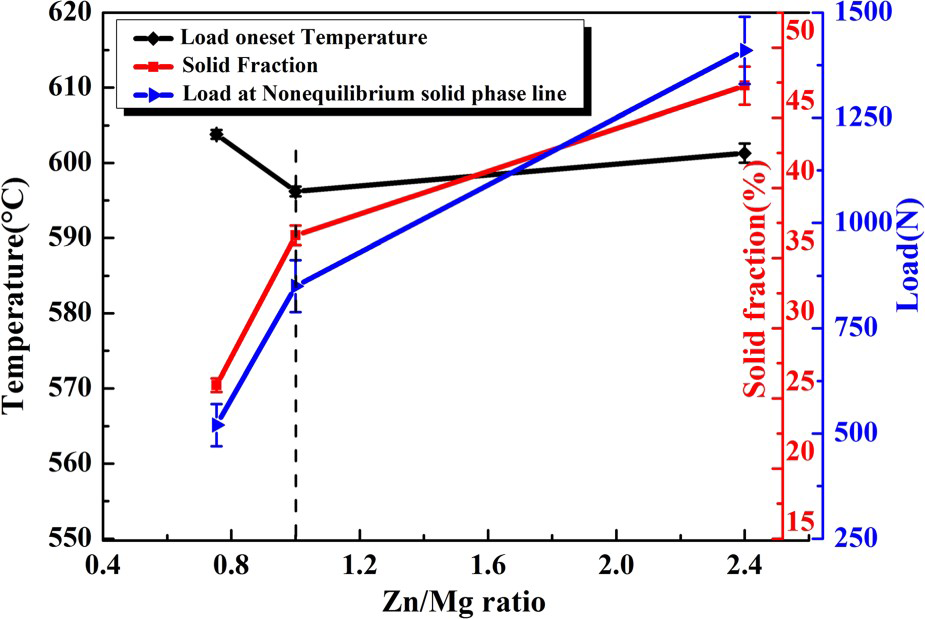
Discussion
The hot cracking susceptibility of aluminium welds is closely related to the weld metal composition of the alloy, which affects the solidification temperature range, the amount and distribution of the eutectic liquid phase at the terminal stage of solidification, and the internal stress in the mushy zone during solidification shrinkage [24-27]. In this study, the Zn/Mg and Cu/Mg ratios of the novel alloy are below 1.0 and this is the main difference of alloy composition between novel alloy and traditional 2000 and 7000 series alloys.
Generally speaking, the wider the effective solidification temperature range, the larger the mixed region of solid and liquid in the weld metal or the mushy zone. Alloy 3 has the widest effective solidification range with an increase of Zn/Mg and Cu/Mg ratios, and the time needed for solidification is higher under the same cooling condition as shown in Figure 9. Thus, the wider mushy zone of Alloy 3 leads to a weak and susceptible one due to solidification cracking. For pure aluminium, there is no low-melting-point eutectic present at the grain boundary during the terminal stage of solidification to cause solidification cracking, and thus it is not susceptible to solidification cracking. On the other hand, for highly alloyed 7000 series alloy, the solid phase of 7000 series alloy at the end of solidification is almost 100% as shown in Figure 6, and thus there is no liquid phase between grains to heal incipent cracks. However in our novel aluminium alloy, the eutectic liquid between grains at the terminal stage of solidification can be abundant enough to heal incipient cracks. A fine equiaxed dendritic structure with abundant liquid between grains can deform more easily under stresses and thus has a lower susceptibility to cracking.
In general, the lower the load onset temperatures, the slower the development of the load in the cooling process, leading to the lower shrinkage stress during solidification. The variation of the load onset temperatures of all alloys are within 10°C as shown in Figure 9, so that the effect of load onset temperatures is neglected. There is no thermal strain in the mushy zone at low solid fractions because the dendrites were free to move in the liquid. However, the thermal strain in the mushy zone tended to diffuse to the whole solidified material when the solid fraction tends towards 1.0 [27]. The corresponding solid fraction increases from 0.24 to 0.50 with an increase in the Zn/Mg ratio. A sharp increase in the corresponding solid fraction at the load onset temperatures is observed in the 7000 series alloy. This means that with increasing solid fraction of the alloy during solidification, the distributed internal stress causing incipient cracks increases in the mushy zone. When the internal shrinkage stress of the alloy reaches a certain value with continuous solidification, the thin liquid films that remain in the mushy zone at the end of solidification cannot accommodate the shrinkage stress, and thus hot cracking will occur [20].
Finally, the load at NES has been successfully used to predict the hot cracking susceptibility of Al–Cu [24] and Al–Mg–Si [28] alloys. As reported in the literature [28], the load at NES mirrored the amount of the unfed shrinkage and thus was related to the pressure drop in the mushy zone. In our study, the higher load reflects the higher pressure drop in the mushy zone, resulting in higher shrinkage stress during the welding cooling process. Therefore, there is a good correlation between the load at NES and hot cracking susceptibility. The load at NES increases with an increase in Zn/Mg and Cu/Mg ratios. In addition, the effective solidification temperature range and the load at NES of 7000 series alloy is very high, and the alloy is almost entirely solid at the end of solidification compared with novel alloys. Thus, it is easy to develop into macrocracks when primary microcracks are formed in the welding process. As for novel alloys, the effective solidification temperature range and load onset temperature are almost the same, and there is a certain liquid phase at the terminal stage of solidification to compensate the incipient microcracks. Therefore, hot cracking did not occur in novel alloys. The biggest difference between the two alloys is that the load at NES of Alloy 1 is much lower than that of Alloy 2. On the whole, the hot cracking susceptibility of Alloy 1 is lower corresponding to the statistics of microcracks as shown in Figure 5. Based on the above discussion, the load at NES is the most important parameter for predicting hot cracking susceptibility during fusion welding. Effective solidification temperature range, load onset temperatures and the amount of eutectic phase at the terminal stage of solidification are also closely related to the hot cracking susceptibility during fusion welding.
Conclusions
This study investigates the hot cracking behaviour of novel Al alloys during fusion welding by the comibination of the modified T-shaped device and non-equilibrium solidification simulation. The main conclusions are summarized as follows:
The high-strength and weldable Al–Mg–Zn–Cu alloys with Zn/Mg≤1 and Cu/Mg≤0.25 are fabricated based on the idea of restraining hot cracking during welding and precipitation hardening. The hot cracking susceptibility of novel alloys are much better than that of the 7000 series alloy during fusion welding. The more the microcracks in the welds, the worse the hot cracking susceptibility. The novel alloy has narrower effective solidification temperature range and higher liquid fraction at the end of solidification than those of the 7000 series alloy, and it corresponds to lower hot cracking tendency. The alloy begins to crack when the stress release appears during solidification verified by the modified T-shaped device. The greater the load at the non-equilibrium solid phase line, the more likely the hot cracking will occur.
Footnotes
Disclosure statement
No potential conflict of interest was reported by the authors.