
Abstract
Realising high-quality welding of the peak aged Cu–Cr–Zr alloy has always been a big challenge. Under a low rotation rate of 400
Keywords
Introduction
Cu–Cr–Zr alloy is a typical precipitation-hardened copper alloy with abundant nanoscale Cr-rich precipitates [1-3]. For this structural and functional integration material, the nanoscale precipitates contribute to the excellent strength, and the very low solubility of Cr and Zr atoms in Cu matrix ensures the high conductivity. Therefore, this alloy has been widely used in the components in metallurgy, power, and electronics fields [1-4].
The industrial application of Cu–Cr–Zr alloy unavoidably involves the welding and joining processes. However, voids and hot cracks were easily formed in the nugget zone (NZ) when adopting the fusion welding techniques [5-7]. Even if the welding defects were eliminated, it is still a big challenge to keep the good mechanical properties and conductivity of the base material (BM). Because Cu–Cr–Zr alloy is a highly conductive material, it needs very high heat input to get full penetration joints in fusion welding methods, resulting in severe grain coarsening, and dissolution/coarsening of the precipitates in the NZ and heat affected zone (HAZ) [7, 8]. Obviously, the NZ and HAZ are distinct softening zones with poor mechanical properties and electrical conductivity.
Friction stir welding (FSW), widely used in various industries [9-12], is a solid-state joining technique with much lower heat input over the fusion welding methods. Simultaneously, the severe plastic deformation involved in FSW would produce significant grain refinement [13]. Therefore, FSW is expected to be able to acquire high-quality Cu–Cr–Zr alloy joints. However, property degradation such as greatly reduced ultimate tensile strength (UTS), low strength coefficient (UTSFSW/UTSBM, 60%–65%) and poor electrical conductivity still existed in FSW joints of Cu–Cr–Zr alloys [2, 14, 15]. This is due to the dissolution and coarsening of the precipitates after the frequently used high heat input in these FSW processes.
Considering the coarsening temperature of the precipitates [16-18], when the peak temperature of the NZ is under 450°C during FSW, the precipitates would not be obviously coarsened or dissolved in the NZ and HAZ. Therefore, softening zones could be eliminated in this case. What's more, grains in the NZ could be greatly refined with the preservation of nanoscale precipitates under this low heat input FSW process [19], so that the hardness of the NZ could be increased. On the other hand, reducing the precipitate dissolution is also helpful to maintain good conductivity. In fact, the heat input can be greatly reduced by the general FSW method used in industry for the Cu alloy due to its high thermal conductivity, and some strategies, such as increasing the welding speed, decreasing the rotation rate and using stir tool with smaller shoulder, have been proven to be useful methods to reduce the heat input during FSW [12, 19].
It is well known that as the heat input decreases, material flow becomes difficult during FSW, especially for the Cu–Cr–Zr alloys with relatively high strength at high temperature [20]. In addition, complex shapes such as threads and grooves, are difficult to machine on the W-Re and PCBN tools which are frequently used for high-melting metal welding. In this case, defects are easy to form during FSW, so no studies have been performed on low heat input FSW till now. Previous studies indicated that TiC reinforced ceramics showed high hardness, low friction coefficient with metals [21] and more importantly, complex threads could be machined on them. Therefore, a cermet tool with conical threaded pin and small shoulder can be used to increase material flow around the pin under a low heat input condition during FSW.
In this study, FSW was conducted on a peak aged state Cu–Cr–Zr alloy under low heat input condition with a specially designed tool. The aim of this study is to (a) realise equal strength welding with good conductivity to the BM; (b) understand the relationship of the microstructure evolution and the improvement of mechanical and electrical properties of the Cu–Cr–Zr alloy joint and (c) verify the improvement of thread pin for insufficient material flow during low heat input FSW.
Experimental procedure
Peak aged state commercial hot rolled Cu–0.83Cr–0.14Zr (wt-%) alloy plates 2.5 mm in thickness were adopted as the BM. As shown in Figure 1(a), a TiC based cermet tool with a concave shoulder 12 mm in diameter and a conical threaded pin 5 mm in root diameter, 2.3 mm in length was employed. FSW was conducted at a constant welding speed of 50 mm min−1 with three low rotation rates of 400, 500 and 600 rev min−1, defined as R400, R500 and R600, respectively. For comparison, a W-Re alloy tool with threadless taper pin (Figure 1(b)) was employed under a rotation rate of 600 rev min−1, defined as R600W, to show a conventional FSW condition. K-type thermocouples were placed at the bottom of the interface to record the temperature histories during FSW.
Macrostructural characterisation of FSW joints and corresponding stir tools.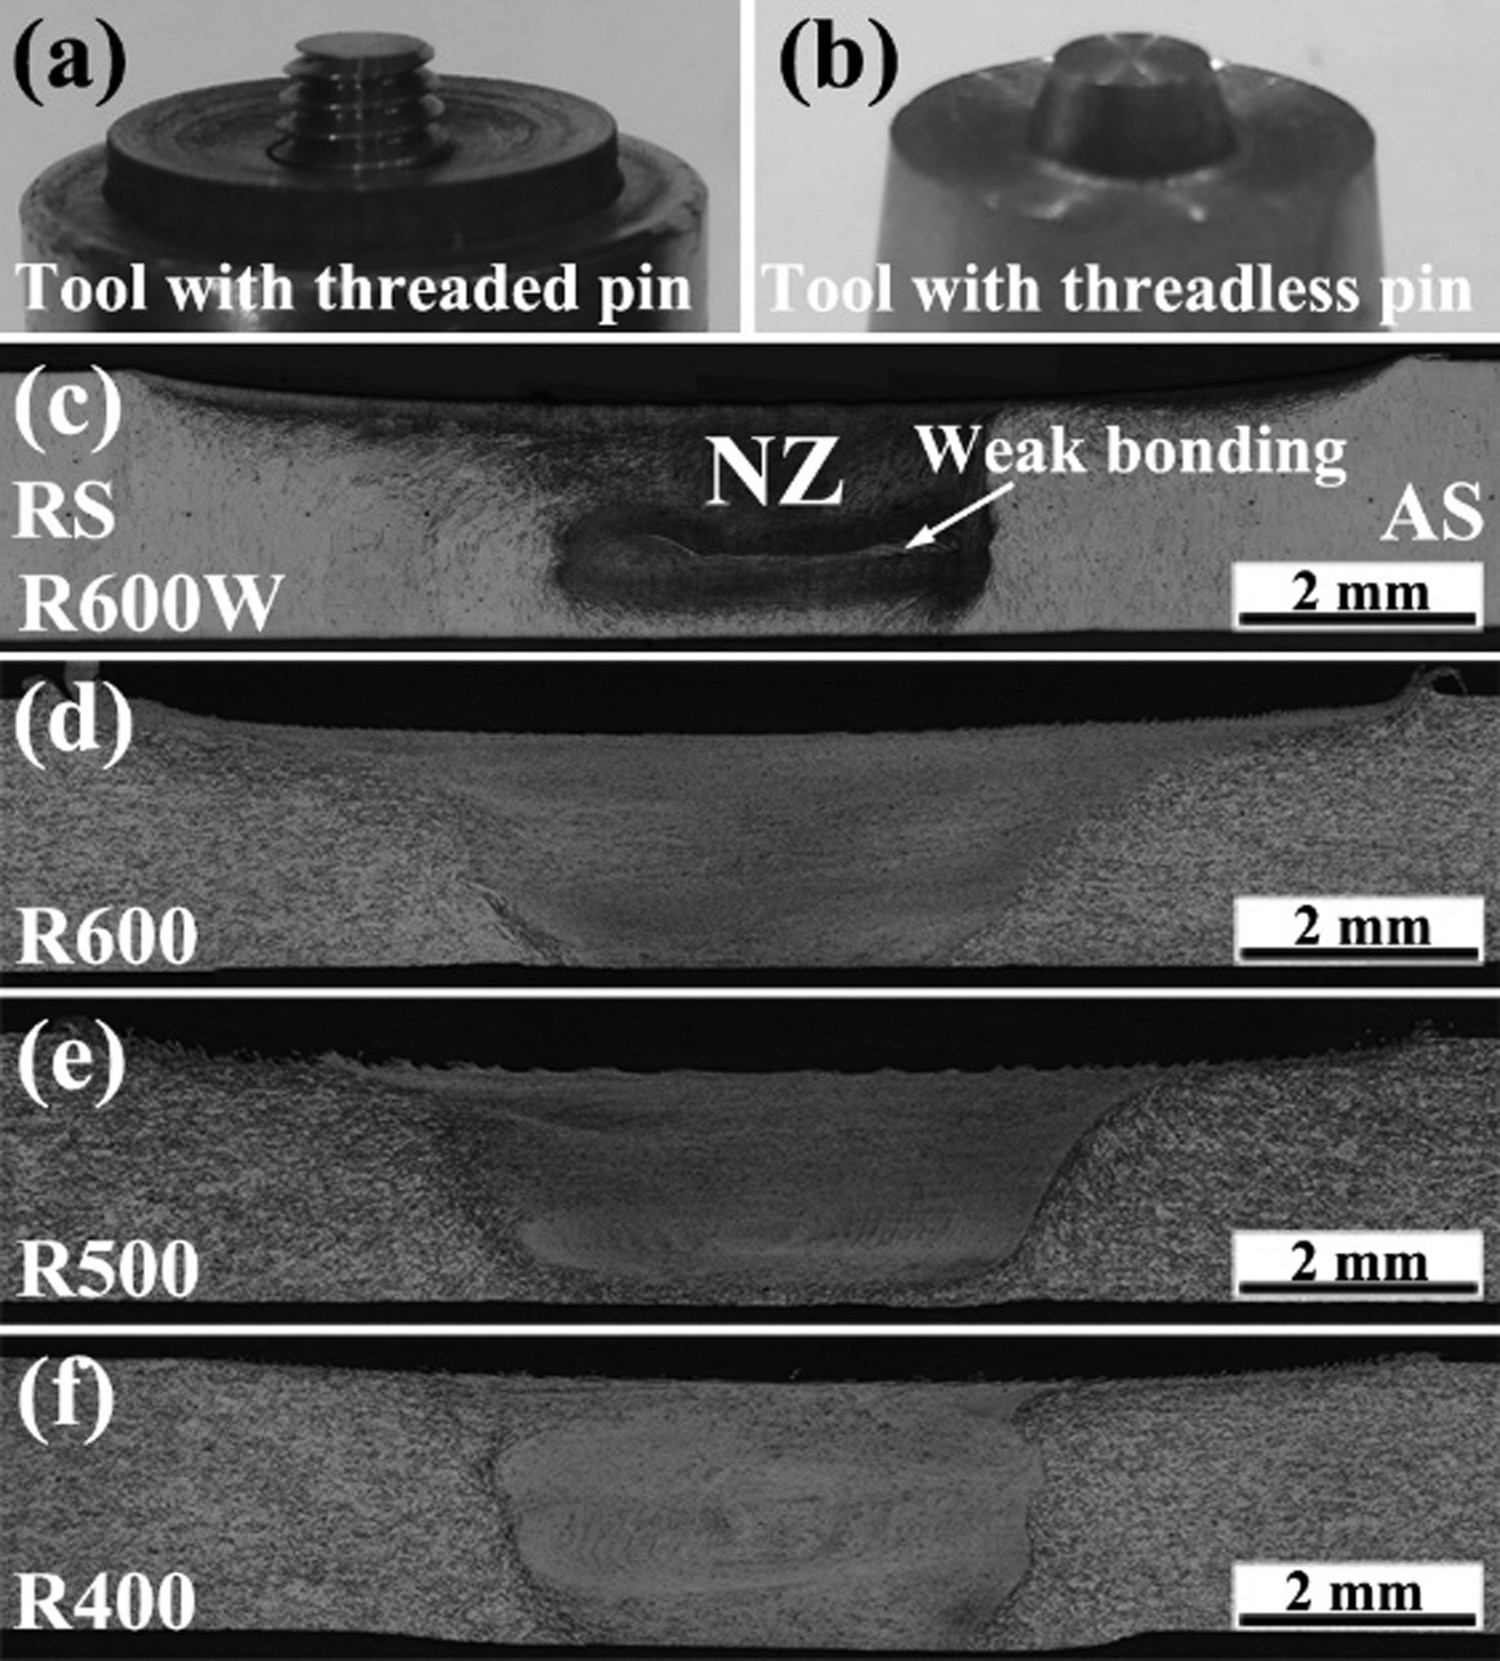
After FSW, microstructure was characterised by optical microscope (OM), scanning electron microscope (SEM) equipped with electron channelling contrast (ECC) imaging system and transmission electron microscope (TEM). The specimens for OM and SEM-ECC observation were perpendicular to the welding direction. X-ray diffraction (XRD) experiments were carried out with Cu Kα radiation. The samples for XRD test and TEM observation were parallel to the welding surface.
Vickers microhardness values were measured on the OM specimens under a load of 200 g and a dwell time of 15 s. The hardness scans were made in a grid pattern covering all the zones of the joints. Uniaxial tensile tests were conducted under an initial strain rate of 10−3s−1. Dog-bone-shaped tensile specimens (with a gauge scale of 30 mm in length and 3.5 mm in width) were machined perpendicular to the FSW direction. The electrical conductivities of the joints were measured at room temperature using the four-probe method with TH2515 DC Resistance Tester. The specimens were machined perpendicular to the FSW direction across the NZs with a length of 20 mm and cross-section area of 2 mm × 2 mm.
Results and discussion
Microstructure evolution
It is clear that weak bonding and voids appeared in the R600W joint (Figure 1(c) and S1) after FSW with conventional W-Re tool with threadless pin even under a relatively high heat input condition (600 rev min−1). Usually, the high deformation resistance of Cu–Cr–Zr alloy resulted in the inadequate material flow in the vertical direction, dividing the NZ into two parts and the weak bonding and void defects easily formed [22]. However, no voids or tunnel defects were detected in the joints under all FSW parameters with thread cermet tool. Obviously, the thread around the pin facilitates the material flow in the vertical direction and material mixture, which is consistent with previous studies [23, 24]. Therefore, the tool with threaded pin was more suitable for low heat input FSW than that of the conventional threadless pin design. In the next paragraphs, the joints obtained with the tool with threaded pin will be carefully investigated.
The peak temperature in the region near the NZ was 580°C for the R600 sample, and was only about 384°C for the R400 sample (Figure S2). The study [2] showed that when the peak temperature of the top area (shoulder affected zone) reached 1000°C during FSW of Cu–Cr–Zr alloy, the temperature difference in the NZ was about 50°C. Considering the peak temperatures of the top area of all samples in this study were far lower than 1000°C, it is reasonable to assume that the monitored temperature would be no more than 50°C lower than that of the NZ centre and can reflect the temperature in the NZ. Thus, the NZ of R400 sample would not experience temperatures higher than 450°C in this study, which was well below those detected in the previous studies (above 800°C) [2, 15].
The grain characteristics of the BM and NZs in all FSW samples, together with the statistical distributions of the grain size are shown in Figure 2. The BM consisted of coarse equiaxed grains (76 μm in size) as well as many annealing twins. It is clear that the grains were significantly refined after FSW and equiaxed ultrafine grains (UFG) were observed in the NZs. As the rotation rate decreased, the average grain sizes were reduced from 970 nm, 760 to 390 nm for R600, R500, and R400 samples, respectively. Differently, coarser grains with the size in the range of 4.5–8.2 μm were obtained in the NZ when FSW at a high rotation rate of 1500 rev min−1 [2].
(a) OM image of BM, and (b)–(d) SEM-ECC images of NZs under different FSW conditions with histograms showing the grain size distributions.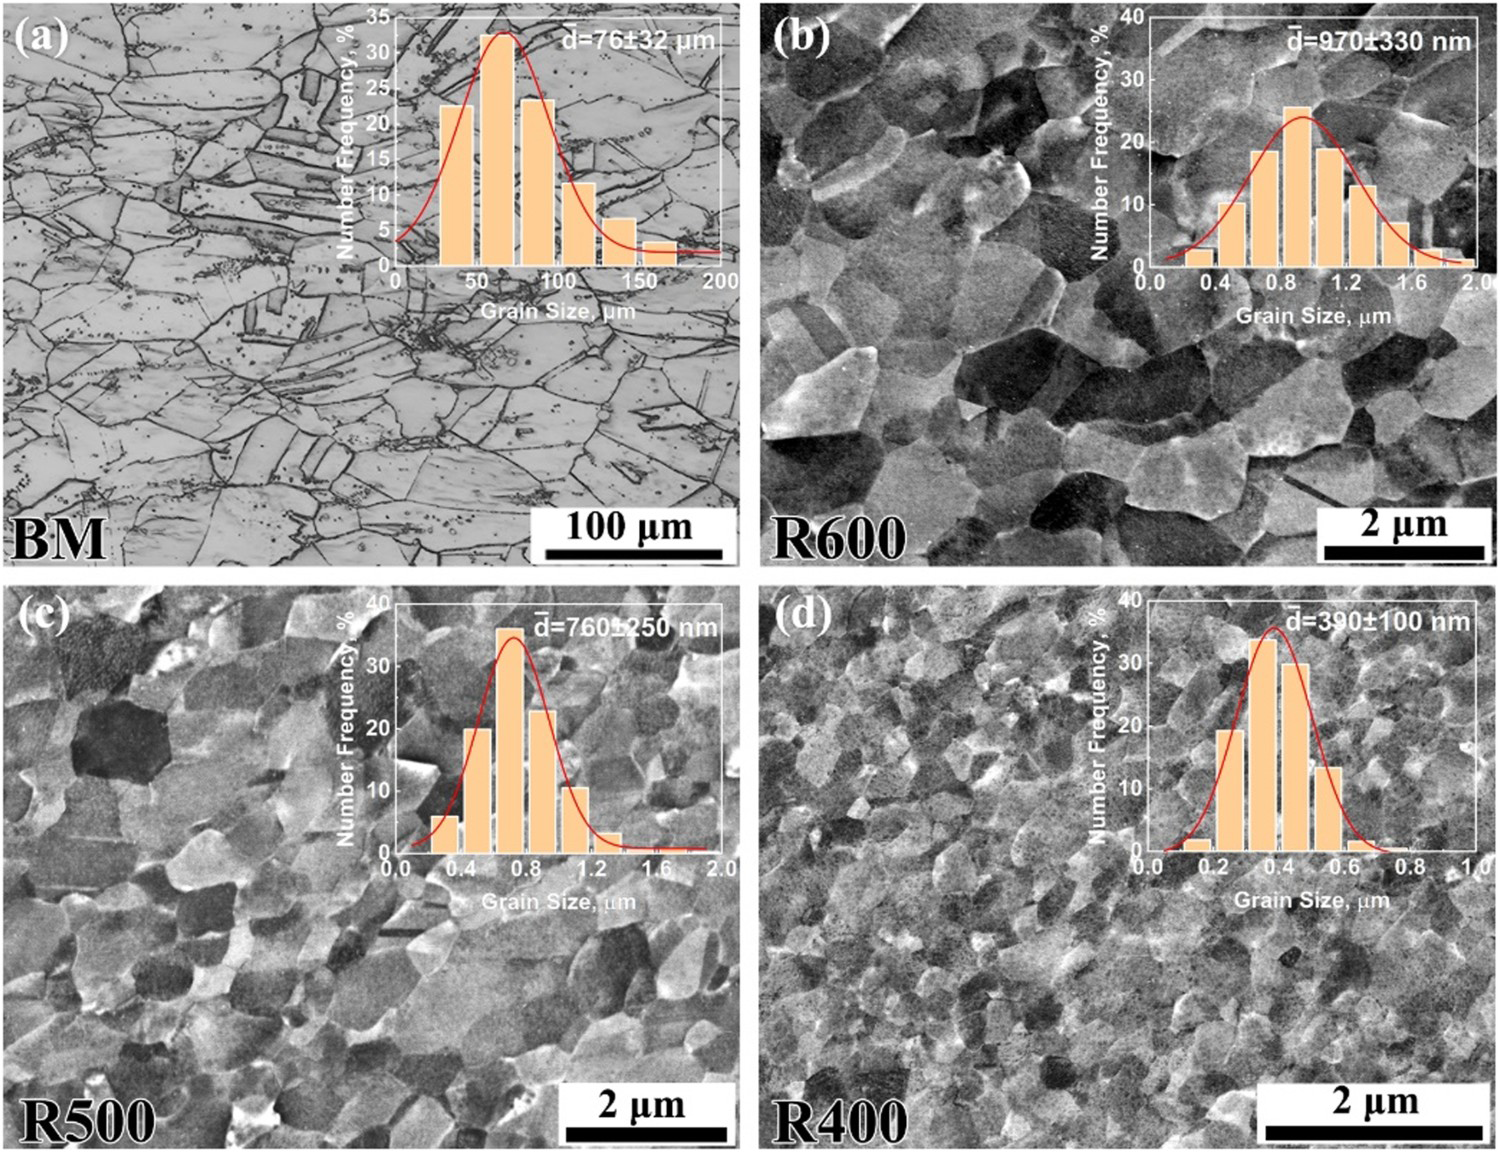
XRD patterns of BM and NZs under different FSW conditions are shown in Figure 3. The dominant peaks marked with purple dots were proved to be fcc Cu matrix. The ration of Cu peaks is not identical for the BM and full annealed pure Cu [16], which was due to the texture formed after hot rolling deformation in the BM. The intensity ratios of the typical peaks of Cu in the NZ after FSW at different rotation rate were similar to annealed Cu, which indicated that no obvious texture formed in the NZs after FSW. Besides the dominant Cu peaks, a relatively weak peak appeared at about 44.3° (Figure 3(b)), and this peak was identified as bcc Cr phase [25]. It is commonly believed that both fcc and bcc Cr-rich precipitates simultaneously existed in the peak aged state Cu–Cr–Zr alloys [26-28]. With further increasing the aging time and/or aging temperature, bcc precipitates increased and coarsened at the expense of fcc nuclei, and this is the well-known over-aging phenomenon [17, 29]. The increase of bcc Cr phase content showed by (110) Cr intensity in R600 and R500 samples implied that the NZs were in overaged state after relatively high heat input FSW. However, the bcc Cr phase almost remained constant after FSW at the lowest rotation rate of 400 rev min−1, indicating that the peak aged state was scarcely changed.
(a) XRD-spectrum of BM and NZs under different FSW conditions. (b) Close-up view of XRD-peaks at 42°–45°.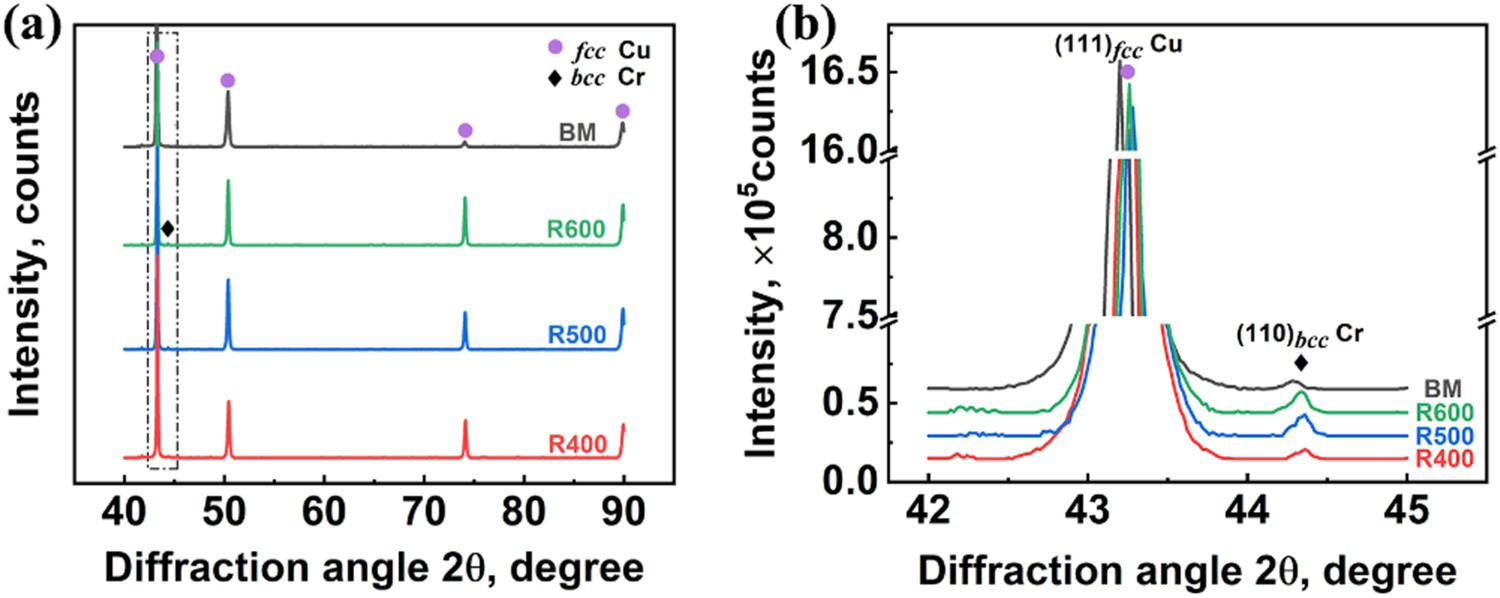
Figure 4 shows the high magnified bright-field TEM images and corresponding statistical distributions of the particle sizes in the NZs and HAZs, as well as the BM. It is clear that many nano-particles existed in the Cu matrix of all samples, which were proven to be Cr-rich precipitates [1-3, 27, 28]. The precipitates in the BM were about 2.8 nm in size, and significantly coarsened to 11.2 nm in R600 sample, while those in R400 sample (3.2 nm) were not obviously coarsened. Further, the same changing tendency also appeared in the HAZs and the precipitate size in R400 sample (2.9 nm) was almost the same as that of the BM.
(a)–(g) Bright-field TEM image of precipitates in BM, NZ and HAZ under different FSW conditions, (h) histogram of precipitate size distributions.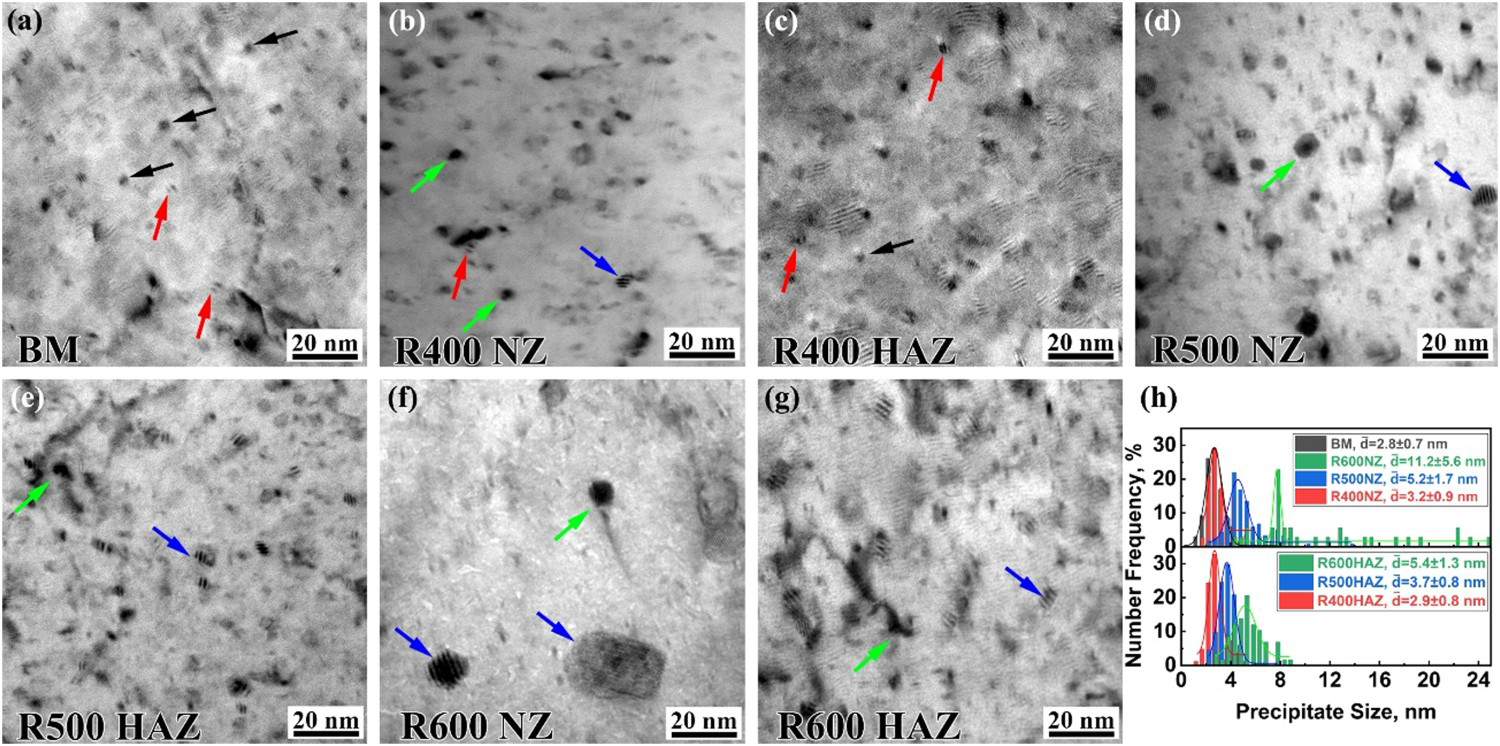
Four kinds of Cr-rich precipitates could be identified in Figure 4. The first one showed spherical shape with black or white dots contrast (shown by black arrows). The second one showed a typical coffee-bean shape (shown by the red arrows). The sphere-like precipitates can be considered as G.P. zones and precipitates with the typical coffee-bean contrasts can be identified as Cr-rich phase with fcc structure [26]. These two kinds of precipitates mainly existed in samples that were scarcely affected by the heat input (BM and HAZ of R400 sample). Because of the low peak temperature in the NZ of R400 sample (<450°C), the precipitates were scarcely coarsened, and part of them maintained the fcc structure and coherent with the Cu matrix after FSW, as shown in Figure 4(b) and (c). Obviously, the low heat input in R400 sample was beneficial to suppress the dissolution/coarsening of the precipitates. The third one showed an ellipse-like shape with Moiré fringes, as shown by the blue arrows. They were Cr precipitates with a stable bcc structure which exhibited NW or KS orientation relationship with the Cu matrix [28, 30]. The fourth precipitates were coarse dark particles, as shown by the green arrows. This type of precipitate was believed to be bcc structure, and lost the coherent relationship with the Cu matrix [26, 28]. With increasing the heat input during FSW, the precipitates gradually coarsened and lost the coherent relationship with the Cu matrix, which is consistent with the precipitation sequence and XRD results shown in Figure 3(b). The low heat input was beneficial to suppress the dissolution of the precipitates and maintain the original state of the precipitates.
Mechanical properties
The hardness contour plots at the transverse cross-section for different FSW joints are presented in Figure 5. The average hardness in the NZs of R600 and R500 samples were about 107 and 133 HV, respectively, which were lower than that of the BM (∼151 HV). Obvious softening also occurred in the HAZs of R600 and R500 samples. The width of softening zone (measured along the mid-thickness of the cross-section) of R600 sample was 11.1 mm, and reduced to 7 mm when the rotation rate decreased to 500 rev min−1. Further decreasing the rotation rate to 400 rev min−1, no obvious softening was observed in the whole joint. The average hardness value in the NZ was as high as 173 HV.
Hardness contour plots of FSW joints.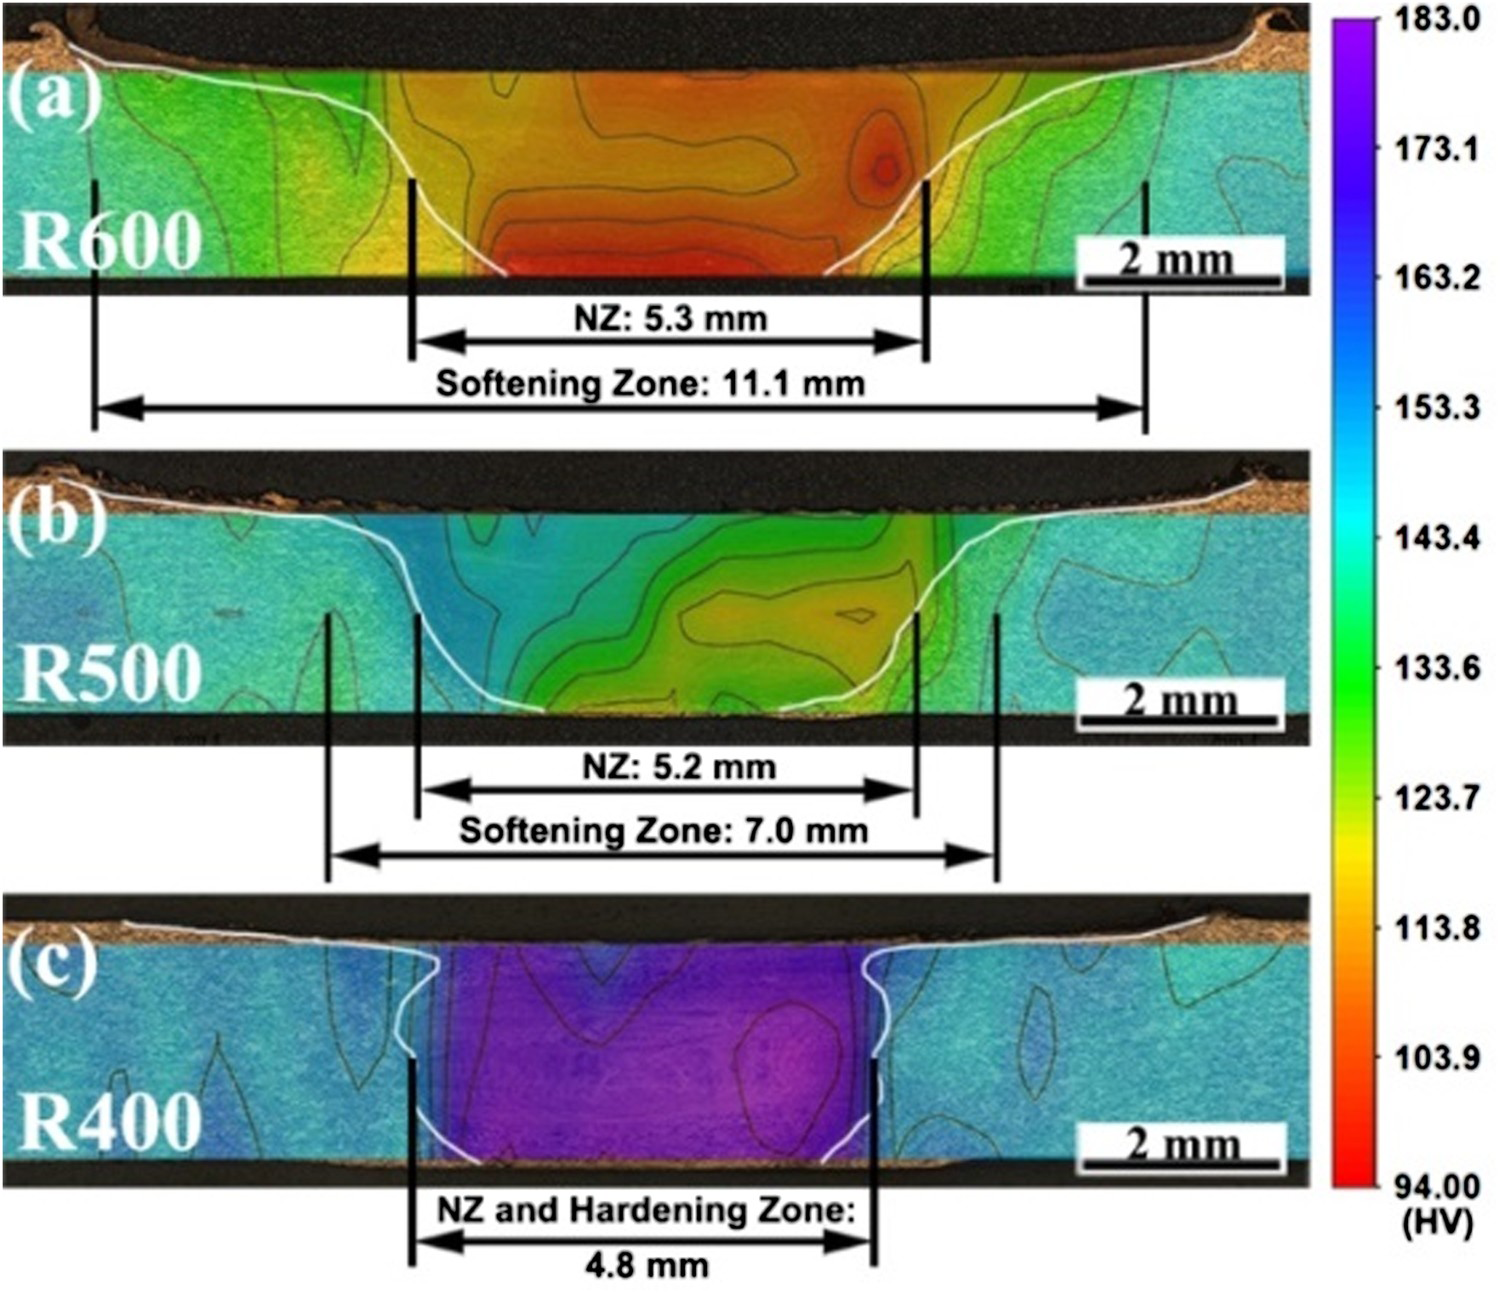
The softening in the HAZs of R600 and R500 samples were caused by the coarsening of the Cr-rich precipitates. With the decrease of heat input, the coarsening degree of precipitates was weakened, and the width of the softening zone shrank. When the peak temperature was lower than 450°C (R400 sample), the precipitates near the NZ hardly changed. Therefore, the heat affected softening zone disappeared in the R400 sample. From Figure 4, the average size of precipitates in the NZ was distinctly larger than that in the HAZ, especially in the R600 and R500 samples. The severe coarsening of the precipitates made the NZ becoming the softest area, even though the grains were obviously refined. However, the precipitates in the NZ of R400 sample were not obviously coarsened and the grains were significantly refined to 390 nm. So, the hardness in the NZ of R400 sample was higher than that of the BM.
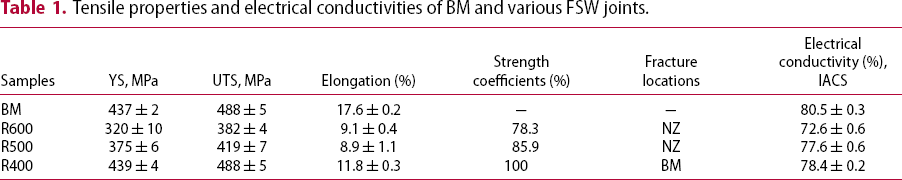
Figure 6 shows the engineering stress–strain curves of the BM and FSW joints, as well as the morphologies of fractured samples, and the tensile properties are summarised in Table 1. The BM exhibited the highest UTS of 488 MPa and the elongation was 17.6%. As shown in Figure S3, the defects severely deteriorated the tensile properties of R600W joint, and the serrated feature on the fracture surface (Figure S4(a)) confirmed the existence of weak bonding defects. As a result, the UTS decreased to 417 MPa. On the contrary, the threaded pin facilitated the material flow and avoided welding defects, so a high number of dimples were observed on the fracture surfaces of the joints (Figure S4(b)–(d)). The R600 joint showed a much lower UTS of 382 MPa due to the obvious over-aging effect, as evidenced by TEM examinations (Figure 4(f)). As the rotation rate decreased to 500 rev min−1, the grains and precipitates in the NZ became smaller than that of R600 sample, resulting in a higher UTS of 419 MPa. The R600 and R500 samples exhibited low elongations of ∼9%, which was due to the strain localisation in the softened NZs. As shown in Figure 5(c), no softening zones were found when further decreased the rotation rate to 400 rev min−1. During the tensile process, the strain concentrated on the softer BM and almost no plastic deformation occurred in the harder NZ, resulting in the fracture at the BM and the decrease of elongation of the joint to 11.8%. Therefore, equal strength welding to the BM was successfully achieved in a low heat input condition with the threaded cermet tool.
Engineering stress–strain curves of BM and various FSW joints (the inserted macrographs showing fracture locations). Tensile properties and electrical conductivities of BM and various FSW joints.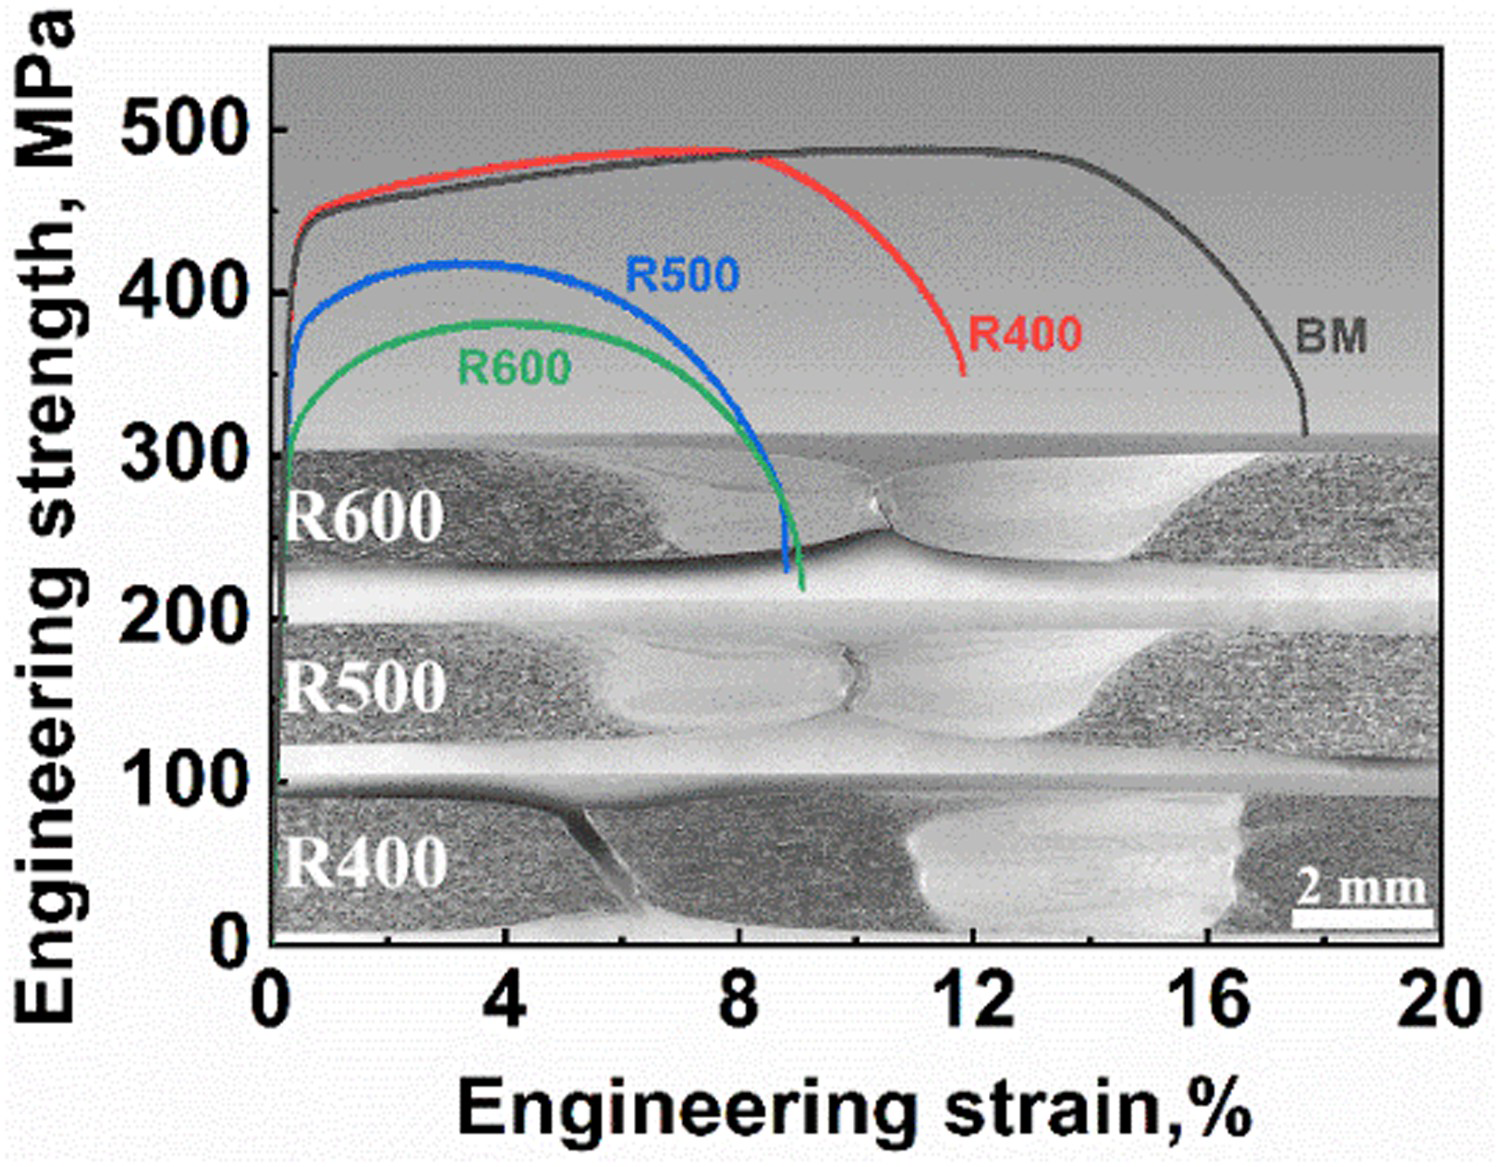
Electrical conductivity
As shown in Table 1, the BM had the highest electrical conductivity of 80.5% IACS. As the rotation rate decreased from 600 to 500 rev min−1, the electrical conductivity of the whole joint increased from 72.6 to 76.6% IACS, which were still much higher than that obtained in previous studies (45%–55% IACS) [2, 6]. The dissolution of the precipitates at high temperature is the major reason for the deterioration of electrical conductivity. In this study, the peak temperatures of R600 and R500 samples were much lower than that in previous studies [2, 15] and the dissolution of Cr/Zr atoms into Cu matrix decreased. Further reducing the rotation rate to 400 rev min−1, the electrical conductivity of the joint increased to 78.4% IACS, very close to that of the BM. Obviously, the low heat input in R400 sample was beneficial to suppress the dissolution of the precipitates, making the electrical conductivity of the entire joint hardly weakened.
In general, low heat input FSW is an efficient method of realising equal strength welding with good electrical conductivity in Cu–Cr–Zr alloys. The cermet tool with the threaded pin not only reduced heat generation at the shoulder but also promoted material flow around the pin. The low heat input suppressed the coarsening of the precipitates in the NZ and HAZ, as a result, the heat affected softening zone disappeared. On the other hand, the precipitates scarcely dissolved into the Cu matrix, making the electrical conductivity of the entire joint hardly weakened.
Conclusions
The cermet tool with threaded pin guaranteed sufficient material flow around the pin, ensuring a defect-free welding during low heat input FSW. At the same time, the peak temperature in the NZ during FSW was significantly decreased. The grains in the NZs were refined to 970, 760 nm and 390 nm with decreasing the rotation rates from 600, 500 rev min−1 to 400 rev min−1. The coarsening and dissolution of Cr-rich precipitates in NZs were gradually suppressed, and the precipitate size decreased from 11.2 to 3.2 nm. Further, the precipitates almost maintained their original state in the HAZ of the joint with a low rotation rate of 400 rev min−1. The softening zones in the NZ and HAZ disappeared and a joint with equal strength to BM was achieved when the rotation rate decreased to 400 rev min−1. Furthermore, the electrical conductivity of the entire joint was hardly weakened, only slightly decreased from 80.5% IACS for BM to 78.4% IACS.
Footnotes
Acknowledgements
This work was supported by the National Natural Science Foundation of China under Grant Nos. 52071317, and the Open Research Fund from the State Key Laboratory of Rolling and Automation, Northeastern University under Grant Nos. 2020RALKFKT009.
Disclosure statement
No potential conflict of interest was reported by the author(s).