
Abstract
High-strength age-hardenable aluminium alloys are susceptible to localised corrosion. It is vital to monitor the evolution of the corrosion depth in order to prevent a critical degradation of the mechanical properties. This study presents the application of 3D optical pattern profilometry for the analysis of the pitting corrosion behaviour of the aluminium alloy EN AW-2024-T3. Therefore, measurements were conducted using a 1 M NaCl solution at different exposure times. The measurements are compared to the results of optical microscopy investigations of metallographic specimens as well as laser scanning microscopy measurements. In immersion bath tests, the 3D pattern profilometry shows a high measurement accuracy of the pitting corrosion. Regarding the pit characteristics, corroded metal sheets exhibit an increase in the pit depth, volume and area with an increasing exposure time of up to 312 h and then decrease. Moreover, a higher increase in the width in rolling direction than perpendicular to it is noticeable.
Keywords
Introduction
High-strength aluminium alloy EN AW 2024-T3 is used in the aircraft industry due to its high strength and good corrosion resistance. However, the corrosion resistance fails if the passive layer is damaged, e.g. by chloride ions. Due to local potential differences [1], precipitation hardened aluminium alloys are highly susceptible to local corrosion, in particular pitting corrosion. Since local corrosion phenomena (furthermore also mentioned as defects) are macroscopically difficult to detect, they often cause the failure of a structural component.
The damage to the aluminium alloy EN AW 2024-T3 induced by pitting corrosion [2–8], exfoliation [2,3,9], intergranular corrosion [2] and uniform [10] corrosion has been investigated in the last years. Pantelakis et al. [2,3] investigated the development of pitting corrosion and exfoliation using immersion bath tests with solutions consisting of sodium chloride, potassium nitrate and nitric acid, called EXCO test. They found out that the mean penetration depth of the pits increase with increasing exposure time from about 50  after 2 h to 250
  after 24 h. A similar result is shown by Alexopoulos et al. [9]. In addition, Pantelakis et al. [3] noticed that the transition from pitting to exfoliation occurs after about 16 h of exposure in the EXCO solution and that the maximum penetration depth is only about 20
  using pure 3.5% NaCl solution instead of the EXCO solution at room temperature [4]. Other investigations using 3.5% NaCl solution with additives such as hydrogen peroxide [7,8] and even 3 M NaCl electrolyte solutions with an applied voltage of 0.63 V [5,6] show pitting corrosion as well as intergranular corrosion, exhibiting pit depths in the range 200– 400
  [8], respectively, 400– 600
  [5]. Since corrosion pits generally lead to an increasing local stress concentration [5,6,11–13], they are the source of crack initiation [14] and hence the reduction of the functional fatigue life time of EN AW-2024-T3 [7,8,15]. But not only the fatigue life time reduces in the presence of local corrosion, but also the yield strength and ductility decreases [2,4,9,11,16–18].
As figured out in numerical simulations, the stress concentration around corrosion defects depends on their shape [13,19]. To quantify the local corrosion, in particular pitting corrosion, the depth as well as the widths in rolling (RD) and transverse (TD) direction, the volume and the area of the resulting corrosion pits are measured using different measuring techniques. Typically, metallographic specimens [2–4,7,8] are prepared and measured using optical microscopy. Then, the defects are approximated with simple structures like ellipses [8] based on the microscopic images. Also, atomic force microscopy [5,6] or even scanning electron microscopy [12] can be used to determine the defect parameters and to quantify the corrosion state. The disadvantage of these techniques is their quite limited measuring range. Moreover, it is desirable to measure the pit shape parameters without destroying the specimen, e.g. for the inspection of component parts in service. Convenient techniques to overcome these problems are topological measurement methods, such as 3D optical profilometry [10,20,21]. The basic principle of this method is the calculation of the surface profile out of the distortion of a regular-shaped light-pattern projected onto the surface. With this method large surface areas can be scanned in a dimension shorter measuring time than comparable methods, e.g. laser scanning microscopy (LSM).
This study presents an investigation of the local corrosion behaviour of the aluminium alloy EN AW-2024-T3 over time, which is quantified by the defect parameters volume, area, depth and width in RD and TD, respectively. In order to retain the possibility of using the presented method for component parts in service, the defect parameters are determined using the nondestructive method of 3D optical pattern profilometry. A verification of the chosen measuring method is done by a comparison with LSM and made-to-measure metallographic specimens.
Material and methods
Rectangular metal sheets of standard commercial aluminium alloy EN AW-2024-T3 with the dimensions 100 mm in RD, 25 mm in TD and a thickness of 1.6 mm were used. First, the specimens were grinded along TD using 1000 mesh size SiC paper to achieve a similar surface roughness over all samples ( in RD) and to eliminate scratches. Then, the samples were corroded using immersion bath tests with 1 M NaCl solution at room temperature (RT, 294 K). After different exposure times of 24, 72, 168, 312 and 406 h (nearly 17 d) the corrosion damage was scanned using 3D optical pattern profilometry (MikroCAD by GFM Messtechnik) on both sides of the metal sheets in a predefined central area (10 mm in RD times 8 mm in TD). For surface scanning, the exposure tests were interrupted (see the above-mentioned exposure times) and the samples were cleaned in an ultrasonic bath using distilled water, rinsed with ethanol and dried in an air stream. The same procedure was also done using laser scanning microscopy (Keyence VK-X200) for several defects for comparing the results.
In order to verify both measuring methods, metallographic target preparations of predefined defects were manufactured. Afterwards, 2D profiles perpendicular to the RD through the metallographic measured pit with a step size in RD of 1  were calculated and the mean square error (MSE) between these profiles and the microscopic image profile was determined. The profile with the minimal MSE was assumed to be the corresponding 2D image of the 3D profilometry measurements.
The shape parameters volume, area, depth and width in RD/TD of the defects are calculated automatically based on the measured 3D surface profiles given as x- (RD), y- (TD) and z-coordinates, see Figure 1(a)), using a self-implemented MATLAB routine. Thereby, a single pit is detected and measured as follows:
Detection of all connected points in the z-direction (depth) which are lower than a given threshold value of Generation of a closed Delaunay Triangulation (DT) for the outer boundary points of the pit. Calculation of the volume and area using the DT. Determination of all defect points with the maximum pit depth. Calculation of the average x- and y-coordinates. The width in RD respectively TD is described by the line through these x- and y-coordinates from one side to the other, see Figure 1(b). (a) Surface profile measured using 3D optical pattern profilometry with single pits (encircled) and (b) a single pit with the defect parameters depth and width in RD and TD.
 denoting the previously adjusted surface roughness of the specimens.
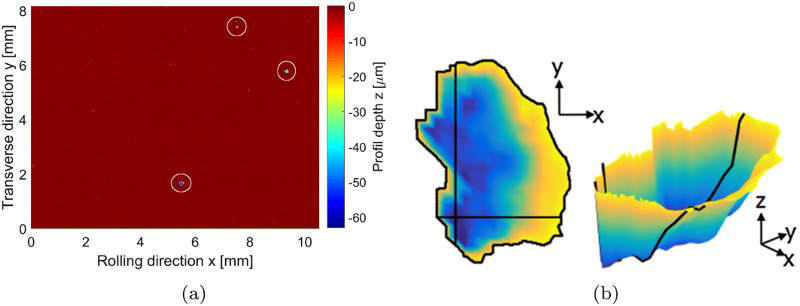
Evolution of single corrosion pits over exposure time
The experimental method of interrupting the corrosion process after defined exposure times, scanning the corroded specimens surface and continuing the corrosion process with the same specimen allows us to observe the evolution of single corrosion pits. This is shown in Figure 2 exemplarily.
Observation of a defined surface area after different exposure times: (a) 24 h, (b) 72 h, (c) 168 h, (d) 312 h and (e) 406 h.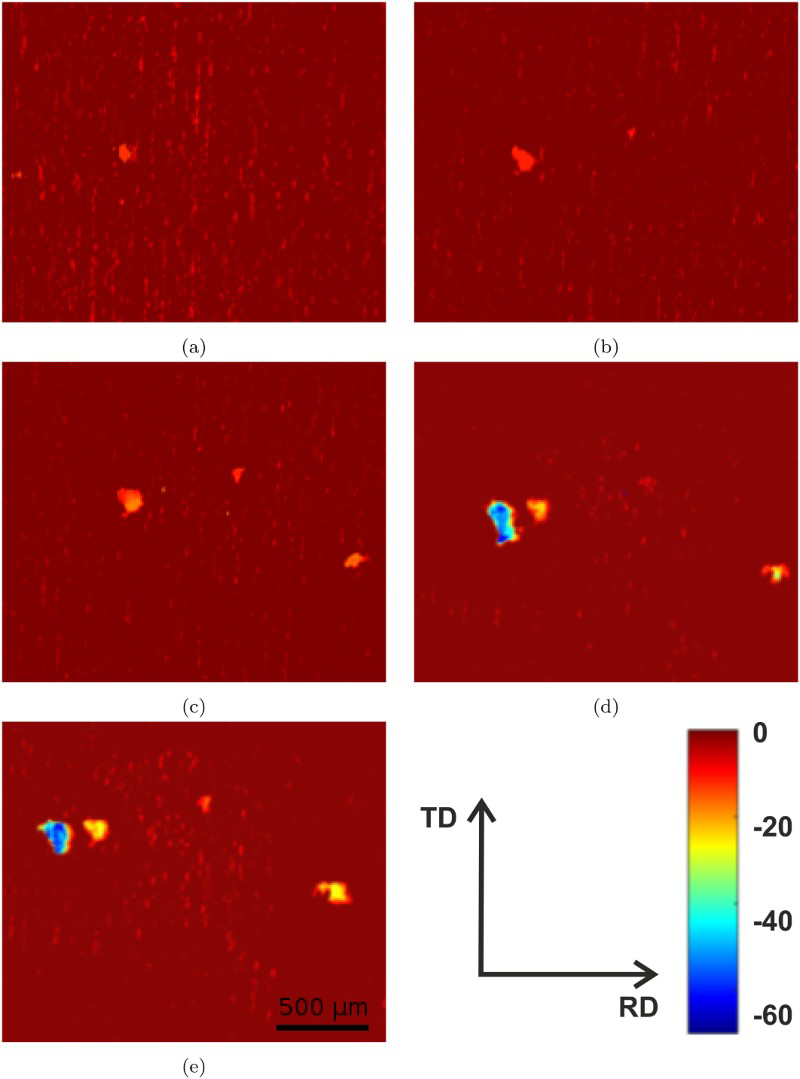
After 24 h. grinding grooves are sill visible on the surface and only some shallow corrosion pits can be distinguished. As reported by Boag et al. [22], the corrosion is typically initiated at intermetallic phases (IMP) which behave more noble than the aluminium matrix in the corrosive environment. Less noble ceAl2CuMg precipitates become enriched in Cu due to the preferential dissolution of Mg and Al and finally act as cathodes as well. After 72 h, additional corrosion pits occur, which grow in depth and width until 168 h. In this stage, the galvanic corrosion of the aluminium matrix continues. Furthermore, an alkaline environment is observed around cathodic IMP due to oxygen reduction [23]. This leads to the accelerated corrosion of the aluminium matrix. A fourth corrosion pit with a much greater depth appears 144 h on the left hand side. At the end of the test series (nearly 17 d), we can see four pits deeper than 30  and a cluster of very small pittings in the centre of the area of interest. The ‘smoother’ surface around the pits with the advance of exposure time is a hint on uniform corrosion. In addition to this, there seems to be a saturation of pit grow between 312 and 406 h. As described in the literature, the corrosion pits become covered by corrosion products in this stage and the corrosion proceeds along grain boundaries into the depth of the substrate [22].
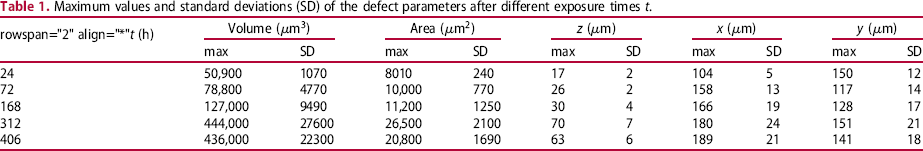
In Figure 3, the mean values of all the defect parameters over the exposure time are shown. In addition to that, the maximum values and standard deviations of the defect parameters are given in Table 1.
Development of the defect parameters (a) volume, (b) area, (c) depth and widths in RD and TD over the corrosion time for metal sheets exposed to 1 M NaCl at RT. Maximum values and standard deviations (SD) of the defect parameters after different exposure times t.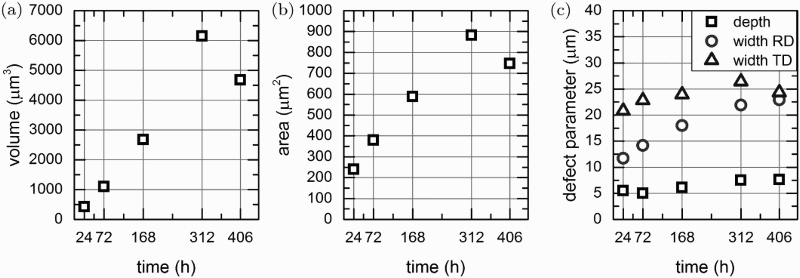
 )
) )
) )
) )
) )
)The average depths of the pits increase with increasing exposure time, see Figure 3(c), as it is also observed in the literature for EN AW-2024-T3 exposed to NaCl solutions with additives [3,8], but the maximum depth is much lower. Surprisingly, this maximum depth reaches a saturation and even decreases slightly after an exposure time of 312 h from about 70– 63  (see Figure 2). This effect was also observed in [8] without an explanation. As already discussed, a reason for the saturation might be the presence of corrosion products. An other explanation for the slight decrease could be the coincidentally occurrence of uniform corrosion during the corrosion process of EN AW-2024-T3 [4]. Huang et al. [10] showed that NaCl solutions with a nearly neutral pH value at room temperature constitutes a preferred environmental for uniform corrosion of such aluminium alloys. The mean and maximum widths in TD and RD show the same trend of increasing over the exposure time until 312 h and then decrease, see Figure 3(c). Because of the orientation along grinding grooves, the maximum width in TD is higher than the width in RD at the beginning. This changes after 72 h, indicating that the rolling direction is the preferred pitting corrosion direction because of the rolling texture. Nevertheless, the mean widths in TD are always higher than in RD. The volume and area of the pits first increase until 312 h and then decrease, as mostly seen for the other parameters, see Figure 3(a,b).
All defect parameters exhibit a high standard deviation, which even rises with increasing exposure time. This behaviour is caused due to the arising of new defects, meanwhile the large defects are getting deeper during the corrosion process.
To determine the accuracy of the 3D pattern profilometry in terms of 2D profiles, the measurements are compared to the corresponding metallographic specimens perpendicular to the rolling direction and to laser scanning microscopy measurements. The 2D shape of a reference pit is presented in Figure 4. The image shows the maximal depth of the pit and the real contour line of the actual pit shape is emphasised.
Comparison of the 2D profiles perpendicular to the RD of a pit corroded for 406 h, measured using optical microscopy of the metallographic specimen (the actual profile of the pit), laser scanning microscopy (brighter line) and 3D pattern profilometry (darker line).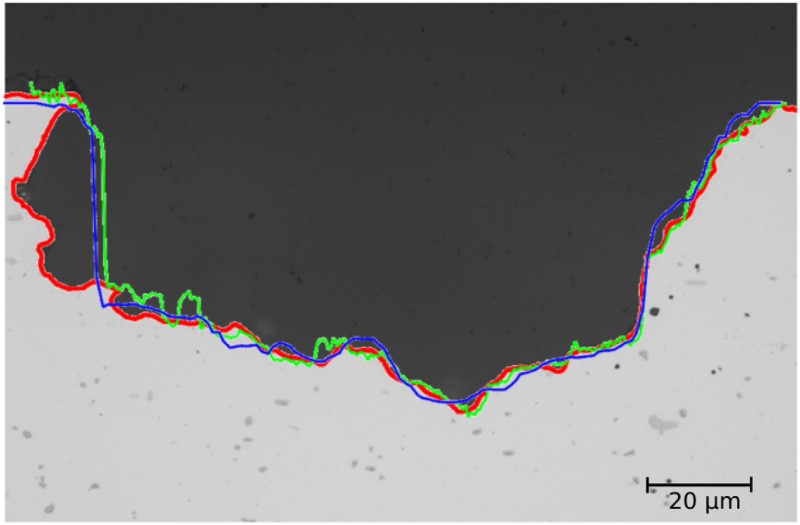
Of course, the undercut on the left flank of the defect cannot be measured by topological measurements techniques such as 3D pattern profilometry or laser scanning microscopy. Hence, to find the corresponding 2D profiles by calculating the minimal MSEs, this region is omitted. As it can be seen, the contour line of the 2D pattern profilometry profile shows a high accuracy compared to the real shape of the pit, see the darker line in Figure 4. The comparison of both topological measurement techniques, pattern profilometry and LSM, see brighter line in Figure 3, enhanced the fact that the pattern profilometry seems to be a suitable technique to measure pitting in case of minor undercuts and branches as it is seen here. It should be mentioned that comparisons of 2D profiles of other pits showed similar results. The very small increase in accuracy by LSM has to be bought by an order of magnitude higher measuring time. For typical applications like FE-simulations of parts in service damaged by corrosion, the small deviation in shape is not significant, see, e.g. [11].
The application of 3D optical pattern profilometry for the measurement of pitting corrosion was investigated on the aluminium alloy EN AW 2024-T3 exposed to a 1 M NaCl solution at RT. The metal sheets were corroded using classical immersion bath tests and the shape of the resulting pits was measured using metallographic specimens and 3D pattern profilometry. It was observed that:
Depth and width of the corrosion pits on EN AW-2024-T3 substrate increase until a saturation at 312 h. The maximum penetration depth after an exposure time of 312 h is about 70 The 3D optical pattern profilometry shows a high measurement accuracy in case of pitting corrosion caused by immersion bath tests and is a suitable technique to measure the defect parameters of the pits. Beside the defect parameters, the whole corroded surface profile of a specimen can be scanned and used in FE-simulations instead of commonly used elliptical approximations.
 and the mean value of the maximum depth as well as the area, volume and width in TD decreases until 406 h.
The presented approach of measuring the pitting corrosion in order to derive the residual strength of structures can also be transferred to other high-strength aluminium alloys, e.g. EN AW-7075-T6.
Footnotes
Acknowledgments
Financial support was granted by the Deutsche Forschungsgemeinschaft (German Research Foundation) via the project LA 1274/36-1.
Disclosure statement
No potential conflict of interest was reported by the authors.