
Abstract
The susceptibility to localised corrosion of the high strength alloys, AA2050-T84 and AA7050-T7451, used in the aerospace industry, was investigated in this study by localised electrochemical techniques, specifically, scanning vibrating electrode technique (SVET) and scanning ion-selective electrode technique (SIET), in 0.005 mol L−1 NaCl solution. The study was initially carried out using both alloys individually and then, coupling the two alloys and evaluating the effect of galvanic coupling between them. The results revealed that the AA2050-T84, being nobler than the AA7050-T7451, presented higher corrosion current density values when tested in isolation and the depth of corrosion penetration was significantly deeper in the AA2050-T84 alloy than in the AA7050-T7451. However, galvanic coupling of the two alloys resulted in cathodic protection of the AA2050-T84 alloy and a reduction in corrosion current densities on both alloys.
Introduction
Aluminium alloys are becoming increasingly popular in the transport sector due to the continuous efforts to reduce CO2 emissions through lightweighting. In this regard, new generation alloys (Al–Cu–Li alloys) are being developed to replace conventional aluminium alloys. The new generation alloys from the 2xxx series, such as the AA2050, have been developed to replace conventional high strength 2xxx and 7xxx series (including AA7050) of aluminium alloys. However, because of different property requirements from zone to zone on certain components and from adjoining components, joining and or welding of both the new generation alloy (the AA2050 for example) and conventional alloys (the AA7050 as an example) may still be necessary for practice. Apart from the fact that these alloys are highly susceptible to localised forms of attack individually, galvanic corrosion associated with the potential differences between the alloys may also arise.
Al–Cu–Li alloys are susceptible to various forms of localised corrosion, depending on their microstructure including the distribution of the intermetallics and hardening phases that control their local electrochemical behaviour [1,2]. The main phase responsible for hardening in these alloys is the T1 (Al2CuLi) phase, and its influence on the corrosion resistance of Al–Cu–Li alloys is major, resulting in galvanic coupling with the matrix, where the T1 phase acts initially as an anode due to Li in its composition. T1 phase precipitates preferentially at dislocations, subgrain and grain boundaries, and it leads to corrosion due to its high electrochemical activity. The grains with higher T1 phase density are more electrochemically active than the other grains [1,3 8].
The corrosion susceptibility of the AA2050-T84 alloy depends on its metallurgical state that affects the distribution and preferential precipitation of the T1 phase in the microstructure [6,7,9]. Guérin et al. [6] studied the corrosion susceptibility of the AA2050-T84 alloy with different tempers and showed that the corrosion behaviour was dependent on the alloy structure which influenced the precipitation sequence, leading to different types of corrosion, such as intergranular or intragranular corrosion, according to the preferential sites of T1 precipitation.
The AA7050-T7451 alloy was developed to combine mechanical strength, damage tolerance, stress corrosion cracking resistance and toughness [10,11]. Alloying elements such as Cu and Zn are used in the 7xxx series in order to increase their mechanical properties [12]. As the solubility of Zn in Al is limited, Zn-rich second phase particles are formed. These precipitates have a deleterious effect on the alloy corrosion resistance due to galvanic coupling between the precipitates and the matrix [11]. In the case of the AA7050-T7451, the main strengthening particles distributed in the Al matrix are the η (MgZn2) phases which are anodic relative to the matrix and favour intergranular corrosion (IGC) in sodium chloride solutions [10,13 19]. This is due to potential differences between the precipitates at the grain boundaries and the matrix.
Investigating the localised corrosion resistance of the AA2050 and AA7050 alloys is very crucial since these alloys are being considered for use in the aerospace area. Lequeu et al. [20] compared the AA2050-T84 to the AA7050-T7451 and found that the Al–Cu–Li alloy (AA2050) presents improved resistance to stress corrosion than the AA7050, besides its 5% lower density compared to the AA7050 alloy, which translates to less fuel usage [20]. Despite the work of Lequeu et al. [20], there are only a few reports in the literature comparing the differences in the corrosion behaviour of the AA2050 and AA7050 alloys and their galvanic interactions when coupled together. Understanding the galvanic interactions between these two alloys is important as the need for welding components made from the two alloys may arise in practice.
In the present study, the corrosion resistance of the AA2050-T84 and AA7050-T7451 alloys and their galvanic interactions were investigated by scanning vibrating electrode technique (SVET) and scanning ion-selective electrode technique (SIET) alongside microscopic techniques to examine the extent and morphologies of corrosion in these two alloys. SVET and SIET are very useful techniques to evaluate galvanic activities [21,22] and localised corrosion resistance [23,24].
Materials and methods
Chemical composition (wt-%) of the AA2050-T84 and AA7050-T7451.

Samples preparation
Samples of the AA2050-T84 and AA7050-T7451 aluminium alloys were sequentially ground with SiC papers of #400, #800, #1200, #2000, #2500, #4000 grit sizes and then polished with diamond pastes of 3 and 1
μm. After polishing, the samples were ultrasonically cleaned with ethanol, rinsed with deionised water and dried under a cold air stream.
Microstructure characterisation and surface observation
The surfaces of the AA2050-T84 and AA7050-T7451 samples were observed by Optical Microscopy using a Leica DMLM coupled optical microscope (MO) and a HITACHI TM3000 scanning electron microscope (SEM) operating at 15 kV.
TEM samples were prepared by twin-jet electropolishing. The samples were initially ground to a thickness lower than 200 µm. Discs of 3 mm diameter were then cut before the electropolishing process which was carried out using a solution of 35% nitric acid in methanol at −20°C. A JEOL JEM 2100 transmission electron microscope equipped with an energy dispersive X-ray spectrometry (EDS) detector was used.
Electrochemical characterisation
Open circuit potential (OCP) measurements were obtained for 7 h (25 200 s) in a naturally aerated 5 mM NaCl solution at room temperature. SVET was used for local electrochemical investigation, using an Applicable Electronics TM SVET equipment which is controlled by an Automated Scanning Electrode Technique ASET 4.0 (Science Wares TM). The vibrating electrode used in this technique was an isolated Pt–Ir electrode. A 15-μm diameter platinum sphere was electrodeposited at its tip before starting SVET measurements.
Calibration of the test equipment was carried out using a 60 nA current with the calibration electrode, which was positioned 150 μm from the vibrating electrode. The conductivity of the solution was inputted in the ASET 4 software. Based on the inputted value, the potential difference was measured and automatically converted to current density values.
For the SVET tests, the electrode, which vibrates in the planes perpendicular (Z) and parallel (X) to the sample surface, was located at (100 ± 9) μm above the sample surface. The amplitude of vibration was 19 μm, and the vibration frequencies of the electrode were 174 Hz (X) and 73 Hz (Z). 25 × 25 points were obtained on each SVET map. The time difference between a current density measurement and another was 0.52 s, and the scanning interval was 100 μm. All tests were performed in a Faraday cage at 20 ± 1°C. Samples from the AA2050-T84, AA7050-T7451 and the galvanic couple of the two alloys were used as working electrodes, and the exposed surface area was 25 mm2. To evaluate the effect of galvanic coupling, the two alloys were put in direct contact with each other, clipped with a copper ring to ensure electrical contact and embedded in resin. The surfaces of the samples were polished to a 1 μm finish. Epoxy resin and adhesive tape were used to form the reservoir. The experiments were carried out in 5 mM NaCl solution for 24 h. SVET maps were obtained every 2 h, and in situ images of the exposed surface for corrosion monitoring on the AA2050-T84 and AA7050-T7451 alloys were obtained in these time intervals. An external reservoir was used with 0.06 L electrolyte solution to maintain the same level of solution within the test vessel. A peristaltic pump was used to maintain the flow of the solution at a flow rate of 0.003 mL min−1.
The local distribution of H+ ions on the surfaces of the samples was acquired using SIET under open-circuit conditions. The electrode was made by back-filling signalised glass micropipettes with the inner filling solution (0.01 mol L−1 KH2PO4 in 0.1 mol L−1 KCl) and tip filling with hydrogen ionophore II cocktail A (Fluka). A chlorinated silver wire was inserted into the capillary resulting in the H+ selective microelectrode. An Ag/AgCl electrode with KCl solution was used as an external reference electrode. The selective H+ microelectrode was calibrated using buffer solutions according to the Nernst equation. The microelectrodes showed stable and reproducible potential in the pH range between 6.9 and 10.6. The Nernst slope was 58 ± 0.1 mV pH−1. The selective microelectrode was located at 50 ± 3 µm above the surface. All tests were performed in a Faraday cage at 20 ± 2°C. The samples used as the working electrode were embedded in epoxy resin and their surfaces were sequentially polished. An adhesive tape and epoxy resin were used as a reservoir for the electrolyte (solution with 0.005 mol L−1 of NaCl) with a 2 h test duration.
Discussion and results
Presented in Figure 1 is a plot showing the OCP measurements obtained in the 0.005 mol L−1 sodium chloride solution for the AA2050-T84 and AA7050-T7451 alloys.
Variation of open circuit potential (OCP) vs. time of immersion of the AA2050-T84 and AA7050-T7451 alloys in 0.005 mol L−1 NaCl solution.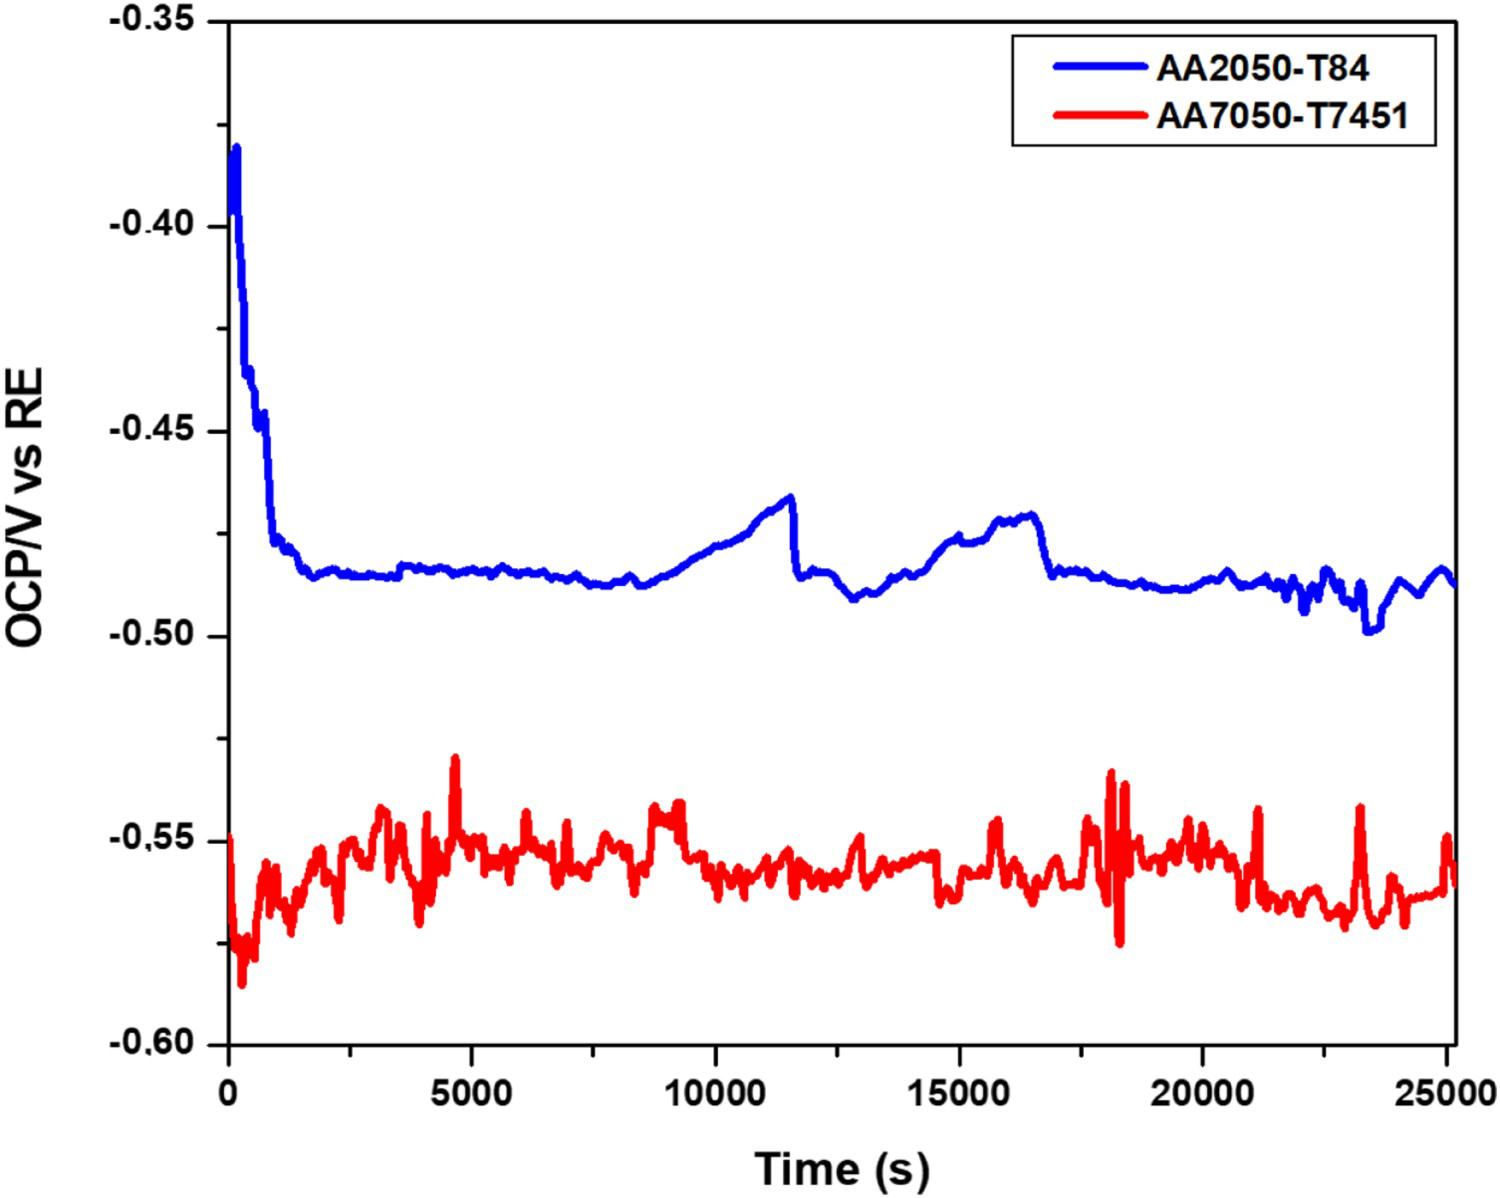
The AA2050-T84 alloy is nobler than the AA7050-T7451 alloy due to Cu being the main element in the AA2050; whereas, in the AA7050 alloy, the main alloying element is Zn. The initial decrease in OCP values for the AA2050 indicates the dissolution of the naturally formed oxide film on the alloy surface. For the AA7050 alloy, the frequent OCP oscillations indicate localised attack at the exposed surface during the whole test period. Attack to the air-formed oxide film on the AA7050 also occurred soon after exposure to the electrolyte. Besides, high susceptibility to nucleation of localised attack in the AA7050 alloy resulted in the high-frequency OCP oscillations. The potential difference between the two alloys after approximately 2000 s was higher than 0.05 V, indicating that galvanic coupling effects between these two alloys are possible. The AA2050 alloy exhibited oscillations of lower frequencies compared to the AA7050, showing that the AA2050 alloy is also susceptible to localised corrosion and localised electrochemical techniques are proper for investigating the corrosion behaviour of these alloys.
SVET results
AA2050-T84
Figure 2 presents SVET maps and corresponding macro-images for the AA2050-T84 alloy after (a,b) 2 h and (c,d) 24 h of exposure to the 0.005 mol L−1 NaCl solution. The measurements of current density and the images obtained by the equipment microscope are also shown in Figure 2, with maximum current densities above 500 µA cm−2.
(a) SVET map of the AA2050-T84 alloy after 2 h of exposure to 0.005 mol L−1 NaCl solution; (b) image of the AA2050-T84 exposed surface obtained by the SVET camera after 2 h in the 0.005 mol L−1 NaCl solution; (c) SVET map of the AA2050-T84 alloy after 24 h of exposure to 0.005 mol L−1 NaCl solution; (d) image of the AA2050-T84 exposed surface after 2 h in the 0.005 mol L−1 NaCl solution.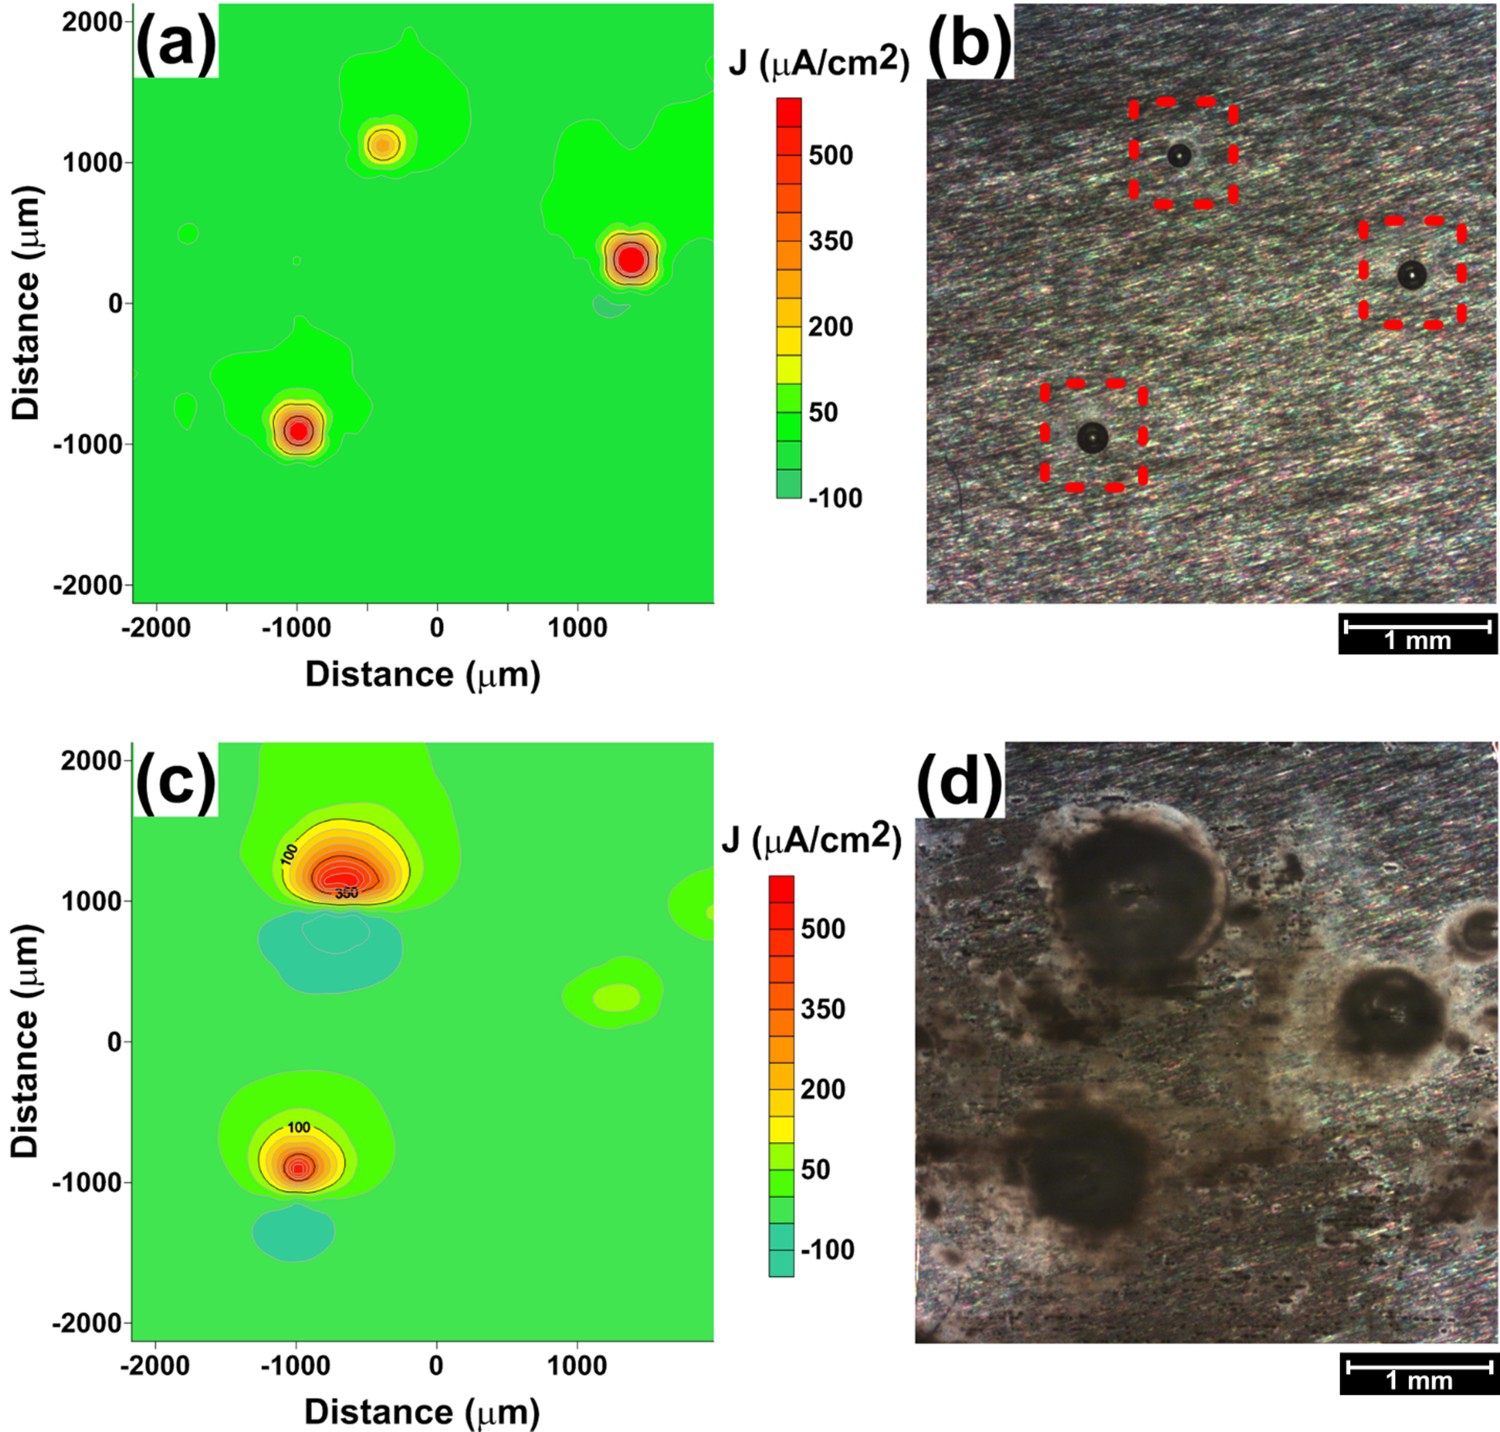
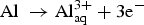
Figure 2 shows three anodic sites identified at the exposed surface within the first two hours of test, with current densities higher than 200 μA cm−2 corresponding to those of the most active areas on the surface. These sites are shown in Figure 2(b) as spherical pits and hydrogen bubbles were seen on the ‘mouths’ of the pits, indicating that severe localised corrosion is occurring. Hydrogen bubbles result from the high generation rate of hydrogen ions inside the pits according to reactions (1) to (3) leading to reduced pH inside the pits.


The area affected by corrosion increased from 2 to 24 h, and deposition of corrosion products occurred on the attacked sites, mainly on those with high current densities at the first period of the test. This led to a current decrease from 2 to 24 h since the access of corrosion species to the active sites was hindered by the deposited corrosion products (Figure 2(c,d)).
From the optical image in Figure 3(a), it is evident that the anodic sites were covered with corrosion products after 24 h. SEM images, Figure 3(b–d), allow better visualisation of the corroded sites after 24 h of exposure to the test solution.
Surface of the AA2050-T84 alloy after 24 h in 0.005 mol L−1 NaCl solution. (a) Optical micrograph of the exposed surface; and SEM micrographs of (b) top surface of the sample showing intense attack with the removal of large areas of the surface and corrosion penetration into the alloy; (c) corroded sites showing the correlation of the attacked areas – typical of trenching with the removal of the matrix surrounding the white coarse particles (arrows); (d) another site of localised corrosion with penetration and deposition of corrosion products surrounding the attacked areas; (e) corroded region with large volumes of corrosion products (arrows).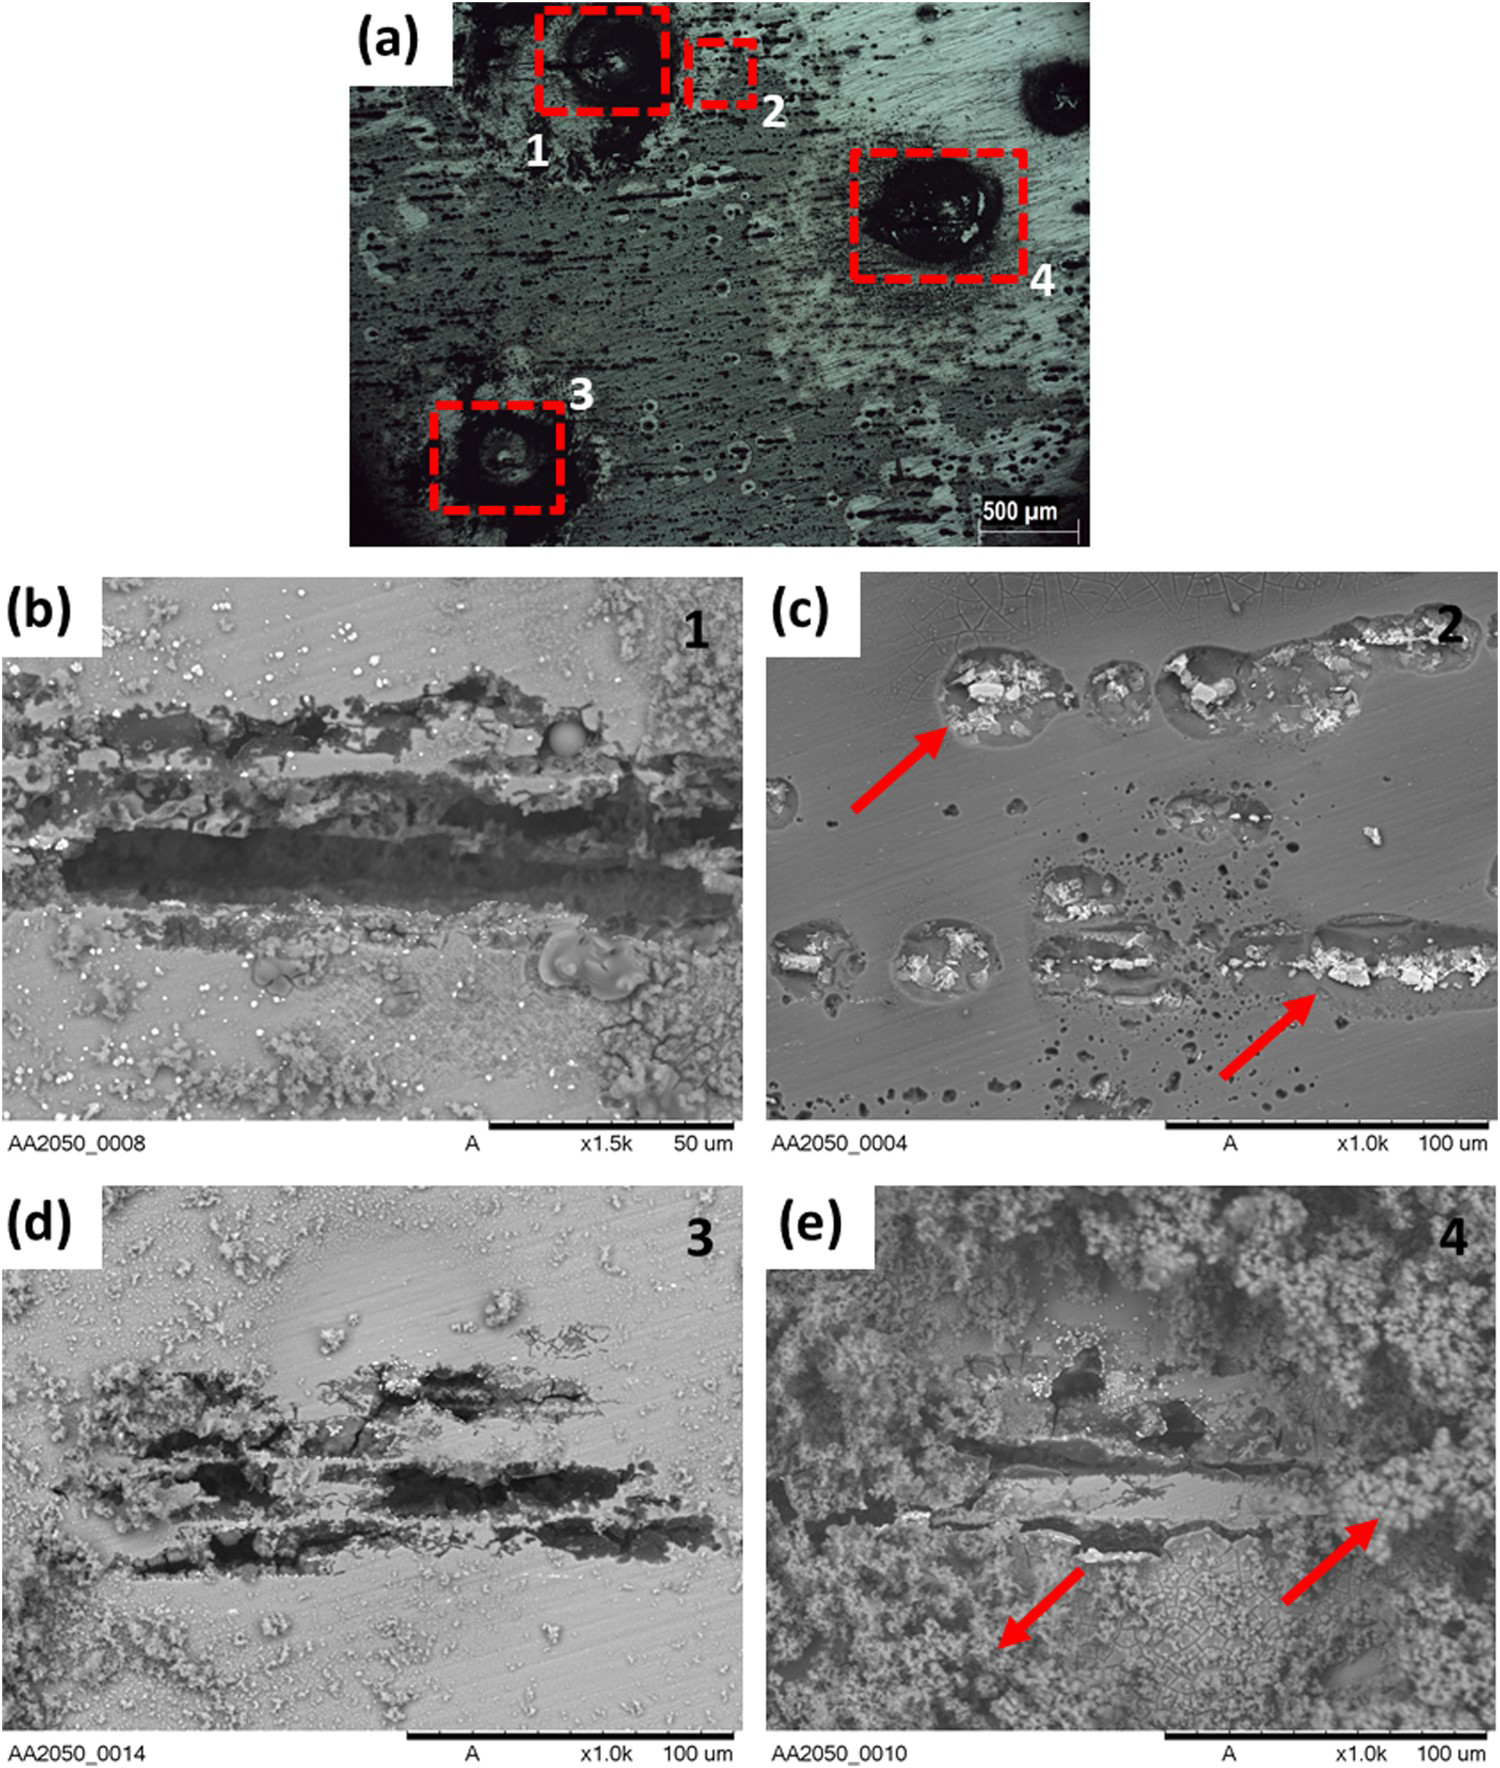
From the SEM images (Figure 3(b–e)), it is possible to identify the main modes of localised corrosion. The large areas of attack and penetration of corrosion are those related to high current densities estimated by SVET measurements. Severe localised corrosion was seen in some sites on the surface, Figure 3(b–d) but also trenching (Figure 3(c)). Trenching is related to coarse (constituent) particles that are cathodic to the matrix, such as those Cu and Fe-rich, resulting in a preferential attack of the matrix surrounding these particles. This type of attack is often observed on Al alloys. The coarse particles are still seen at the surface after 24 h of test, as evident in Figure 3(c).
The Cu, Fe-rich particles are cathodic to the matrix of the AA2050-T84 alloy. Selective leaching of Li and Al resulted in Cu–Fe enrichment of the particles which then act as cathodic sites for the reduction of O2 to generate OH−. The generation of OH− helps in the dissolution of the oxide layer on the Al matrix region adjacent to the particles and promotes effective galvanic coupling. A TEM micrograph of the AA2050-T84 shows micrometric particles inside the grains of the alloy (Figure 4). Al–Cu–Mn dispersoids were prevalent within the grains of the alloy, but grain boundary precipitates were not found in the regions analysed. The absence of grain boundary precipitates explains why IGC was rarely observed in this alloy. Intragranular attack was the predominant form of attack seen as shown in Figure 3(b,d). As reported in Refs. [5,6], intragranular attack in the AA2050 alloy is usually associated with the presence of fine intragranular T1 precipitates.
(a) TEM image of the AA2050-T84; (b) EDS analysis of area inside the grain.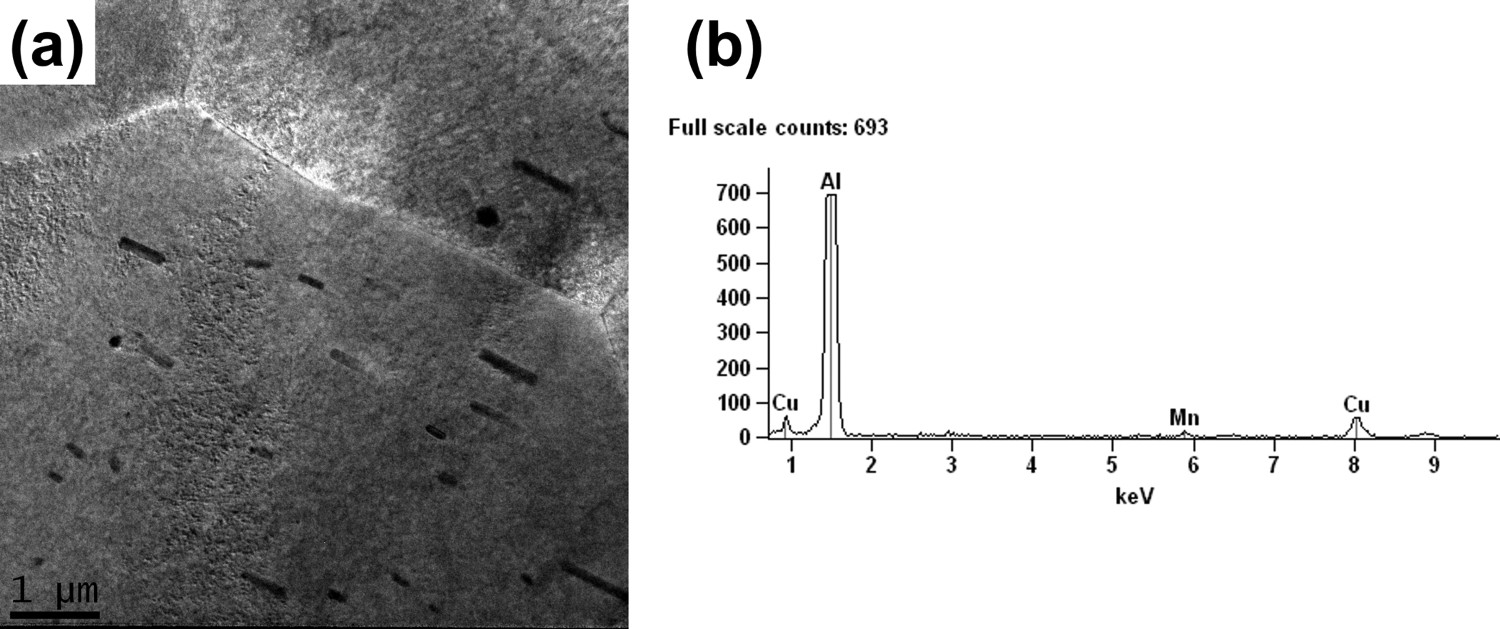
AA7050-T7451
The surface of the AA7050-T7451 after 2 and 24 h of exposure to the test solution is shown in Figure 5, as SVET maps as macro-images. The measurements of current density and the image obtained by the microscope of the equipment are also shown in Figure 5 with maximum current densities of nearly 150 µA cm−2.
(a) SVET map of the AA7050-T7451 after 2 h of exposure to 0.005 mol L−1 NaCl solution; (b) image corresponding to the SVET map of (a); (c) SVET map of the AA7050-T7451 after 24 h of exposure to 0.005 mol L−1 NaCl solution; (d) image corresponding to the SVET map of (c).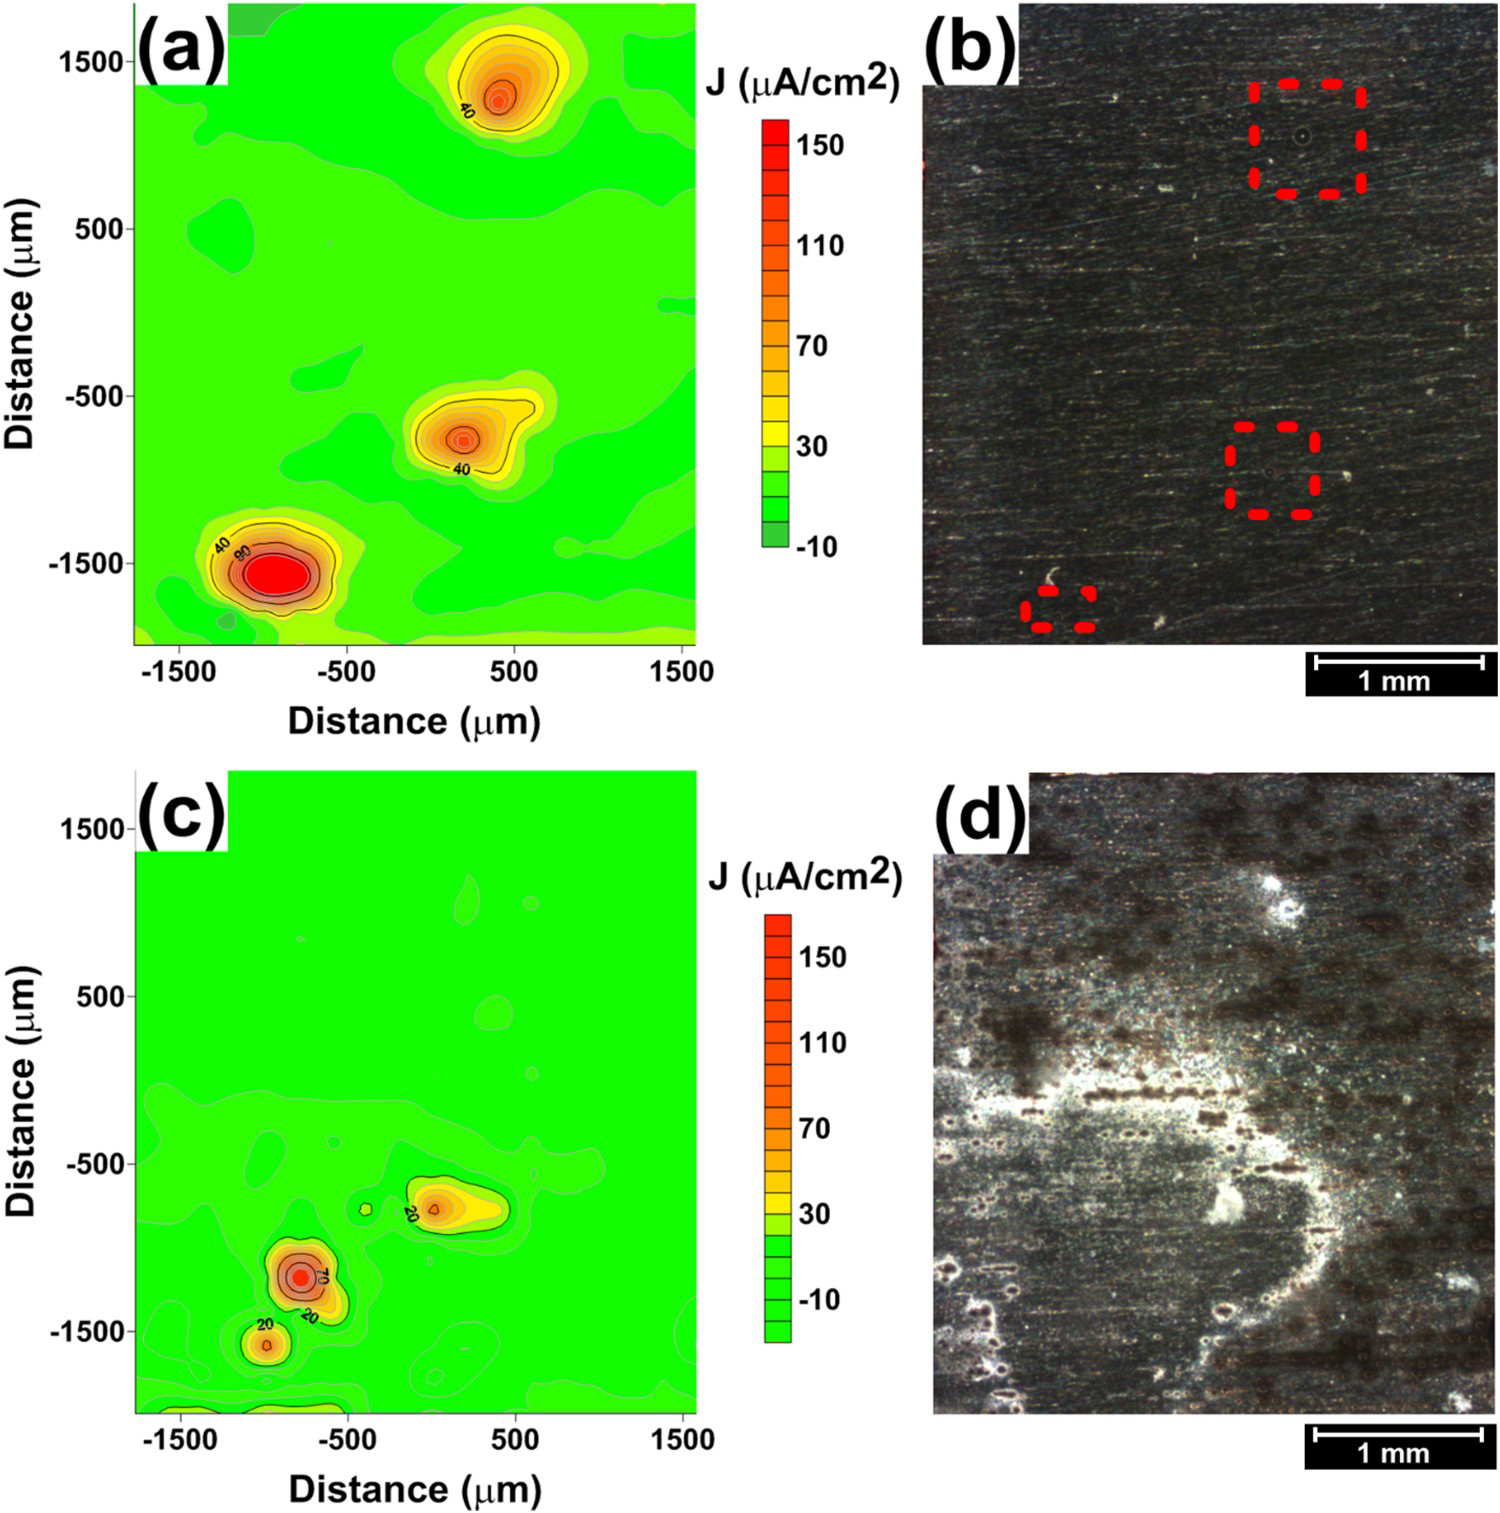
Smaller current densities were recorded on the AA7050-T7451 alloy compared to the AA2050-T84 alloy. Current densities with maximum values around 150 μA cm−2 (Figure 5(a)) were measured. The image shows three sites corresponding to pits with hydrogen bubbles at the pit ‘mouth’. After 24 h of exposure, the current density related to the pits decreased (Figure 5(c)) due to deposition of corrosion products, as Figure 5(d) reveals. SEM images of the AA7050 alloy after the SVET test are shown in Figure 6.
(a) Surface of the AA7050-T7451 alloy after 24 h of exposure to 0.005 mol L−1 NaCl solution; (b) and (c) SEM micrographs of site 1 in (a); (d) corrosion attack related to the precipitates in the AA7050-T7451 alloy, SEM micrograph of site 2 in (a); (e) relation between precipitate and corrosion products surrounding a cathodic precipitate shown in (d) at higher magnification.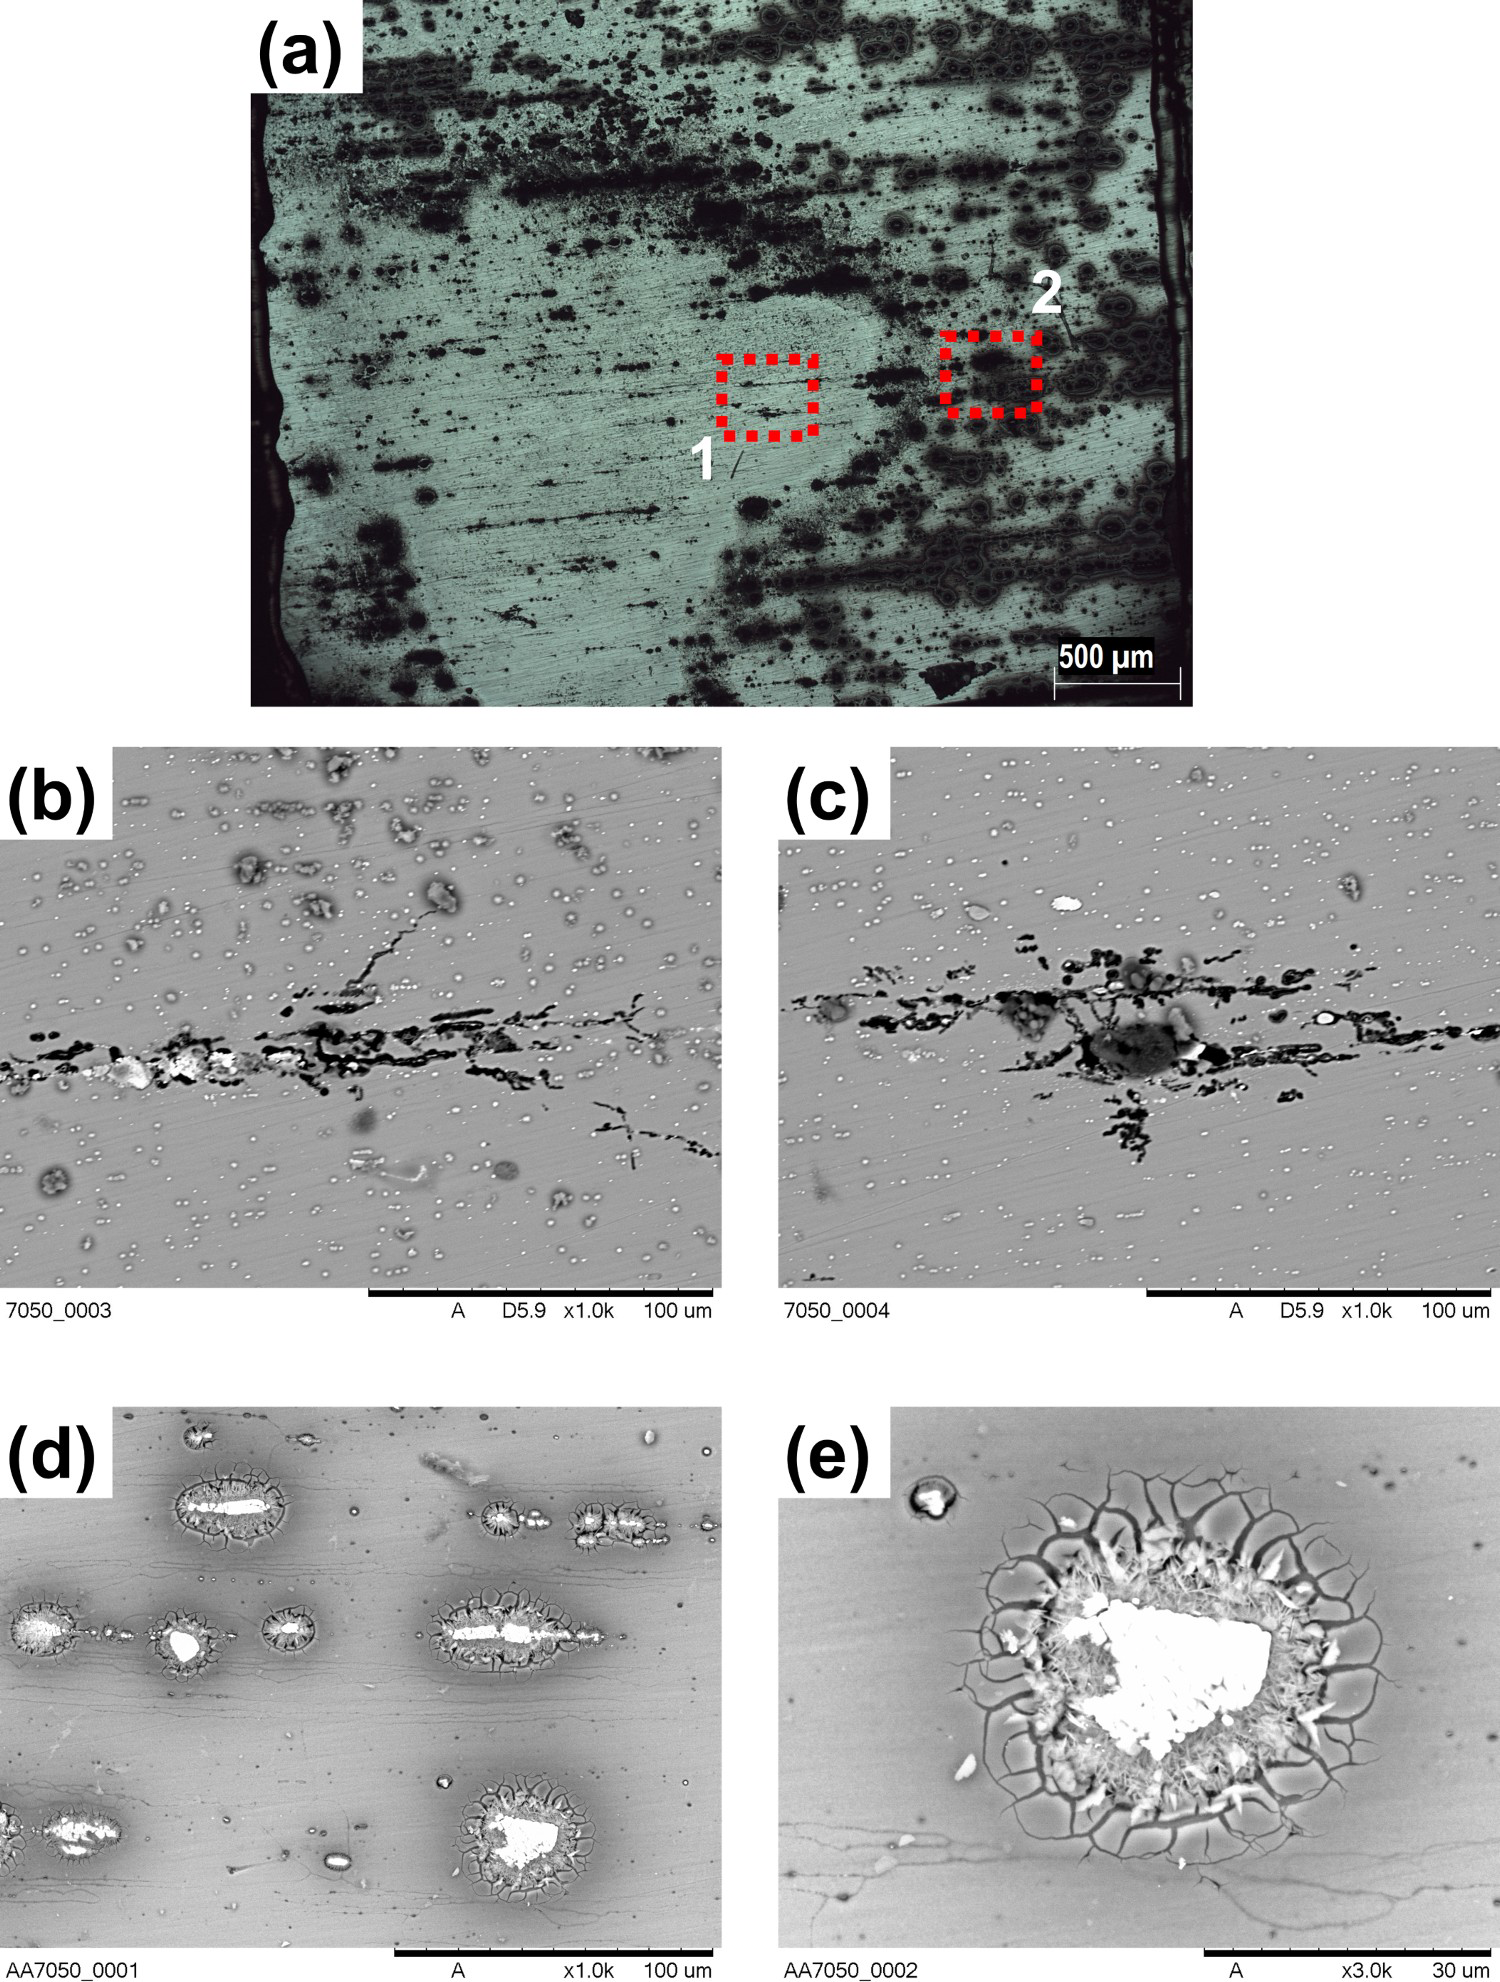
A comparison of the corrosion morphologies related to the two alloys, AA2050 and AA7050, shows that the severity of the attack is significantly stronger for the AA2050 than for the AA7050, in agreement with the peak current density values from each scan measured by SVET analysis, as it is shown in Figure 7. This is related to the composition of the particles of both Al alloys [12,17,25 27], as well as their distribution in the two alloys.
Values of peak current densities for the AA2050-T84 and AA7050-T7451 during exposure to 0.005 mol L−1 NaCl solution for SVET measurements.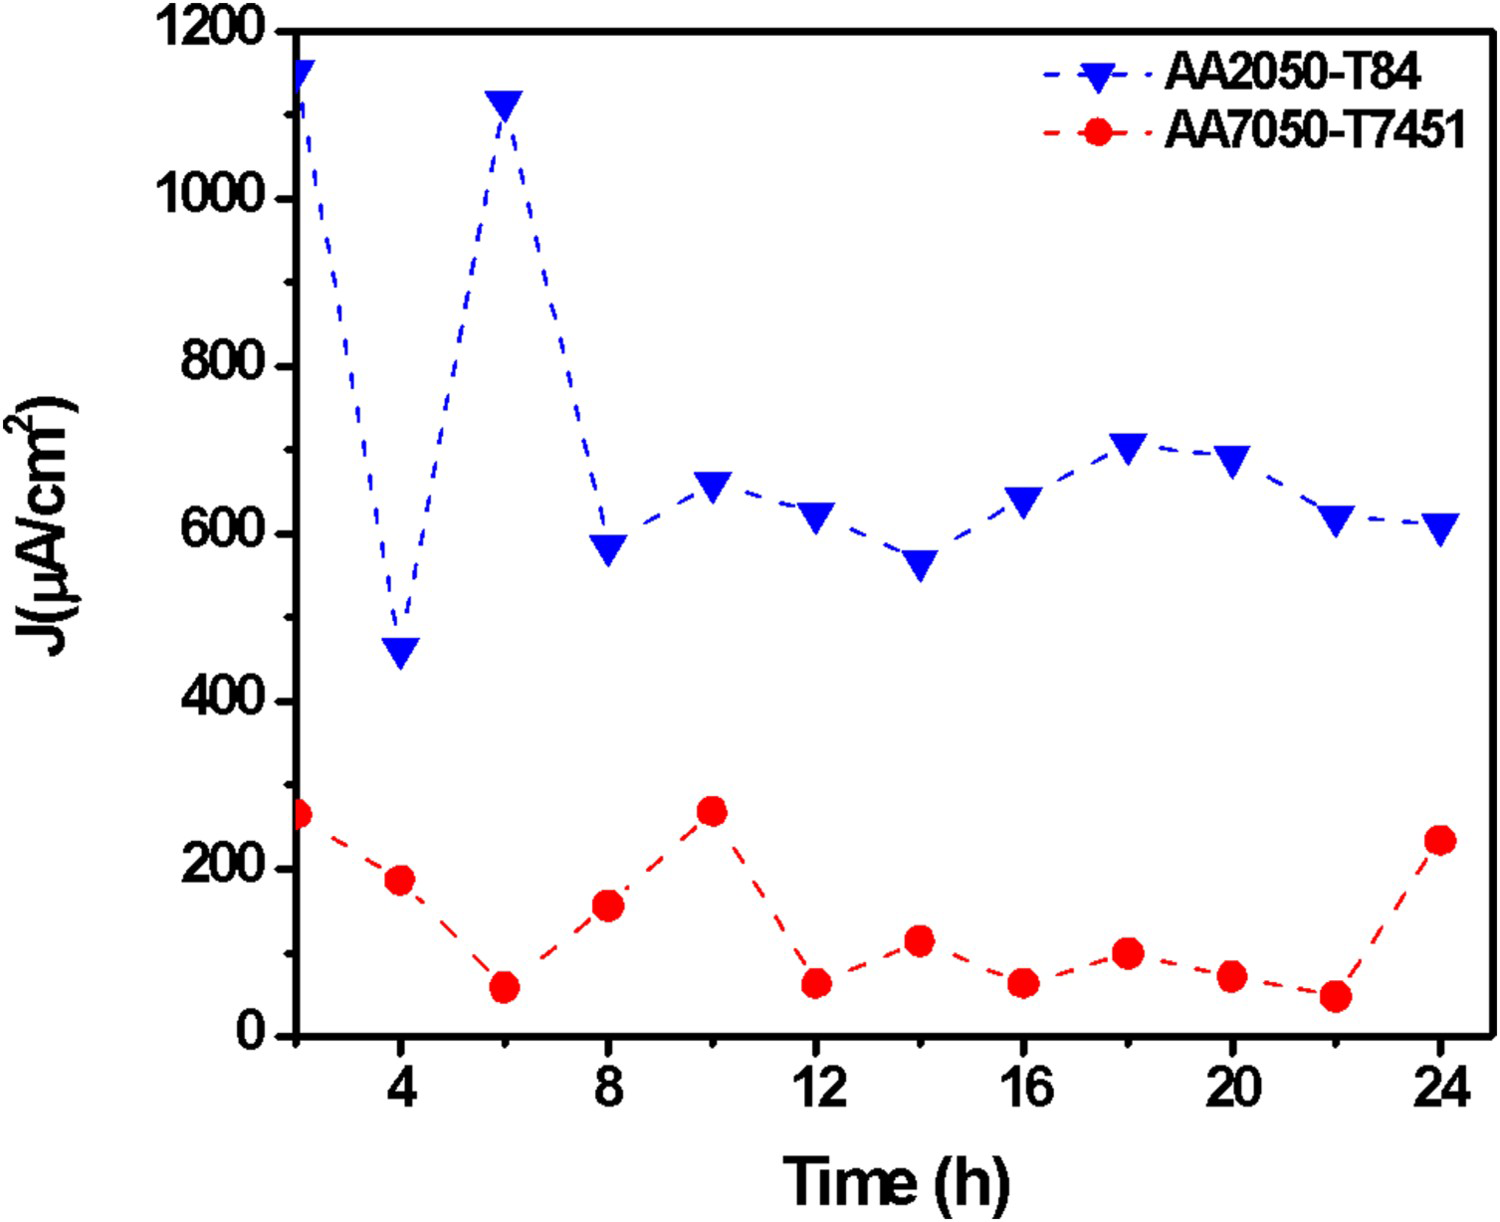
The results presented show that even though the two alloys are susceptible to severe localised corrosion, the current densities and the morphologies of the corrosion products related to these alloys were significantly different.
The results for the AA7050 alloy suggested preferential grain boundary attack and this can be explained by the preferential precipitation of the η (Al–Zn–Mg) phase at the grain boundaries of the alloy (Figure 8). This causes a potential difference between the matrix and the precipitates preferentially located at the grain boundaries, thus causing IGC.
(a) Micrograph of the AA7050-T7451 alloy showing precipitates mainly located at the grain boundaries; (b) EDS spectrum of the precipitates located at the grain boundaries.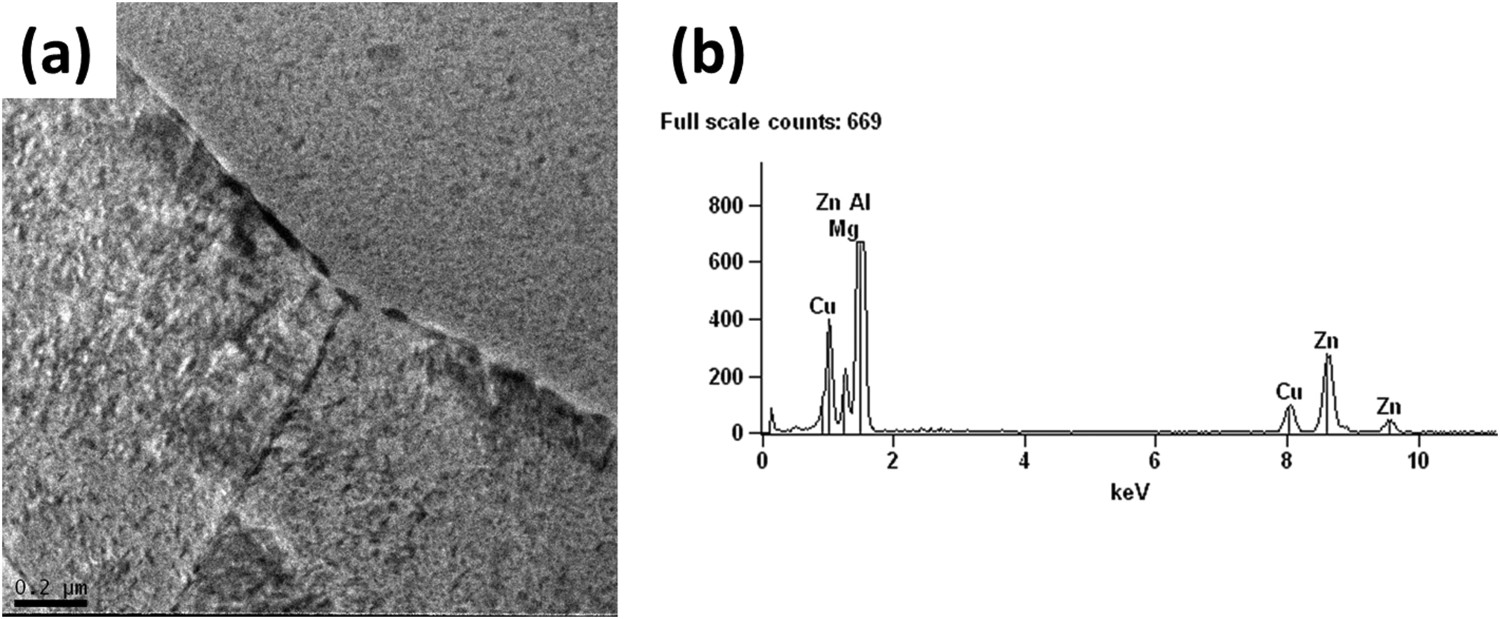
SIET measurements show the distribution and concentration of H+ on the surface. SIET results show that the cathodic reactions increased the localised pH value due to the generation of OH− ions on the surface, whereas at the anodic sites, the decrease in pH due to hydrolysis promoted by metal cations liberation into the solution [16].
SIET results show large pH variation between the anodic and cathodic sites and revealed the sites of SLC in the alloys. The pH varied from 3.5 in the anodic areas to 6.7 in the cathodic ones. As it is well known, inside the SLC, hydrolysis is promoted by the metallic cations resulting from metal oxidation and it results in the formation of H+ ions that diffuses outwards and this is responsible for the low pHs measured by SIET. Fewer sites of SLC, indicated by the low pHs, were observed on the AA2050 alloy compared to the AA7050. In the latter alloy, the mechanism of corrosion initiation was an intergranular attack, and the low pHs measure at various sites indicated that the attack was severe. It was also observed that the cathode to anode area ratio was greater for the AA2050 compared to the AA7050 which supports the SVET results that showed higher current densities for the AA2050. In fact, the results of the SIET agree with those of the SVET and OCP measurement for the AA2050 and AA7050 alloys. Inside the pits, a fraction of the generated H+ ions is reduced giving rise to hydrogen bubbles which are seen at the pits ‘mouth’ (Figure 9).
(a) SIET map of the AA2050-T84 alloy after 2 h of test in 0.005 mol L−1 NaCl; (b) image obtained through the SIET camera after 24 h of test for the AA2050-T84 alloy; (c) SIET map of the AA7050-T7451 alloy after 2 h of test in 0.005 molL−1 NaCl; (d) image obtained through the SIET camera after 24 h of test in the AA7050-T7451 alloy.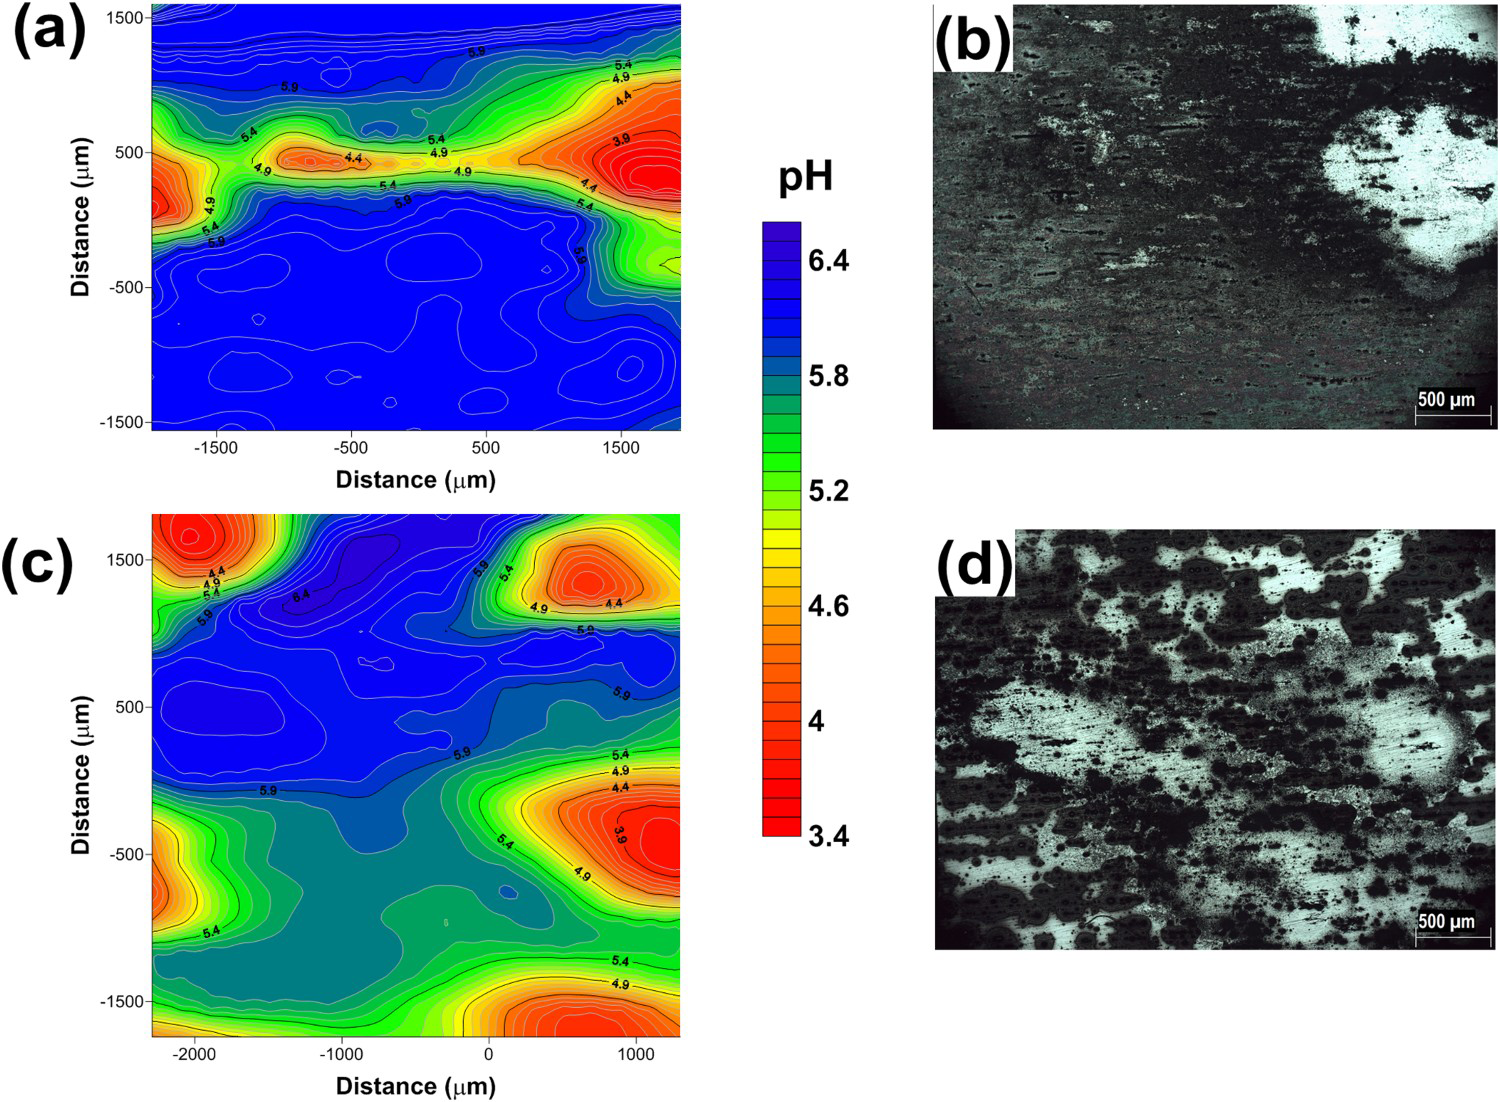
Effect of galvanic coupling
Corrosion monitoring was carried out by SVET and surface observation, and the results after 2 and 24 h of exposure to the test solution (0.005 mol L−1 NaCl solution) are illustrated in Figure 10. The AA2050-T84 alloy is located on the left side, whereas the AA7050-T7451, on the right side. Figure 10(a,b) correspond to 2 h of test, while Figure 10(c,d) correspond to 24 h. The results clearly show that the AA2050-T84 alloy was cathodically protected by the AA7050-T7451 and the corrosion current densities at the localised sites of the AA7050-T7451 were significantly lower than when tested individually and were maintained at lower values during the whole test period, even though new corrosion sites nucleated on the surface between 2 and 24 h of test.
(a) SVET map of galvanic coupled AA2050-T84 and AA7050-T7451 alloys and exposed to 0.005 mol L−1 NaCl solution after 2 h of test; (b) surface of the coupled alloys, AA2050 and AA7050, corresponding to (a); (c) SVET map of galvanic coupled AA2050-T84 and AA7050-T7451 alloys in 0.005 mol L−1 NaCl solution after 24 h of test; (d) surface of the coupled alloys, AA2050-T84 and AA7050-T7451, corresponding to (c).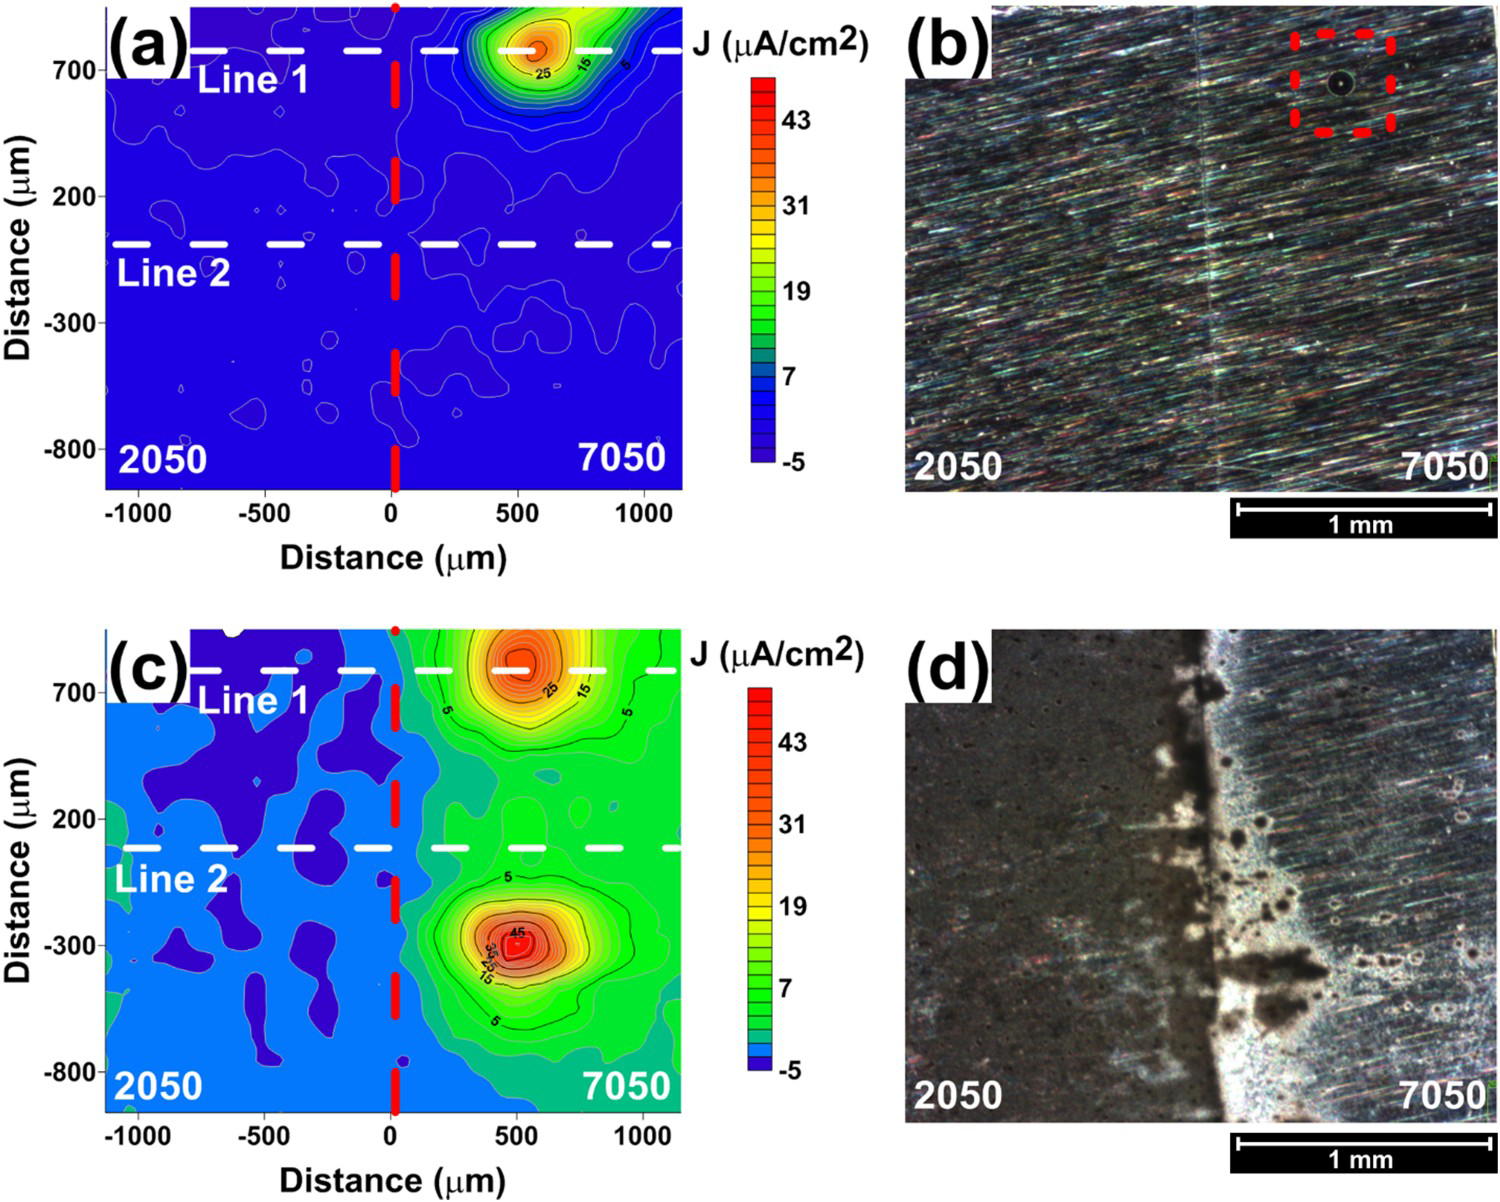
SEM images of the sample exposed during 24 h of test (Figure 11(a)) shows corrosion products accumulated at the interface between the two alloys and also on the AA7050-T7451 alloy near to the interface. The results show that the anodic sites were all located at the AA7050 whereas the AA2050 acted as the cathode in the galvanic couple. At higher magnifications (Figures 11(b–e)), it is clearly seen that galvanic coupling resulted in cathodic protection of the AA2050-T84 alloy and most coarse particles exposed to the corrosive medium were preserved, though attack to the matrix surrounding the particles occurred. This attack is due to the alkalinisation of the medium surrounding coarse particles as a result of the cathodic reactions on them. In the case of the AA7050-T7451, the corrosion attack followed a direct path, Figure 11 (c,e). Severe localised corrosion that was nucleated by IGC was evident on the AA7050 alloy in addition to the coarse particle-associated attack. The bulk anode, the AA7050 alloy, underwent severe localised corrosion and protected the AA2050 alloy at the neighbourhood of the AA7050, and SLC was not seen on this last alloy.
Micrographs showing the galvanically coupled AA2050-T84 and AA7050-T7451 alloys after exposure for 24 h to 0.005 mol L−1 NaCl solution (a) coupled alloys, (b) AA2050-T84, (c) localised attack in the AA7050-T7451, (d) higher magnification of AA2050-T84 shown in (b); (e) another area of localised attack in the AA7050-T7451 alloy.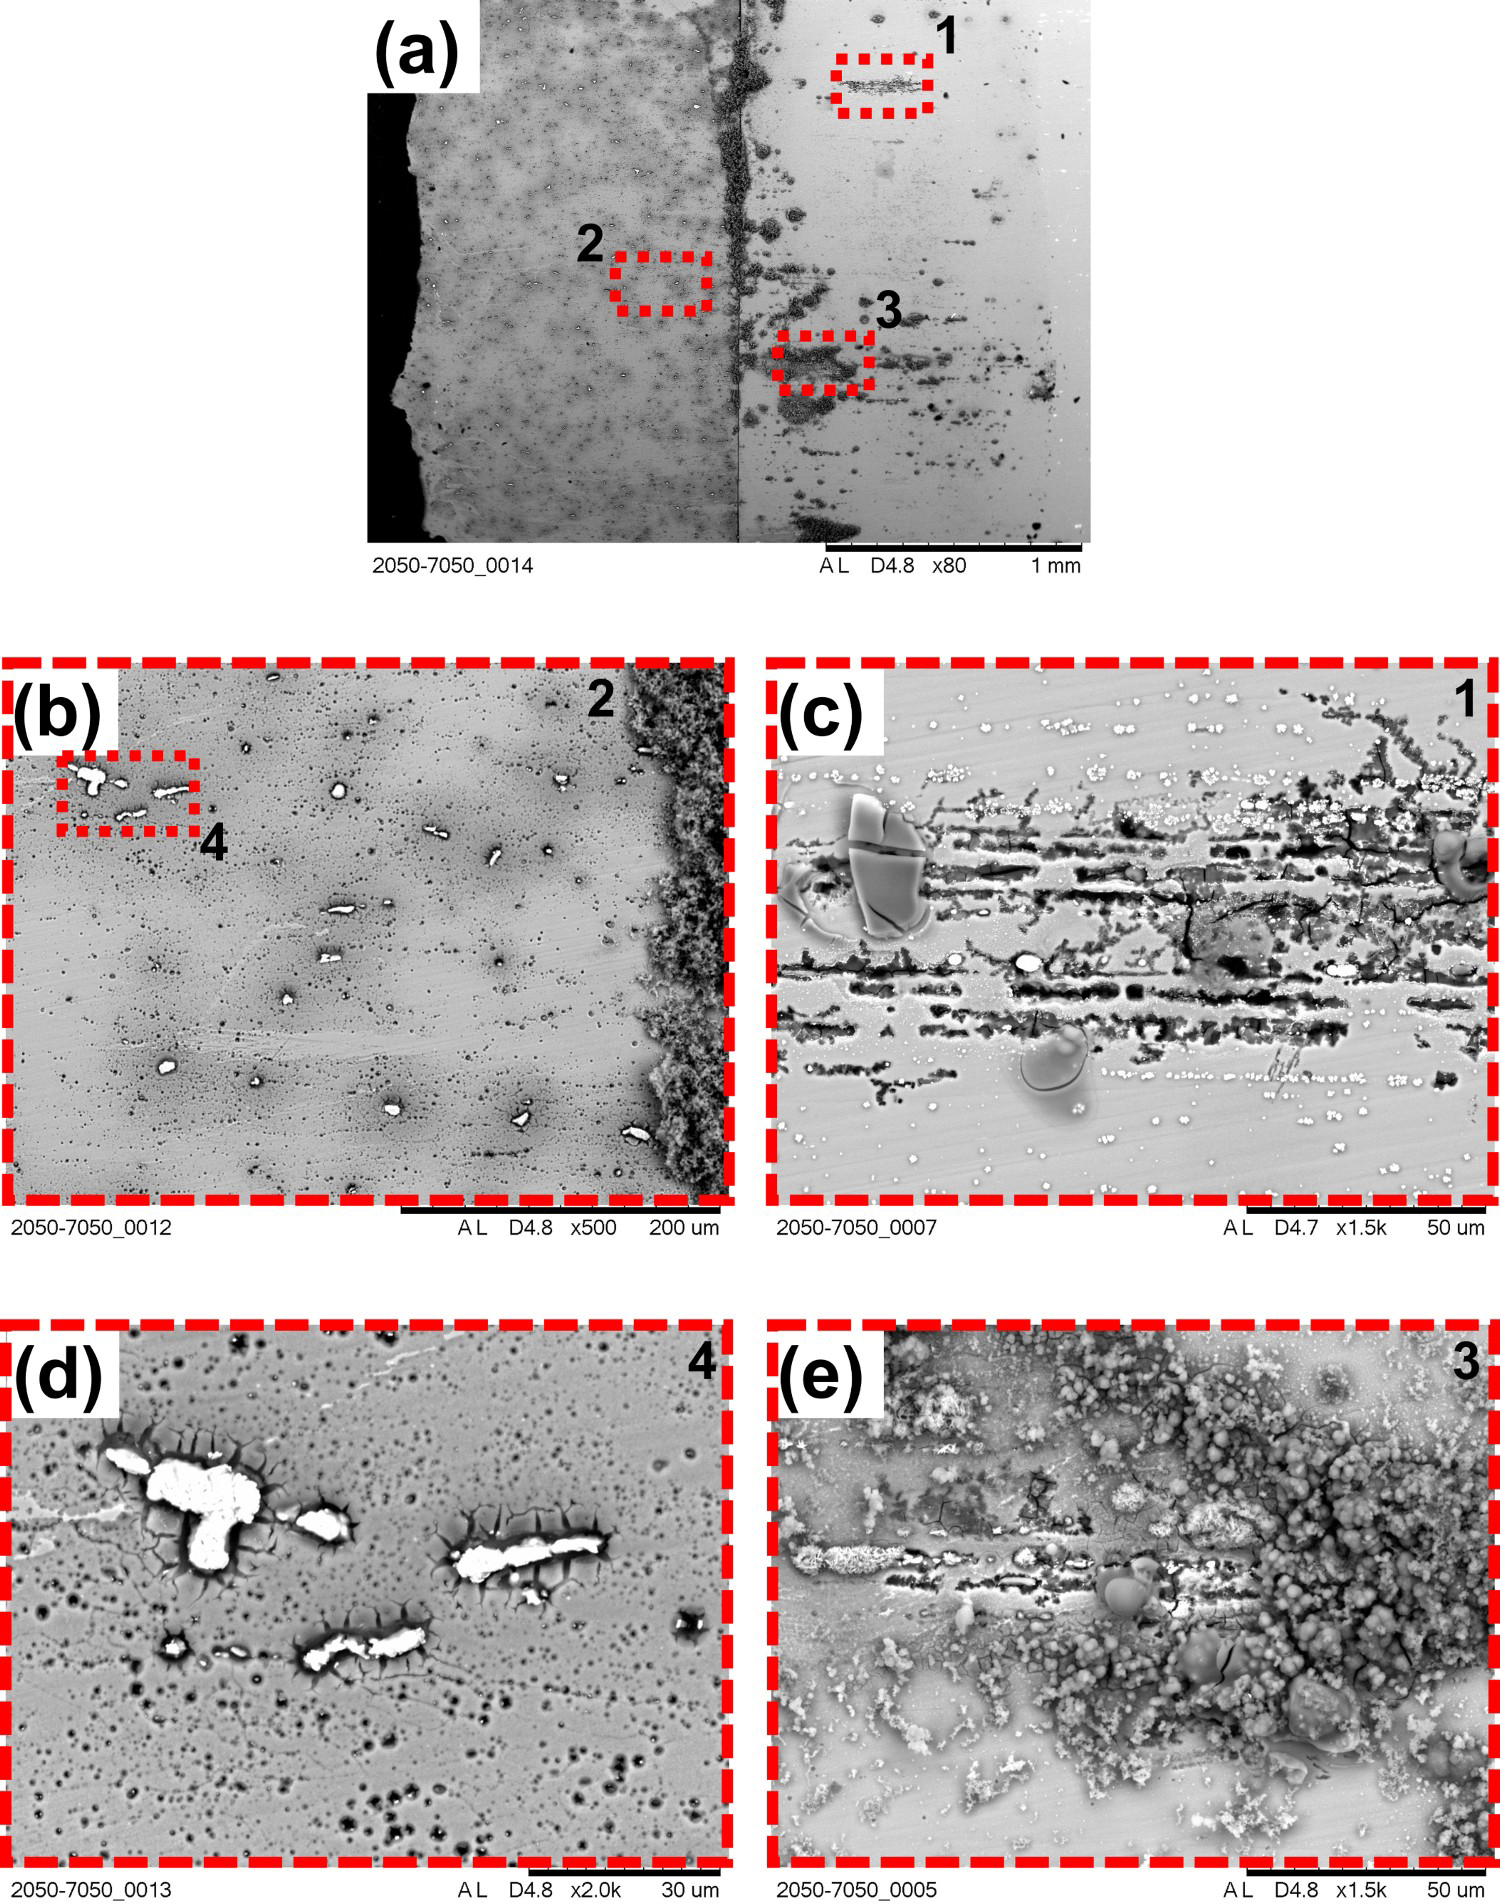
Current density plots along lines 1 and 2, corresponding to 2 and 24 h of exposure to 0.005 mol L−1 NaCl (Figure 10(a,c)) supported the previous observation. They show a peak of current above 30 µA cm−2 which was related to the pit on the AA7050-T7451, whereas the AA2024-T84 presented comparatively lower current densities along lines 1 and 2. There were no significant changes between the current density plots related to line 1 between 2 and 24 h, but it is seen that a new pit developed on the AA7050-T7451 (Figure 10(c)) and it affected the current density plot associated with line 2 since it crosses the areas surrounding this new pit. These results also showed that the SLC sites were not located directly at the boundary between the two galvanically coupled alloys but there is evidence of the cathodic protection of the AA2050 by the AA7050 alloy, as seen by comparison of Figures 2 and 10.
Plots of lines 1 and 2 were investigated sequentially, and at the early stage of immersion (Figure 12(a)), peak anodic values were only obtained along Line 1 which was across an SLC area on the AA7050 alloy. Along line 2, which did not cross a severe localised corrosion site, no anodic current values were recorded. In fact, the values were below the transition point of 0 µA cm−2. At the later stage of the immersion test (Figure 12(b)), the profile of line 1 remained similar, but the profile of line 2 varied, with the values on the AA7050 side increasing above the reference point. These results show that even though the AA7050 alloy was the bulk anode, the galvanic corrosion mode was not general, but localised. Although new localised anodic sites developed later, the galvanic current was mainly supplied by severe localised corrosion sites located away from the interface between the alloys.
Variation of current density along lines 1 and 2 in Figure 10, for the galvanically coupled AA2050-T84 and AA7050-T7451 alloys for (a) 2 h and (b) 24 h of exposure to 0.005 mol L−1 NaCl solution.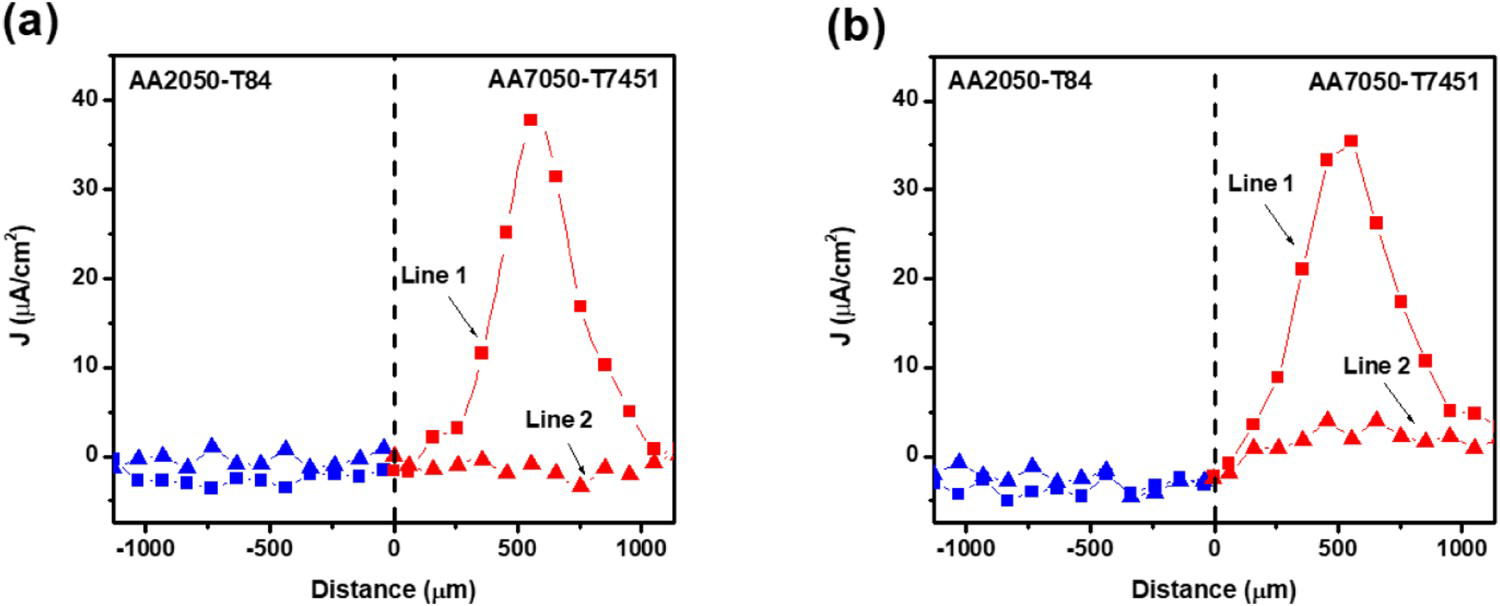
The main contribution of this study is to show that galvanic coupling of the two alloys (that separately presented SLC and very high current density values associated with SLC) resulted in the cathodic protection of the AA2050 alloy, but also in a substantial reduction in the current densities related to the alloy that acted as the anode in the couple, that is, the AA7050 alloy. The cathodic efficiency of the AA2050 alloy as the bulk cathode of the couple may be lower compared to the cathodic efficiency of the localised cathodic sites on the AA7050 alloy when the alloy is tested in isolation. There could also be a cathode-anode-area-ratio change effect. However, the exact mechanism explaining the reduced anodic current densities when there is galvanic coupling is not yet fully understood and it is currently being investigated.
Conclusions
Susceptibility to localised corrosion of the AA7050-T7451 and AA2050-T84 was investigated and compared in this study. The AA2050-T7451 presented high susceptibility to severe localised corrosion and very high corrosion current densities (higher than 500 µA cm−2) were associated with these sites. The AA7050-T7451 also showed high susceptibility to severe localised corrosion that started as an intergranular attack. The current density values associated with the SLC sites in the AA7050-T7451 were high (around 150 µA cm−2) always much inferior to the values of the AA2050-T84.
Cathodic protection of the AA2050-T84 occurred by galvanic coupling with the AA7050-T7451 with no SLC formation in the first alloy and decreased current densities at the SLC sites on the AA7050-T7451 that acted as the anode in the galvanic couple.
Footnotes
Disclosure statement
No potential conflict of interest was reported by the author(s).