
Abstract
Friction stir weld joints of 2024-T4 are strengthened by ultrasonic impact treatment (UIT). After ultrasonic impact treatment, the grains on the surface of the sample are refined to form a dense deformation layer, and residual compressive stress is applied on the surface of the sample. The corrosion rate and mass-loss rate of the UIT sample are significantly lower than those of the non-UIT sample, and uniform corrosion is exhibited. The average life of the UIT samples in the air is 1.74 times that of the non-UIT samples; meanwhile, the average life of the UIT samples in 3.5% NaCl solution is twice that of the non-UIT samples. The crack sources of the UIT sample in the air shift from the surface to the subsurface below the strengthening layer, whereas those of the sample in the 3.5% NaCl solution are located in the corroded area on the surface of the sample.
Introduction
Welded structures are widely used in aerospace, shipbuilding and other industrial fields. A solid-phase connecting technique referred to as friction stir welding (FSW), which solves the difficulties of aluminium alloy material welding and low welding strength, is widely used to weld aluminium structures. This method provides several advantages, such as low connection temperatures, low residual stress after welding and high joint performance [1]. Aluminium alloys are characterised by small joint deformation and excellent mechanical properties after FSW, but the aluminium-clad layer on the surface of the weld is destroyed during welding. Inevitably, this occurrence adversely affects the corrosion resistance of the joint. Aircraft inevitably serve in a corrosive environment, and owing to the combined action of corrosive medium and load, aluminium alloys are relatively prone to fatigue damage, posing a threat to aircraft safety. The long-term service behaviour and reliability of materials have always been the main basis for structural design, rendering the research on corrosion performance particularly important.
Under the synergy and interaction of alternating stress and corrosive environment, the premature failure of materials or components below the yield strength of the material is called corrosion fatigue failure. Fatigue failure in welded joints is one of the major reasons for the failure of mechanical structures and typically starts from the surface or near the surface. Therefore, the overall mechanical properties of the joint can be improved by strengthening the surface of the welded joint by using various techniques, such as shot peening, hammering, rolling and plasma spraying, among others [2 4]. Surface strengthening endows the material with ideal surface performance without changing its overall performance and can be potentially used in various industries. Ultrasonic impact treatment (UIT) is a relatively new and promising method with the advantages of a lightweight actuator, flexible and convenient use, high efficiency, low noise, low cost and so on [5,6]. UIT produces residual compressive stress and microstructural changes on the surface of the workpiece by high-speed impact, improving the mechanical properties of the material. UIT exhibits good controllability, provides deep residual compressive stress layer and hardened layer and can be impacted for complex-shaped workpieces; thus, it bears considerable engineering value and theoretical significance [7].
Liu [8] et al. evaluated the effects of external compressive stress and residual compressive stress on the local corrosion of the 2024 aluminium alloy; they found that external compressive stress can significantly reduce the expansion of intergranular corrosion perpendicular to the stress direction, and the effect was related to the grain orientation of the aluminium alloy. Trdan [9] et al. performed unprotected and non-medium femtosecond laser shock enhancement on 2024-T3; they found that strengthening in 2024-T3 increased the polarisation resistance of the corroded surface, reduced the corrosion current and anodic dissolution and showed long-term stability in the corrosive solution. Kumar [10] et al. conducted ultrasonic shot peening on Ti–13Nb–13Zr and compared the corrosion performance of the sample in Ringer's solution before and after treatment. Compared with untreated samples, all samples treated by ultrasonic shot peening showed higher corrosion resistance, which was attributed to the formation of a complete and effective passivation oxide layer. Pandey [11] analyzed the effect of the surface nanostructure formed by ultrasonic shot peening on the corrosion behaviour of 7075 aluminium alloy. The samples exhibited reduced current density and enhanced corrosion potential after treatment by ultrasonic shot peening, which refined the surface grains and imposed compressive residual stress. Lv [12] et al. found that the depth of the samples treated by shot peening was significantly less than that of the untreated samples. They concluded that shot peening improved the overall corrosion resistance of 7050 aluminium alloy, whereas the residual compressive stress field inhibited the development of local corrosion. Timmermann [13] et al. conducted shot peening on cast aluminium 359 and wrought aluminium alloy 6060, which underwent rotating–bending fatigue performance testing in air and in a salt spray environment. Their study indicated that shot peening can improve the mechanical fatigue and corrosion fatigue life of the two aluminium alloys; however, the improved corrosion fatigue life of 6060 aluminium alloy under lower stress was more apparent. Zupanc [14] et al. conducted residual stress and fatigue tests on pre-corroded 7075 aluminium alloy shot-peened samples. After the pre-corrosion of the shot-peened samples, a relatively high residual compressive stress field remained on the surface, and the number of surface corrosion pits was small, thus improving the fatigue life.
Numerous studies have been reported on surface strengthening to improve the fatigue performance of materials; however, studies on the corrosion performance and corrosion fatigue behaviour of complex welded structures are rarely studied. In this study, UIT was used to strengthen the surface of the friction stir weld of 2024-T4 aluminium alloy. The microstructure, hardness and residual stress of the UIT and non-UIT samples were observed and compared. The corrosion rate and corrosion fatigue behaviour of the UIT and non-UIT samples were compared in simulated sea water in a 3.5% NaCl solution. The effects of UIT and corrosion conditions on the corrosion performance and corrosion fatigue of the aluminium alloy were evaluated.
Materials and methods
Experimental materials
2024 alloy chemical composition (mass fraction) (wt-%).
2024 alloy chemical composition (mass fraction) (wt-%).
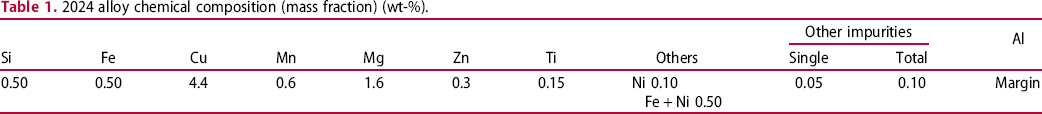
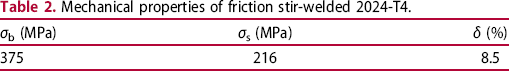
Mechanical properties of friction stir-welded 2024-T4.
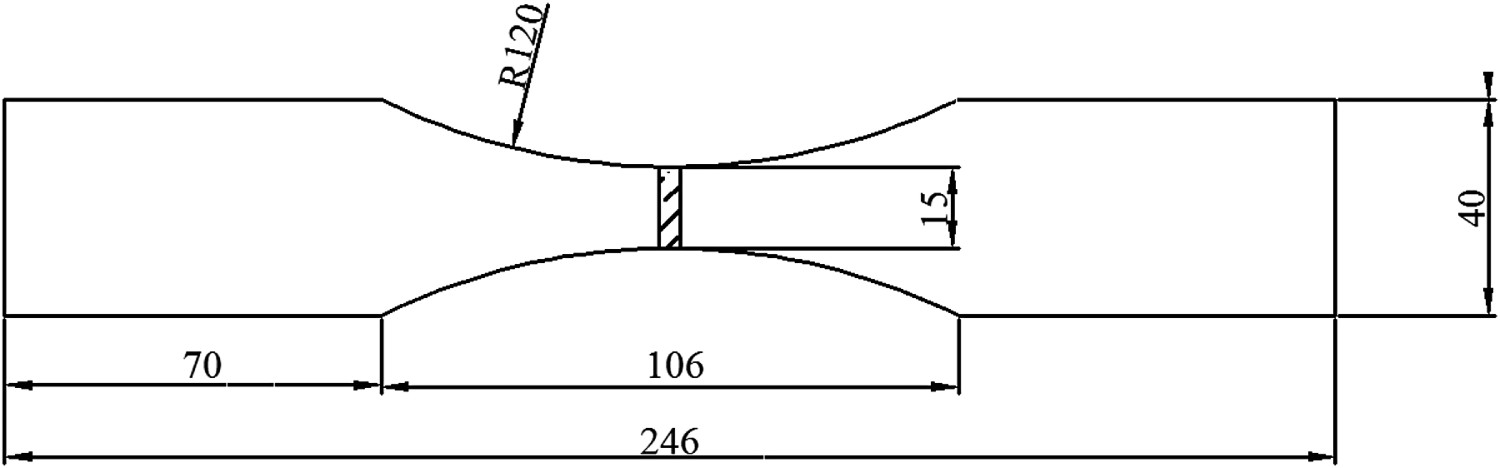
The FSW 2024-T4 aluminium alloy plate is cut along the welding seam into 40 mm × 25 mm × 4 mm samples to be corroded as shown in Figure 1. The corrosion fatigue sample size is presented in Figure 2. After FSW, the testpiece has a ‘flash’ on the surface, and its edge appears uneven and not smooth after wire cutting. Therefore, to prevent stress concentration or potential surface crack source defects, the surface and side of the sample were polished before the experiment.
Schematic diagram of corrosion sample. Schematic diagram of corrosion fatigue sample.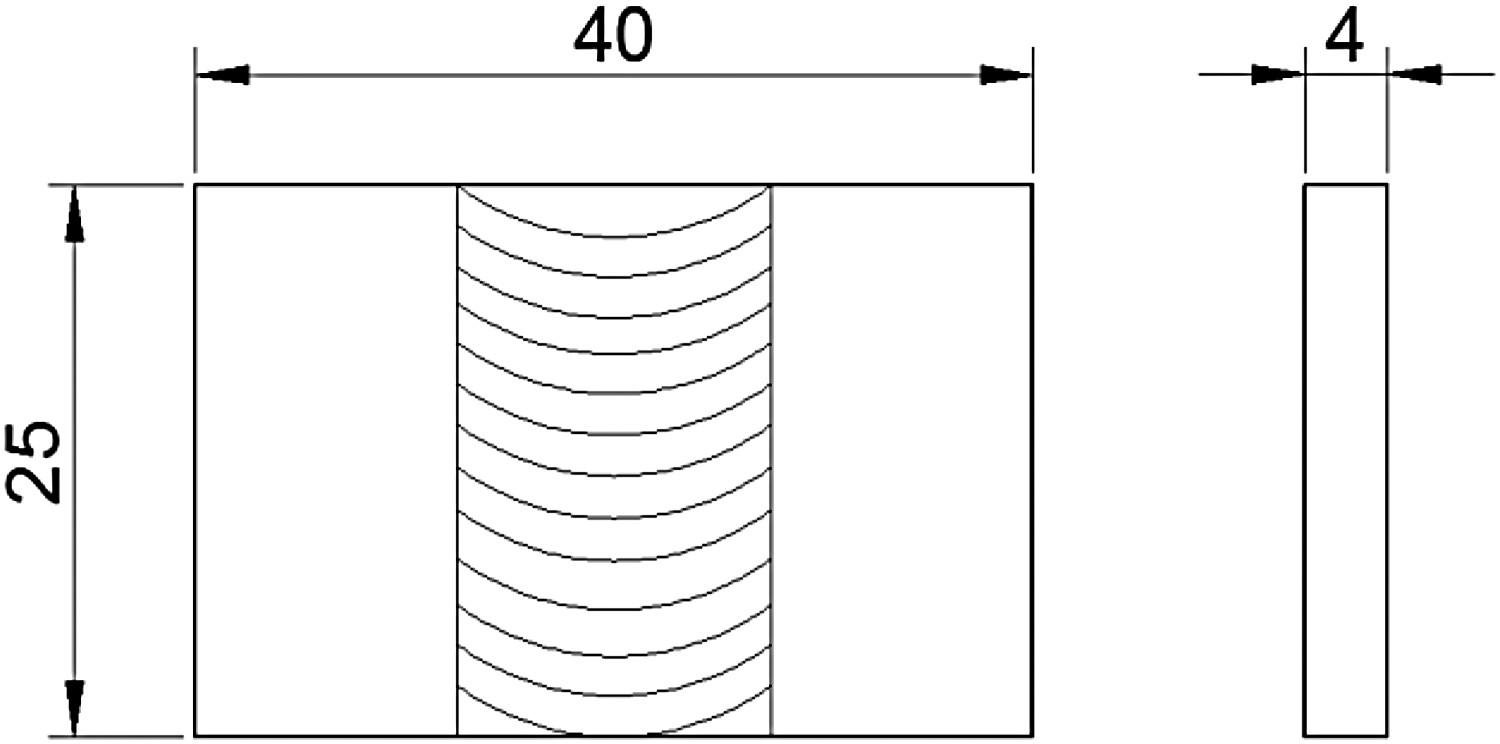
The sample was fixed on the workbench, and full-coverage UIT was performed on the surface of the weld (Figure 3). The impact gun reciprocated in the direction perpendicular to the weld to ensure that the impact coverage was not less than 100%; the ultrasonic vibration frequency was17.67 kHz, and the amplitude was 20 µm. Visual observation of the treated surface was conducted, and no untreated area was found. After the impact, slight sanding was performed to make the surface as smooth as possible.
Schematic diagram of UIT: (a) ultrasonic impact device; (b) UIT path.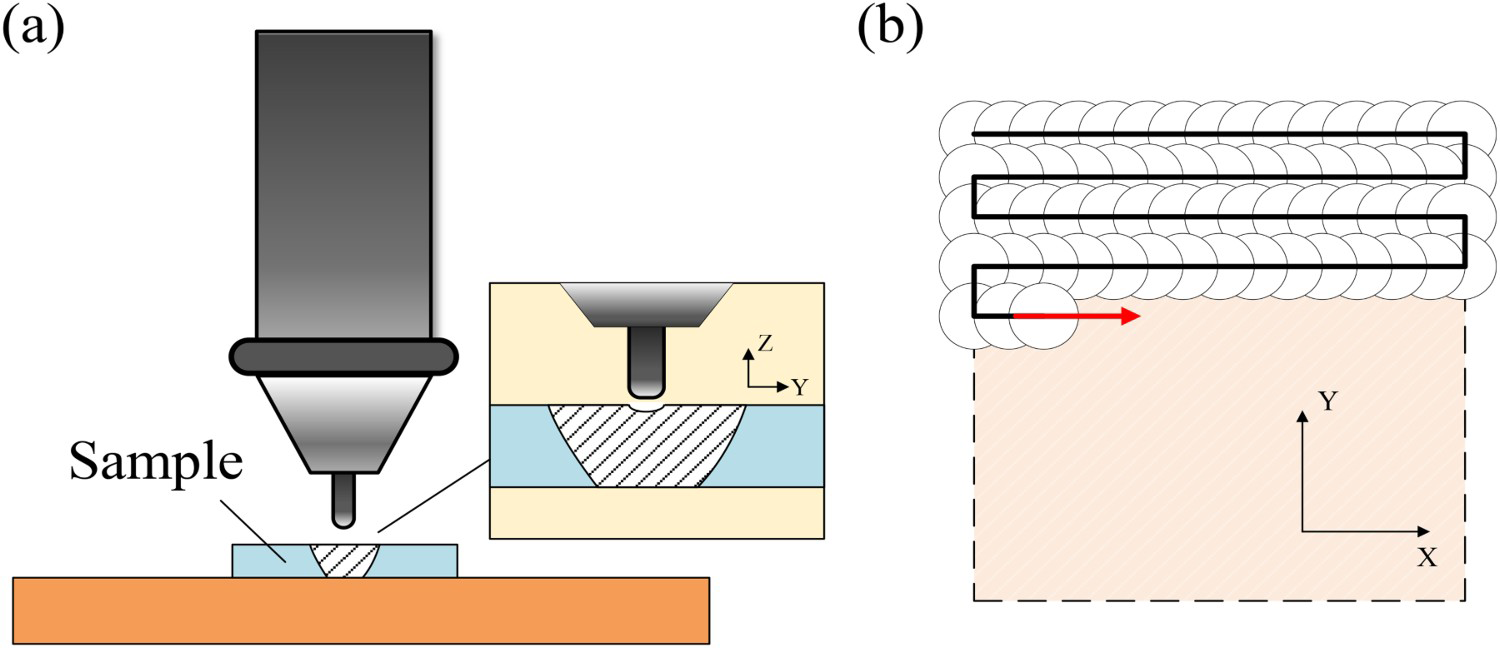
Microstructure and microhardness testing
An automatic microhardness tester was used to compare the hardness of the UIT and non-UIT FSW 2024-T4. The load was 200 g, and the load time was set to 10 s. A schematic of the hardness test is presented in Figure 4. The weld after UIT is cut, polished, polished and corroded with Keller's reagent (1 mL HF + 1.5 mL HCl + 2.5 mL HNO3 + 95 mL H2O) and then observed using an optical microscope.
Schematic diagram of hardness test.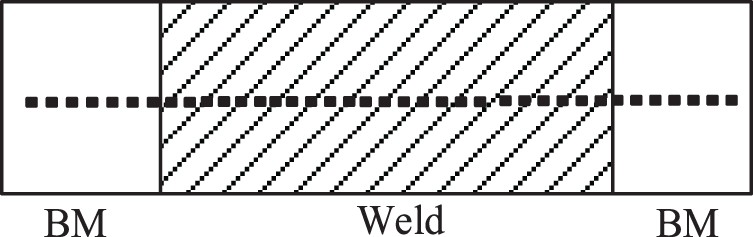
The residual stress of the UIT and non-UIT samples was measured with the µ-X360 residual stress tester. The testing conditions were as follows: CoKα target; diffraction crystal plane (3, 1, 1); X-ray tube current, 1.5 mA; voltage, 30 kV; X-ray incident angle, 25°; diffraction angle 2θ, 139.451°.
Corrosion performance test
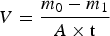
The surface of the weld was used as the corroded surface, and the rest of the sample was sealed with epoxy resin. The corrosive liquid was a 3.5% NaCl solution prepared with deionised water. The corrosive environment was set at room temperature 20 °C ± 2 °C. The UIT and non-UIT samples were divided into eight groups, based on different corrosion times: 24, 48, 72, 96, 120, 240, 360 and 480 h. Each group used three samples. The corrosive liquid was replaced once every 5 days, and the pH value within 5 days was measured: 0, 1, 2, 4, 6, 8, 12, 24, 48, 72, 96 and 120 h. Corrosion products were removed by immersion in a pickling solution, combined with ultrasonic vibration cleaning. The corrosion rate was measured using the static mass-loss method. The formula is given by
Polarisation curve testing for UIT and non-UIT samples was conducted on the AUTOLAB electrochemical workstation under the following conditions: medium, 3.5% NaCl solution; the measurement software is NOVA1.1 software; reference electrode, Ag/AgCl electrode; auxiliary electrode, platinum electrode; scanning potential range, −1.0 to −0.5 V (vs. OCP); and scanning rate, 1 mV/s. During programming, the OCP program was inserted in front of the polarisation curve and set the soaking time to 2 min. The stable potential at the end of OCP immersion was used as the self-corrosive potential. Five samples were selected for the experiment, and the most stable curve was used as the result. Three equivalent samples were selected for the electrochemical test, and the most stable curve was selected as the result.
Fatigue performance test
The fatigue life test in the median life area was performed on the non-UIT sample in air, the UIT sample in air, the non-UIT sample in 3.5% NaCl solution and the UIT sample in 3.5% NaCl solution, with four samples in each group. The fatigue test was conducted on the MTS testing machine under the following conditions: test environment, air; loading frequency, 10 Hz; and loading waveform, sine wave. The test was performed under the same stress level of 200 MPa, and the stress ratio of R = 0.06. After the sample was broken, the fracture was observed by scanning electron microscopy.
Results and discussion
Microstructure, microhardness and residual stress
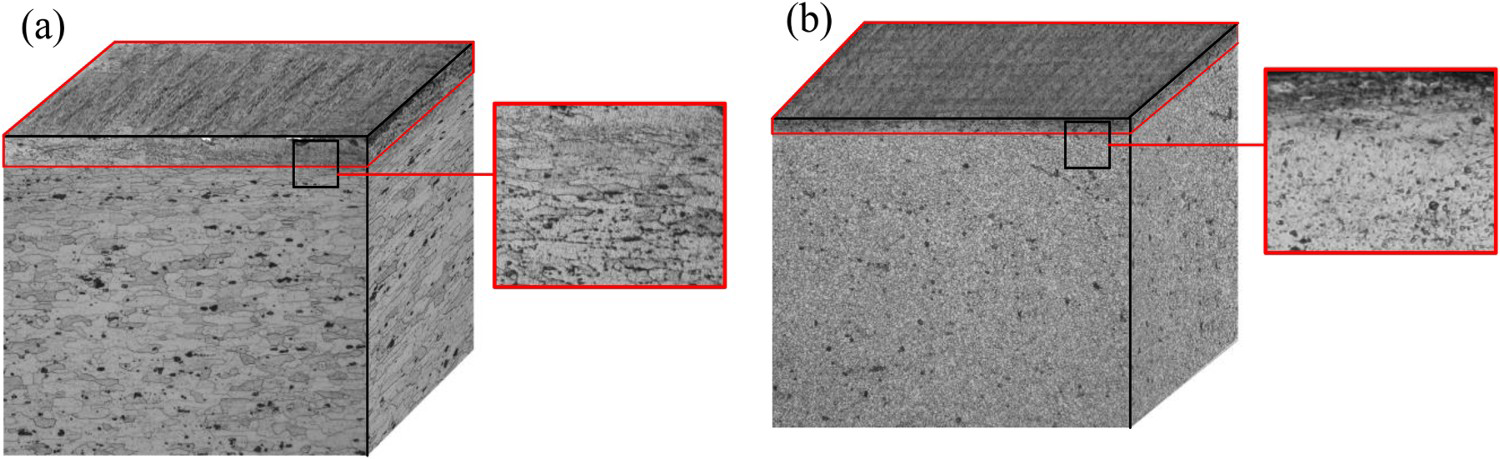
After UIT, the surface structure of the sample is refined. A schematic of the material surface structure modified by ultrasonic impact strengthening is presented in Figure 5. Ultrasonic impact causes slippage and deformation of the neatly arranged lattice on the surface of the material. The microstructure of the sample after UIT is presented in Figure 6. As shown in the figure, the grain of the sample is refined by the strong mechanical impact of the ultrasonic treatment. A deformed layer composed of fine grains is thus produced. The deformation layer produced in the base metal area is deeper than the weld nugget area, and the degree of grain refinement is greater. The reason is that during FSW, under the strong mechanical stirring and heat input of the stirring needle, the strengthening phase is evenly distributed in the structure of the weld nugget area, the original structure undergoes dynamic recrystallisation, and the dislocation density is significantly increased. The grains are reduced to small recrystallised grains. Therefore, the grain refining effect obtained by UIT is smaller than that of the base material, and the strengthening layer is relatively shallow. During welding, the sample inevitably produces defects and these defects are prone to stress concentration, which aids cracking. Ultrasonic impact surface strengthening can effectively eliminate welding defects [15] and refine the grains of the surface layer. Grain refinement hinders crack propagation between grains of different orientations and can improve the static load strength and fatigue strength of the material [16].
Schematic diagram of UIT changing the surface structure of the material. Microstructure of base metal and weld nugget treated by ultrasonic impact: (a) base material; (b) weld nugget.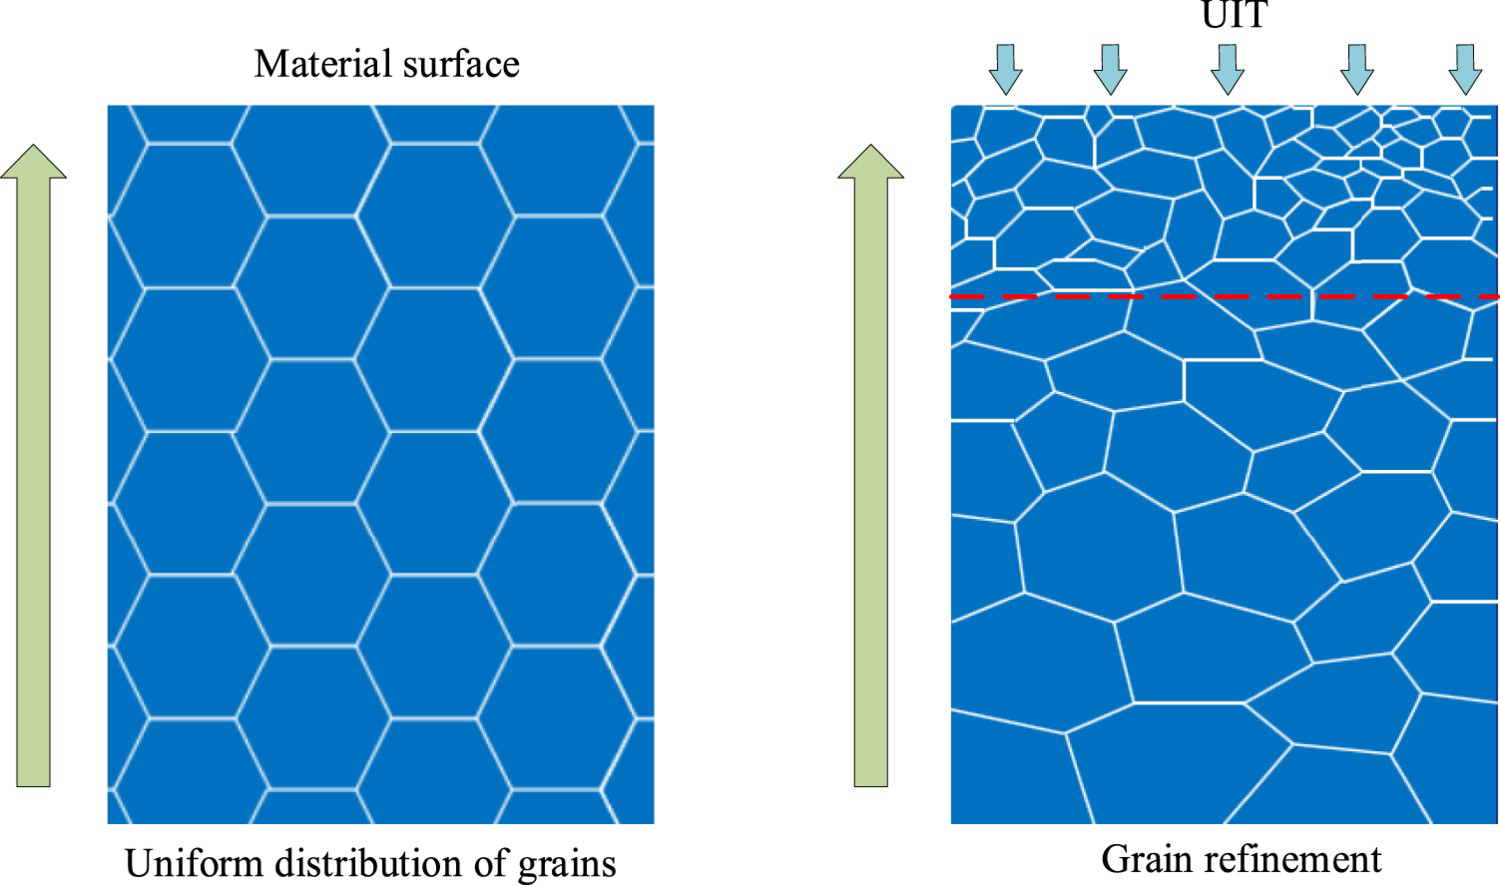
Surface hardness is the basic performance of metal materials and significantly affects fatigue performance. It can effectively show the ability to resist crack initiation [17]. Figure 7 compares the surface hardness of the non-UIT and UIT FSW 2024-T4. As shown in the figure, the hardness of the non-UIT weld area shows a high + low + high ‘W’ shape distribution, and the hardness of the UIT weld area tends to be uniform. After UIT, the overall surface hardness increases, but the increase in each area is not consistent. The largest improvement is observed in the heat-mechanical affected zone, with the lowest hardness of the entire weld. This area is subject to mechanical heat and stirring needles during welding; thus, the originally dispersed small strengthening phases are clustered under the heat effect, and the material is overaged and softened. After the UIT, the largest increase in hardness is observed. The weld nugget shows the smallest increase in hardness. During welding, the weld nugget area undergoes mechanical stirring, and the crystal grains become fine recrystallised grains. The grains exhibit a high dislocation density, with a degree of refinement. Therefore, UIT does not improve the weld nugget area.
Comparison of hardness before and after UIT.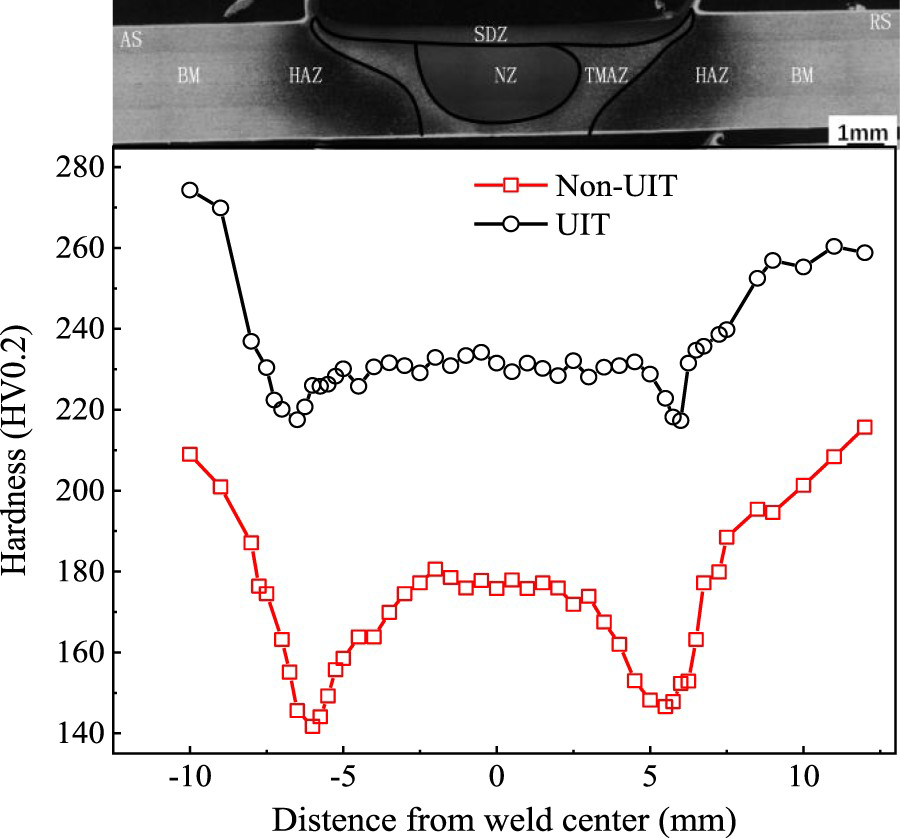
Under the action of the complex welding heat-mechanical cycle, residual stresses inevitably occur in the welded joints. Residual tensile stresses promote the initiation of fatigue cracks and considerably affect the fatigue life of the welded structure. The residual stress distribution diagram of the non-UIT and UIT samples is presented in Figure 8. As shown in the figure, a large amount of participating compressive stress is applied on the surface of the sample after UIT. Residual stress is one of the main factors affecting the fatigue performance of materials. UIT applies compressive stress on the surface of the material because ultrasonic impact causes severe plastic deformation on the surface of the material, resulting in the fragmentation of surface grains and an increase in dislocation density. Owing to the restraint of the lower layer of the material on the surface, residual compressive stress is generated on the surface of the material.
The distribution of residual stress on the surface of the UIT sample and the non-UIT sample.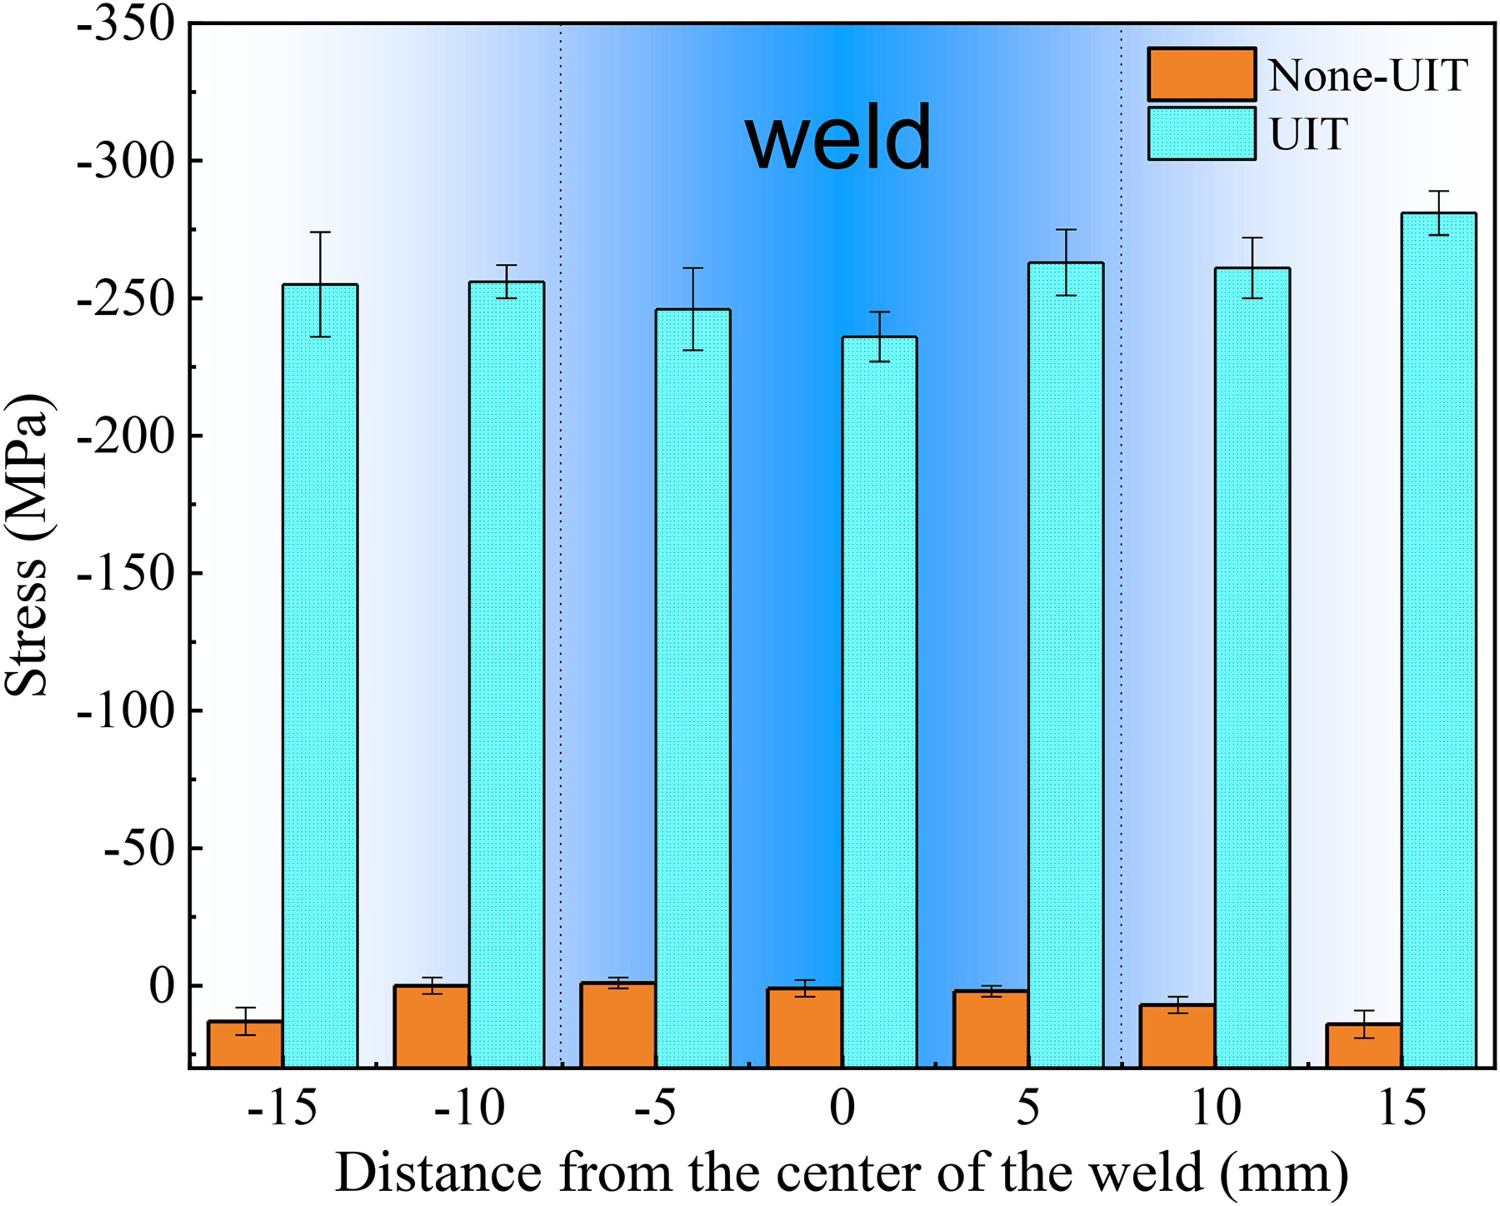
The surface morphology of the samples in a 3.5% NaCl solution with different lengths of corrosion time is presented in Figure 9. Copper (Cu) is an important element in 2024 aluminium alloy. Cu exhibits high solubility in the matrix and exerts a good solid-solution strengthening effect. This element is the main component of the main strengthening phase S (CuMgAl2) and phase θ (Al2Cu) of 2024 aluminium alloy, which significantly enhances the strength of the material [18].
Corrosion performance comparison of UIT samples and non-UIT samples: (a) non-UIT sample 48 h; (b) non-UIT sample 96 h; (c) non-UIT sample 240 h; (d) non-UIT sample 480 h; (e) UIT sample 48 h; (f) UIT sample 96 h; (g) UIT sample 240 h; (h) UIT sample 480 h.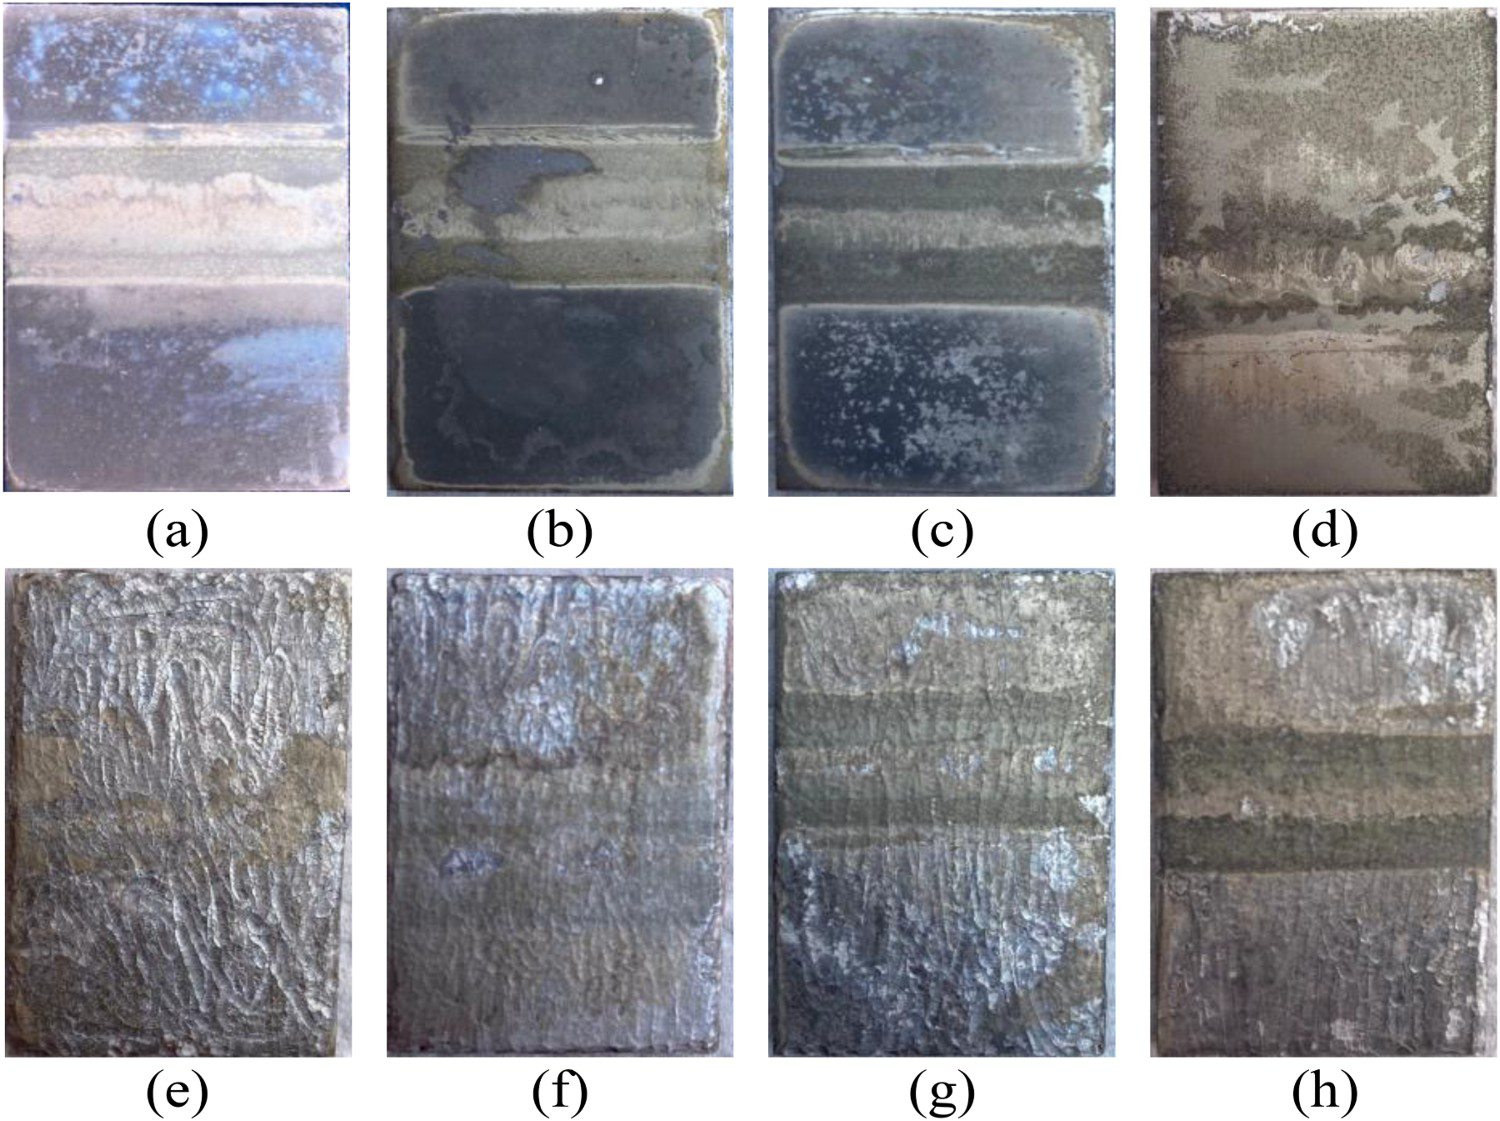
In the early stages of corrosion, the corrosion mechanism is generally based on the pitting corrosion of the second-phase dissolution, and the corrosion potential of the θ phase is close to that of the matrix. Thus, most of the alloy corrosion is accompanied by the pitting corrosion of the S phase itself and the dissolution of the surrounding matrix metal [19]. The Mg element in the S phase exhibits a higher activity and a lower potential and thus is used as an anode to be electrochemically dissolved first. When Mg is dissolved, the remaining Cu content in the S phase gradually increases, which then changes the potential difference between the particles and the matrix. As shown in Figure 9(a), red copper appears on the surface of the sample. The activity of Cu is lower than that of Al in the matrix; thus, the particles change from the anode to the cathode. The Al matrix around the Cu-rich particles starts to dissolve as the anode, causing the opening area of the pitting pit to increase continuously. Until the Al around the particles is completely dissolved, the S phase begins to fall off gradually, forming pitting pits of different sizes. Figure 9(a,e) reveals that the corrosion in the heat-affected zone of the non-UIT sample is more severe than any other zones, and the corrosion morphology of the heat-affected zone clearly varies from that of other areas. Zhang [20] argued that the degree of corrosion of the heat-affected zone is more serious in the saline water corrosion performance testing of 2A12 friction stir welds and proved this point by measuring the potentiodynamic polarisation curve. The reason is that the heat-affected zone undergoes thermal cycling during FSW, prompting the growth of crystal grains by heating. A large amount of the S phase is simultaneously precipitated. The initial stage of corrosion is mainly characterised by S phase pitting; thus, the heat-affected zone is the most severely corroded area. Figure 9(e,f) shows that the UIT sample has no apparent corroded heat-affected zone, and the UIT sample exhibits a uniform state of corrosion.
As the corrosion progresses, pitting corrosion slowly begins to transition to intergranular corrosion. Intergranular corrosion is caused by the precipitation of the S phase near the grain boundary, thereby reducing the Cu and Mg contents in the area near the grain boundary. At this time, the grains (as the anode) and the copper-poor and magnesium-poor areas at the grain boundary (as the cathode) form a corrosion galvanic cell, which accelerates the corrosion at the grain boundary and finally forms a corrosion channel, leading to intergranular corrosion damage. The friction stir weld simultaneously undergoes thermal cycling and mechanical action during welding; consequently, the energy of the grain boundary, dislocations and vacancy joints are increased, and the residual stress at the weld is characterised by tensile stress [21]. The presence of tensile stress also accelerates grain boundary corrosion. As shown in Figure 9(c), after undergoing corrosion for 240 h, the non-UIT sample shows a peeled-off surface. As shown in Figure 9(g), the UIT sample does not reveal heat-affected zone with weak corrosion resistance until the 240 h time point.
Grain size, compressive residual stress, surface roughness and corrosive environment are the key factors affecting corrosion resistance [22 24]. UIT can exert residual compressive stress on the surface of the sample and refine the surface structure, contributing to resistance to pitting corrosion, rendering the corrosion uniform and simultaneously improving the resistance of the material to intergranular corrosion. Compressive stress reduces the electrochemical activity of the metal atoms on the surface of the Al alloy and the grain boundary zone, thereby inhibiting or delaying the intergranular selective corrosion [8]. The residual compressive stress introduced by UIT can also offset the tensile stress caused by the wedging effect of a certain corrosion product after intergranular corrosion, which can also slow down the intergranular corrosion of the material. The grain refinement caused by UIT can destroy the grain boundary corrosion active channel on the surface of the material. Consequently, the local selective corrosion of the grain boundary can be effectively controlled, resulting in uniform corrosion and delaying the generation and development of intergranular corrosion.
In the early stages of corrosion, when CuMgAl2 particles are transformed from the anode to the cathode, a large number of OH– ions are produced. Consequently, the pH of the etching solution rises, and the pH value changes, as shown in Figure 10. During corrosion, the pH value falls within the 6.49-6.84 range, exerting no effect on the corrosivity of the sample.
Corrosion solution pH.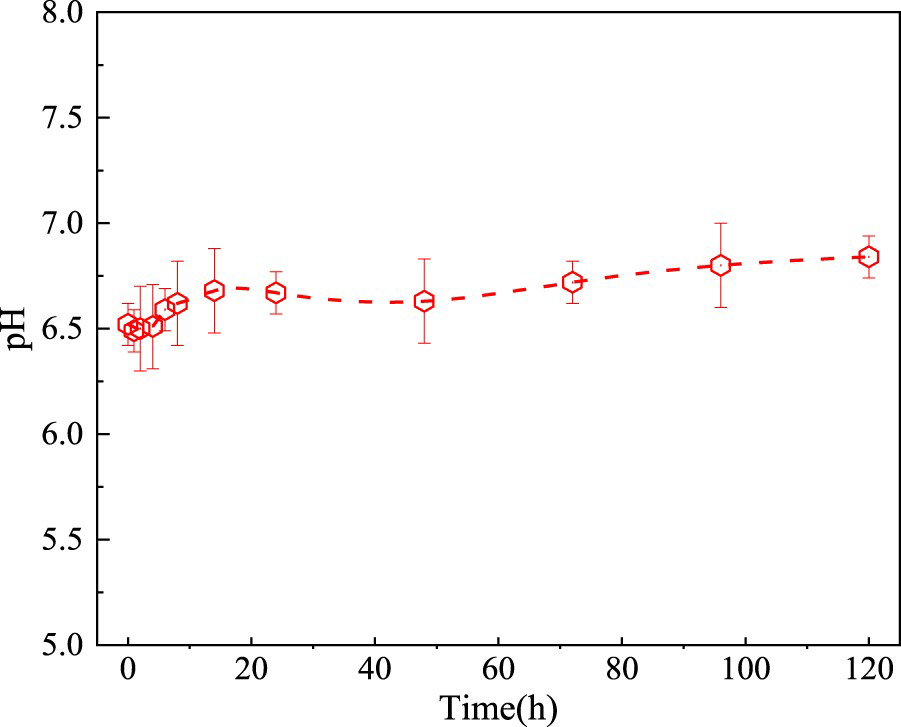
Figure 11 presents the time curve of the corrosion rate of the non-UIT and UIT samples in the 3.5% NaCl solution. The corrosion rate of the UIT sample is generally lower than that of the non-UIT sample. In the initial stages of corrosion, both the UIT and non-UIT samples exhibit a fast corrosion rate, which then decreases slowly. The corrosive liquid directly comes in contact with the substrate because FSW destroys the aluminium-clad layer. This behaviour varies from the tendency of the corrosion rate of aluminium alloy to increase and then decrease in the early stages of corrosion [25]. The corrosion rate of the FSW aluminium alloy is higher in the initial stages of corrosion. The non-UIT sample is mainly caused by the generation of pitting corrosion and the corrosion and dissolution of the S phase in the initial stages. This process gradually expands the area of the corrosion pit, which shows a higher corrosion rate. However, no obvious pitting corrosion is observed in the UIT samples, which present a uniformly corroded morphology, and the rate is lower than that of the non-UIT samples. As corrosion progresses, pitting corrosion slowly changes to intergranular corrosion. At this time, the quality is slightly reduced. In the figure, the non-UIT sample shows a decrease in corrosion rate. The UIT sample is more uniformly corroded, and with UIT, residual compressive stress is exerted on the surface, and the surface structure is refined. These changes further improve the material intergranular corrosion resistance of the material, hence the decreases in a rate reduction. As pitting corrosion and intergranular corrosion progress, a corrosion channel is formed, which eventually leads to denudation and consequently, severe loss of quality. The non-UIT sample shows an increasing corrosion rate caused by residual tensile stress, which promotes the activity of the grain boundary metal elements and increases the potential difference between the grain boundary and the inside of the grain. This occurrence is conducive to the development of intergranular corrosion. Simultaneously, the volume of intergranular corrosion products is larger than the original aluminium alloy consumed by corrosion and dissolution, and the corrosion products generate external thrust on the elongated grains during rolling in the form of wedging [26]. Owing to the wedging and extrapolation of corrosion products, corrosion continues and produces stress concentration at the tip of the interface, allowing spalling corrosion and stress corrosion cracking to develop [27]. However, the corrosion rate of the UIT sample does not increase because compressive stress inhibits the selective corrosion of the metal grain boundary and exerts a certain closing effect on cracks caused by corrosion, preventing the corrosive medium from entering the inside of the crevice, thereby reducing the degree of intergranular corrosion [8]. A comparison of the corrosion rates of the UIT and non-UIT samples reveals that the average corrosion rate of the untreated samples is about 0.2445 g m–2 h–1, and the average corrosion rate of the samples subjected to UIT is about 0.1492 g m–2 h–1. The corrosion rate is reduced by 39%.
Corrosion rate of UIT sample and non-UIT sample.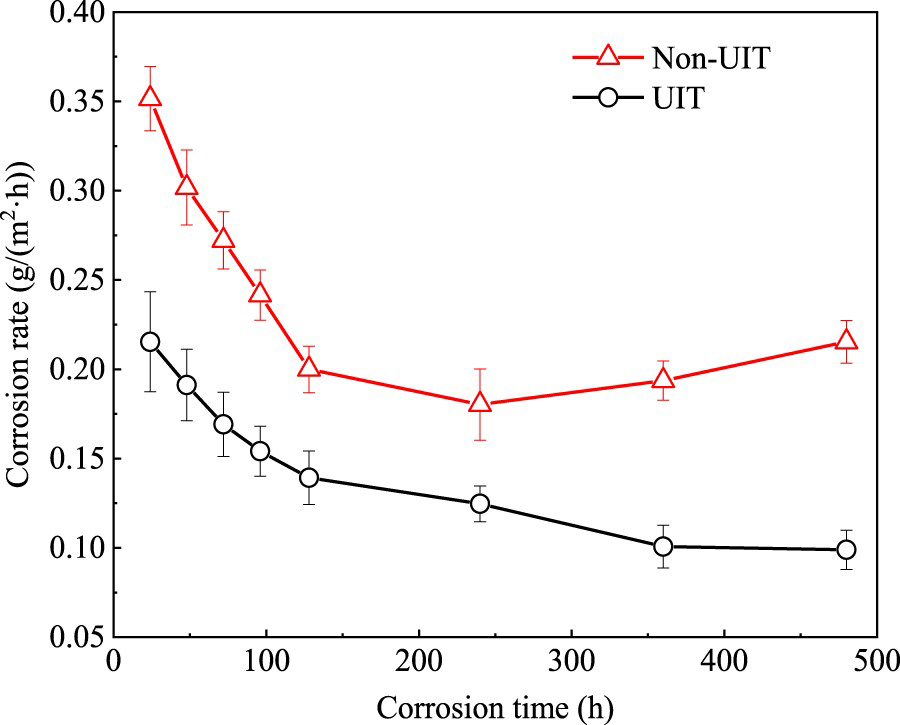
Figure 12 presents the potential polarisation curve of the weld of the UIT and non-UIT samples in a 3.5% NaCl solution. It can be seen that the UIT and Non-UIT samples are in the form of anodic dissolution. The non-UIT sample has no passivation, in the anode polarization curve, the corrosion current density increases rapidly with the increase of potential, while the UIT sample has passivation as the polarisation potential increases. The corrosion current density can clearly indicate the corrosion rate of the sample. The less the corrosion current density, the lower the corrosion rate. The corrosion current density of the UIT sample approximation reduced to 1.943 × 10⁻⁷ A cm–2 compared with 1.6846 × 10 –6 A cm–2 of the non-UIT sample. Taking advantage of corrosion current density, the corrosion rate can be estimated to Faraday's law.
Corrosion rate of UIT sample and non-UIT sample.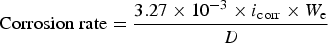
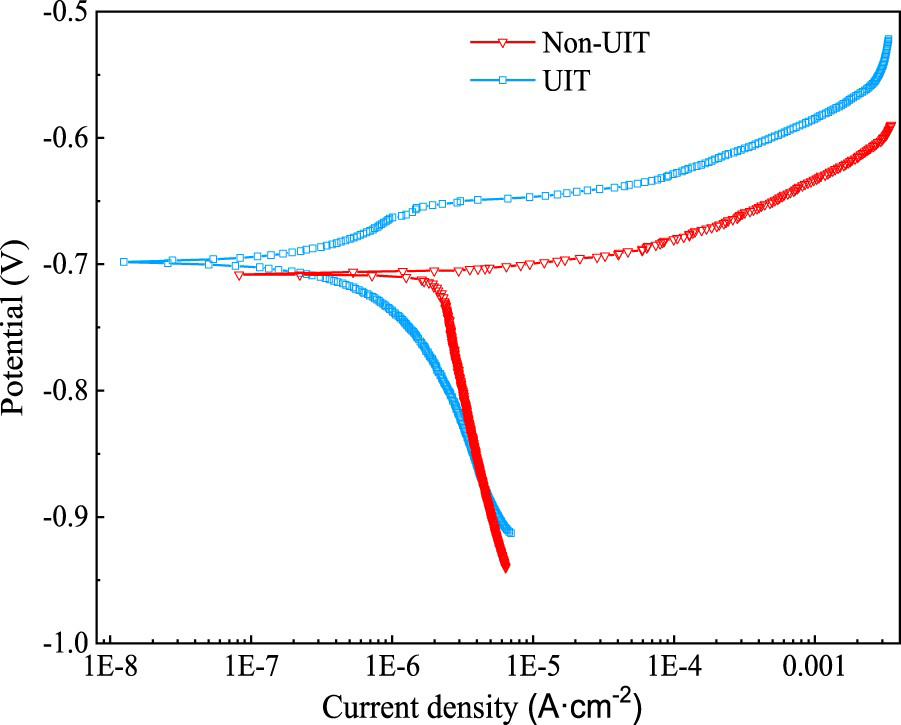
UIT can refine the grains on the surface of the sample and produce a large number of grain boundaries. Compared with the Non-UIT sample, a large number of grain boundaries can provide more diffusion channels, so that a denser passivation film is formed on the surface of the sample, thereby improving the corrosion resistance. After UIT, the corrosion current density of the sample decreases, and the corrosion rate also decreases according to the formula which is consistent with that obtained by mass-loss method.
Corrosion strength is usually indicated by the mass-loss rate V−, which is the loss rate of material quality. This parameter is typically used in electrochemical corrosion research [28]. Figure 13 shows the mass-loss rate of the UIT and non-UIT samples. The mass-loss caused by pitting when corrosion starts is considerably small, corresponding to the mild corrosion of the sample at the beginning. After the corrosion of the sample for 96 h, the mass-loss rate remains unchanged for a certain period, corresponding to the reduction in the corrosion rate. This stage is the development stage from pitting corrosion to intergranular corrosion, and the mass-loss decreases. The mass-loss rate begins to rise linearly, corresponding to the increase in the corrosion rate. Erosion starts at this stage. The figure also shows that the severity of corrosion in the UIT sample is much less than that in the non-UIT sample. When the corrosion time is set to 480 h, the mass-loss rate of the UIT sample is only 46.8% of that of the non-UIT sample.
Sample mass-loss rate.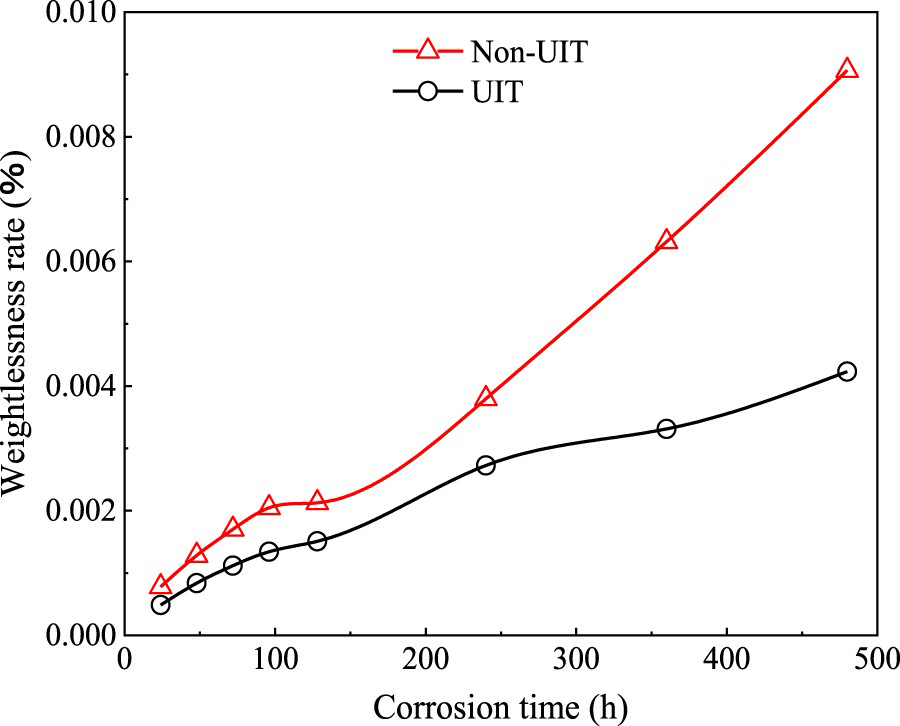
The morphology of corrosion pits over different lengths of corrosion time is shown in Figure 14. Non-UIT samples in the early stages of corrosion are shown in Figure 14(a,b). The Al matrix around the Cu-rich particles starts to dissolve as the anode; thus, the S phase falls off, causing corrosion pits on the surface of the samples. As corrosion time increases, corrosion pits gradually increase. No corrosion pits are clearly visible in the UIT samples, indicating the occurrence of uniform corrosion, as shown in Figure 14(e,f). When the corrosion time is set to 240 h, the surface of the non-UIT sample begins to peel off, as shown in Figure 14(c), gradually falling off from the middle of the corrosion pit to the surroundings. As shown in Figure 14(g), numerous small holes caused by corrosion gradually appear on the surface of the UIT sample, but no obvious corrosion pit is observed, indicating uniform corrosion. At this time, the heat-affected zone with the lowest corrosion resistance is observed, corresponding to Figure 9(g). As shown in Figure 14(d), when the corrosion time is 480 h, the non-UIT sample is largely peeled off, severely damaging the surface morphology. Moreover, when the corrosion time is 480 h, the non-UIT sample exhibits significant shedding and the surface morphology is severely damaged by corrosion. As shown in Figure 14(h), a large area on the surface of the UIT sample also exhibits signs of corrosion, but the surface morphology remains intact; no apparent shedding occurs, and uniform corrosion is indicated.
Corrosion different time surface morphology: (a) non-UIT sample 48 h; (b) non-UIT sample 96 h; (c) non-UIT sample 240 h; (d) non-UIT sample 480 h; (e) UIT sample 48 h; (f) UIT sample 96 h; (g) UIT sample 240 h; (h) UIT sample 480 h.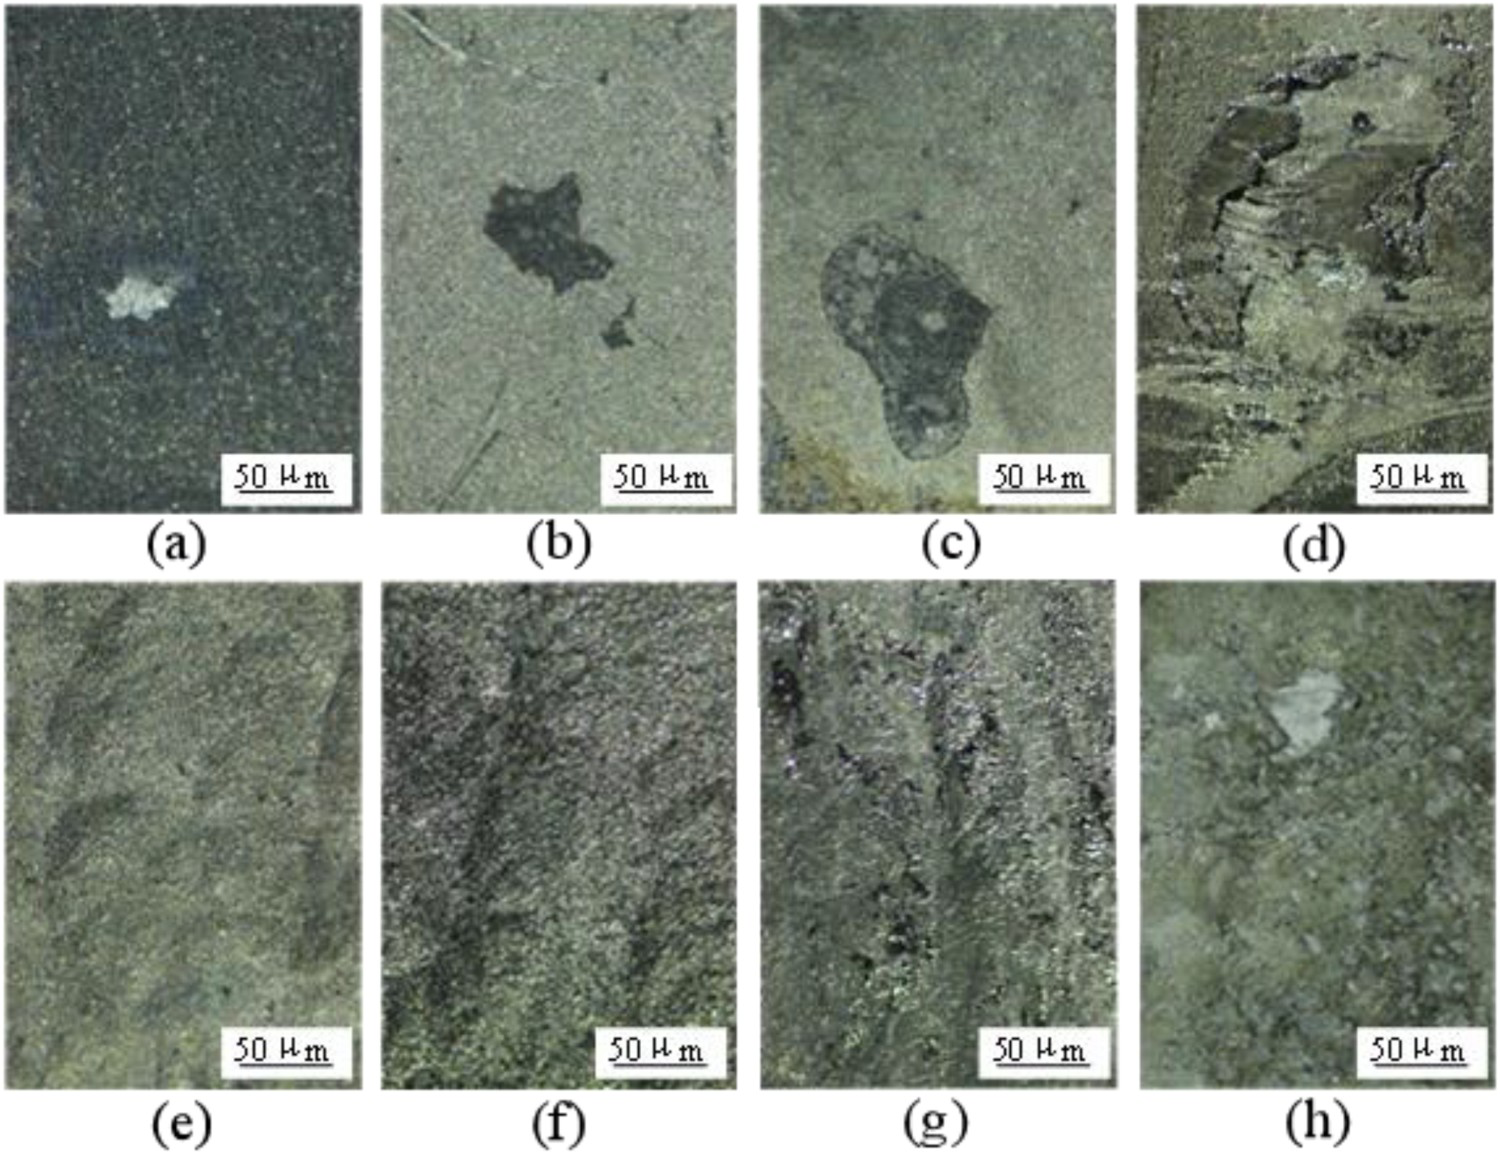
FSW 2024-T4 aluminium alloy UIT and non-UIT samples in air and the 3.5% NaCl solution were evaluated for fatigue life in the median life area (Figure 15).
Samples fatigue life.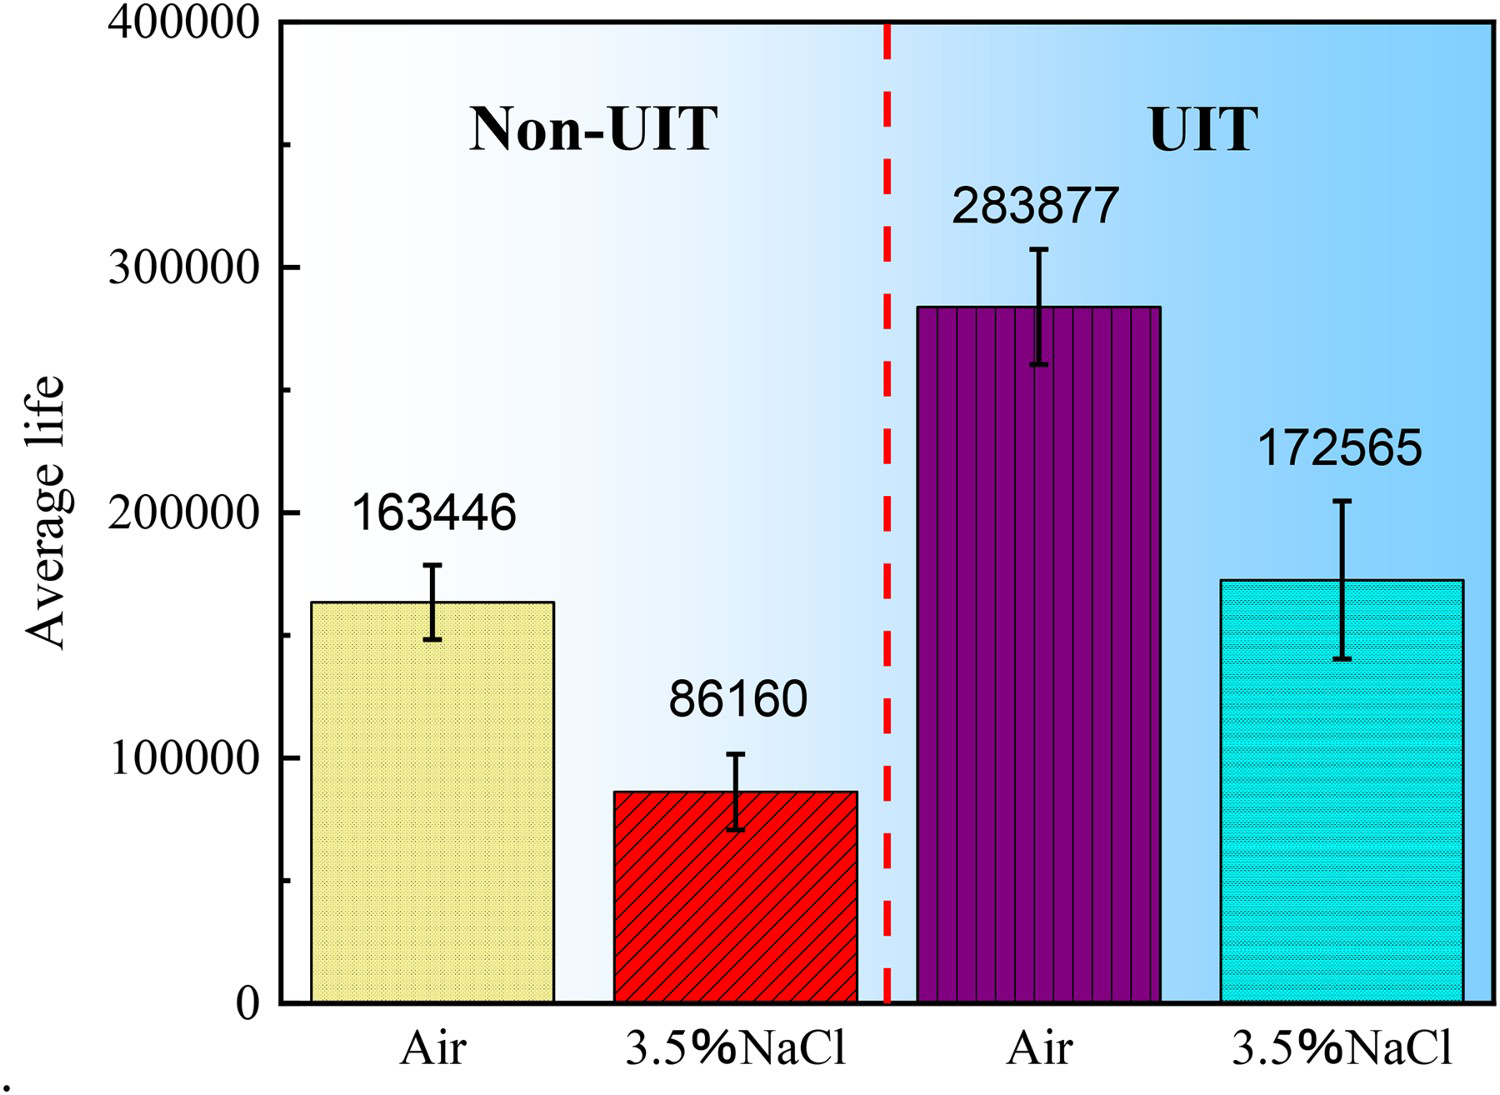
According to test results, when the stress is 200 MPa, the average life of the non-UIT samples in the air is 163,446, and that of the UIT samples is 283,877. Meanwhile, the average life of non-UIT samples in the 3.5% NaCl solution is 86,160, and that of the UIT samples is 172,565. The life of the samples in the 3.5% NaCl solution decreases markedly, and the life of the non-UIT samples in the 3.5% NaCl solution is only 52.7% of that in air. UIT can significantly increase the life of the sample. The life of the UIT samples in the air is 1.74 times that of the non-UIT samples, and the life of the UIT samples in salt water is twice that of the non-UIT samples.
In a corrosive environment (3.5% NaCl solution), pitting pits of different sizes are formed on the surface of the sample, together with the shedding of the S phase. The source of the fatigue cracks in the aluminium alloy is generally the stress concentration caused by pitting corrosion [29,30]. Pitting corrosion leads to faster crack initiation in the sample. The corrosive environment induces grain boundary sensitisation, thereby reducing the bonding force between the grain boundaries. This occurrence facilitates crack growth along the grain, ultimately shortening the fatigue life. UIT can apply residual compressive stress on the surface of the sample. The technique can also refine the grains of the surface and produce lattice distortion. The applied residual compressive stress can offset part of the external tensile stress acting on the material, thereby reducing the actual tensile stress and indirectly increasing the critical load required for crack initiation. Grain refinement and lattice distortion help restrict and hinder the movement of dislocations in the grains, inhibiting crack propagation. Moreover, UIT refines the grains of the surface layer, resulting in uniform corrosion and preventing pitting corrosion to a certain extent. The compressive stress introduced by UIT can inhibit the electrochemical activity of surface metal atoms to inhibit or delay intergranular selective corrosion [8]; after intergranular corrosion, the compressive stress can offset the tensile stress attributed to the wedging of certain corrosion products. This process can also slow down the intergranular corrosion of the material. The fatigue life of the sample is ultimately improved.
The fatigue sources of UIT and non-UIT samples in different environments are shown in Figure 16. The crack source of the non-UIT sample in the air is located at the surface welding defect and at the intersection of the radial lines, as shown in Figure 16(a). The sample crack source in a 3.5% NaCl solution is also located at the welding defect; however, many holes are corroded in the crack source area, as shown in Figure 16(b). The corrosive environment causes the welding defects on the surface of the sample to be corroded, resulting in greater stress concentration and accelerating the initiation of fatigue. The crack source of the UIT sample in the air is shown in Figure 16(c). After the sample undergoes UIT, the crack source is transferred from the surface to the subsurface below the strengthening layer, and the crack tends to extend to the surface of the sample. Numerous steps and ridges are formed at the intersection of the radial lines, rendering the crack source relatively rough, because the crack initiation of the ultrasonic shock sample is not in the same plane. Whether or not the sample is subjected to UIT, the crack source of the sample in salt water is located in the corrosion area of the sample surface. However, unlike those in the non-UIT sample, the surface welding defects in the UIT sample are effectively eliminated, and corrosion is the main factor of crack initiation, as shown in Figure 16(d). Magnification of the crack source area reveals the apparent characteristics of intergranular corrosion – that is, the grain profile is relatively complete.
Crack source: (a) non-UIT sample in the air; (b) non-UIT sample in the 3.5% NaCl solution; (c) UIT sample in the air; (d) UIT sample in the 3.5% NaCl solution.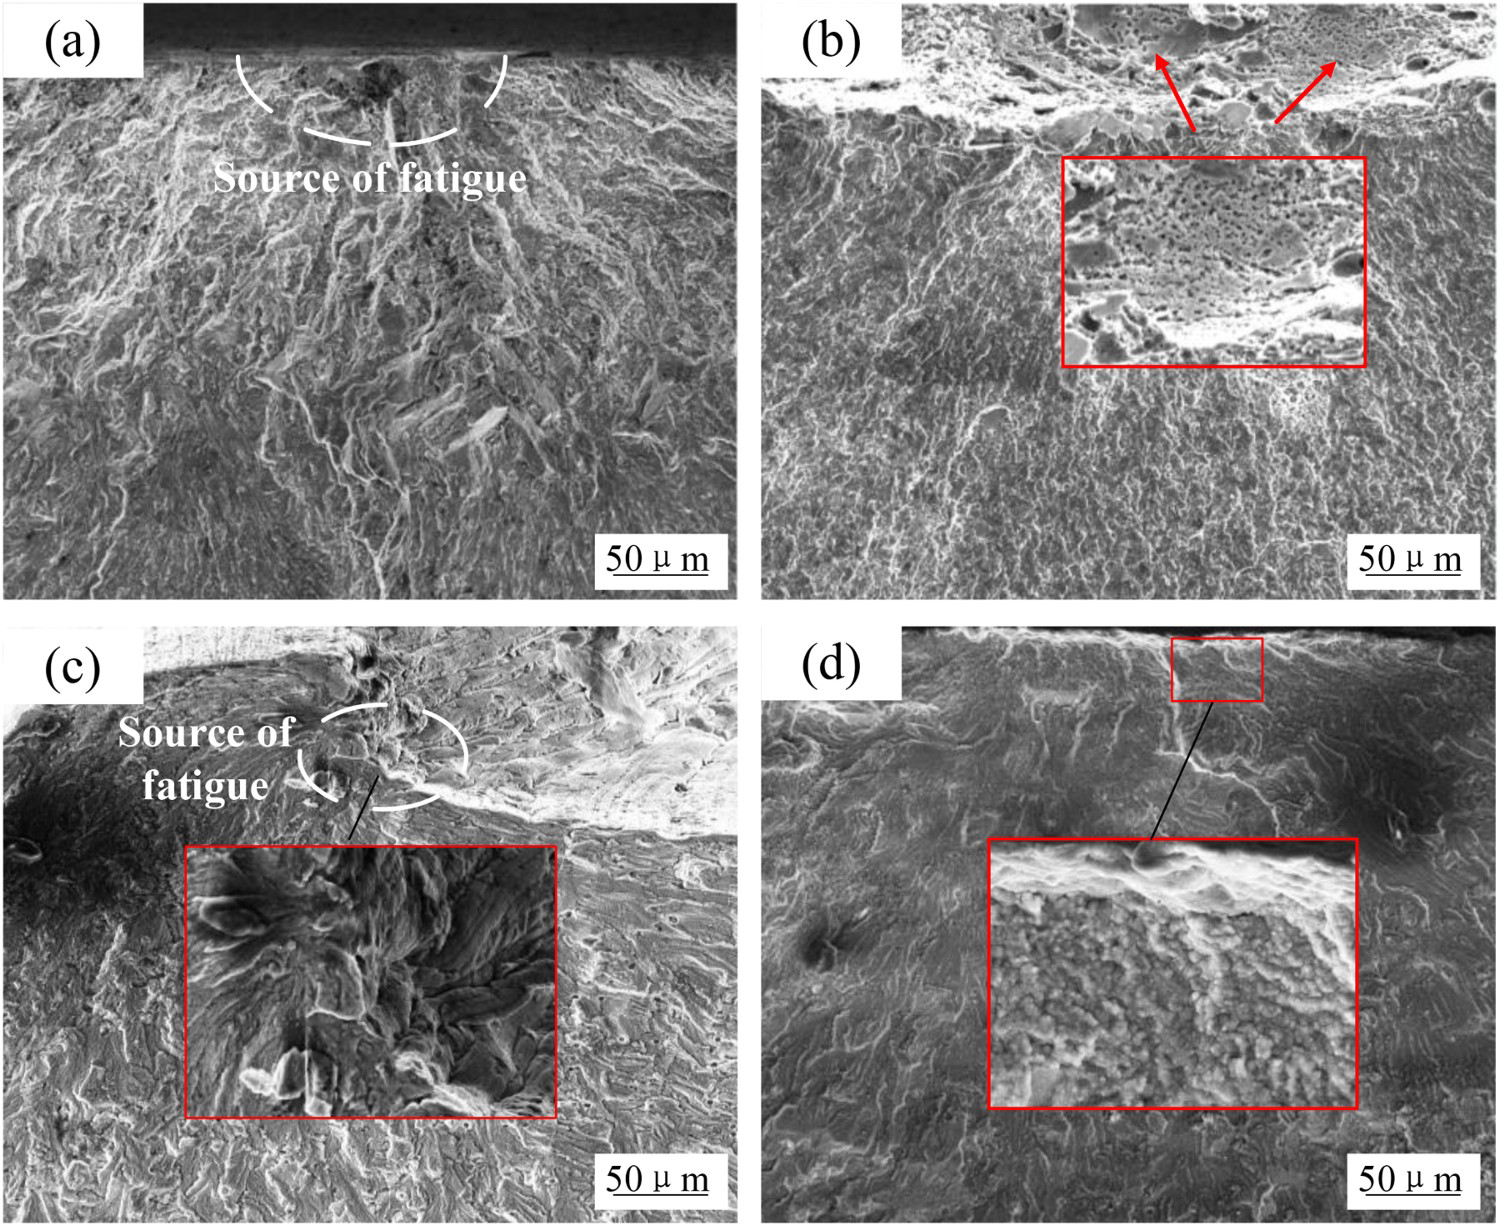
In the steady-state expansion zone, whether the sample is in the air or in the 3.5% NaCl solution, the fracture surface is flat, obvious fatigue lines perpendicular to the crack propagation are generated, and secondary cracks appear. However, the secondary cracks of the sample in the 3.5% NaCl solution are markedly larger than those in the air. The reason is that the effect of cyclic load on the crack is perpendicular to the direction of crack propagation; in addition, the corrosion is not directional, and corrosion cracking causes more and larger secondary cracks in the sample immersed in the 3.5% NaCl solution [31]. Figure 17(b) shows the closure behaviour of the secondary cracks generated by the grain boundary due to corrosion. On the basis of the fatigue lines, the fatigue line spacing of the sample in the 3.5% NaCl solution is larger than that in the air, which reflects the faster crack growth of the sample in the 3.5% NaCl solution from the side. The UIT sample appears similar to the non-UIT sample in the steady-state expansion zone – that is, with obvious fatigue streaks and secondary cracks.
Steady-state expansion area: (a) Non-UIT sample in the air; (b) non-UIT sample in the 3.5% NaCl solution; (c) UIT sample in the air; (d) UIT sample in the 3.5% NaCl solution.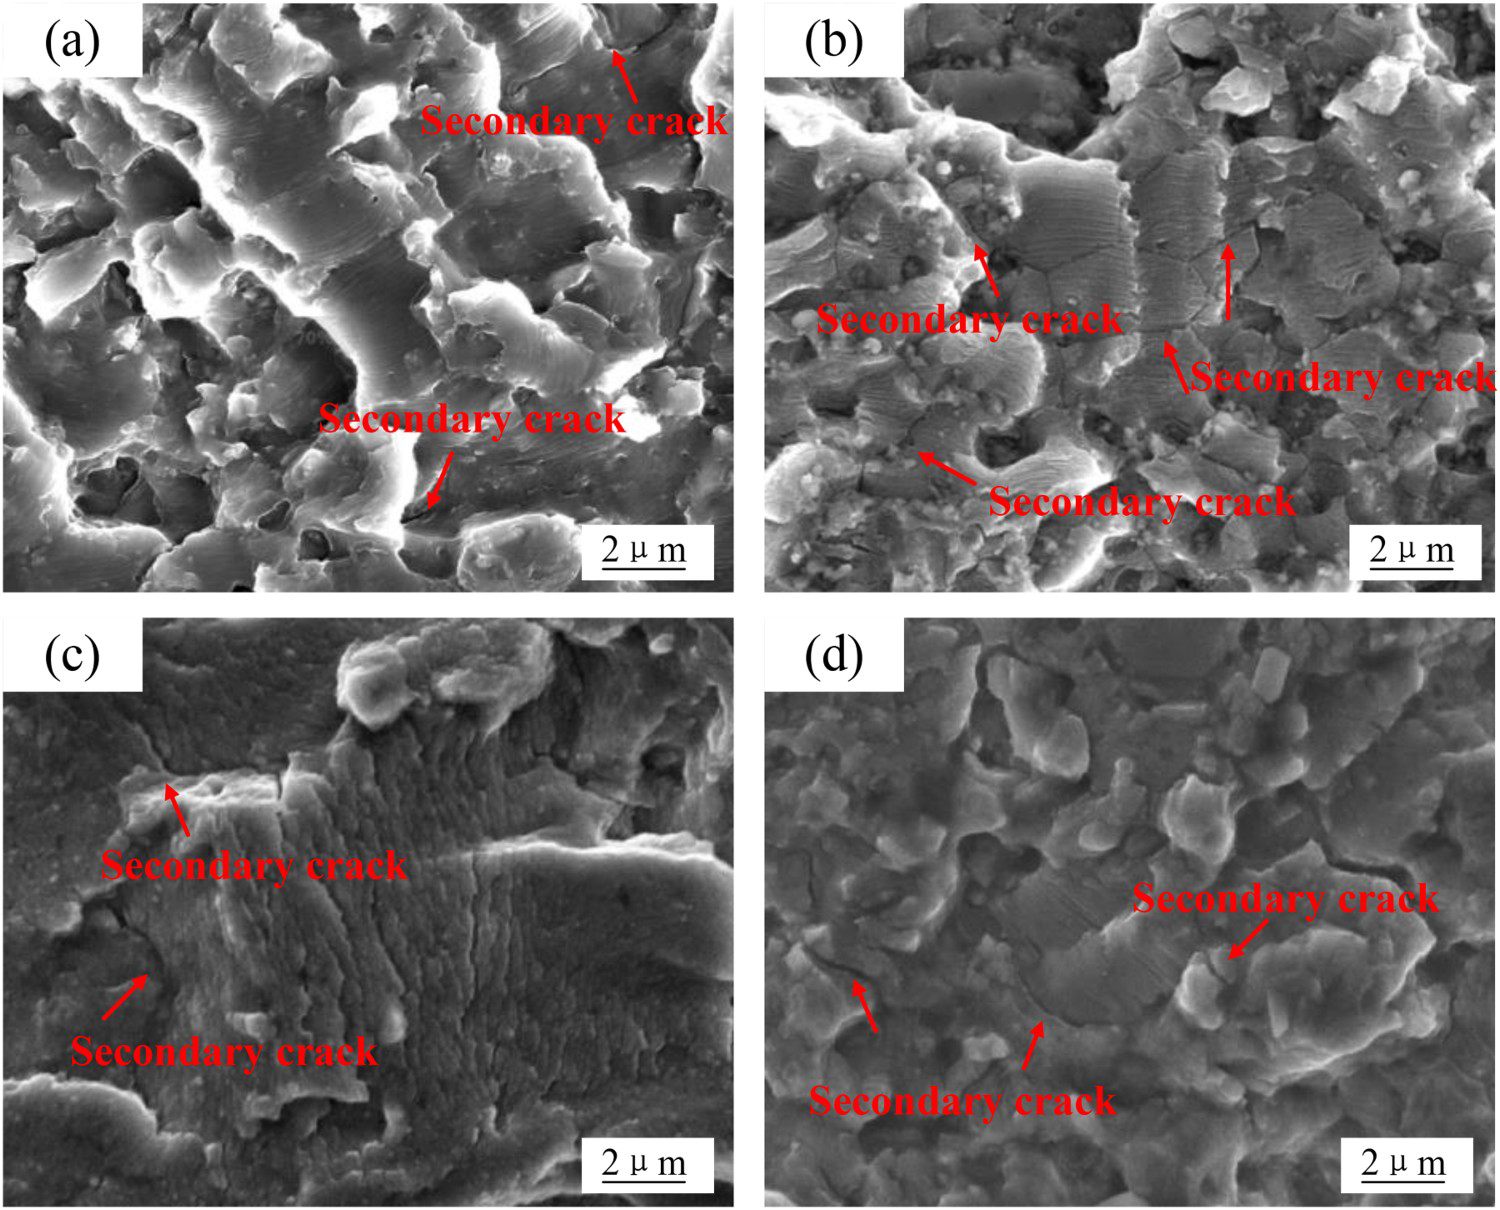
In the transient region, the morphology of the UIT sample t is similar to that of the non-UIT sample, as shown in Figure 18. The dimples of the UIT and non-UIT samples in the air are similar in size and evenly distributed on the fracture surface, as shown in Figure 18(a,c). The instantaneous area of the samples in the 3.5% NaCl solution is fuzzy and dim owing to corrosion, the size of the dimples is uneven and some microcracks are formed, as shown in Figure 18(b,d). The reason is that the corrosive environment reduces the plasticity of the weld and sensitises the grain boundary, promoting the formation of intergranular cracks.
Transient area: (a) Non-UIT sample in the air; (b) non-UIT sample in the 3.5% NaCl solution; (c) UIT sample in the air; (d) UIT sample in the 3.5% NaCl solution.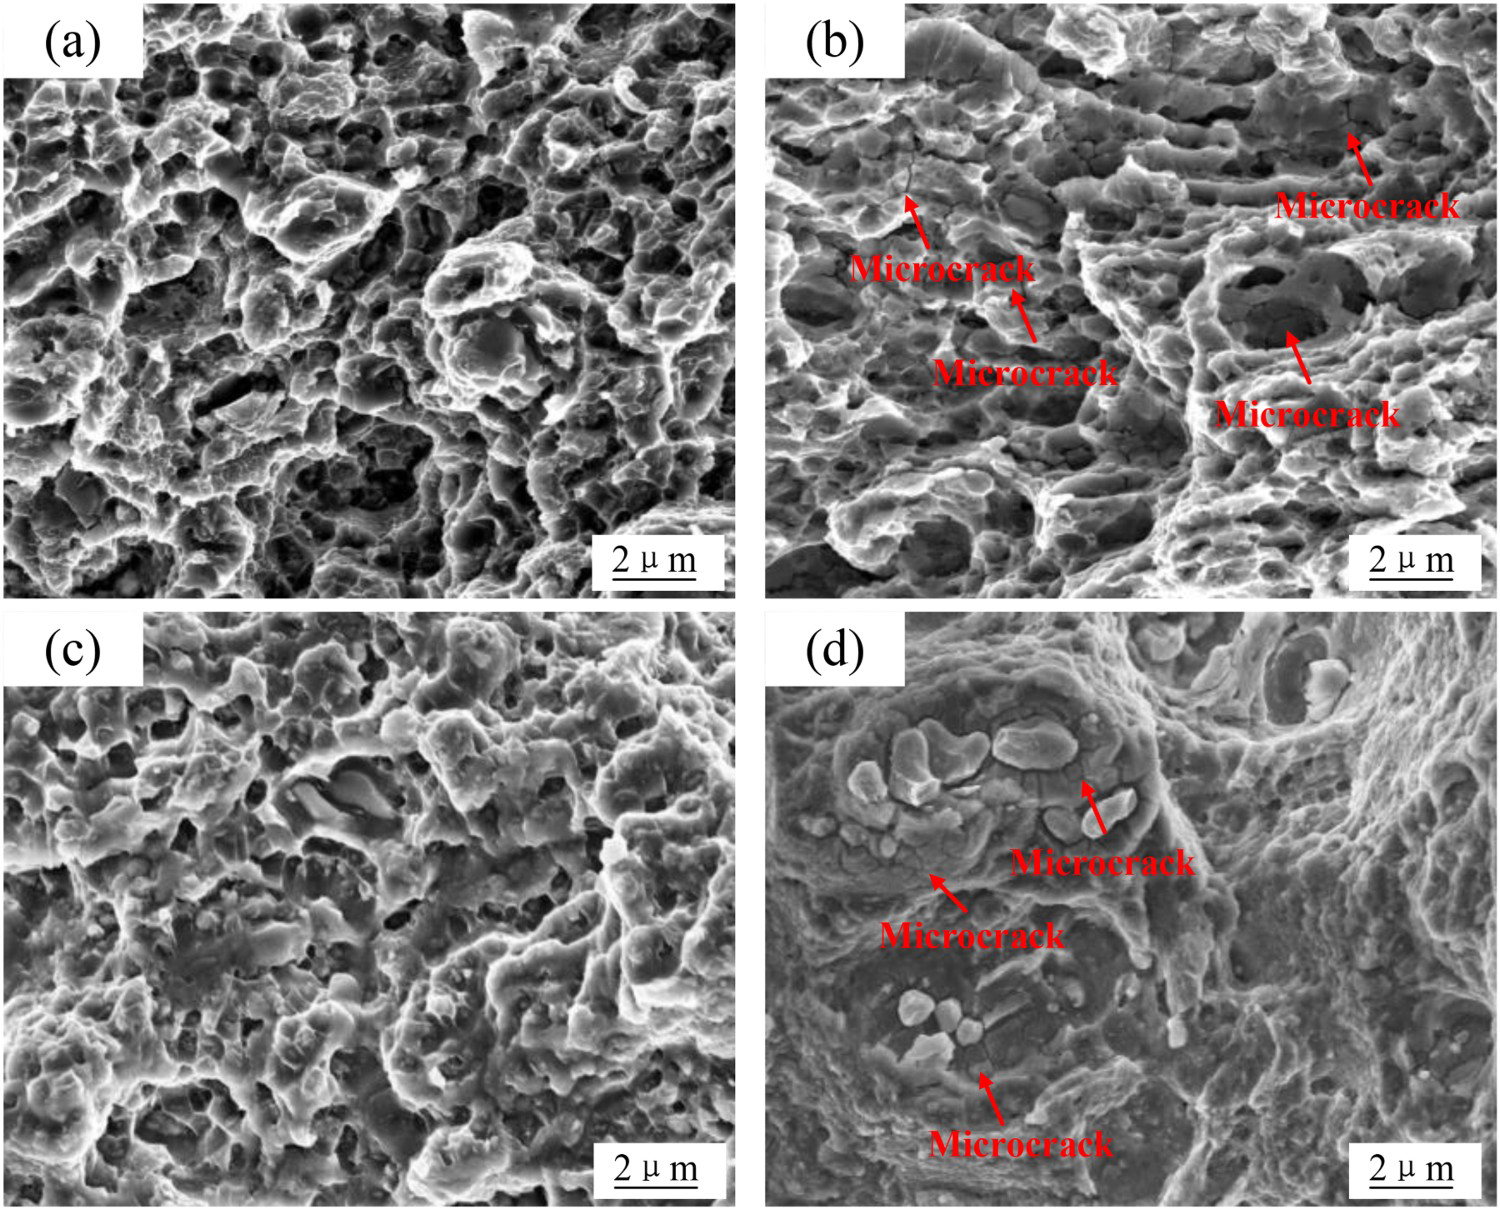
In this study, UIT was used to strengthen the surface of friction stir-welded 2024-T4 alloy samples. UIT and non-UIT samples are compared with respect to microstructure, surface hardness, residual stress and corrosion performance and corrosion fatigue behaviour in the 3.5% NaCl solution. The major conclusions are as follows:
UIT can refine the grains on the surface of the material to form a dense plastic deformation layer and increase the surface hardness while applying residual compressive stress on the surface of the sample. Owing to the small grain size of the weld nugget area, the strengthening layer is shallower than the base material area. Pitting corrosion is initially observed in the non-UIT sample and then develops to intergranular corrosion and finally to surface erosion. No obvious pitting corrosion is found in the UIT sample, which exhibits uniform corrosion. The corrosion resistance of the UIT sample in the 3.5% NaCl solution is significantly improved. Both the immersion mass-loss method and the potential polarisation curve indicate that the UIT samples have a lower corrosion rate, compared with the non-UIT sample. The corrosion severity of the UIT sample is far less than that of the non-UIT sample. When the corrosion time is 480 h, the mass-loss rate of the UIT sample is only 46.8% of that of the non-UIT sample. UIT can significantly improve the life of the sample. The life of the UIT sample in the air is 1.74 times that of the non-UIT sample, and the life of the UIT sample in the 3.5% NaCl solution is twice that of the non-UIT sample. Observation of the fatigue fracture indicates that the fatigue source of the UIT sample in the air is transferred from the surface to the subsurface. The fatigue source in the 3.5% NaCl solution is located in the corrosion area of the UIT and non-UIT sample surface. Owing to corrosion, numerous microcracks are formed in the samples immersed in the 3.5% NaCl solution during crack propagation.
Footnotes
Disclosure statement
No potential conflict of interest was reported by the author(s).