
Abstract
The electro-osmotic pulse (EOP) systems are widely used for damp-proofing the basements of buildings. However, the cathode of EOP systems will produce stray current interference, posing risks of electrochemical corrosion to the buried steel pipe. This paper introduces a series of on-site tests and numerical simulations conducted in a townhouse alley equipped with EOP systems. The corrosion risk produced by EOP was evaluated and corrosion mitigation measurements were discussed. The results show that the EOP system produces 1 Hz pulse dynamic direct current in the soil, resulting in the average ground potential of gas pipes and the building steel pipe will rise from -0.7 to +1-4V. The shorter the distance, the stronger the interference. Metal shielding nets and sacrificial anode were simulated and proposed to mitigate pipe corrosion. The findings of this study can serve as a reference for the safe use of EOP systems and gas pipe anti-corrosion protection.
Introduction
For better land utilisation rate, underground spaces such as basements, bridge foundation, and tunnels have attracted great attention as important space resources, especially in large urban cities [1,2]. When developing and utilising underground spaces, preventing groundwater infiltration has become a prominent task because building structures such as concrete and masonry usually have capillary holes, which will absorb moisture from the surrounding soil [3]. Moisture intrusion in underground structures that causes ‘damp basements’ is a pretty common phenomenon. Severe ‘damp basement’ may cause a high maintenance fee because of frequent repainting and cleaning to prevent mold growth. If no measurements were taken, severe moisture intrusion may make the underground space uninhabitable or even unusable because of poor air quality [4].
Under such context, the electro-osmotic pulse (EOP) technology [5] has been widely applied as a promising moisture-proof approach. As shown in Figure 1, the EOP system [7] generates pulse current through the penetration controller. The current passes through the anode buried in the building concrete structure and the cathode buried in the soil near the building to form an electromagnetic field, causes the potential gradient on both sides of the concrete wall, which has an effect on the movement of free ions. Since the water molecules act as dipoles, the cations are attracted to the negative end of the dipoles, thus allowing the water molecules to move together through the capillaries in the concrete to the cathode, i.e. to be discharged to the soil side [8]. As long as the electromagnetic field is uninterrupted, the moisture cannot enter the concrete, so the concrete stays in a relatively dry status. The EOP moisture-proof system can be applied to constructions such as bridge foundation, underground basements, and tunnel structures. It gained popularisation and wide application for underground spaces [9].
EOP system [6].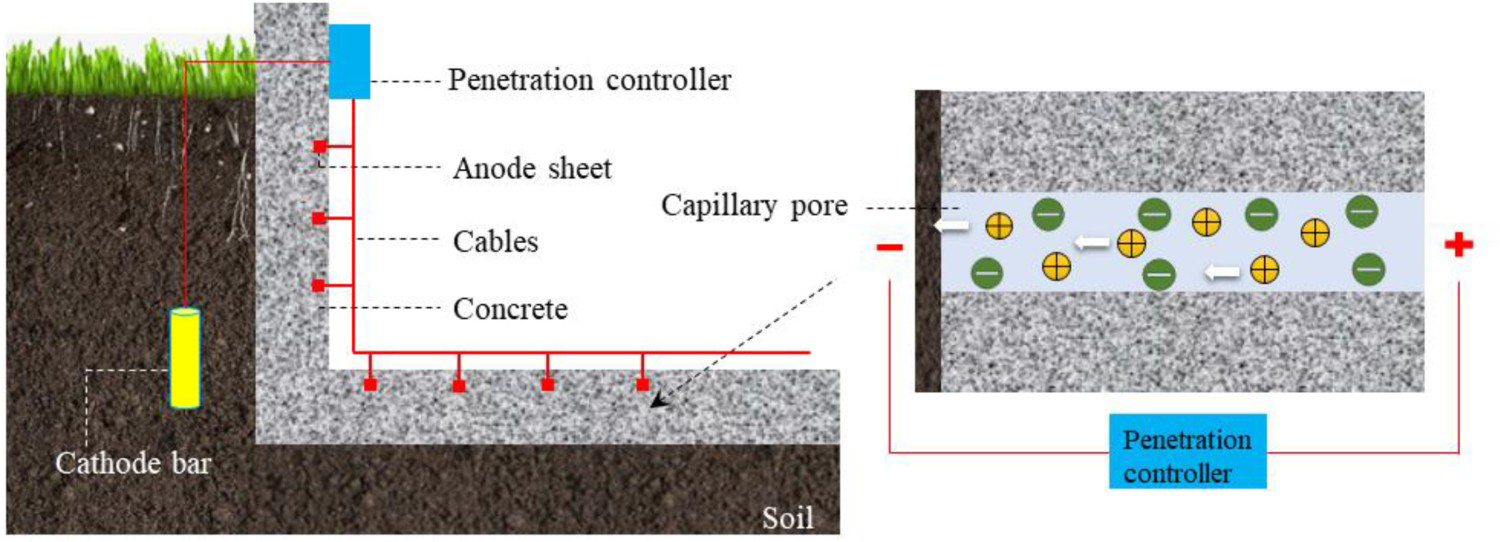
Although the moisture-proof function is of great value, the influence of the EOP system on steel corrosion is worthy of noting. When the EOP system is working, the electric potential near the cathode is low and forms a current sink. The current will be collected from the surrounding soil and may cause stray current interference in this area. The electric potential of the buried steel or other ferrous metal infrastructure in the soil will be positively shifted [10]. As a result, the metal infrastructure loses electrons and faces a high risk of oxidation and corrosion [11,12].
Corrosion may occur on underground pipelines when the coating was defective, where metal pipes were directly exposed to the soil or under disbonded coatings [13,14]. The corrosion is one of the leading causes of pipeline failure in North America, accounting for 41% of Canadian oil/gas pipeline failures between 2014 and 2018. Pipeline failures will result in not only substantial energy loss, but also serious environmental and ecological impacts [12,15]. The electrochemical corrosion of buried steel pipe interfered by stray currents in the soil has been reported by many field tests and theoretical studies [12,16]. The rate and intensity of underground corrosions depend largely on the characteristics of the interference source, which may vary with different facilities such as the subways [17], light rails [18], high-speed rails [19], high voltage direct current (DC) [20] and alternating current (AC) corrosion [21,22], and so on. Almost all the facilities that were equipped with the ground electrode can be regarded as interference source with different characteristics. Some of the DC interferences are periodically fluctuated in minutes [23]. Some of the directions of the DC currents are changed with the period time of the train moving direction [24]. In the previous study of the same team [25], we found that the fluctuations of pipe-to-soil potential near the subway were in accordance with the train's entering and exiting time.
However, the effect of stray current corrosion caused by EOP water-proof system has not been reported yet. Especially in residential communities, EOP water-proof systems are usually applied in the basements with a large number of steel components such as building bars, gas pipes, and water supply and drainage pipes in the surrounding soil. Once several electrochemical corrosions were formed, it may cause serious safety consequences for closing the residents.
To study the corrosion mechanism and assess the corrosion effect of gas pipe corrosion caused by the stray current from EOP water-proof system, the stray current interference of the EOP systems was measured and simulated in this paper, taking an alley between townhouses in Beijing, China as an example. The influence of the location and the number of turned-on EOP systems were analysed and promising corrosion mitigation methods were further analysed.
Method
This study takes an integrated research approach by combining onsite measurement and numeric simulation, which will be introduced in detail in the coming sections. In this way, the field test can be used to form a basic knowledge and to validate the numeric model, while the simulation can help to do further analysis.
On-site test
The tests were conducted from 20 to 21 February 2021 in an alley between townhouses in Beijing, as shown in Figure 2(a). There were nine households along the testing alley with a length of 80 m, a width of 5.5 m, and a soil depth of 7 m. Each household was equipped with gas service pipes that were buried in the alley and an EOP water-proof system (LV-EOP508) in the basement. The gas service pipes were made of Q235 steel with wall thickness of 5 mm. The service pipe was coated with 3PE coating and there was no cathodic protection. The coating defects might occur because of the gardening work or construction issue. The EOP system adopted 220 V AC supply power, with 36 V output DC voltage, 8 A output current, 1 Hz output pulse frequency, and 300 W power, as shown in Figure 2(b). Pulse waveforms consist of positive pulses, negative pulses and zero levels. The positive pulse, which acts as a drain, can be of different types such as sine, triangle, square, ramp and step waves. In the test, the positive pulse was set as a square wave with a continuous output time of 0.6 s. The negative pulse, using a square wave, acts mainly as a cathode depolariser and the zero level is used as a buffer, both with an output time of 0.2 s. The system anode was located inside the basement wall while the cathode was buried in the soil adjacent to basement, which was in a depth of 6 m in the alley. The test filed was the alley along H1–H4 (black font) and the simulation field was H1–H9 (black and green fonts) (see Figure 2(a)).
(a) Testing field; (b) EOP water-proof system.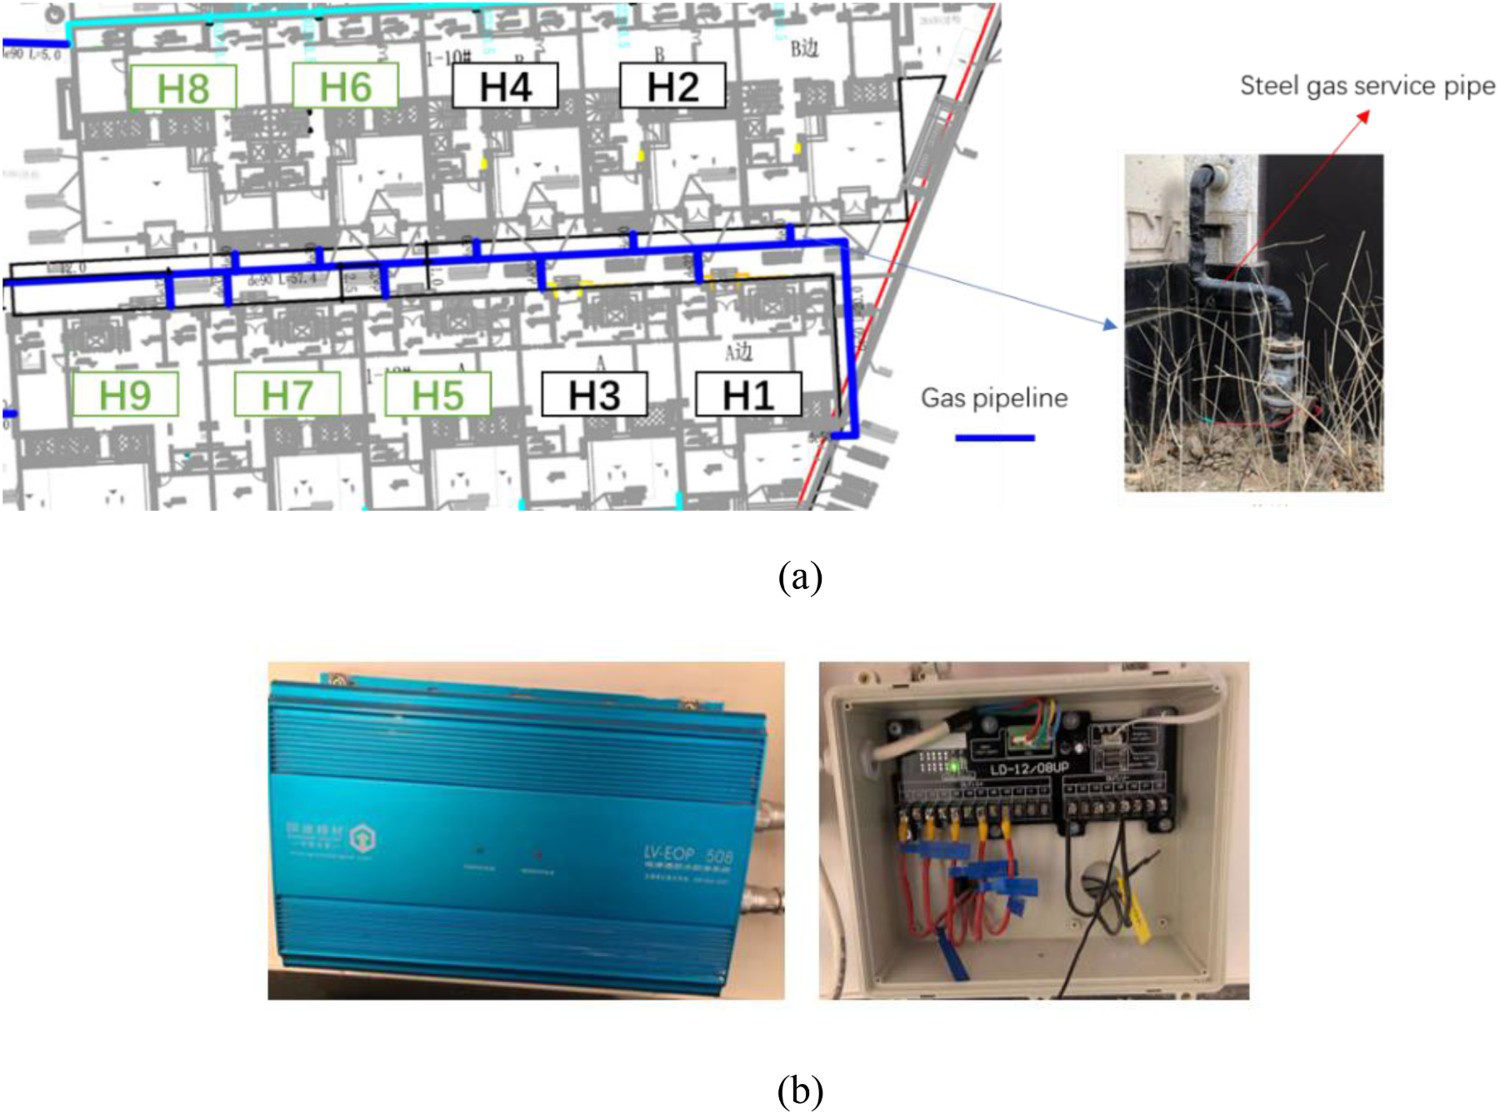
Electric potential test method
In order to evaluate the influence of EOP current on the gas pipe, soil electric potential gradient and pipe-to-soil electrical potential of the gas pipe were measured. As shown in Figure 3, 15 electric potential test points were deployed in the soil of the alley at 3-5 m distance. A reference electrode (CSE, Cu/CuSO4) was buried at a depth of 15 cm at each testing point. Two service gas pipes at A and B were measured to evaluate the influence of the EOP interference. The two pipes were 23 m apart.
Soil potential test point in the alley.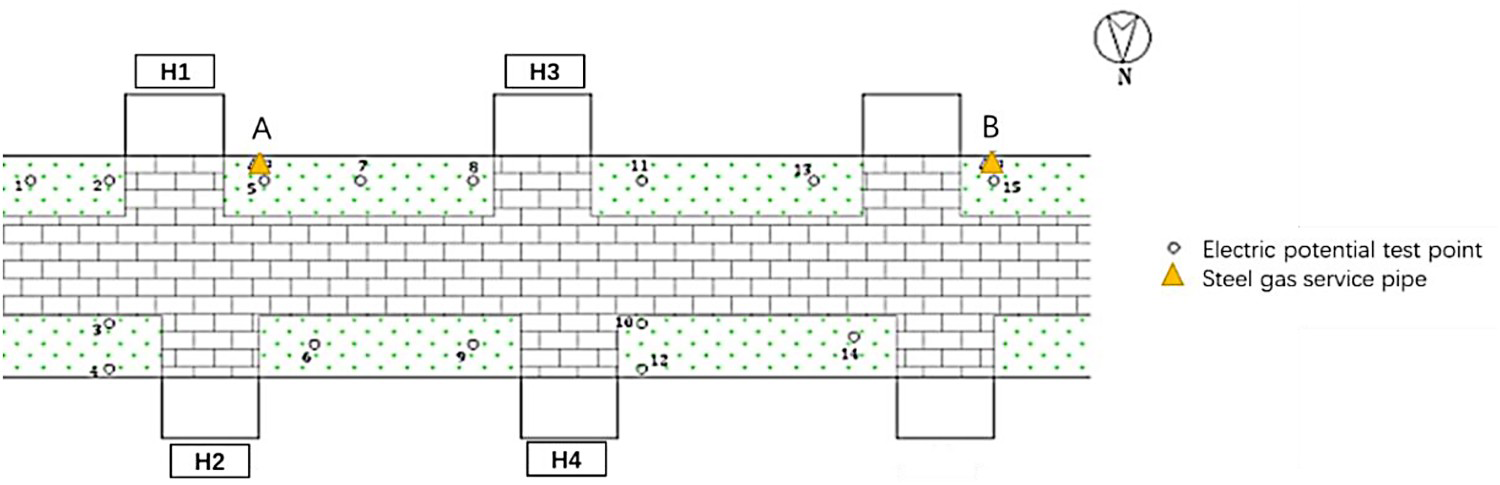
The electrode potential was measured by the voltmeter with analogue input modules as shown in Figure 4. The soil electrical potential gradient was measured by the potential difference between two reference electrodes located on each testing point and then was divided by the electrode spacing. The pipe-to-ground potential was measured through the potential difference between the pipe and the corresponding reference electrode [26].
(a) Low-frequency acquisition module; (b) high-frequency acquisition module.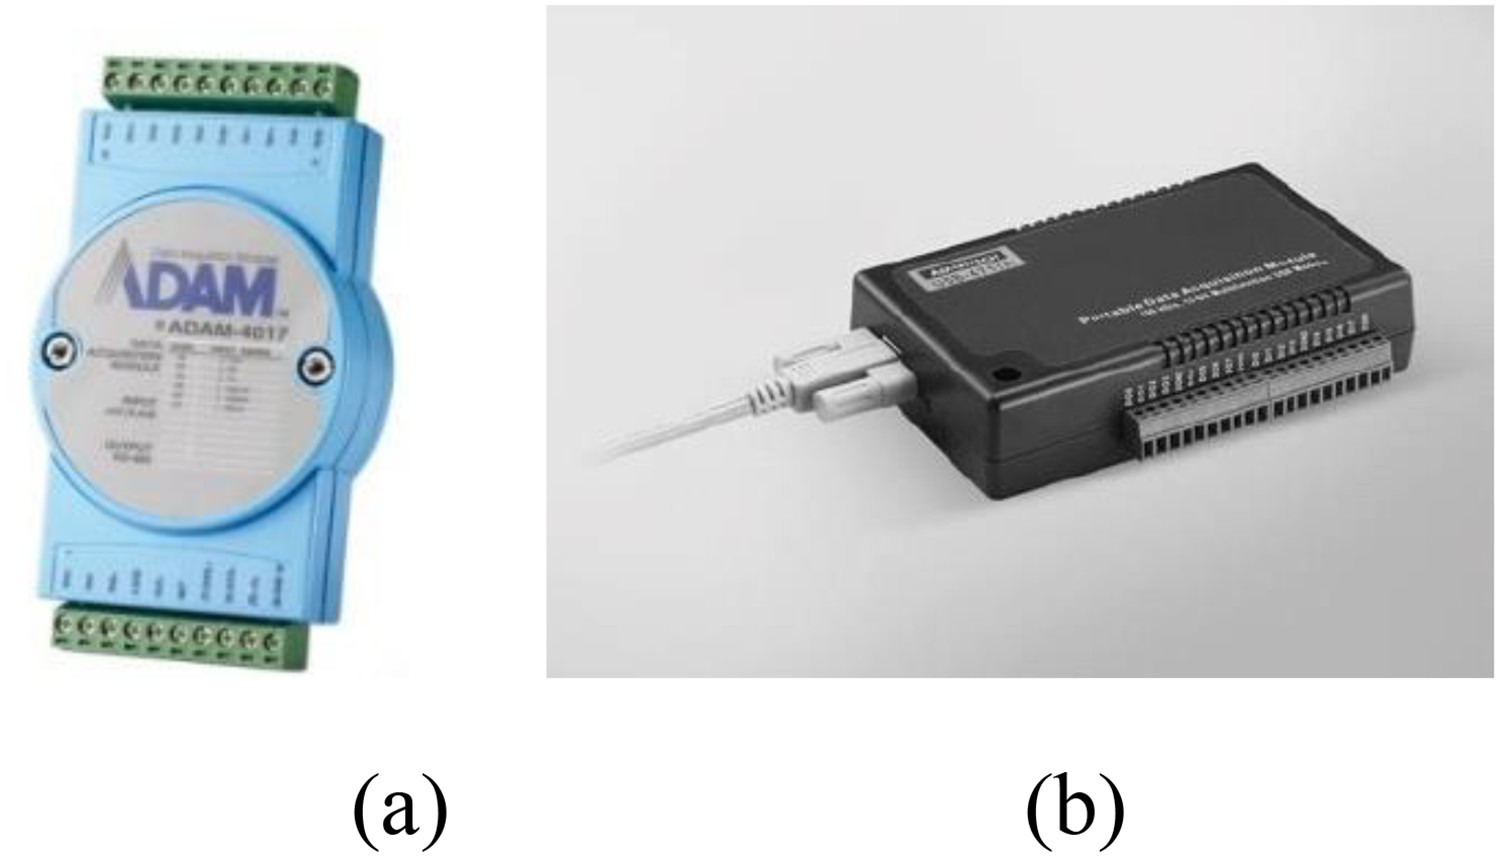
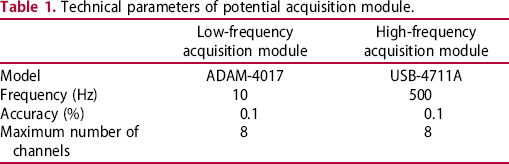
Technical parameters of potential acquisition module.
Simulation model development
To further analysed how other factors affect the stray current interference and discuss the corrosion mitigation method, the finite element method (FEM) was used to simulate and calculate the stray current interference in the soil [28,29]. The model was developed based on the on-site test scenarios.
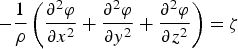
Assuming that the soil was uniform, isotropic, and stable, the basic potential distribution governing equation can be expressed by Poisson equation, as shown in Equation (1), where,  is the soil resistivity
  ,
,  is the source term, and φ is the electric potential.
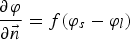
The boundary conditions were set as follows. The cathode of the EOP system was the interference source, which could be set to a constant potential value  (Dirichlet boundary condition, Equation (2)), or the constant current value
  (Neumann boundary condition, Equation (3)), where,
  is the normal direction.


The soil boundary and the ground boundary were set to be insulated, as shown in the following equation:

The gas pipe surfaces were set as the third type of boundary condition, as shown in Equation (5). Here Polarisation curve of gas steel pipe with coating defects. is the potential value of the electrode,
  is the electrolyte potential, and
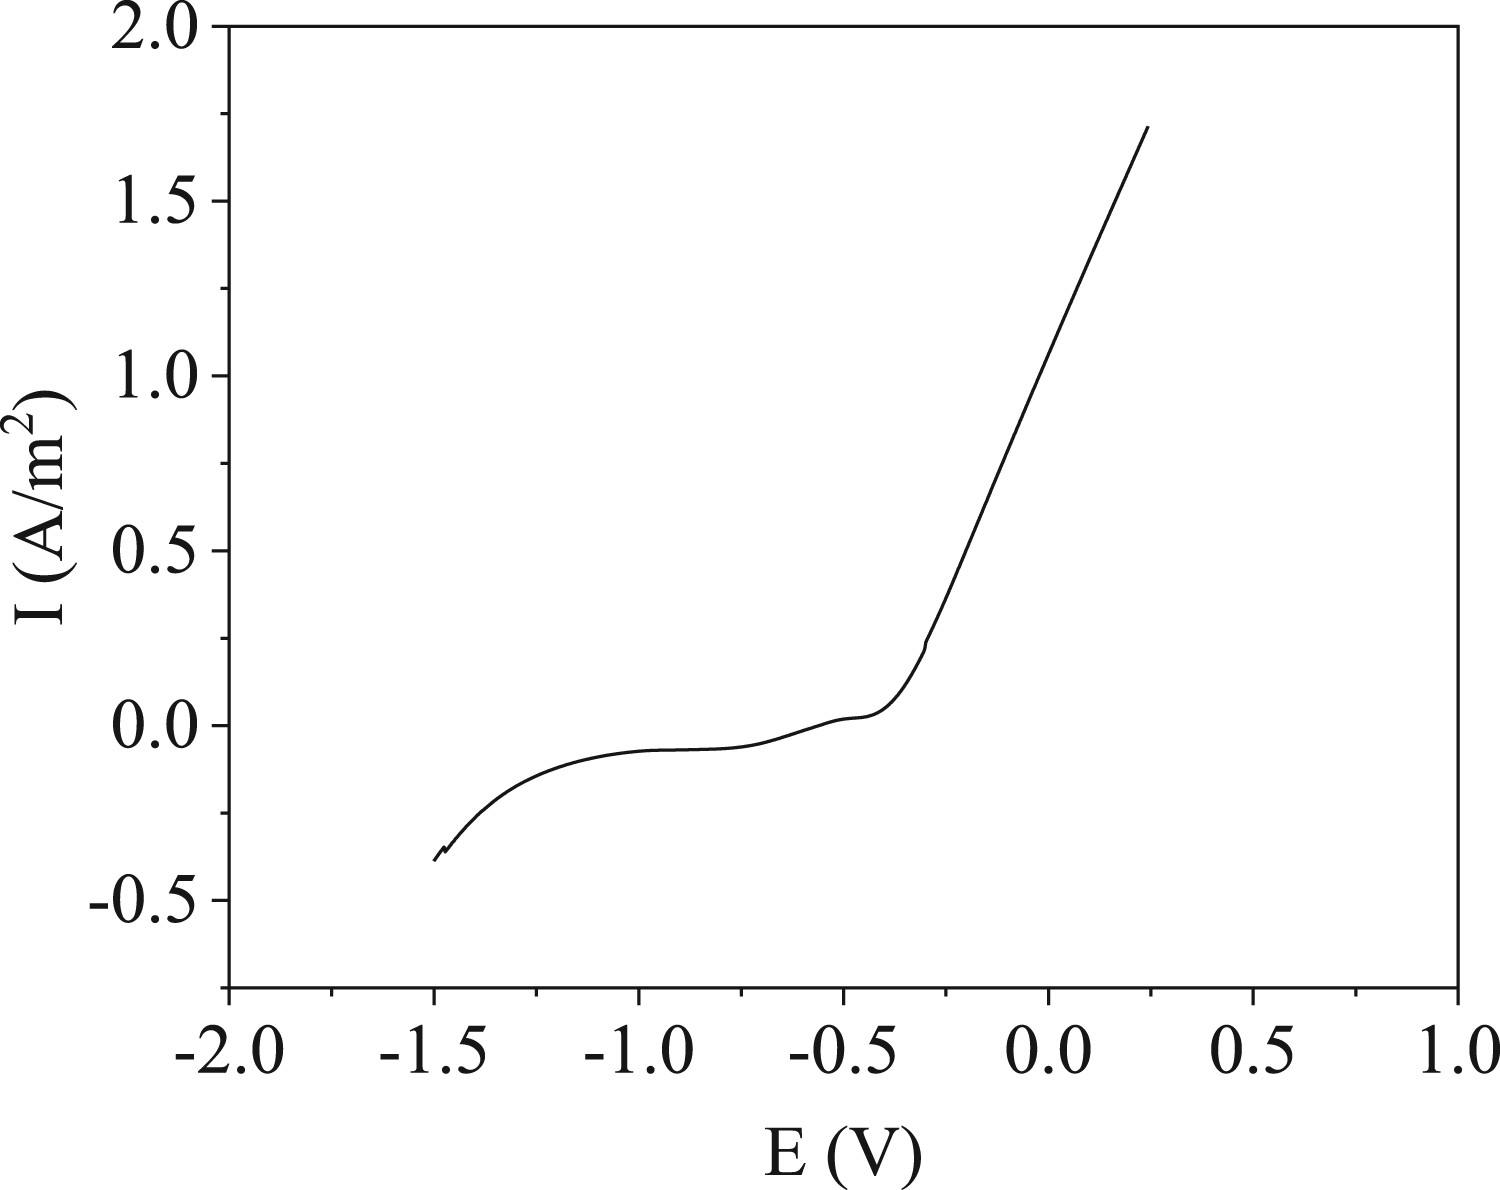
  is the polarisation current density function. The polarisation current density function is a curve that represents the relationship between electrode potential and polarisation current density. It is one of the basic methods to explain the basic laws of metal corrosion, reveal the mechanism of metal corrosion, and explore ways to control corrosion. The polarisation curve of the gas pipe with coating defects was tested by an electrochemical workstation (CHI600E, Chenhuan, China), which is shown in Figure 5.
According to the on-site test results, the soil resistivity was 80  , and the potential of the cathode of the EOP system was about −18 V. The alley was surrounded by building walls, which can be considered as an insulating boundary.
Except for the 3PE anti-corrosion coating, which has the risk of being defective, the pipes did not have any other corrosion mitigation facilities. Therefore, after the actual case was simulated, the potential corrosion mitigation method, including metal component shielding net and cathodic protection were simulated.
Corrosion current density  was calculated according to the simulation. Then, the annual corrosion rate (mm year−1) was calculated through Equation (6), where M is the atomic weight, n is the number of charges transferred in the electrochemical reaction, F is the Faraday constant, and
  is the density
  . The main component of the gas pipe was iron (Fe), which causes oxygen absorption and corrosion. Fe undergoes an oxidation reaction and loses electrons. The atomic weight of Fe is 56, n is 2, F is 96,485 C mol−1, and
  is 7.8
  .
.
Result and discussion
EOP current distribution in the soil
Due to the complex sources of stray current in the soil, there may exist DC (0 Hz), EOP system current (1 Hz), and residential AC (50 Hz). In order to consider the possibility of interference currents at different frequencies, a 500 Hz high-frequency acquisition program is used to test the pipe-to-soil potential at pipe A to further determine the source of interference. A period of 60 s data were taken as an example to analysis the current spectrum. The EOP system of H1 were kept off at the first 30 s and then turned on after 30 s.
Figure 6(a) shows the pipe-ground potential when the EOP system is off and on, and the FFT spectrum is shown in Figure 6(b). When the EOP system was turned on, the pipe-to-soil potential fluctuated periodically, while the frequency was basically 0 Hz and as the amplitude as low as 0.06 when the EOP system was off, indicating that there was no AC interference or other DC interference in the soil with no EOP systems, and the soil potential and potential signal appeared when one EOP water-proof system was turned on. The signal amplitude and power density near 1 Hz was the highest, which was the same as the output pulse frequency of EOP water-proof system used in the household. Therefore, it can be confirmed that the interference comes from the EOP system and there was no other interference current.
Pipe-to-soil potential analysis (0-29 s: EOP system turned off; 30-60 s: EOP system of H1 turned on): (a) Pipe-to-soil potential; (b) spectral analysis.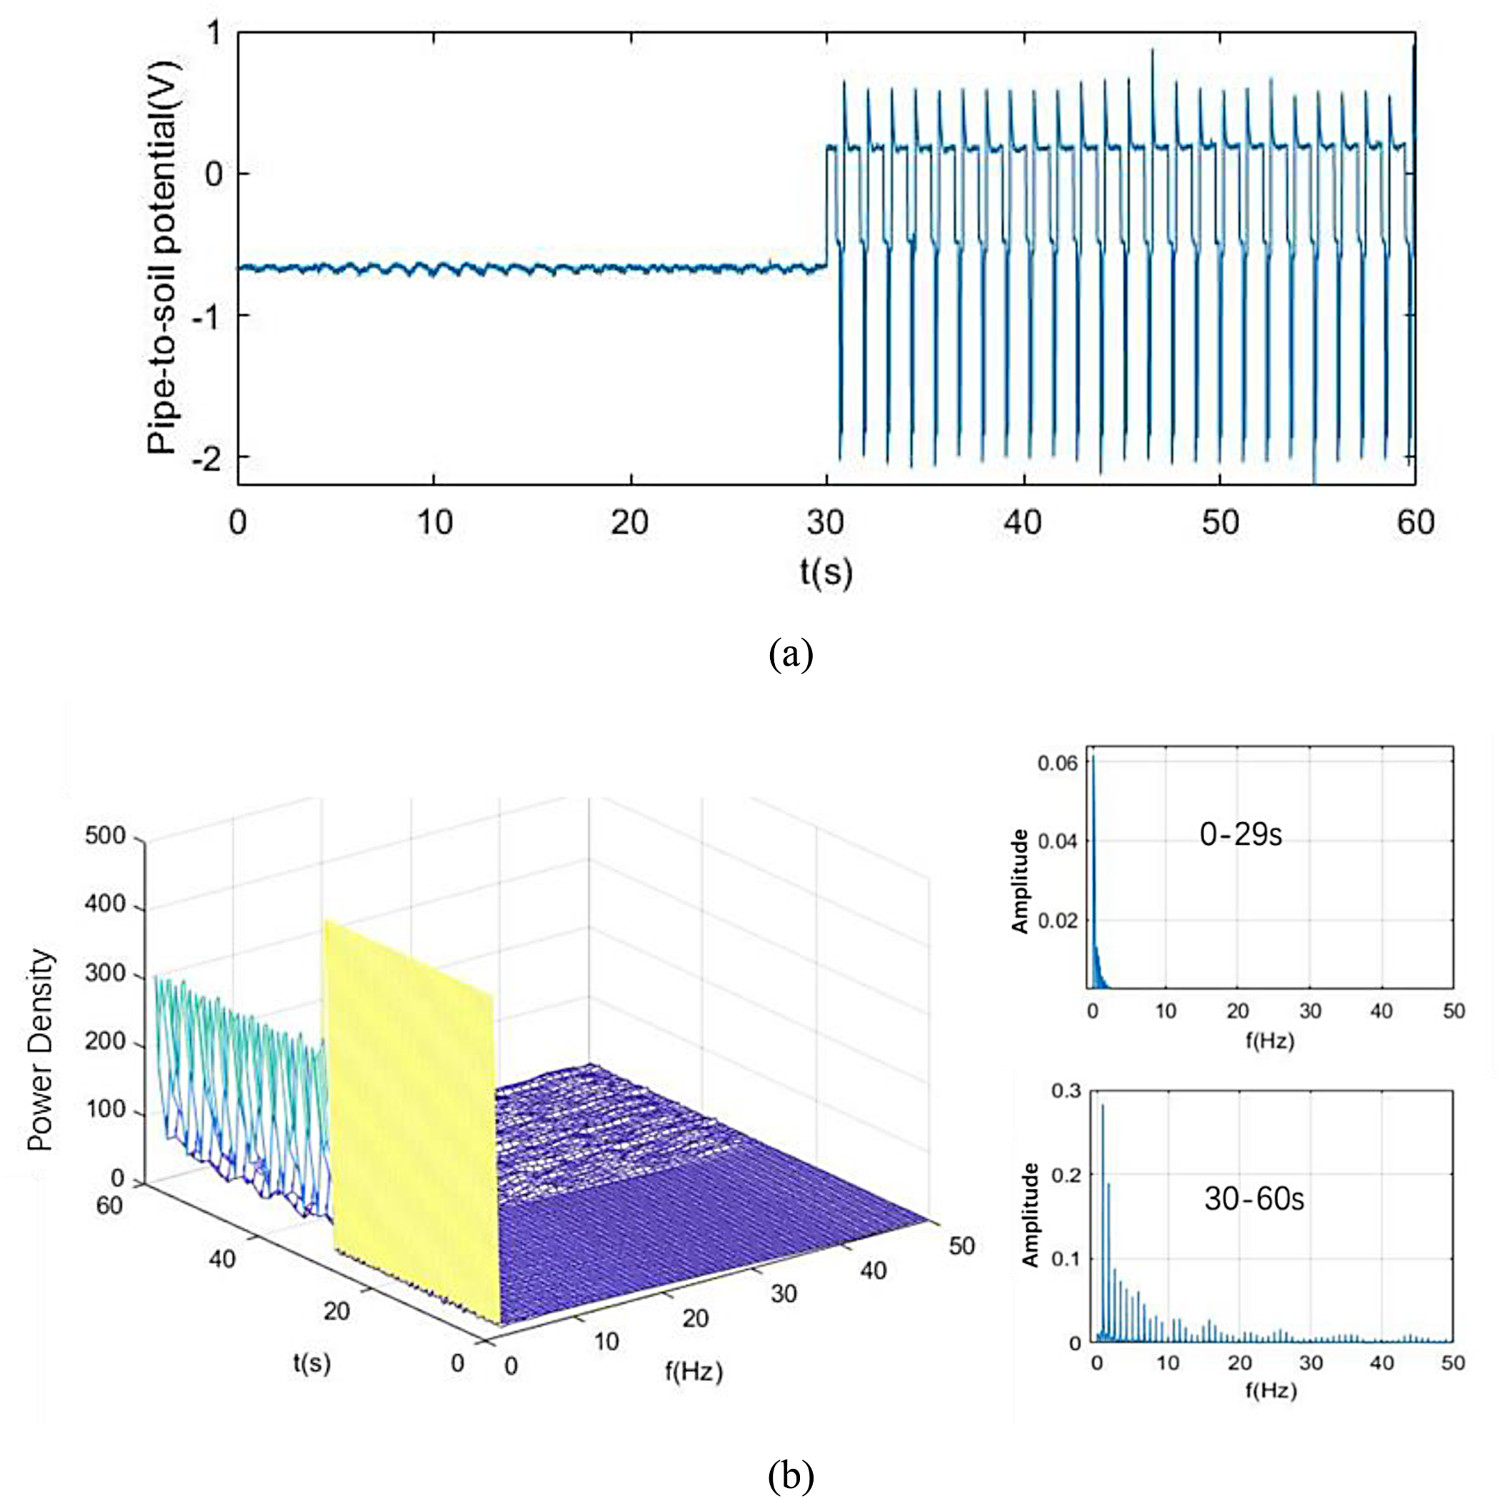
Soil surface potential gradient and current direction
The current direction in the soil depends on the surface potential gradient in the alley. When the EOP system was off, the two potential gradients were stable at around 0 mV m−1, and there was basically no current in the soil. As the EOP system was turned on, the potential gradient rosed, and the potential gradient range was −135 to 167 mV m−1 with only one EOP system. Increasing the number of turned on EOP system, the potential gradient range can reach as high as −997 to 681 mV m−1, as shown in Figure 7.
Potential gradient changes in between test points.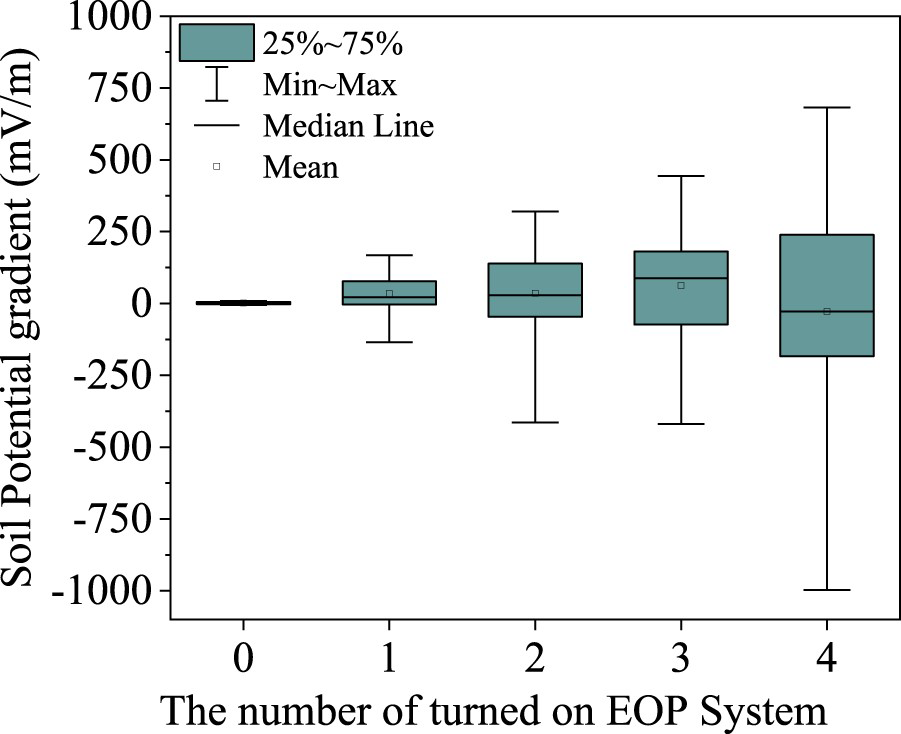
When more EOP systems were turned on, the overall gradient value changed from positive to negative or vice versa, which indicated that the current direction in the soil changed with the location of turned-on EOP systems. According to the positive and negative gradient value, the current direction in the soil was marked in Figure 8. When the EOP system of H1 was turned on, the soil currents flowed to the EOP cathode, and the cathode became a current sink (Figure 8(a)). When the EOP systems of H1 and H2 were turned on (Figure 8(b)), the currents flowed to the cathode of H2. Although there was current flowed out near the cathode of household 1 (2-3: 52.9 mV m−1; 2-5: 31.8 mV m−1), compared with the inflow (1-2: 192 mV m−1), it still belonged to an inflow point. When the EOP systems of H1–H3 were turned on (Figure 8(c)), point 8 became the current sink because it was closest to the cathode of H3. Compared to Figure 8(b), only the current flow direction of points 8-7 changed. When the EOP systems of H1–H4 were turned on (Figure 8(d)), the currents of 9-6 and 9-8 were reversed.
Current direction when turned on EOP systems in different positions (red stars in the figures): (a) turn on H1; (b) turn on H1, H2; (c) turn on H1, H2 and H3; (d) turn on H1, H2, H3 and H4.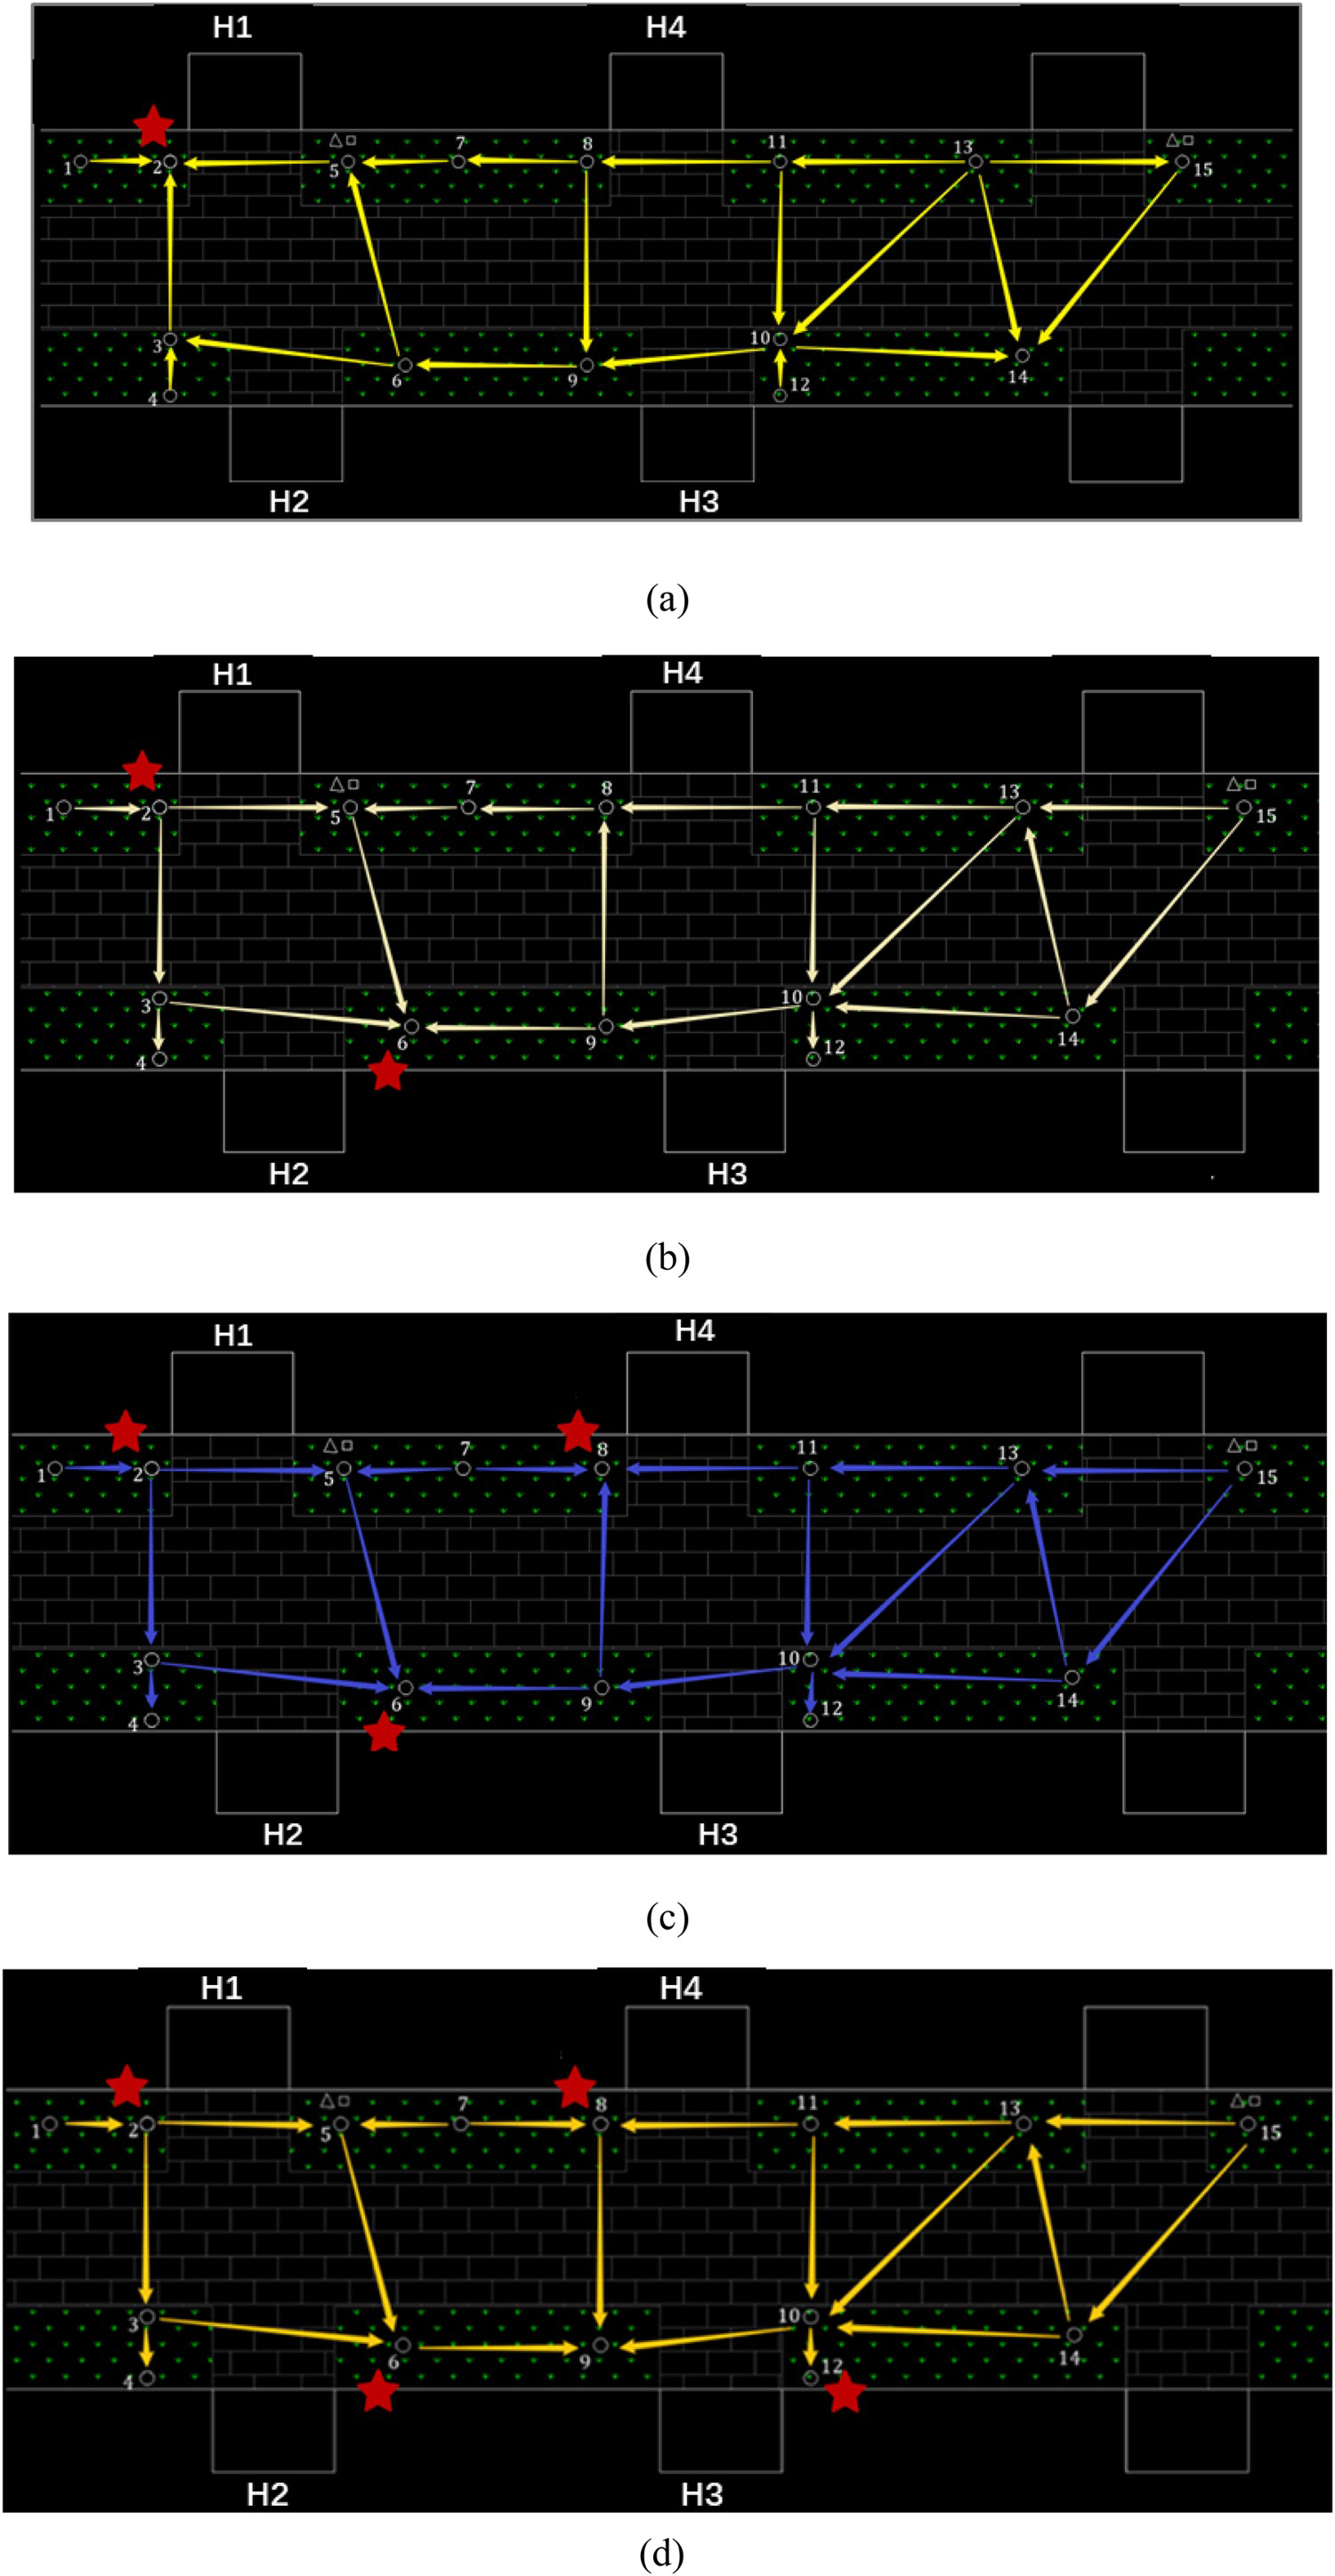
When only the EOP system of H1 was turned on, the maximum gradient value reached 167.6 mV m−1 and a larger potential gradient appeared near the cathode of H1 which was reduced to −1.06 mV m−1 for test points farther away from H1. Figure 9(a) showed the soil potential gradient of two current paths (13-11–8-7–5-2, 12-10–9-6–3-2) that flowed to the cathode of H1. The potential gradient value near the H1 increased sharply. The soil potential gradient within 4 m of the H1 cathode was above 100 mV m−1, and the potential gradient around 20 m was 6 mV m−1. Therefore, it could be considered that when the EOP system distance was more than 30 m (such as points 13-15), the soil potential gradient will be reduced to insignificant, imposing no corrosion risk.
Soil potential gradient between test points: (a) turn on H1; (b) turn on H1, H2; (c) turn on H1, H2 and H3; (d) turn on H1, H2, H3 and H4.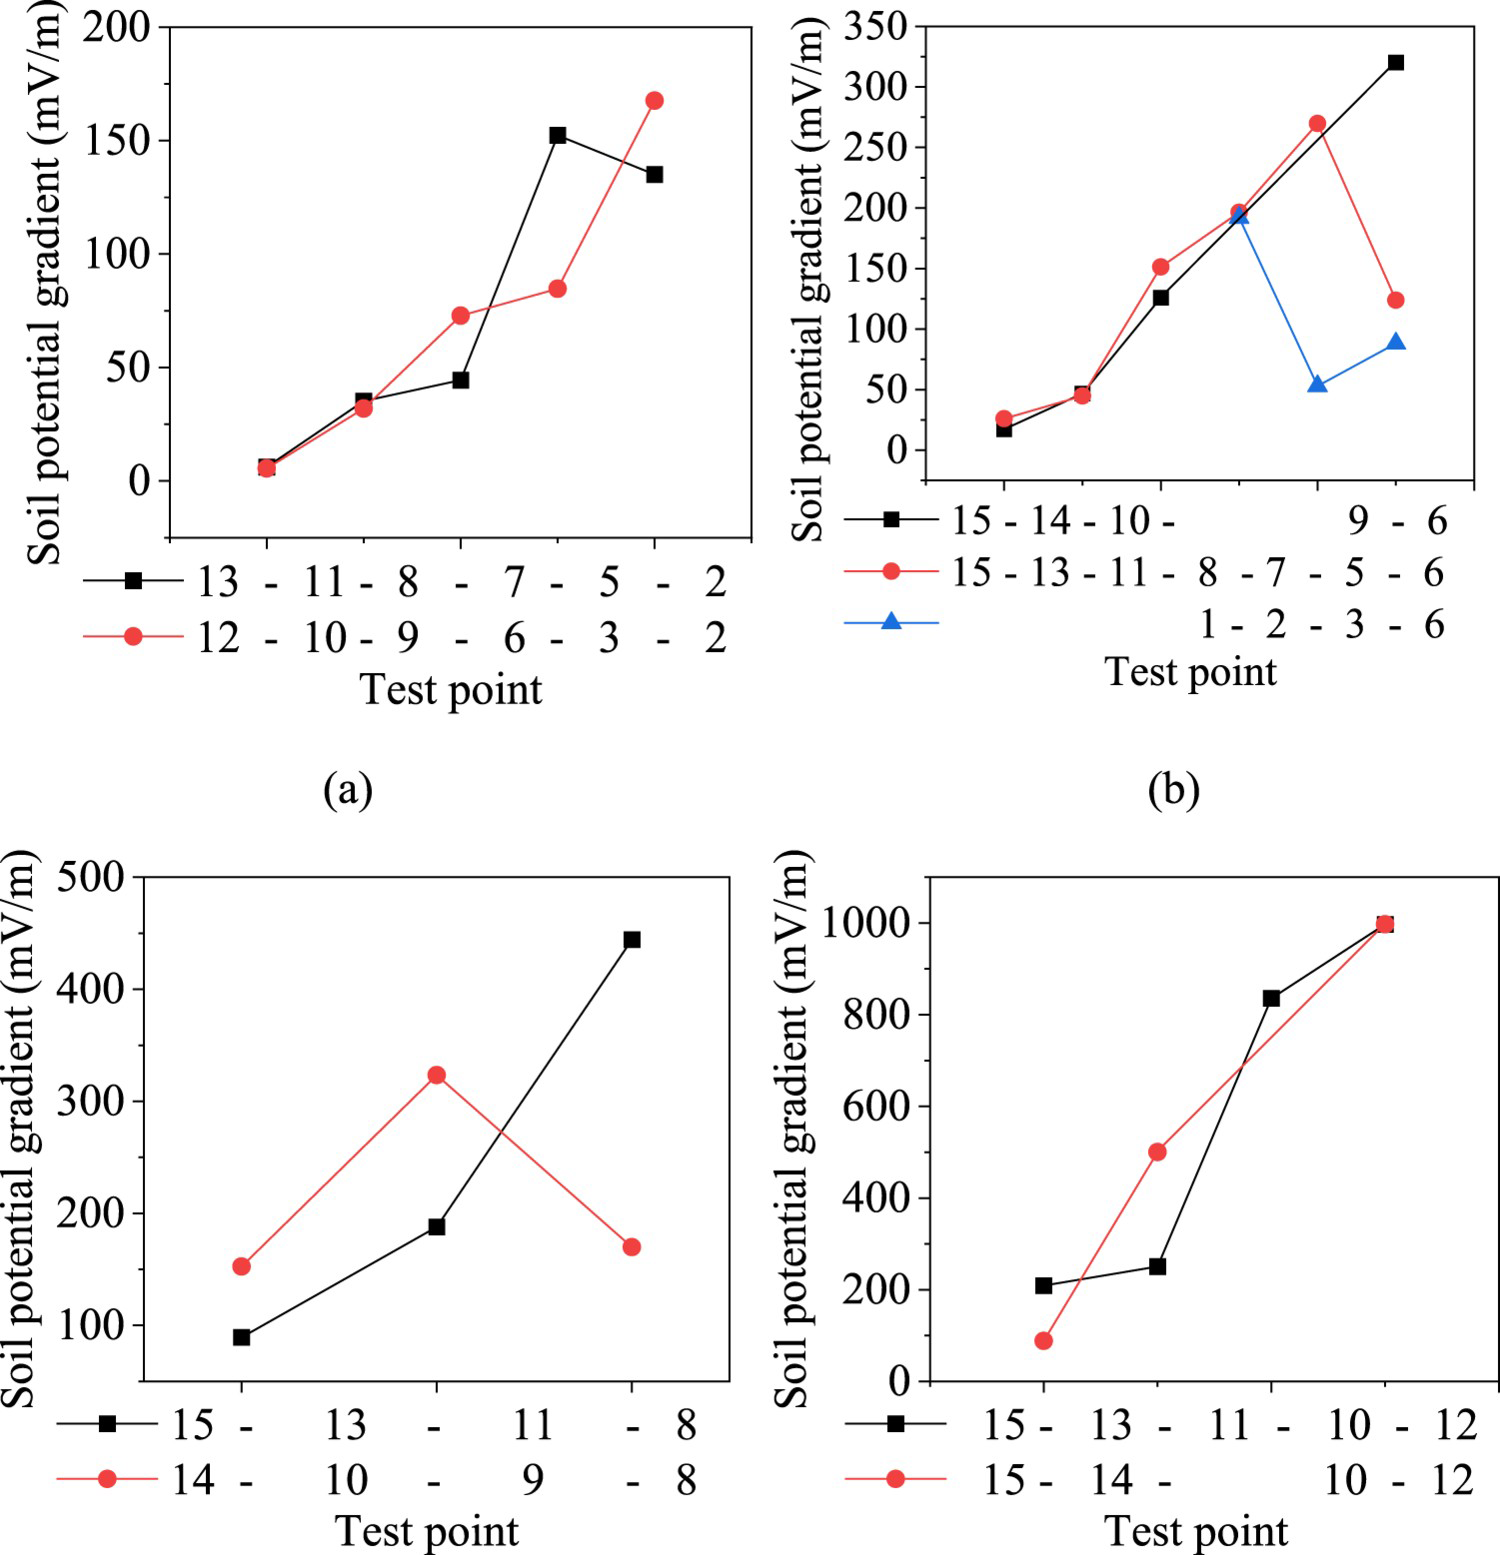
When the EOP systems of H1 and H2 were turned on, the potential gradient between all the test point were above 10 mV m−1, with the highest value of 414 mV m−1, and the points 13-15 were also strongly interfered. Figure 9(b) described the potential gradient change involved in the three current paths (15-14–10-9–6 and 15-13–11-8–7-5–6, 1-2–3-6) flowing to the cathode of H2. Among them, the route 15-14–10-9–6 was farther from H1, so the gradient showed a decreasing trend with the increasing distance from the cathode of H2. The gradients of other two paths near H1 and H2 were reduced due to the interaction of the two EOP systems.
When the EOP systems of H1–H3 were turned on, the potential gradient of two current paths (15-13–11-8, 14-10–9-8) flowing to the cathode of H3 were shown in Figure 9(c). The potential gradient values between different test points were further increased, with the highest value of 444 mV m−1 and the lowest value of 46.5 mV m−1. The potential gradient of path 15-13–11-8, which was father away from H1 and H2, decreased with the increasing distance from the cathode of H3. The potential gradient of 9-8 was reduced due to the proximity and the mutual interaction of the two EOP of H2 and H3.
When the EOP systems of H1–H4 were turned on, the potential gradient of two current paths (15-13–11-10–12, 15-14–10-12) flowing to the cathode of H3 were shown in Figure 9(d). The potential gradients both showed an increasing trend.
Pipe-to-soil potential of gas service pipe
The influence of stray currents from EOP system can be determined through the changes in pipe-to-soil potential. During the test, the EOP systems were turned on one by one from H1 to H4. Figure 10 showed the variation of the pipe-to-soil potential at pipe A and B. When the EOP systems were off, the pipe-to-soil potential was maintained at −0.7 V (pipe A) and −0.42 V (pipe B) steadily. When the EOP systems were turned on, the average potential showed a significant positive shift and the amplitude increased with the increasing number of running EOP systems. For pipe B, the distance from the cathode was about 23 m farther than pipe A, so its overall variation amplitude was smaller than that at pipe A. It should be noted that when only H1 EOP system was turned on, the potential was positive to −0.309 V, the pipe potential was still in the insignificant range with low risk of corrosion. When all the four EOP systems were turned on, the pipe-to-soil potential were 2.46 V (pipe A) and 1.1 V (pipe B), which were prone to cause corrosion.
Pipe-to-soil potential.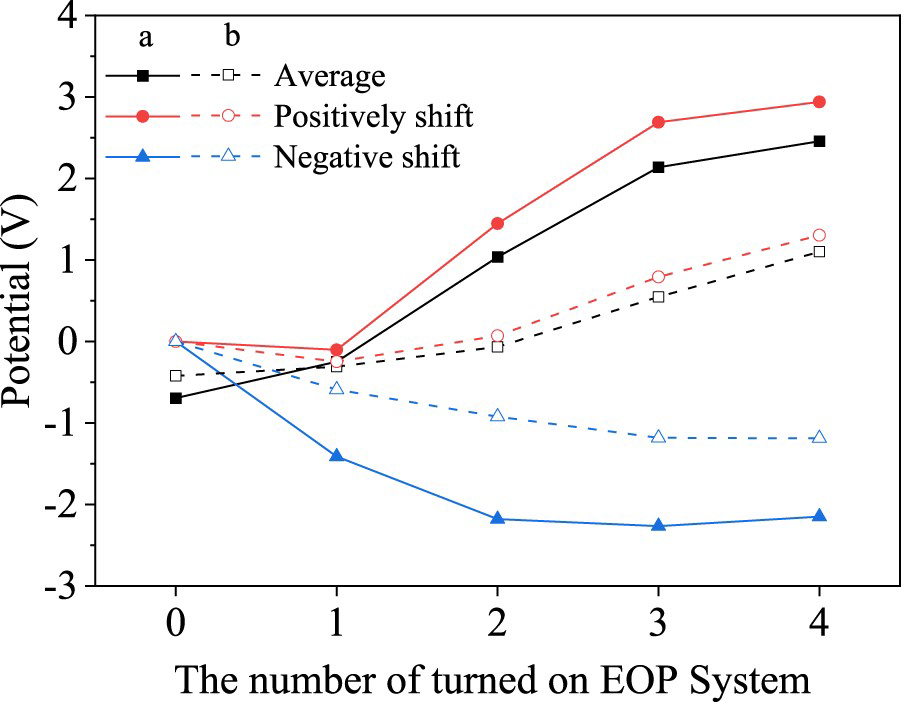
The time for the potential to positively shift was significantly longer than that of negative shift as shown in Figure 11. As the number of turned on EOP system increased, the positive shift proportion slightly increased, and the negative shift decreased accordingly. During the period of positive shift, the pipe-to-soil potential was higher than the acceptable positive potential shift criteria [30]. Although the negative shift time was shorter, the pipe-to-soil potential at a −2.26 V was much higher than −1.2 V. As the surface of steel pipe had negative electrical potential, there was a risk of hydrogen embrittlement on susceptible metals under tensile stress or cathodic de-bonding of protective coatings. Pipe B was farther away from the turned on EOP, and the average negative shift value of the potential was small under different working conditions.
Proportion of positive and negative shift under different number of EOP turned on.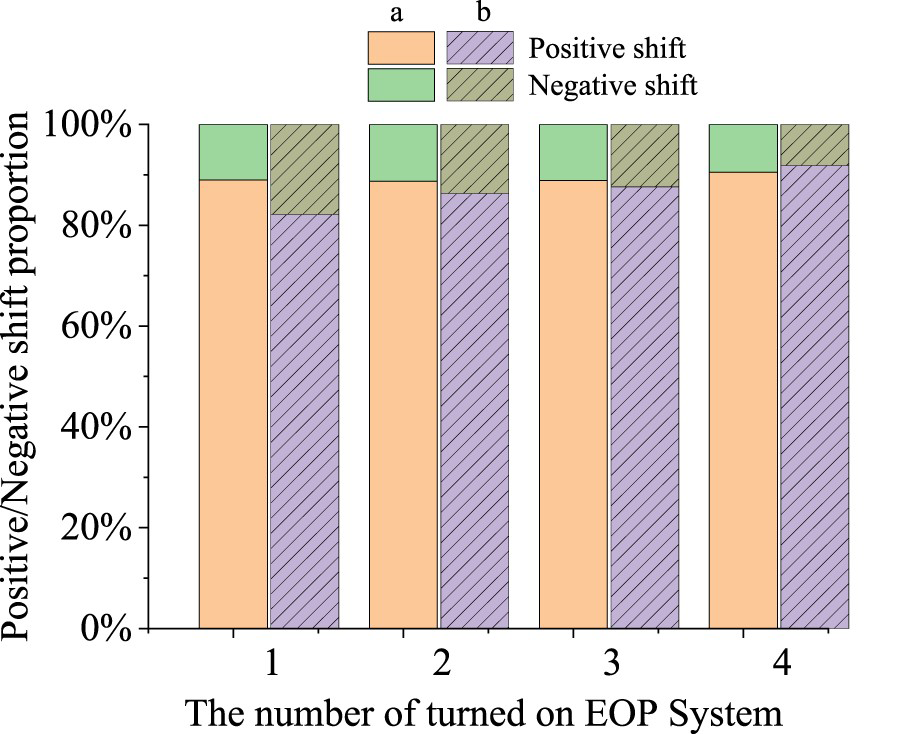
Corrosion risk simulation
Model validation
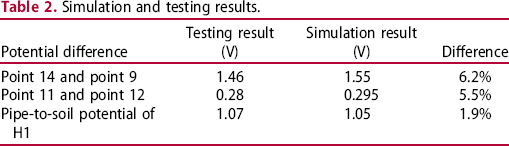
Simulation and testing results.
Corrosion risk and corrosion rate analysis
The tested alley between 9 households were simulated, among which H1, H3, H5, H7, and H9 were on the south side while H2, H4, H6, H8 were on the north side. In the following analysis, the south side with H1, H3, H5, H7, and H9 were taken as examples to demonstrate the results.
Pipe-to-soil potentials when H1's EOP system turned on with defective pipe coatings.
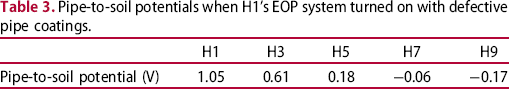
The soil potential distribution and streamlines were shown in Figure 12. It can be seen from Figure 12(a) that the soil potential near the cathode of the EOP system was low, and the farther the distance from the cathode, the higher the soil electrical potential. The current in the soil flowed from the gas pipe to the cathode of the EOP system. Electrochemical reaction occurred at the interface between the gas pipe and the soil, which led to pipe corrosion. As shown in Figure 12(b,c) the cathode of the EOP system formed a current sink.
Soil potential distribution (V) and current direction. (a) YZ section of the soil where the gas pipe is located, (b) XY section of soil near cathode and (c) YZ section of soil near cathode.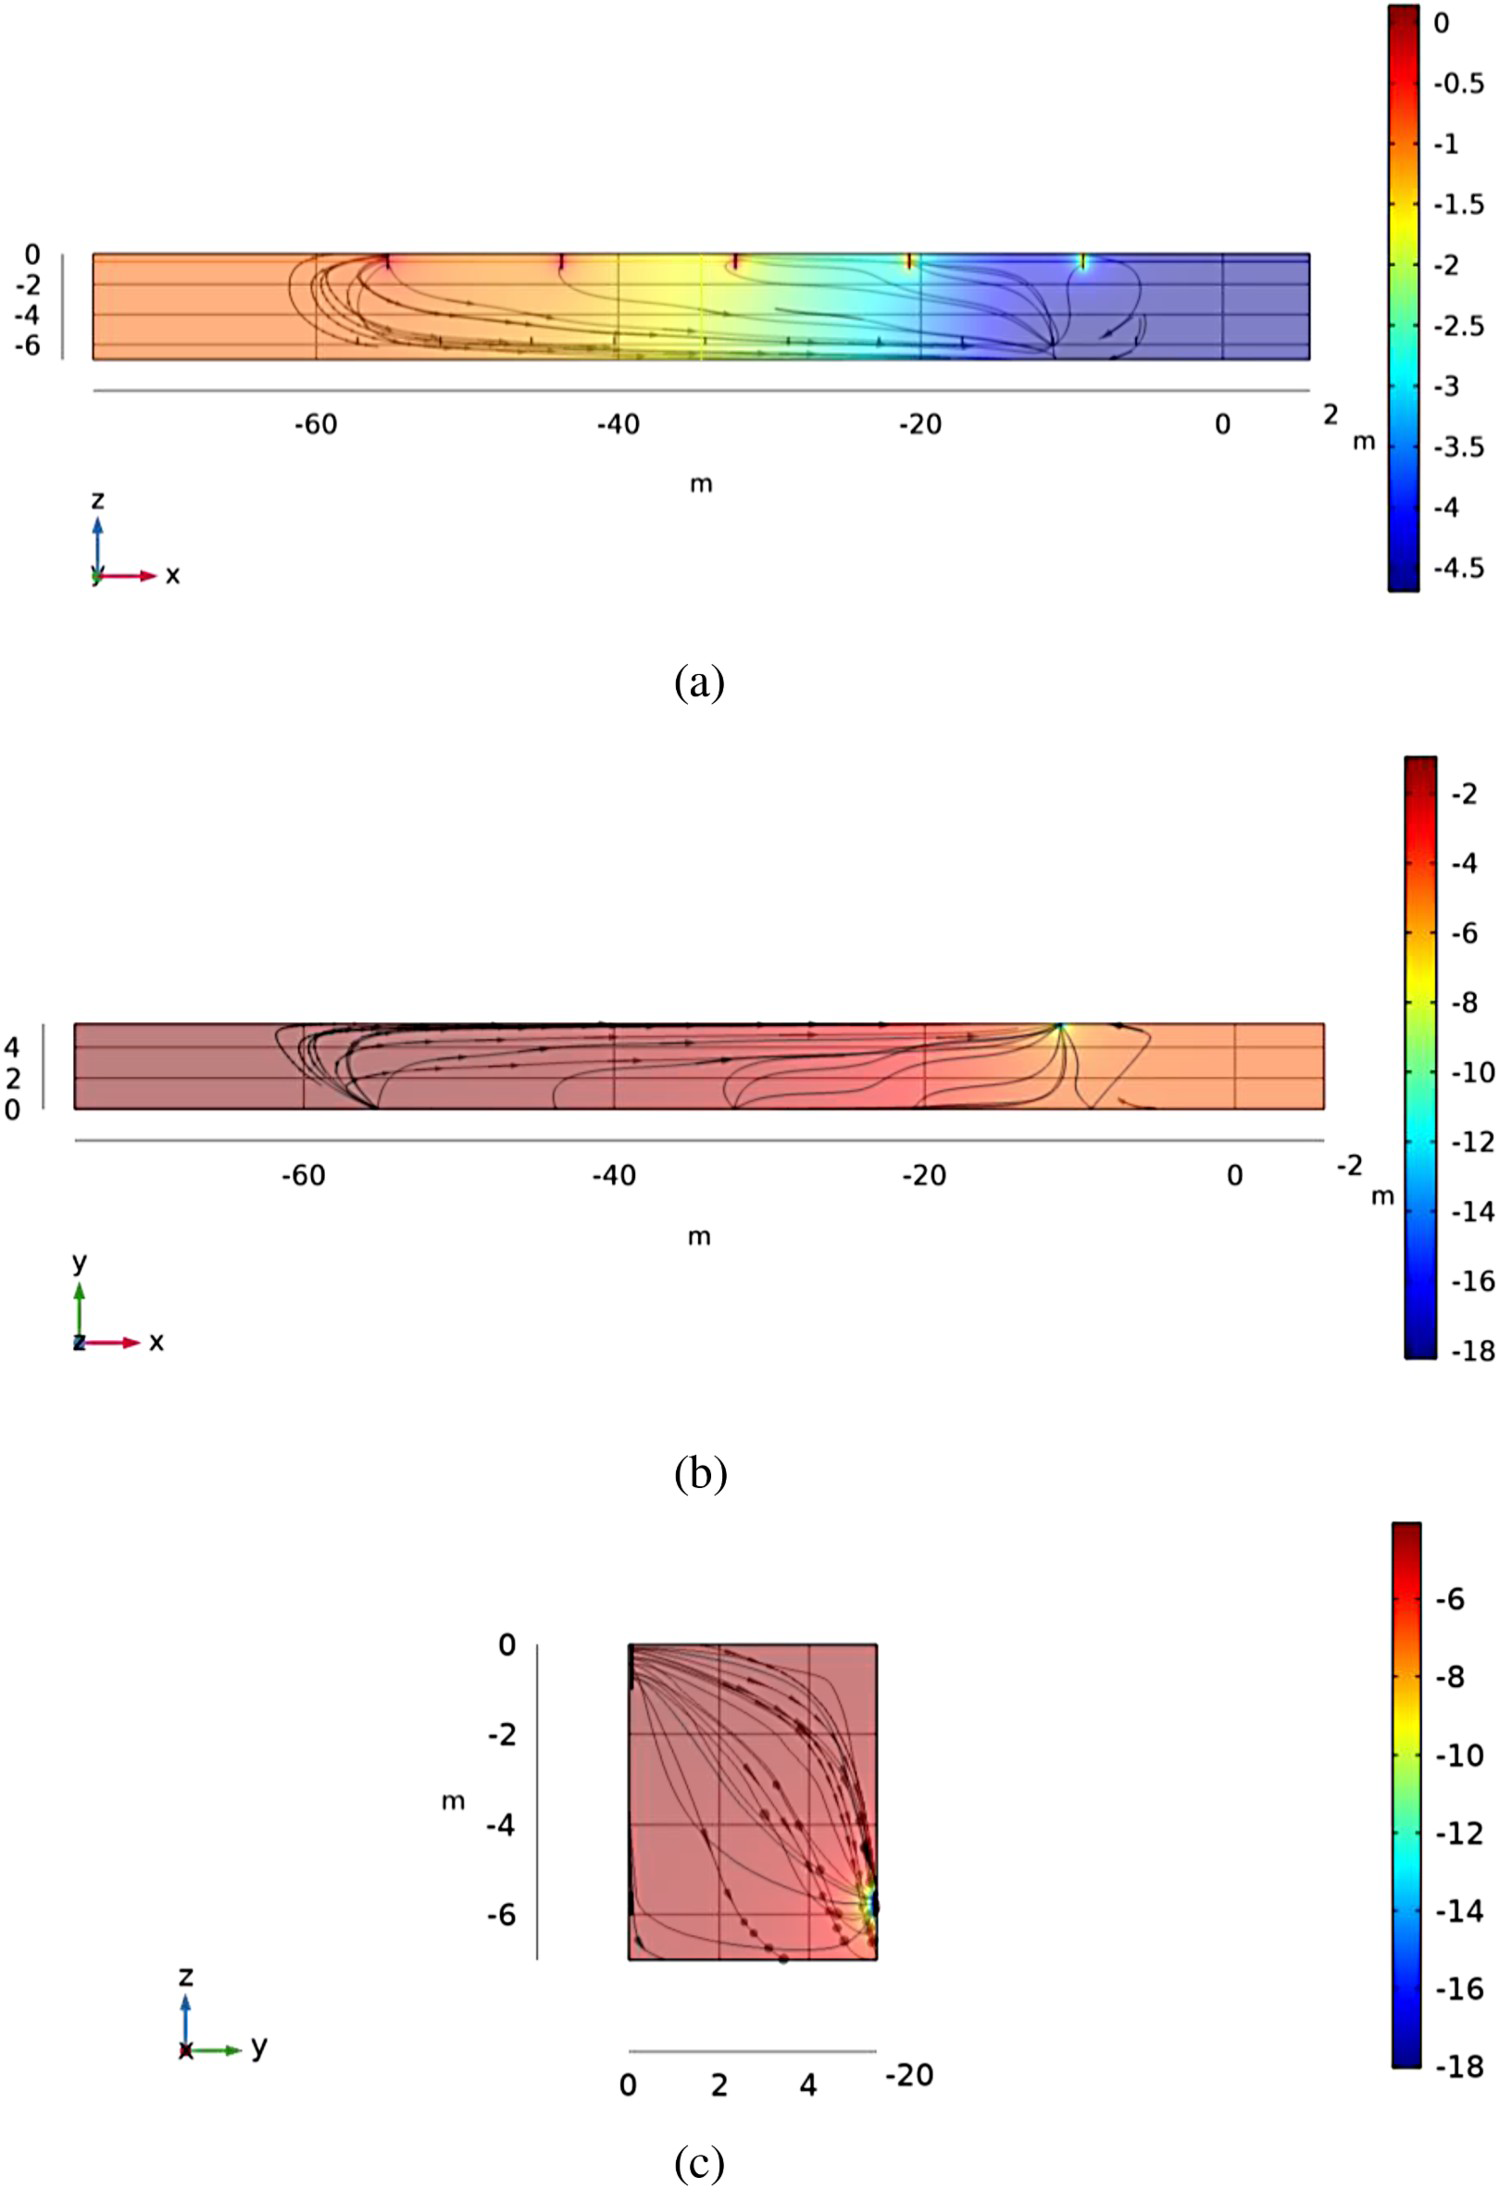
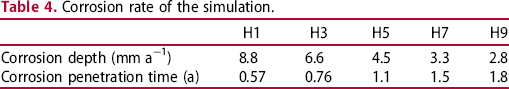
 , the calculated corrosion depth was 8.8-2.8 mm year−1, and the corrosion penetration time was 0.57-1.8 years with the gas pipe wall thickness of 5 mm.
Corrosion rate of the simulation.
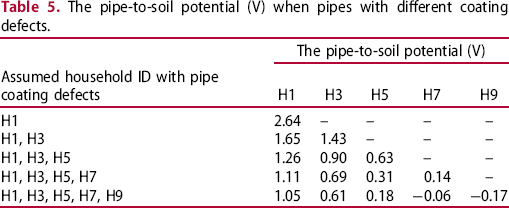
The pipe-to-soil potential (V) when pipes with different coating defects.
The influence of current and distance between the pipe and cathode on corrosion
When the coatings of all the five gas pipes were defective, the pipe corrosion of different households changed with the current were shown in Figure 13. When the interference current decreased, the pipe-to-ground potential of each household decreased, and so as the corrosion risk. Corrosion was affected by both distance and the interference current. Analysis of the slopes of the lines in the figure showed that the pipes closer to the cathode faced higher corrosion risks caused by the interference current. When the interference current was reduced to 10 mA, the potential of the gas pipe was still positively shift by 100-200 mV, and the pipe still faced a risk of corrosion.
Pipe-ground voltage in different households with interference current.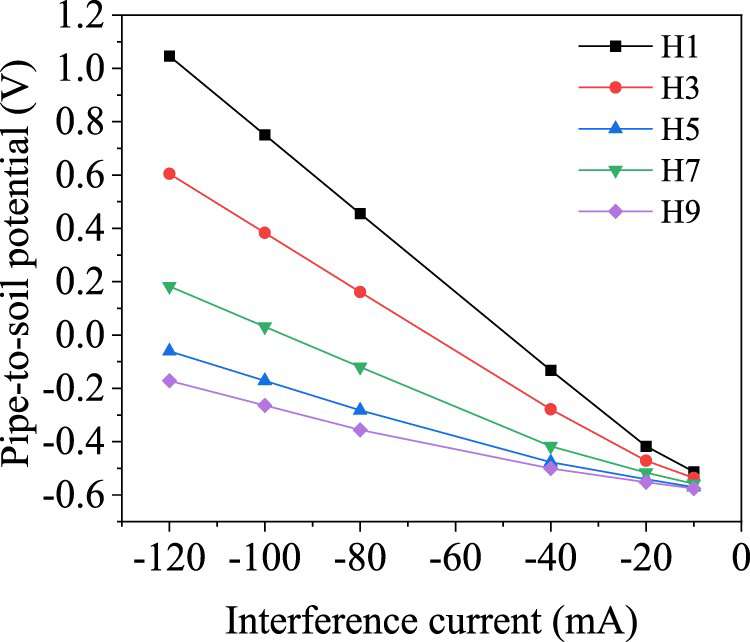
When the coatings of all the five gas pipes were defective, the changes of soil potential gradient with interference current and distance were shown in Figure 14. It can be seen that the greater the interference current, the greater the soil potential gradient. When the interference current was reduced to 10 mA, the soil potential gradient near the pipe was reduced to about 10 mV m−1, and the pipe still faced a risk of corrosion. The longer the distance from the EOP cathode, the smaller the soil potential gradient. Compared with the evaluation criteria of 2.5 mV m−1 [30], after 45 m from the cathode, the soil potential gradient dropped to 2.5 mV m−1, then no anti-corrosion measures required.
Soil potential gradient varies with disturbance current and distance.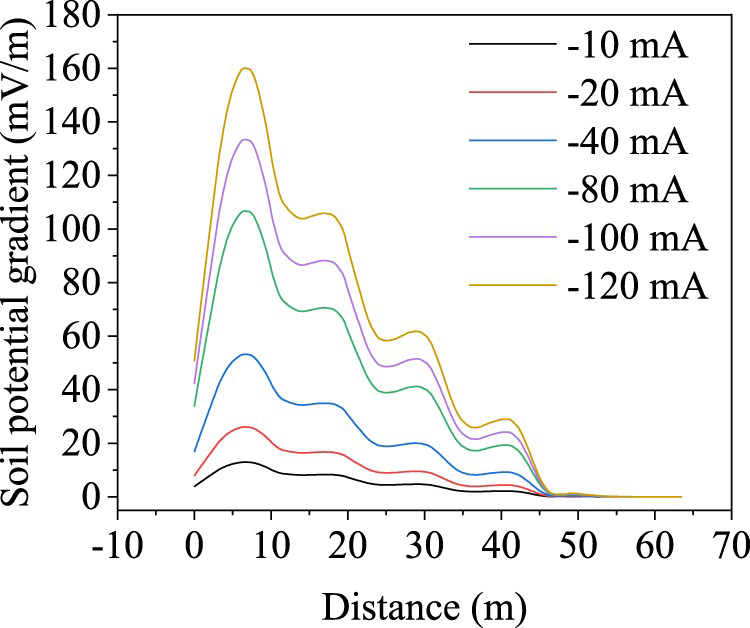
When only one EOP system was turned on and only one households’ pipe coating was defective, the corrosion was the most server compared to that with more households’ pipe coating defects. Under such context, the changes of pipe-to-soil potential with interference current and distance between the pipe and cathode were shown in Figure 15. It can be seen that as the distance increased, the pipe-to-soil potential and the corrosion degree decreased too. When the distance between the pipe and the cathode was greater than 126 m, the positive shift of the pipe-to-soil potential was less than 100 mV, and the current interference of the cathode of the EOP system can be ignored. Analysing the slopes of the lines in the graph, it showed that the greater the interference current, the less the influence of distance on the pipe-to-soil potential.
Pipe-to-soil potential changes with the distance between the pipe and cathode and the interference current.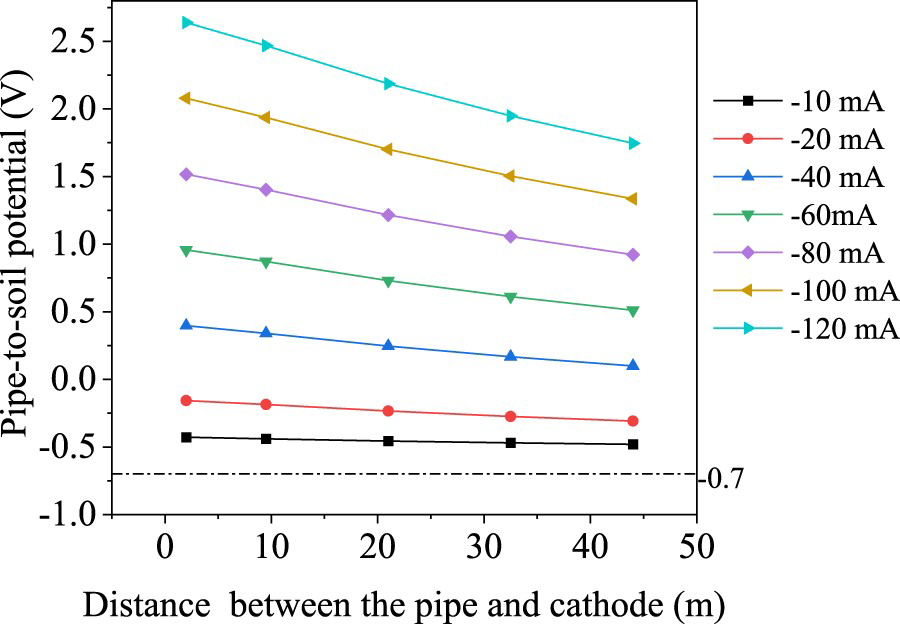
Corrosion mitigation simulation
Metal component shielding net
The corrosion mitigation principle of the buried shielding metal net is that the metal components buried near the interference source react with the interference current and are consumed, so that to change the potential distribution in the soil and protect the pipe outside the shielding net. At a certain distance from the cathode, bury the same material and uncoated metal components as the pipe, such as an iron mesh with a size of 3 * 3 m and a wire radius of 0.5 cm. The shielding mesh was buried vertically with 4 m north–south and east–west spacing from the gas pipes of the H1 household, while its top was 3.5 m from the ground.
When the coating of the gas pipe of only one household was defective, after the shielding net was buried, the soil potential distribution and current direction were shown in Figure 16. The results showed that the current that flowed from the cathode of the EOP system reacted electrochemically with the metal shielding mesh, causing oxidation and corrosion. The current density near the shielding mesh was relatively high, which protected the gas pipe from corrosion.
The potential distribution and current flow direction in the soil after burying shield net when the coating of the pipe of (a) H1 (b) H9 is defective.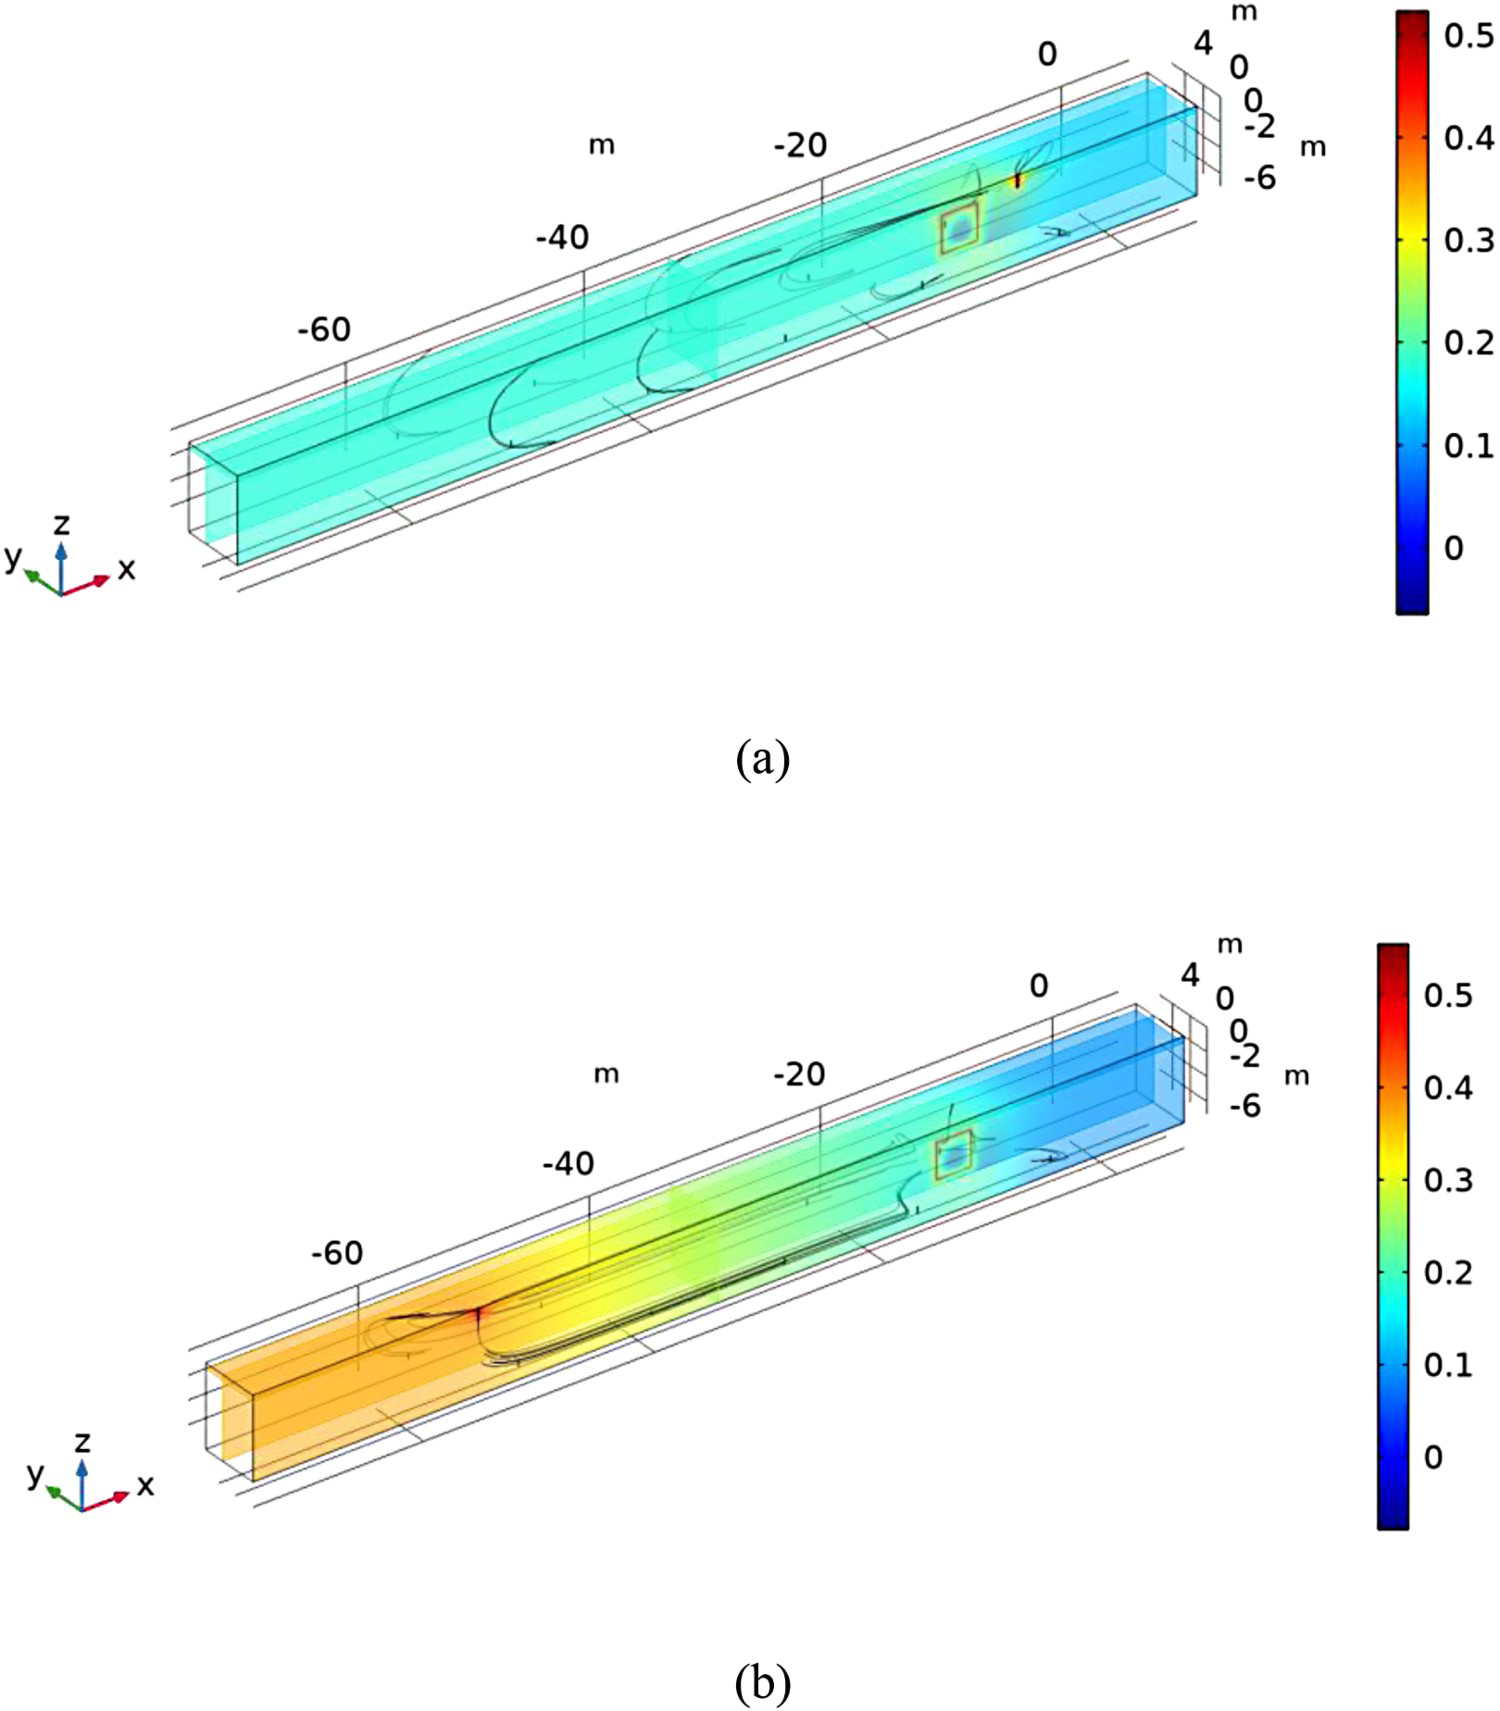
The corrosion mitigation when shielding net buried.

Cathodic protection
The sacrificial anode method is another commonly used method of cathodic protection for pipes [14]. The sacrificial anode is made from a metal alloy with a more ‘active’ voltage (more negative electrochemical potential) than the metal of the structure it is protecting (the cathode). The difference in potential between the two metals means the sacrificial anode material corrodes in preference to the structure. In this case, a sacrificial anode made of zinc with a radius of 1 cm and a length of 10 cm was connected the to the gas pipe for each household, at a distance of 0.2 m and a depth of 1 m.
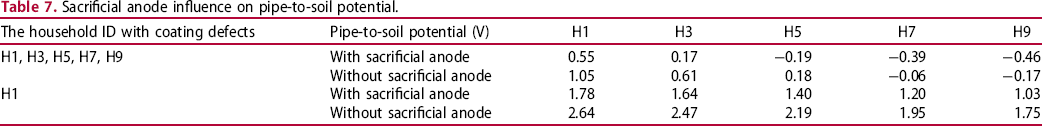
When sacrificial anode protection was used, the calculation results of soil potential distribution and current were shown in Figure 17 and Table 7. It can be seen that connecting sacrificial anode can make the pipe-to-soil potential negatively shift by 0.9-0.3 V, which can effectively protect the gas pipe.
Soil potential distribution and current direction when the pipes equipped with sacrificial anode. Sacrificial anode influence on pipe-to-soil potential.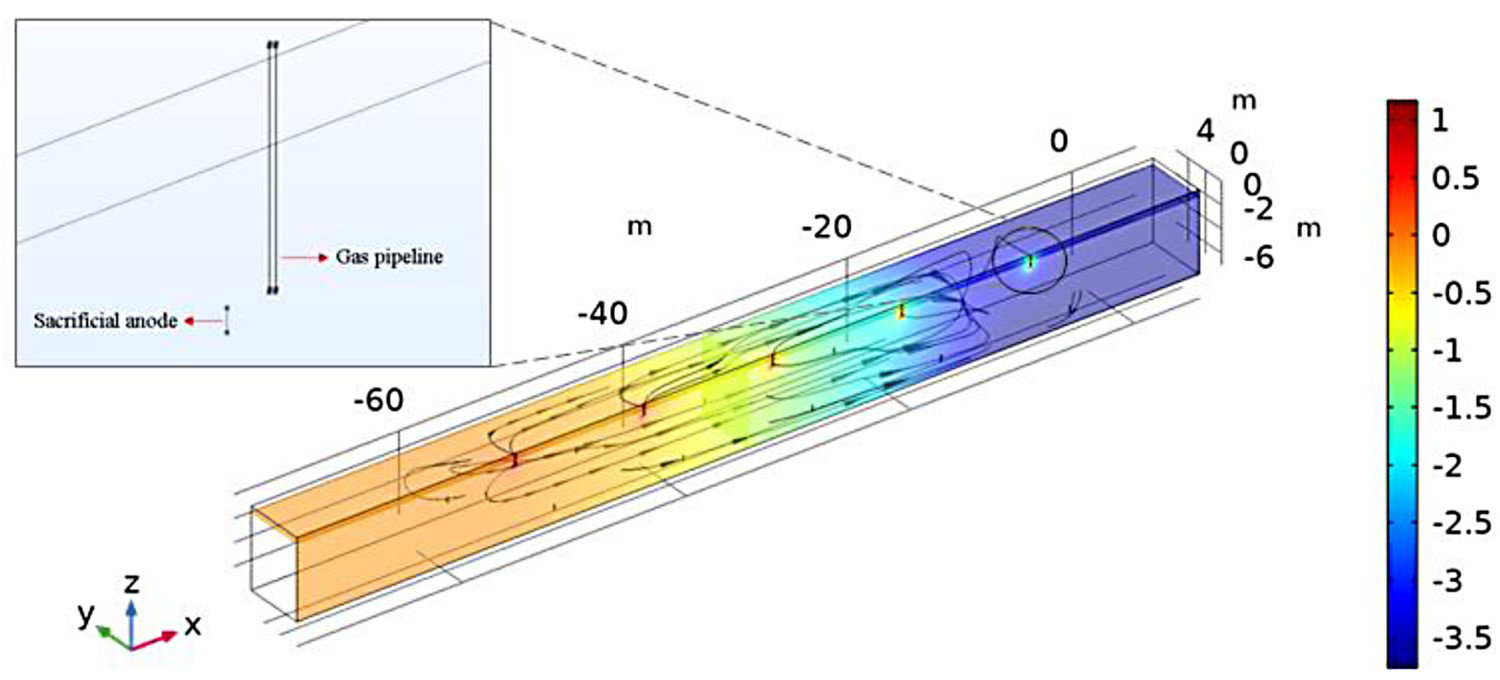
Conclusion
In order to evaluate the interference of EOP system's stray current on surrounding steel gas pipes, both on-site tests and numeric simulation were conducted. The conclusions are as follows.
The interference of the EOP water-proof system is a pulse current of 1 Hz, rising the risks of oxidation corrosion and hydrogen evolution corrosion of the nearby steel gas pipe. When the EOP system is turned on, the average ground potential of gas pipes and building steel pipe rises from −0.7 to 4 V, and the soil potential gradient rises from less than 10 to 1000 mV m−1. The corrosion depth is 8.8-2.8 mm year−1, and the corrosion penetration time is 0.57-1.8 years. The farther away from the EOP system, the smaller the interference current in the soil. When only one EOP system is turned on and the distance from the cathode is more than 30 m, the soil potential gradient will be reduced to insignificant. When the distance is more than 45 m, the soil potential gradient drops to less than 2.5 mV m−1. Changing the locations of the EOP system will cause a change of the current in the soil, which will affect the corrosion of the steel pipe in the soil. Using metal shielding nets and sacrificial anode to alleviate the corrosion of gas pipes is promising. Under the test conditions, after adding the metal shielding net, the pipe-to-soil potential of the H1 households is reduced from the 2.72 to −0.45 V, and the pipe-to-soil potential of the H9 households is reduced from the 1.75 to −0.5 V. Using sacrificial anode can make the pipe-to-soil potential negatively shift 0.9-0.3 V.
Footnotes
Disclosure statement
No potential conflict of interest was reported by the author(s).