
Abstract
Complex load and haul cycles in mining are composed of individual steps, whose times could be better described by a statistical distribution than by the average value. In order to evaluate how loading times and dumping times behave, this paper tested a large dataset of loading and dumping times measured at an open pit limestone mine in Brazil against the distributions most commonly used to model these variables, Log-normal and Normal; as well as Gamma, Logistic, Weibull and Exponential distributions. None of the tested distributions provided statistically significant adherence to the data, but it was possible to identify that for most equipment, Logistic and Normal distributions would produce less error on stochastic modelling then the other tested distributions.
Introduction
The matching between haulage equipment and loading equipment is often the most important cost driver during the earthmoving phase of mining operations accounting for approximately 60% of total operating costs in open-pit mines (Upadhyay and Askari-Nasab 2018). Tightly related to the excavation and production planning, proper fleet sizing allows for the optimal usage of trucks, loaders and excavators. An optimized match between loading and hauling equipment means maximum productivity, resulting in lower capital and operating costs for a given planned production.
Traditional fleet sizing techniques rely on deterministic models, meaning variables have fixed values and the models output a fixed outcome, which in turn is corrected by performance factors such as Utilization and Availability.
The productivity of hauling and loading equipment is an important variable, being one of the main considerations in fleet sizing. It is defined as the amount of material handled per unit of time, usually tons per hour.
Therefore, in a deterministic fleet sizing, it is usual to calculate the expected productivity of trucks and excavators or loaders, and from there choose the best match considering investment and running costs, safety and operational restrictions (Hustrulid et al. 2013). This implies that Utilization and Availability should show some degree of correlation with actual equipment productivity and previous works have shown such correlations can be used along with regression techniques, to model past events (Lanke et al. 2016).
To estimate the real productivity, the deterministic methods will generally calculate the maximum theoretical productivity, or nominal productivity and multiply this value by a performance factor, which aims to correct the value to a more realistic scenario in which the many constraints of the actual operation would interfere with the nominal scenario and degrade the performance (Mambo 2017). An accurate prediction of productivity would ideally ensure the planned production will be met and no installed load and haul capacity will be wasted.
Approaches to simulation that use average values of cycle times as their input variables, estimating a static scenario, albeit adjusted, fail to try to approximate real world operational conditions.
Determinist methods try to foresee a future operation, but are based solely on estimations and historical data, making these techniques prone to significant errors, due to the fact that actual future operations might not fit properly on calculated Utilization and Availability parameters. Mining operations are complex systems, subject to human imperfections and randomness, which makes it very difficult to model analytically (Soofastaei et al. 2016).
The main source of error in deterministic models derives from the fact that real world variables are non-fixed and as such, cannot be properly represented by their averages. This is especially relevant when evaluating truck bunching and overall queue formation as well as idleness of excavators and loaders. A truck having a slower cycle may force the next truck to lose time, be it by slowing down during travel time of having to wait for the loading equipment to finish loading the previous truck, negatively impacting this truck's cycle time. Modelling dynamic processed by fixed averages tend to result in calculations that are not representative of reality (Curi 2014).
The stochastic approach is one way to reduce the aforementioned error and its validation when compared with real-world data shows much better predictions than deterministic models (Martins 2013). Yet, very few works have been published about the behaviour of stochastic variables of load-haul-dump cycle times. There is no consensus on if the individual steps within the cycle can be modelled by a known statistical distribution and if so, which statistical distributions better model the data. Some of the few such works suggest empirically that a Normal distribution could be a viable probability density distribution for modelling loading and dumping times (Rodrigues and Pinto 2006; Martins 2013). Other study based on data from an Indonesian coal mine chose Log-normal distribution as the best fit (Chaowasakoo et al. 2017b), in agreement with a previous availability-based simulation framework using data from a Chilean open-pit mine (Mena et al. 2013). More recent studies adopted Log-normal for dumping and Normal for loading (Januario and Souza 2019).
The present paper is a part of the research conducted by this research team, focused on the stochastic simulation of load and haul operations in mining, in which we discuss the behaviour of the loading and dumping times, the most relevant fixed cycle variables. The paper aims to better understand if some of the statistical distributions most commonly used to model these operations are indeed representative of these operations and how they compare to an empirical cumulative distribution of this study case's measured data.
Materials and methods
In order to evaluate how the cycle variables behave from a statistical standpoint, this research gathered data provided by the truck drivers with the aid of a mining management system, or mining dispatch system, following a strict protocol. The measurements took place in a limestone mine located in Minas Gerais, Brazil, between August and October, 2019, with a total of 14,855 full cycles measured with a fleet of nine off highway haul trucks and three on highway dump trucks, both fleets with 30t capacity bins, in an interchangeable load and haul operation (classified as type m-trucks-for-n-shovels dispatching (Chaowasakoo et al. 2017a)) as depicted on Figure 1.
Fleets and existing combinations for the load and haul cycle at the mine. Images are available in colour online.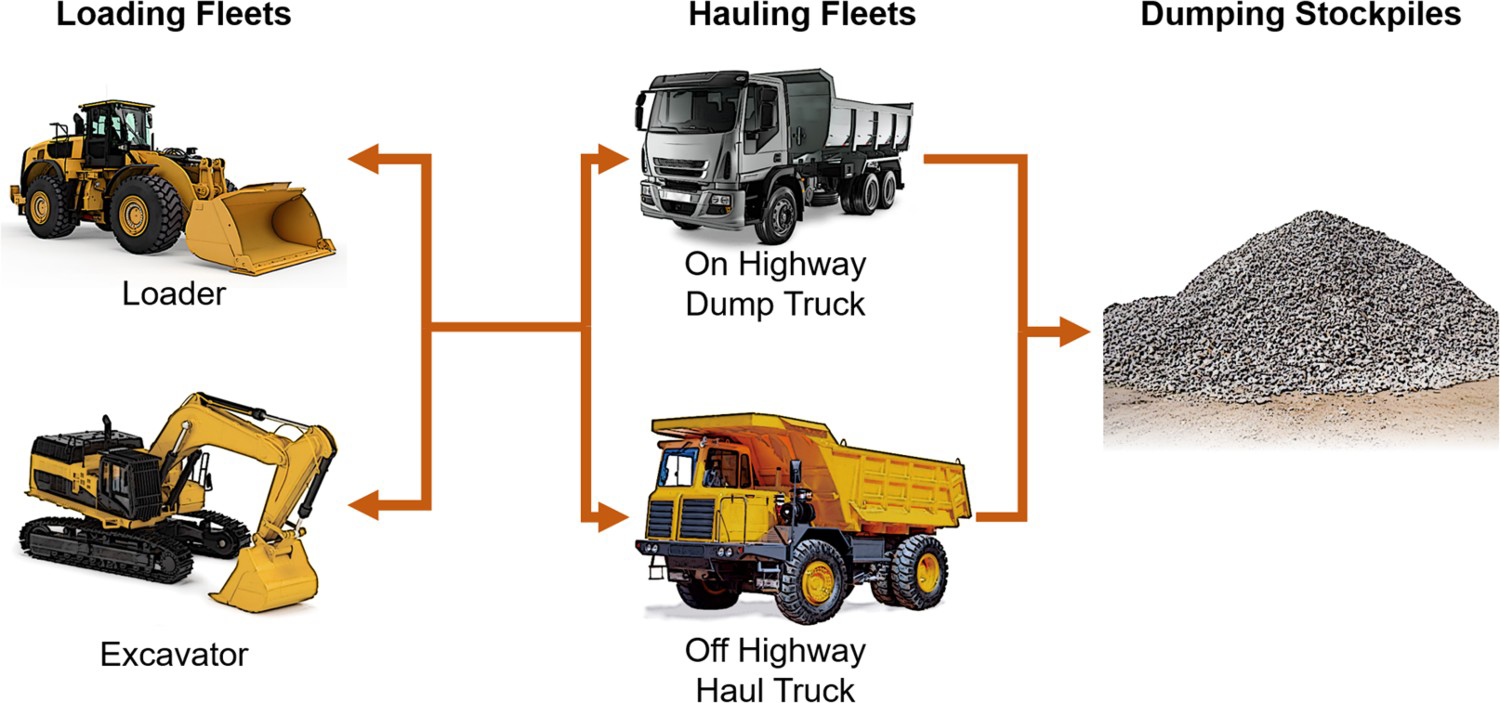
For loading times, the start of measurement was defined as the moment when the truck was positioned under the loading equipment bucket, or on a pre-defined mark in cases where the loading equipment were unable to help truck spotting. The end of measurement was standardized as the moment immediately before the truck is released by the loading equipment and starts moving. For dumping, the start was defined as the pressing of the button or pulling of the lever that activates the hydraulic system which raises the truck bin, and the end corresponds to the moment immediately before the truck starts moving away from the dumping spot. Figure 2 represents the generic load-haul-dump cycle with the parameters for beginning and ending of load and dump times.
Data gathering parameters for loading and dumping times within the mining cycle. Images are available in colour online.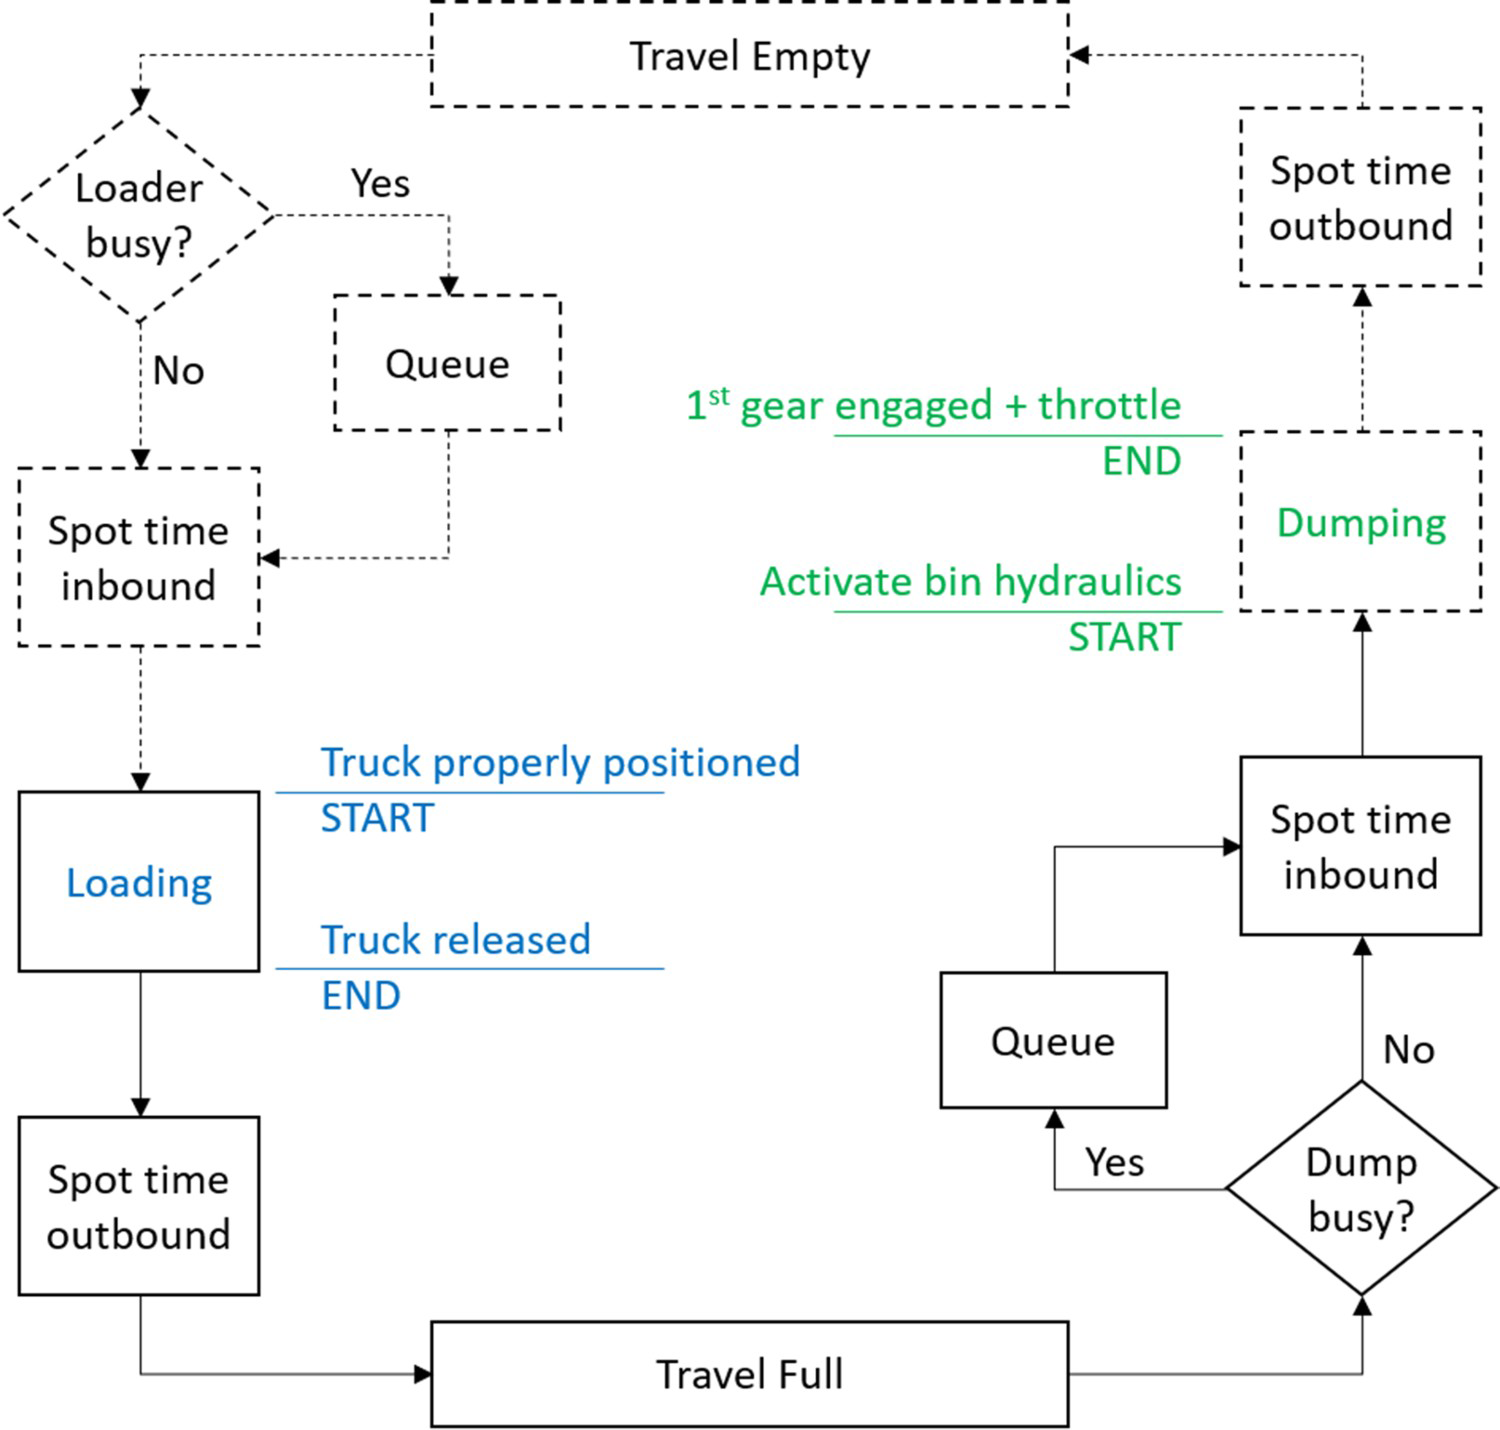
All truck drivers were trained in this protocol, and in order to reduce errors produced by the intrinsic differences between equipment, we grouped loading time data considering the type of machinery (three excavators and four hydraulic loaders) and dump time was filtered by each truck separately.
Outliers and human error were treated by discarding measurements below 0.2 min in loading and 0.15 min in dumping, as well as value above 5 min in loading and 1 min in dumping. These hard caps were arbitrated based on typical cycle times provided by manufacturers (Caterpillar Inc 2013, 2018) on physical limitations of the equipment and reasonable assumptions of operational factors, in which should those be outside the proposed range it is safe to assume it is either bad data, caused by human error, or an atypical situation caused by external factors.
Data points were then grouped by truck class (off highway and on highway) and by loading equipment type (excavators and loaders) as shown on Figure 1. Finally, the data were analysed using Minitab (Minitab Inc. 2013) statistical software's probability plots, and had their Goodness of Fit calculated for the most common statistical distributions, using Anderson–Darling test (Minitab Inc. 2017) as reference to their adherence to each of the distributions.
For graphical analysis all data were plotted and compared to known cumulative distribution functions in order to provide an empirical and visual verification of how close the distribution is to the real-world data.
Loading sub-datasets statistics.
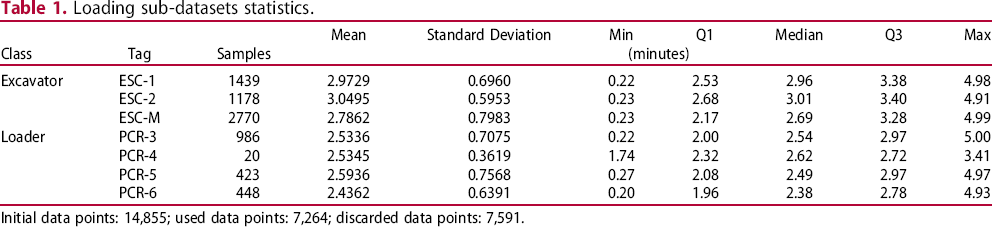
Initial data points: 14,855; used data points: 7,264; discarded data points: 7,591.
Dumping sub-datasets statistics.
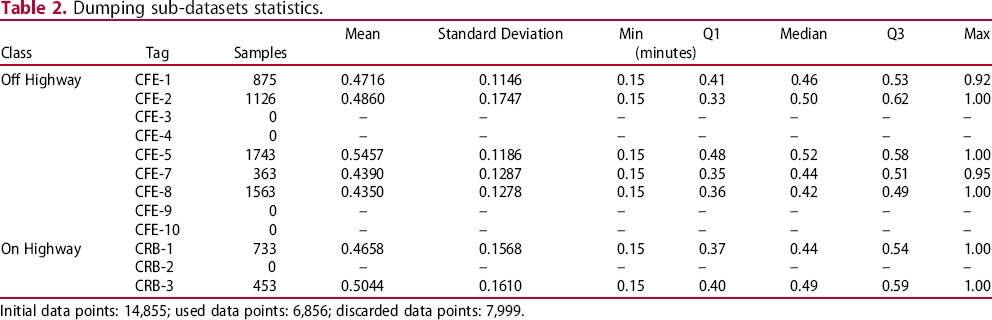
Initial data points: 14,855; used data points: 6,856; discarded data points: 7,999.
Since data gathering was based on manual input and self-report, it was expected that a high number of bad data points would occur. This resulted in all data from CFE-3, CFE-4, CFE-9, CFE-10 and CRB-2 being discarded due to not fitting the specified range of acceptable values, as well as some of the data from other trucks, totaling 51.10% of the loading data and 53.85% of the dumping data being discarded. This is indicative of some truck drivers unwillingness to properly follow the guidelines of this study, as well as a large amount of human error.
The trade-off in this case would be using a fully automated data gathering solution, capable of more consistent data gathering, but subject to instrument precision error and less discretion than a human operator. Future studies should explore this alternative, as well as new technologies.
Results
Anderson–Darling values for loading times.
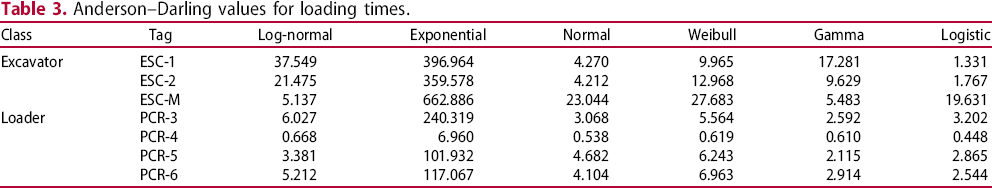
Larger datasets have shown a tendency to result in higher Anderson–Darling values. This effect can be attributed to goodness-of-fit tests discriminatory power, which increases with an increased sample size, resulting in even small differences between two datasets being considered statistically significant (Lazariv and Lehmann 2018).
Across most loading equipment the Logistic distribution has shown to be the best fit, followed by Normal. For loaders, the Gamma and Log-normal distributions also yielded good results.
Excavator ESC-M is discordant from the rest of loading equipment. This can be attributed to the fact that this excavator was operated and maintained by a third-party contractor and was mostly used for pit expansion, loading coarse blasted rock and as ancillary equipment on earthmoving tasks.
Anderson–Darling values for dumping times.
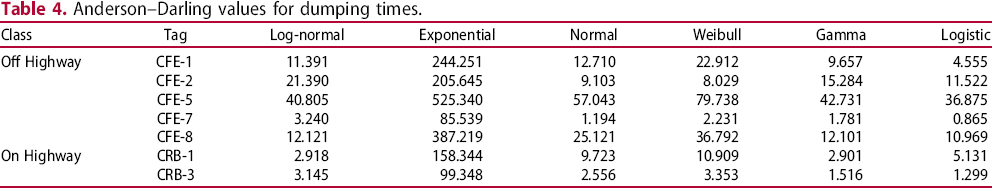
As noted with loading times, for dumping times larger datasets tend to result in higher Anderson–Darling test values. The Logistic distribution has the best fit for most trucks, although Gamma, Log-normal and Normal are also good fit for some of the datasets.
The results were reasonably consistent among all trucks and loading equipment. Also, loading and dumping times, both followed the same overall curve shape with similar Anderson–Darling test values. It is noteworthy however, that the mean and standard deviation of the datasets were different for each truck class and loading equipment type.
To exemplify the results graphically, we chose a single sub-dataset as reference. Figure 3 exemplifies the consolidated results of Goodness of Fit tests for the loading time of hydraulic excavator ESC-1, with Anderson–Darling (AD) values for each distribution. Although some probability density functions were less prone to error than others, all p-values are below significance level for all tests, including the other sub-datasets, which implies that none of the tested data is statistically significant to the distributions. Therefore, modelling using any of the tested probability density functions to model loading and dumping times is subject to some degree of error.
Goodness of Fit plots for hydraulic excavator ESC-1, for a 95% confidence interval. Images are available in colour online.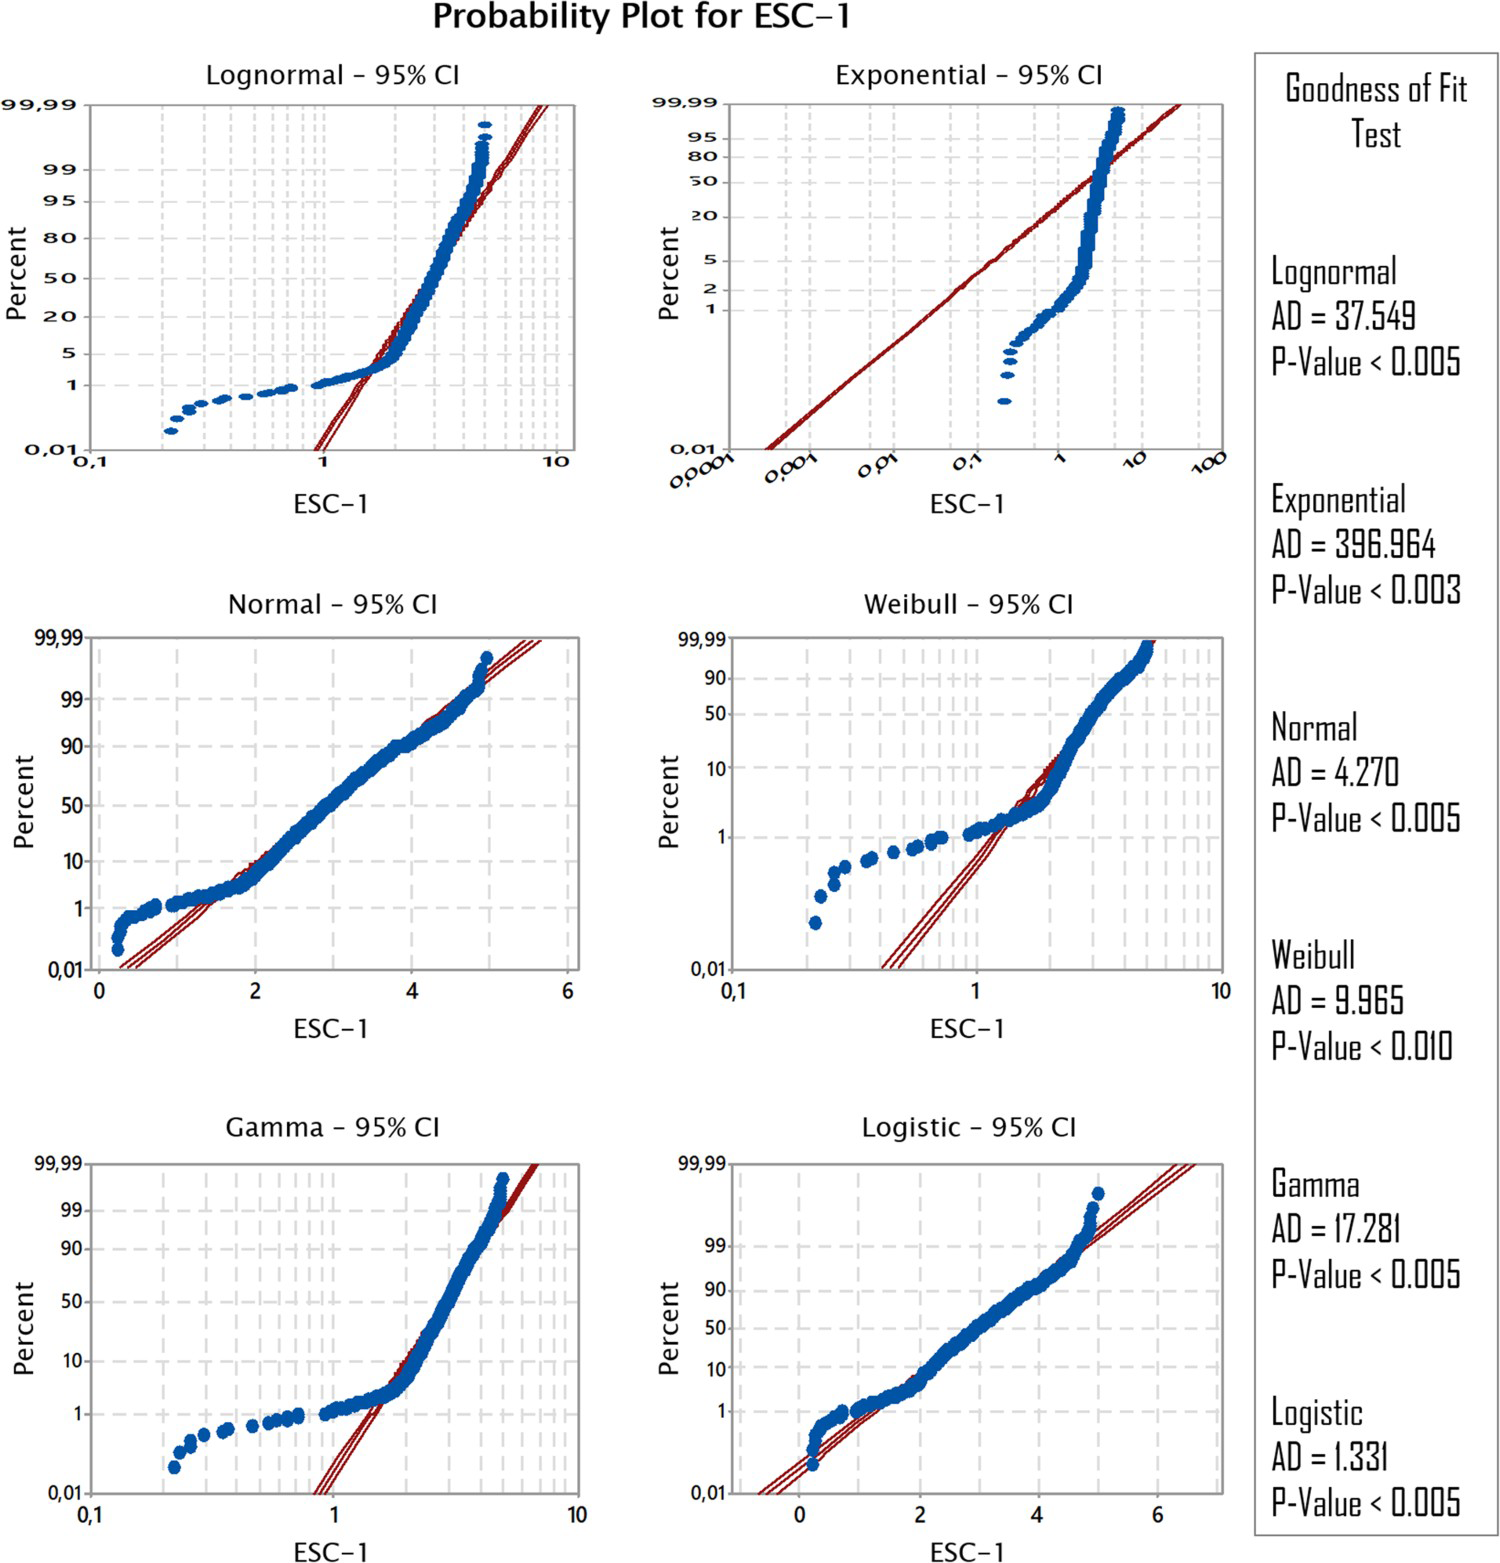
To verify the Goodness of Fit test results and to test the definition proposed by Chaowasakoo et al. (2017b), Figure 4 shows the cumulative probability distribution of ESC-1 load time, where it is possible to see the gaps between the Log-normal curve and real world data from the mine, as well as how Normal and logistic curves provide a much better fit.
Empirical cumulative probability distribution of load time for ESC-1. Images are available in colour online.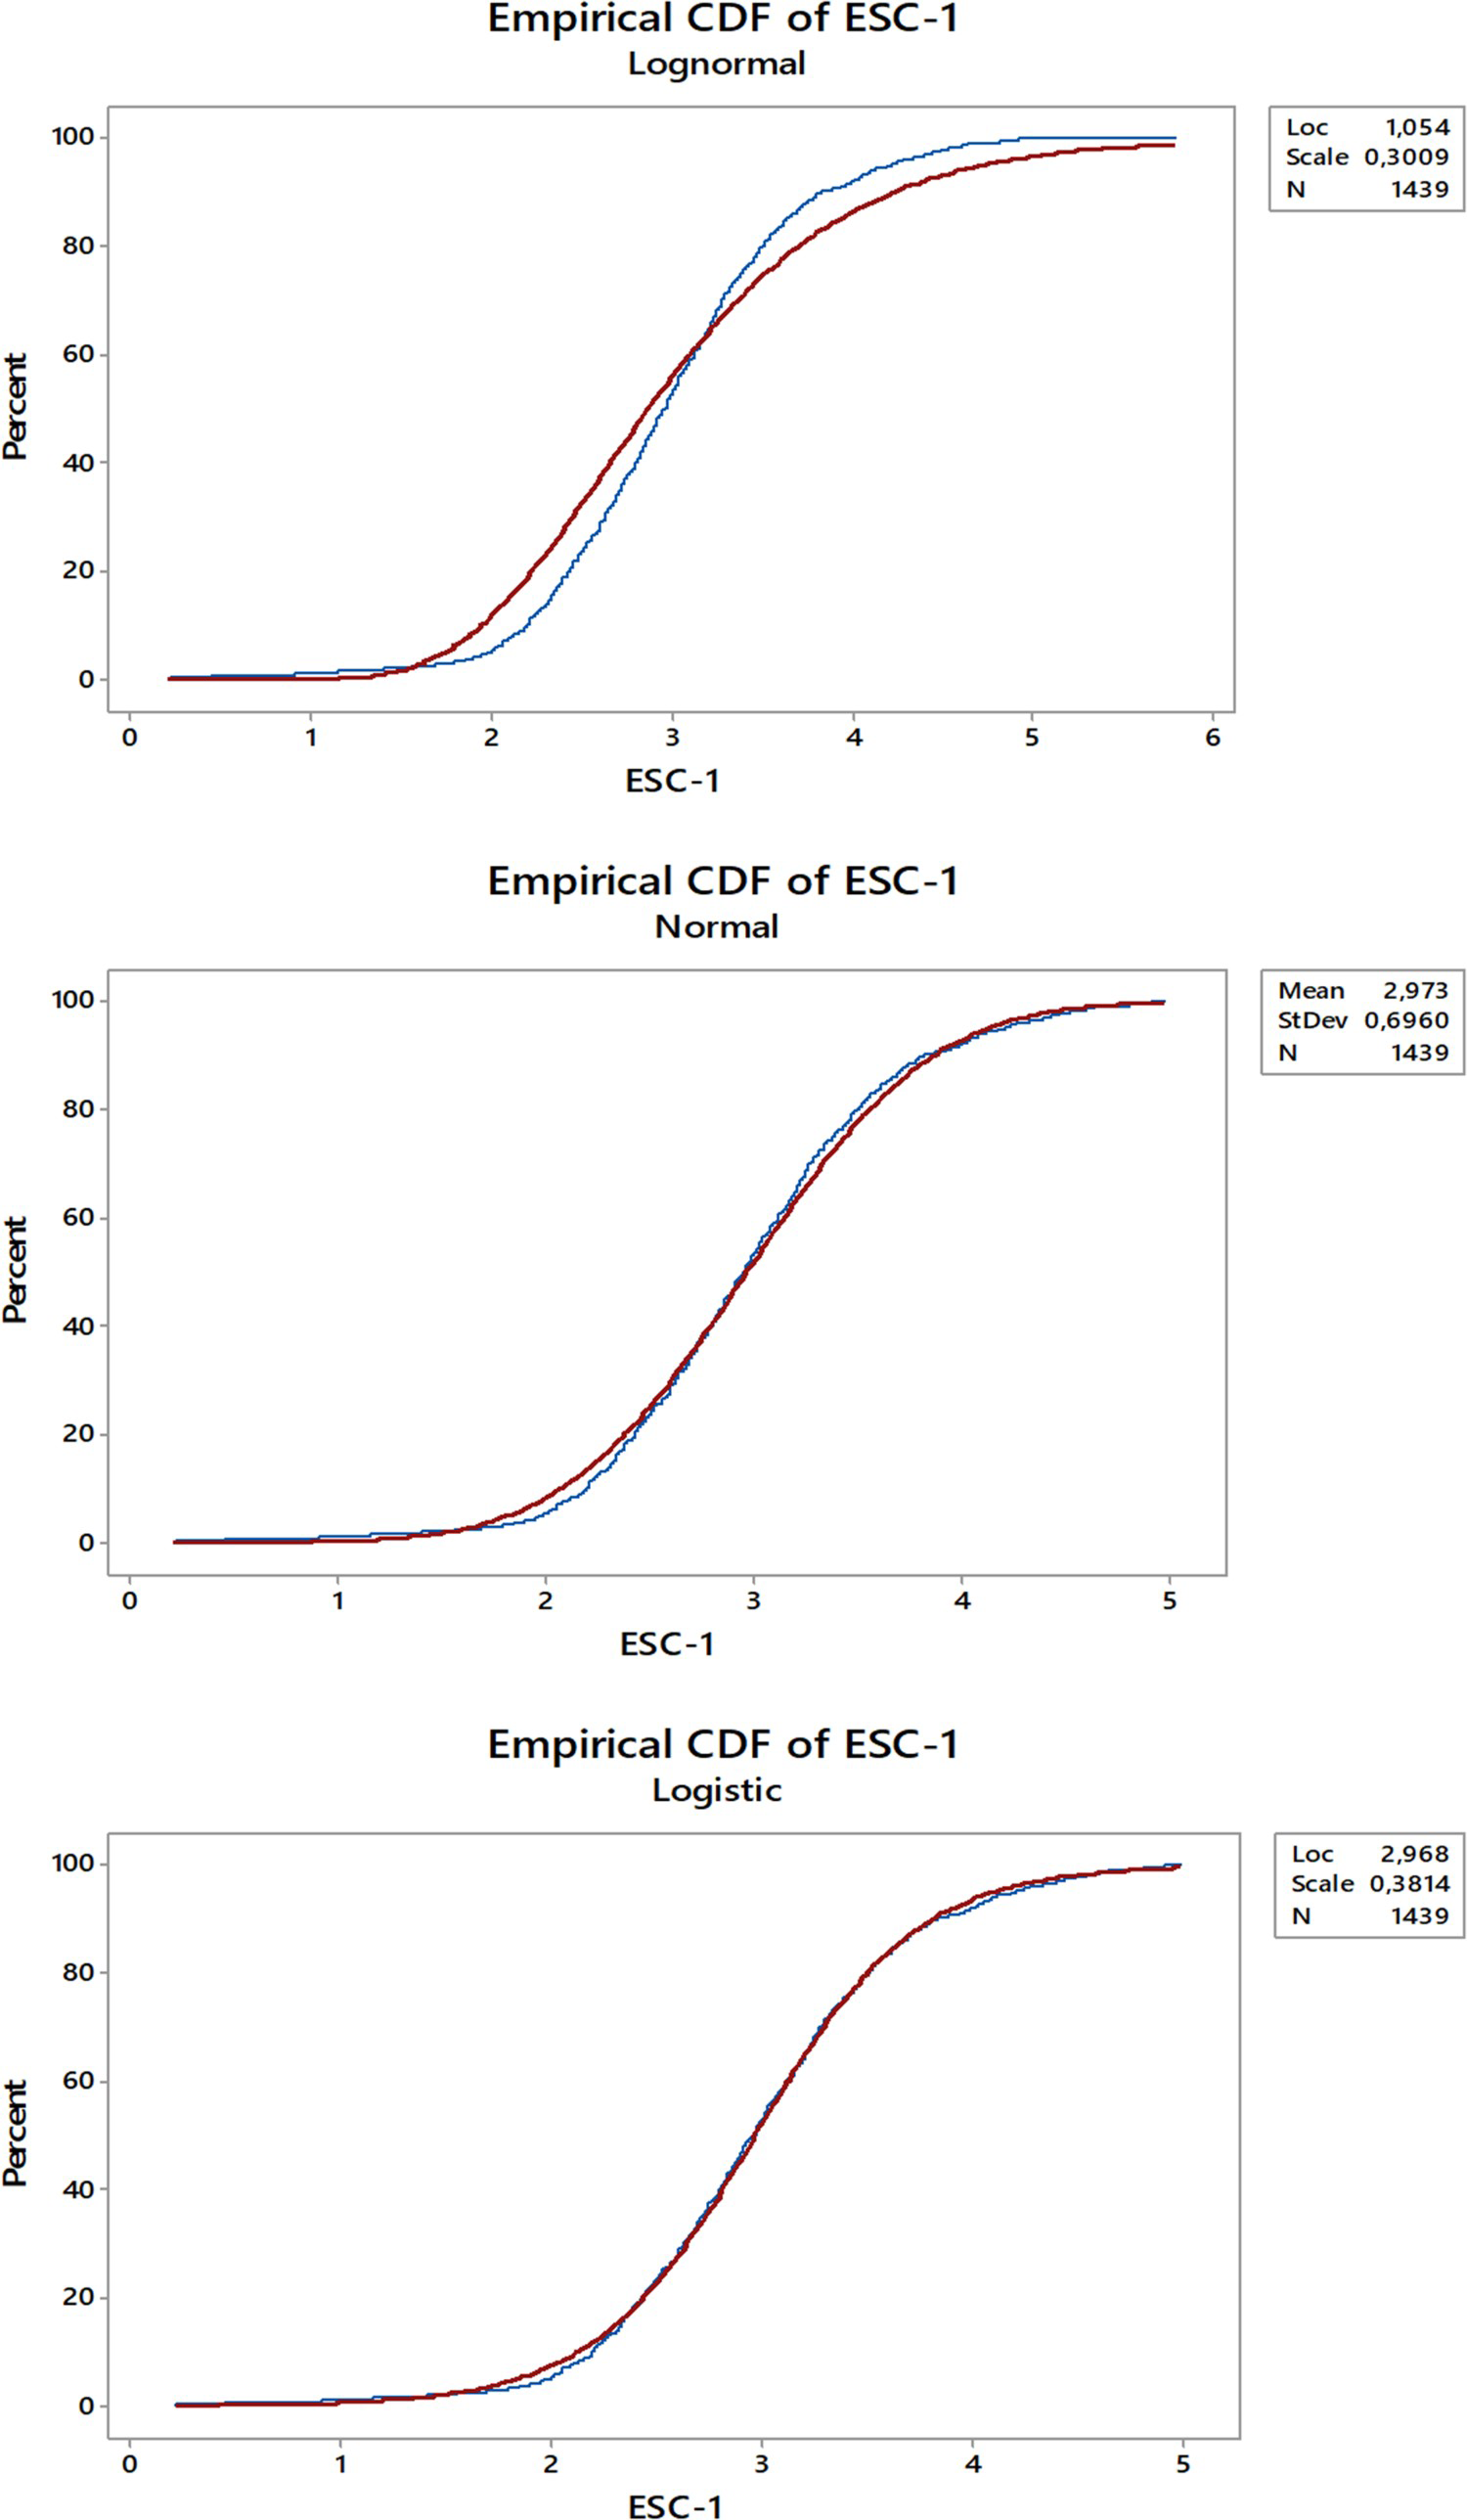
The empirical distributions for all equipment combined, along with corresponding histograms is shown in Figure 5 for both Loading and Dumping times.
Empirical cumulative probability distribution and histograms of load and dump times. Images are available in colour online.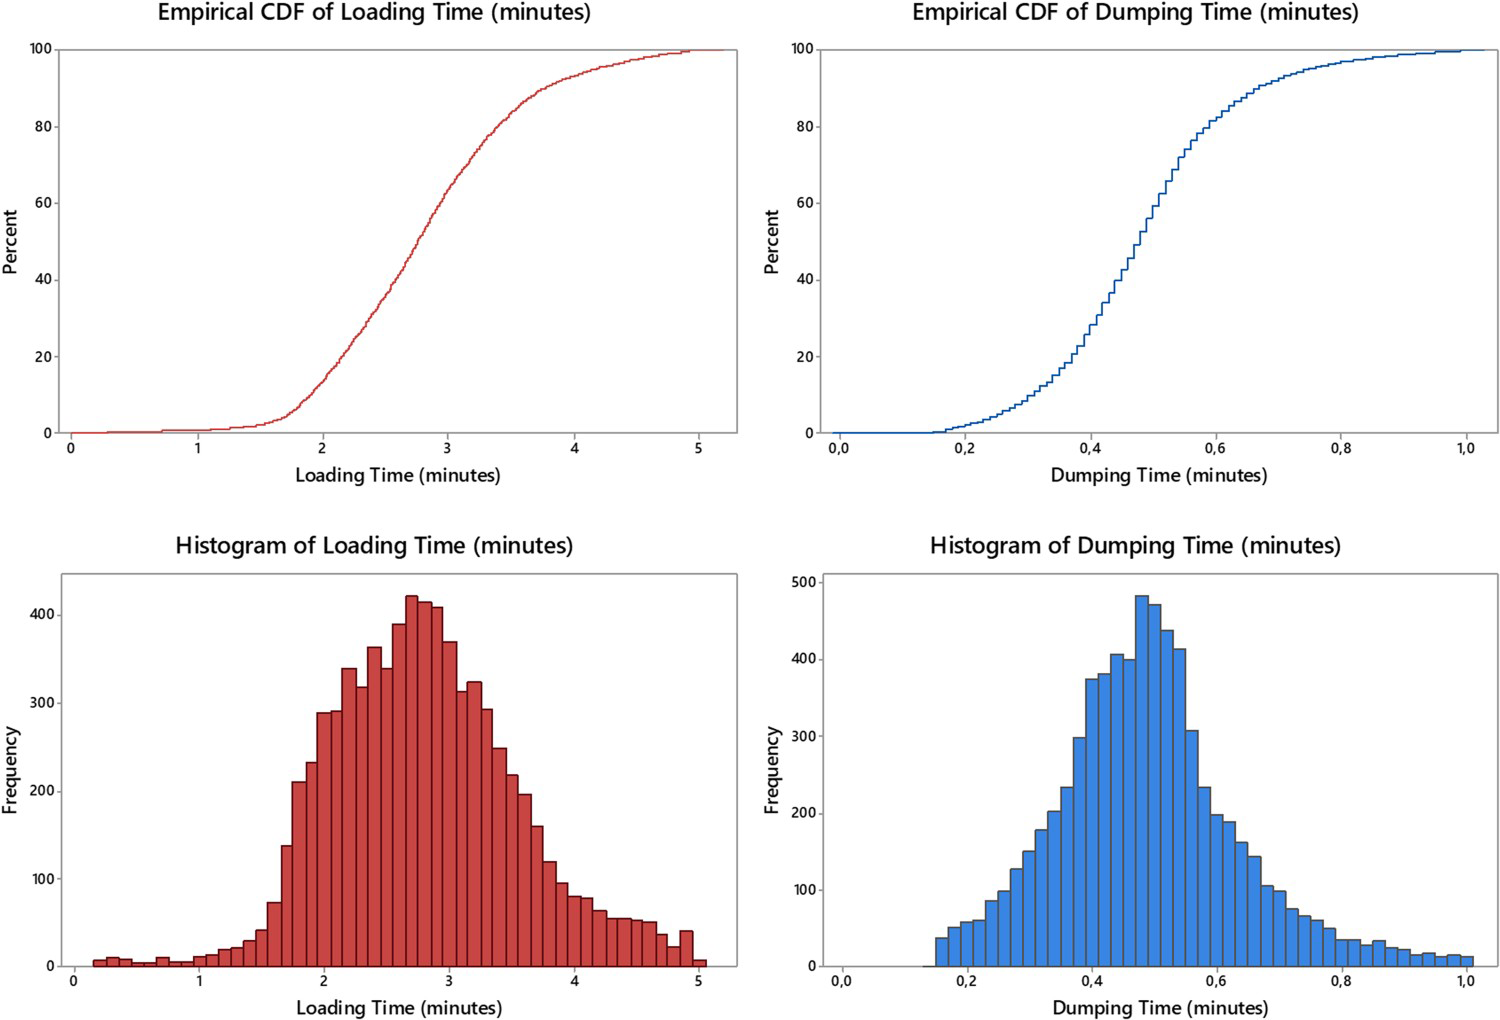
Discussion
Previous to this study, the most comprehensive study to date, done by Chaowasakoo et al. (2017b), analysed data from a coal mine and adopted Log-normal distribution as being more representative for unitary operations, based on graphical analyses and empirical fit of the Log-normal and exponential curves compared to the empirical probability density function. The Log-normal distribution proposed by Chaowasakoo et al. (2017b) has better fit than the exponential distribution, but it still has significant error when compared to the empirical probability density function.
The effect of rare longer times was not dismissed by Chaowasakoo et al. (2017b), which could be useful to represent outside influence factors in this particular case, but makes it impossible to isolate the cycle variables for further analysis. By adopting hard limits to how much time a loading or dumping operation can still be considered typical, in order to reduce data errors and outliers, the empirical function would strongly resemble the bell-shaped curve, often associated with the standard Gaussian distribution, which in turn would make Chaowasakoo et al. (2017b) results consistent with the results presented on this paper.
For excavator ESC-M, since the kind of work performed varied during the time of data gathering, for any meaningful conclusion, it would be necessary to filter the data in order to analyse each specific activity separately, which is beyond the scope of this paper.
The data gathering was based on human reporting, and as such could be flawed due to human error. This makes the analysis of Anderson–Darling statistics, as well as p-value, of very little significance. However, even though bad data are significant enough to result in unreliable statistical tests, when observed in its cumulative probability distribution, these unreliable datum points are diluted within the much larger volume of good data and the overall graphical behaviour accurately shows how the variable behaves in real world conditions. This brings greater relevance to the pure graphical analysis, which shows, qualitatively, between the many probability distribution, which are the ones with less error.
Conclusion
Loading and dumping times have shown low similarity with all tested probability distributions (Log-normal, Exponential, Normal, Weibull, Gamma and Logistic), when tested using the Anderson–Darling test.
The graphical analysis has shown that the divergence is much greater with Log-normal distribution, as suggested by part of the literature (Mena et al. 2013; Chaowasakoo et al. 2017b), when compared to Logistic and Normal distributions.
Although using Log-normal distribution on a stochastic simulation may be a pragmatic choice, the error from this model was very high when this variable was isolated on the tested dataset, when compared to others such as Normal and Logistic distribution, which however having the null hypothesis rejected, are the ones that best fit the data measured in a real mining operation.
Out of the many unit operations comprising the mining load and haul cycle, loading and dumping are both the easiest to model and the ones with more reliable self-reported data. Further work should be done to evaluate other load and haul cycle's times, as well as to consolidate the models for these two more reliable variables. For the other cycle step times, it is expected more external influences and thus worse adherence to known statistical models.
Whenever there is reliable data supporting the use of a proper empirical distribution function for each of the individual processes within the load-haul-dump cycle, it would be advisable to adopt such empirical distribution since this study failed to find enough statistical evidence that any of the known tested distribution is representative of those processes.
Further investigation is needed in different mines, handling different materials and with different equipment. Automated data gathering may also be beneficial as a means of reducing the uncertainty caused by human error.
Footnotes
Disclosure statement
No potential conflict of interest was reported by the author(s).
Data availability statement
No separate dataset will be release along with this paper. All relevant data and analysis are provided within the main text.