
Abstract
The prediction of the depth of fracturing in the sides of underground excavations in coal seams is needed to determine the requirements for rib support and to assess pillar stability. The prediction requires consideration of how coal strength is determined and extrapolated to the mine scale and how stresses are redistributed around excavations in bedded coal masses. The impact of bedding in a stress analysis can be examined by adopting transverse isotropy and this results in much lower confining stresses in the horizontal plane and much higher vertical stresses close to the excavation boundary. The extent of rib scaling can be derived if the bedded coal is modelled as a brittle material. For coal pillars, the depth of scaling may be sufficient to have a material impact on their effective width and hence stability. The specification of rib support needs to consider how the failed coal may subsequently collapse.
Introduction
Most excavations in underground coal mines are located within the coal seams and the workforce is often in close proximity to vertical coal faces. Collapse of these faces, referred to as ribs, presents a potentially fatal hazard. The prevention of the collapse is a key requirement for any ground control strategy. In the absence of adversely aligned joints or cleats, rib collapse follows the onset of stress-driven failure within the coal. The gradual collapse of the sides of roadways is referred to as spalling or scaling. Seedsman (2017) suggested that some coal bursts could be considered as a collapse following the rapid onset of brittle failure with a failure criterion based on the work summarised in Kaiser (2019).
Rib scaling has been invoked as a determinant of pillar life (Van Der Merwe 2016). Recognising that pillars are defined by roadway excavations, there should be a connection between rib collapse, pillar scaling, and the stability of narrow pillars. Pillar design is primarily based on empirical methods using databases of pillar failures with width/height (w/h) values between 1.5 and 4.0 and having been formed at depths of less than 205 m (Van Der Merwe and Mathey 2013a). A number of pillar strength equations have been derived from the databases and they all have a factor that can be interpreted as representative of the compressive strength of coal; it is noteworthy that this strength cannot be inferred from laboratory-derived values (Mark and Barton 1997). Research has focussed on methods to estimate the strength of coal pillars at greater depths where the width/height ratios are greater than those in the database. There has been less research into the challenges of the use of the empirical relationships for narrow pillars with width/height ratios less than 2.0 (Madden and Hardman 1992; Hill 2005).
Several researchers have sought to derive strength parameters for coal by back-analysing the pillar failure database. Esterhuizen et al. (2010) adopted the Hoek-Brown criterion, with the implicit assumption of isotropy, and derived a set of peak and residual strength parameters with the latter being based on calibration to stress gradients in the edges of coal pillars. Bertuzzi et al. (2016) adopted the same parameters for the shear failure of coal at high stresses but applied the brittle failure parameters for strong rock masses (Diederichs 2007) at the low stress range. In a paper specifically focussed on the coal ribs (Sinha and Walton 2020), a failure criterion involving brittle failure, plasticity and general shear in a 3D finite difference code required 17 parameters to be determined by calibration and assumed an isotropic coal mass.
Adopting transverse isotropy results in substantially different stress redistributions around excavations when compared to an isotropic assumption and hence different strength parameters are obtained in any back analysis. A limitation in the adoption of transverse isotropy is that plasticity cannot be modelled and hence stresses in yield zones cannot be used for calibration. Except for the pillar collapse database there is relatively little data on in situ coal behaviour, so in the following work a simple two-dimensional continuum model is used to probe the epistemic uncertainty in coal behaviour. The use of such a simple numerical analysis is consistent with the observation made by Lambe (1973): ‘ … in making his (a) prediction, the engineer should be consistent in the sophistication of his (the) method of prediction and in the quality of the data employed’.
Coal
Coal is an organic material that was originally deposited as peat in a sedimentary environment. At a laboratory testing scale coal samples are either ‘intact’ or contain ‘non-persistent cleat and banding’ while at the mine scale coal has ‘persistent cleat and bedding’ (Figure 1). In a coal mass bedding is the dominant discontinuity and based on the author's experience has very high lateral persistence (well in excess of 20 m) and the spacing of the bedding can vary between about 1 and 50 cm. The bedding discontinuities may be in the form of partings within the coal or at the boundaries between coal and claystone/mudstone layers within the coal seam. Cleat is typically aligned normal to the bedding and does not extend into the surrounding sedimentary rocks.
(a) Banding, bedding and cleat patterns in coal seams (Medhurst and Brown 1998): (b) typical exposure of a coal seam showing banding and bedding often picked out by claystone bands; (c) thicker claystone horizons can be readily interpreted from the density and gamma logs but inspection of the logs and photographs reveals more bedding partings. ‘Images are available in colour online.’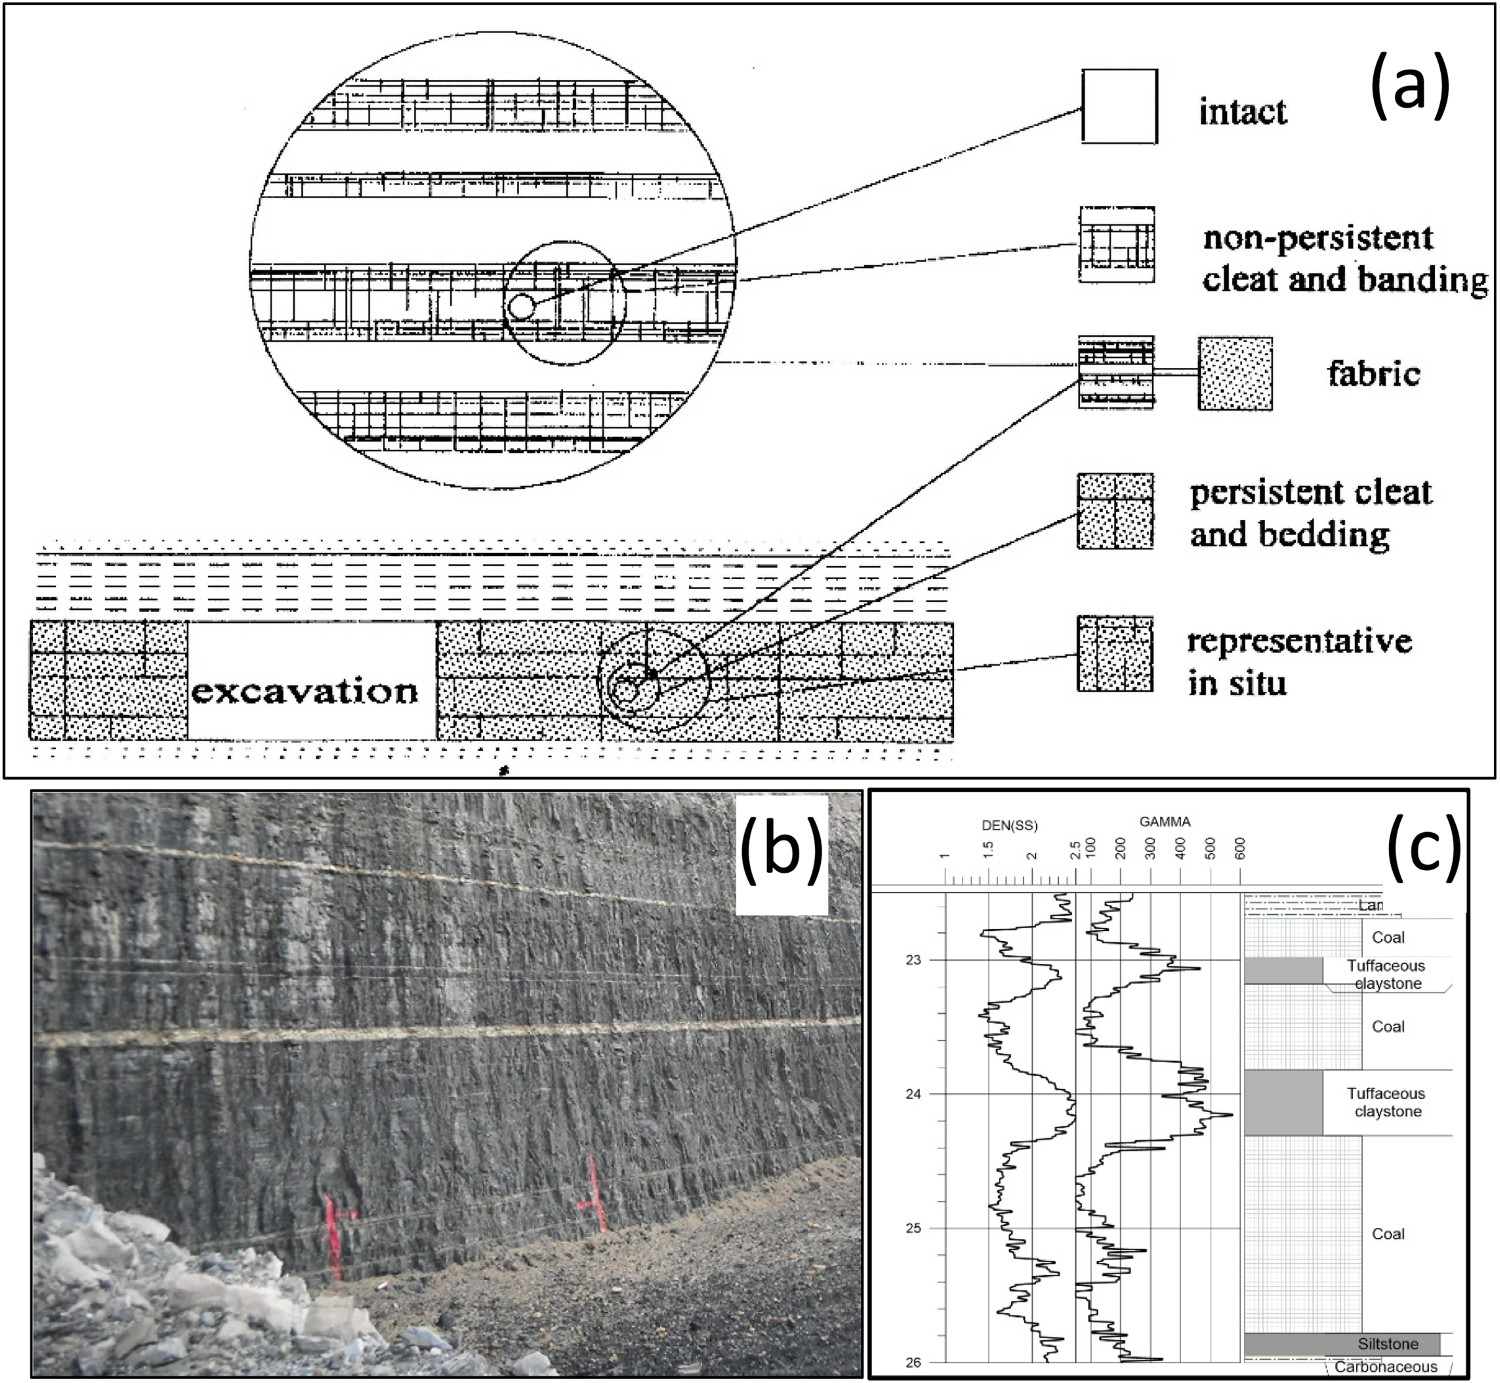
Coal is typically an aquifer and combined with its low modulus this leads to a change in the stress regime during mining. When reviewing Australian coals, Enever et al. (2000) found that prior to mining the horizontal/vertical stress ratio in coal is typically in the order of 0.8–1.0 and lower than in the enclosing rocks. Based on data from some Australian mines, Seedsman (2004) proposed that when the stress field is measured in coal seams immediately ahead of a mining face this stress ratio is typically less than 0.5 and may be related to shrinkage and reloading of the coal as the pore pressures in the coal seam are reduced as mining proceeds. The author is unaware of the results of similar measurement campaigns in coal ahead of the mining face in other countries.
The key properties of coal on which the following discussions rely are: (a) coal is a low strength material that can be readily overstressed in mining operations, (b) a coal mass must be considered to be transversely isotropic, (c) laboratory testing of intact coal does not include bedding partings, (d) the major principal stress in a coal seam is vertical.
Mine observations
During underground mining, excavations within the coal seam are typically characterised by the formation of thin slabs of coal in the sides or ribs (Figure 2(a,b)). The author has observed that these slabs are defined by mining-induced fractures that may be up to about 200 mm apart and which are additional to any cleat that may be present. This behaviour is referred to as spalling in the Australian coal mining industry. If the coal in the roof is thinly bedded, roof support will be required but if it is thickly bedded minimal support is required even at depths of in excess of 400 m. The general roof conditions (at least in Australian mines) are consistent with a stress field in which the vertical stress is dominant.
Examples of coal ribs: (a) unbolted rib at 60 m depth with a coal UCS of less than 10 MPa; (b) bolted rib at approximately 400 m depth in a coal with a UCS in the order of 15–20 MPa; (c) rib scaling in a South African Mine (Van Der Merwe 2004).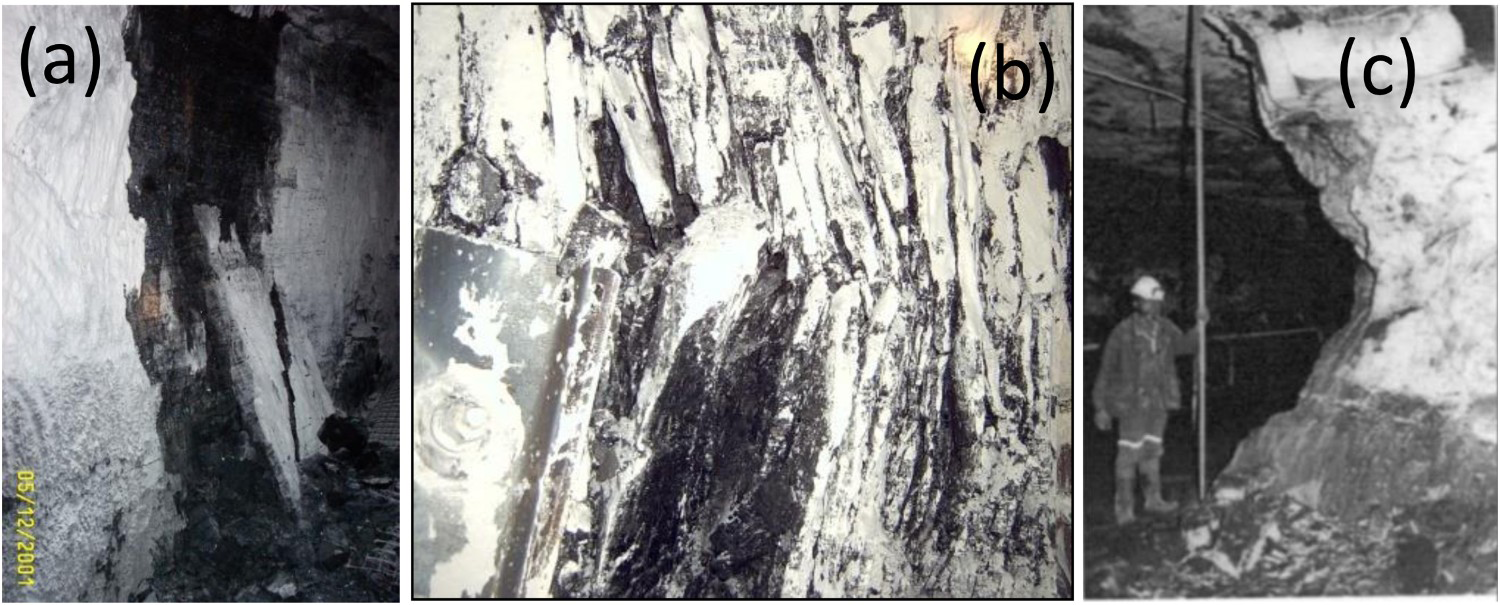
Scaling and extensometry
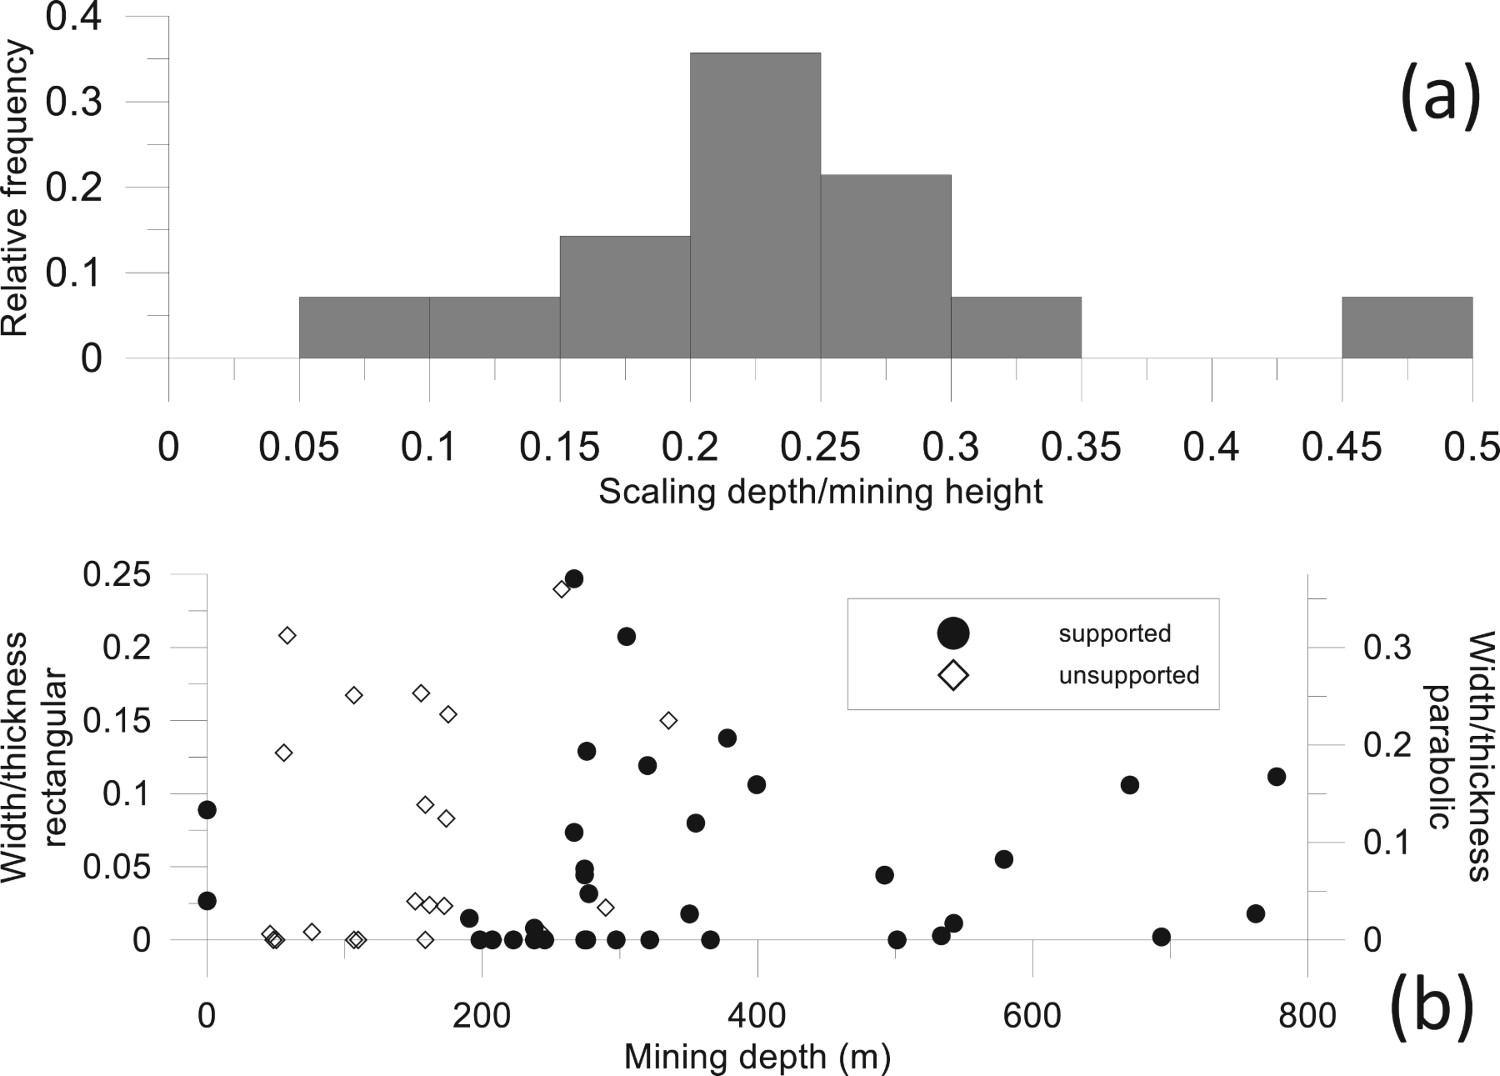
Scaling is the term used for when the coal falls from the sides of excavations if a retain/hold support regime has not been installed (Figure 2(c)). The shape of the scaling in Figure 2(c) is approximately parabolic. There is published data on scaling from shallow bord and pillar mines in South Africa (Van Der Merwe 2016) – the dimensions of the pillars are not given but it is recorded that the dominant condition is that shown in Figure 2(c). The depth of scaling ranges from 0.3 to 1.42 m and when normalised to the extracted seam thickness the range is typically between 0.15 and 0.3 (Figure 3(a)). For USA mines, Mohamed et al. (2016) tabulate seam heights and volumes of rib spall which if converted to spall depth assuming rectangular or parabolic shapes indicates depth/thickness ratios less than 0.25 (Figure 3(b)). There are reports of spalling averaging 0.2 of the extracted height on a longwall face at 240 m depth (Zhang et al. 2016).
Colwell (2004) includes data from rib extensometers that were installed in coal mine roadways (maingate travel roads) prior to longwall retreat – they do not show movements associated with the initial formation of the roadway. Figure 4 shows the result from a 20-point extensometer with the onset of movement in excess of about 5 mm (referred to as the depth of softening) recorded as 1.25 m in a 2.9 m thick seam at 480 m mining depth after the longwall had progressed 981 m beyond. At other sites, the depth of softening was interpreted from extensometers with anchors spaced 1.0 m apart. Figure 4 also includes a plot of the reported depths of softening normalised to seam thickness – except for some outliers there is a trend towards an aspect ratio of approximately 0.4. A similar extensometer data set is available from a 3.3 m high coal rib at a depth of 330 m after the longwall had progressed 93 m beyond (Heritage 2020). At this site, there was a low-strength claystone band in the seam which may have been associated with the greater reported depth of softening of about 3 m. Both extensometer plots show an approximately linear trend of approximate 3% – referred to as a bulking factor.
(a) 20-point rib extensometer results for a travel road behind a longwall face; (b) the depth of softening/pillar height ratio interpreted from 5-point extensometers plotted against depth of cover; (c) interpreted rib deformation possibly localised by clay band (Heritage 2020). ‘Images are available in colour online.’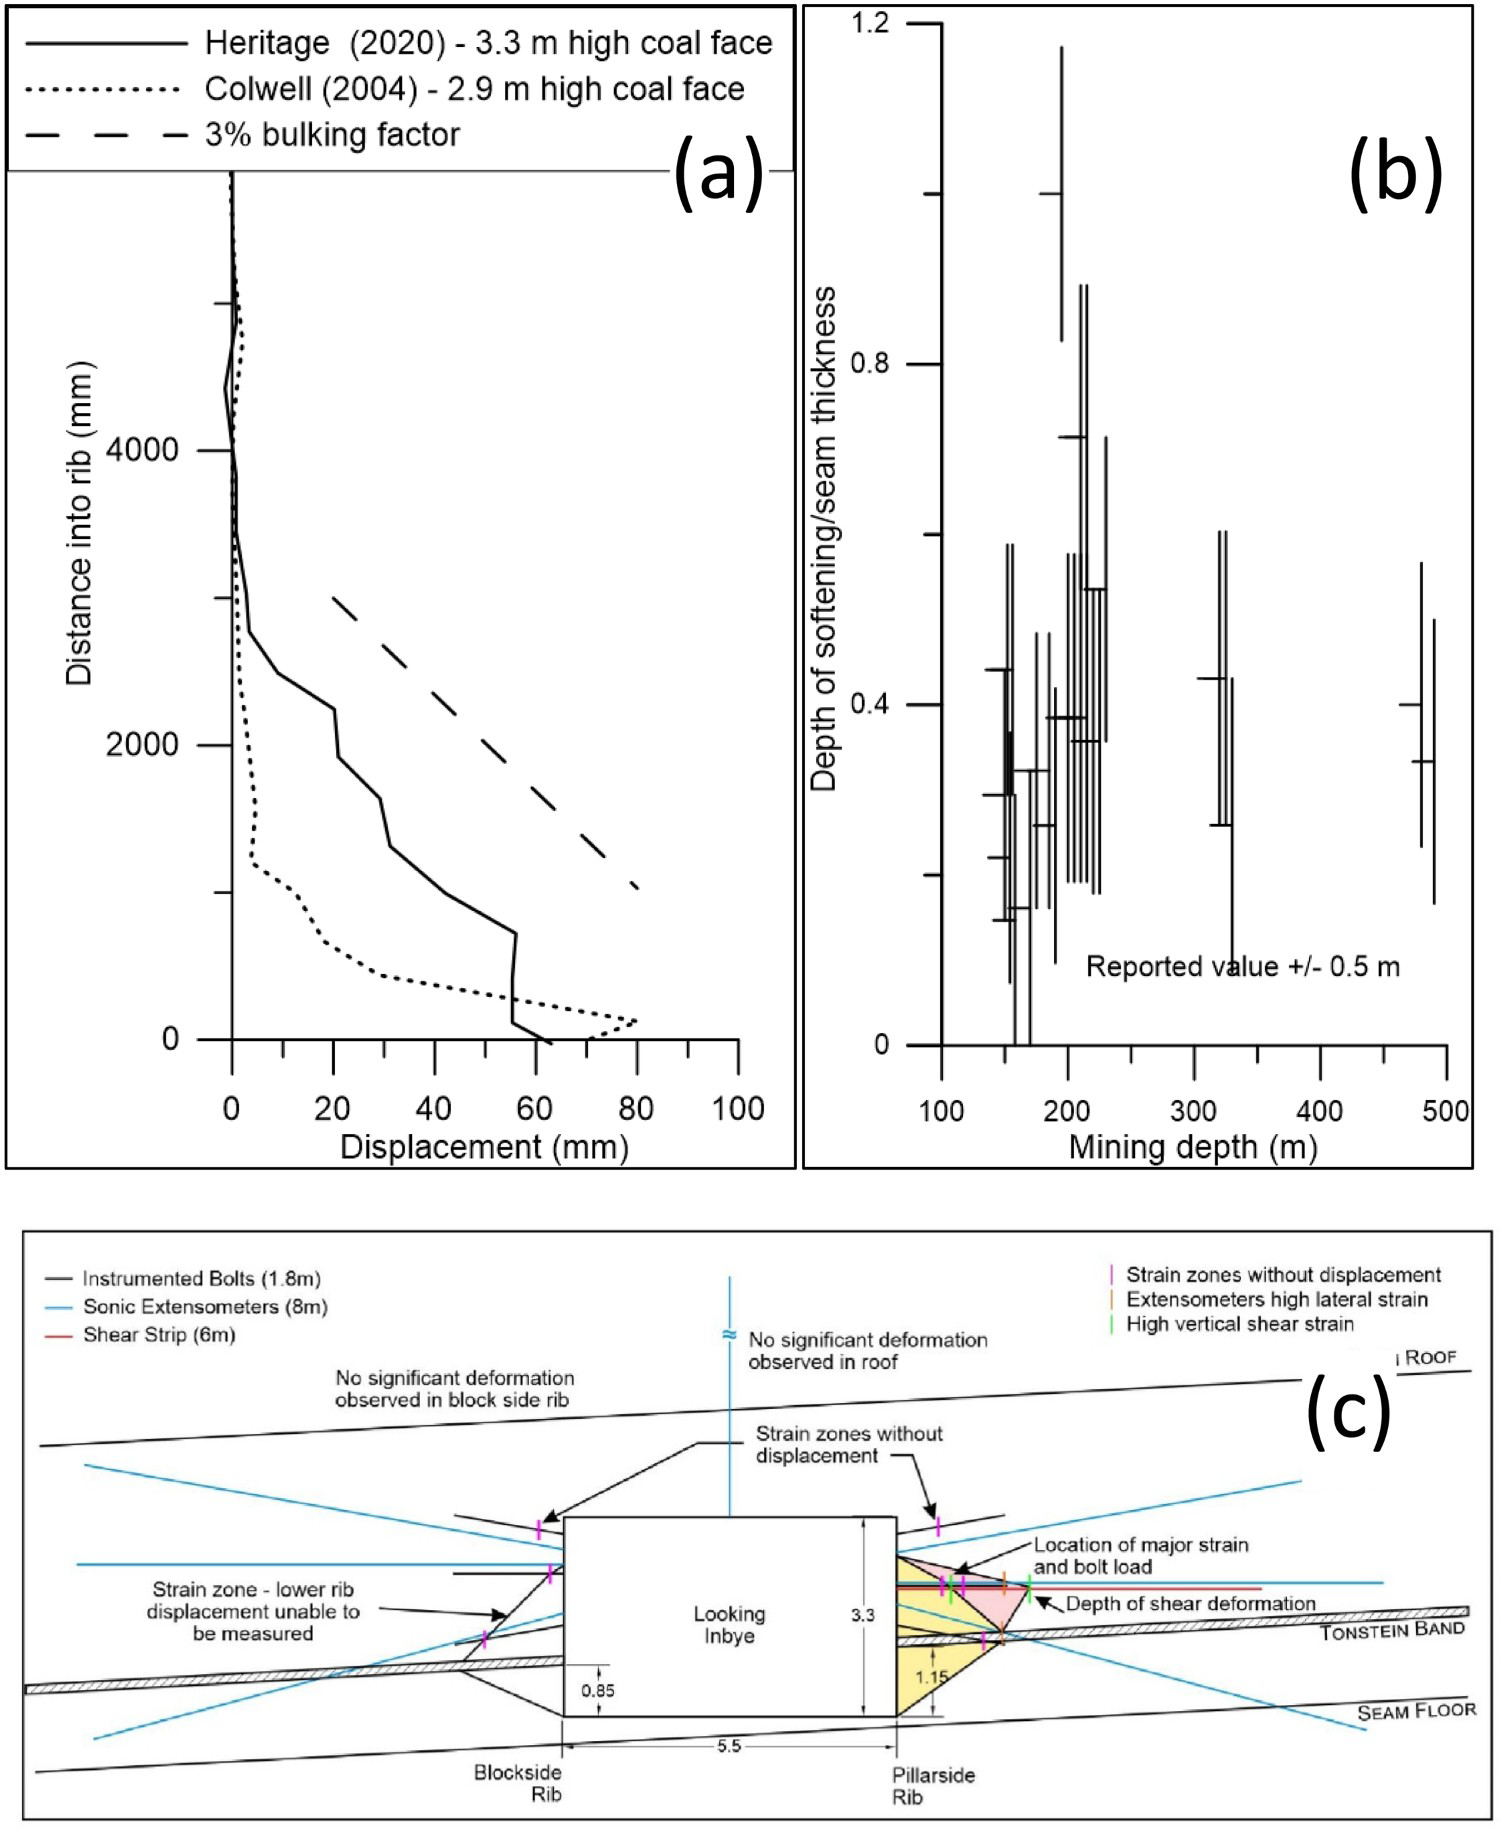
Pillar collapse
There are at least 3 international datasets of collapsed pillars of which the South African set for square pillars (Van Der Merwe and Mathey 2013b) is considered the most robust. This data set includes only those collapses where there is reasonable certainty that the pillars themselves had failed and not the roof or the floor. Data on pillar collapse is restricted to cases where the pillar width (w) to pillar height (h) ratio lies between 0.9 and 4.3, with a median value of 2.05 and quartiles of 1.45 and 2.90. There are ongoing interpretations of this database to produce a suitable pillar strength equation to use in mine design. Depending on the statistical method used two equations have been published, (Van Der Merwe and Mathey 2013b). Another pillar strength equation (Bieniawksi 1992) is widely used for longwalls and whilst it was developed for square pillars there is a modification for use with rectangular coal pillars (Mark 1999):

Experience with the application of the various strength equations has led to the recognition that extrapolation is, as always, dangerous. In South Africa, it is recommended that when using their strength equation for w/h less than 2.0 a higher factor of safety should be used (Madden and Hardman 1992). The use of narrow pillars with strength factors greater than 1 but with a width/height ratio less than 1.5 has been associated with collapse of highwall mining pillars (Hill 2005).
Estimates of the strength of a coal mass
Laboratory testing
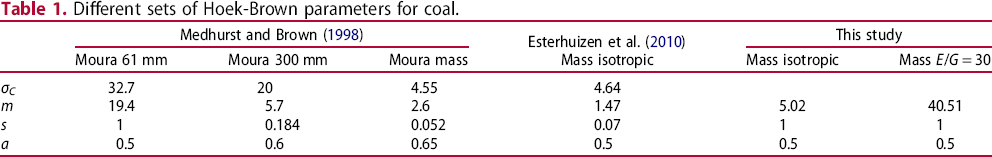
For Australian coals, the uniaxial compressive strength (UCS) ranges from 10 MPa for bright coal to 33 MPa for dull coals, for South African coal the range is 24–40 MPa and in the USA the reported range is 5–34 MPa (Bertuzzi et al. 2016). The strength of the enclosing roof and floor rocks is typically 20–50 MPa for mudstones, and 60–80 MPa for sandstones, although there can also be thin low strength layers (UCS < 10 MPa). Medhurst and Brown (1998) report Young's Modulus (E) values of 4.3 GPa and Poisson's Ratio (ν) values of 0.27 for 61 mm diameter sample of a mid-brightness coal. They also report Hoek-Brown strength parameters for 61 and 300 mm diameter samples (Table 1, Figure 5).
Strength envelopes for coal and coal pillars derived from laboratory tests and the back analysis of pillar failures assuming either isotropic or transversely isotropic conditions. ‘Images are available in colour online.’ Different sets of Hoek-Brown parameters for coal.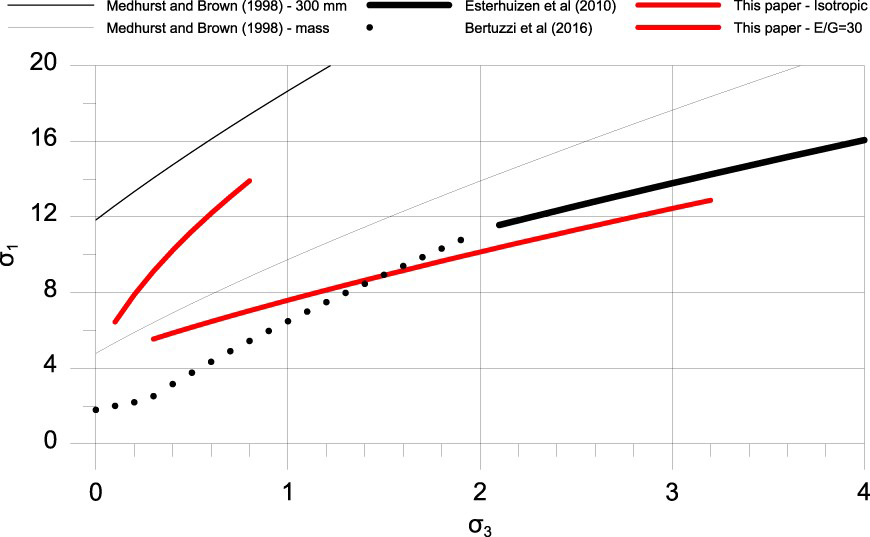
Inferred mass strength
Based on their extensive triaxial testing, Medhurst and Brown (1998) report an estimate of the mass strength of coal (Table 1, Figure 5). Referring to Figure 1, this mass strength is equivalent to a large scale ‘intact’ strength and not necessarily a ‘representative in situ’ value as it does not include the impact of the persistent cleat and particularly bedding partings.
Hoek-Brown strength parameters have been developed by assessing the Bieniawski pillar design equation for square pillars over a w/h range of 2–8 (Table 1, Figure 5) as well as matching some field monitoring data (Esterhuizen et al. 2010). Their back analysis was conducted in 3 dimensions and assumed the coal was isotropic. A satisfactory match to the pillar failure database and the observed depths of yield and stress gradients was claimed. Bertuzzi et al. (2016) adopted these parameters for shear failure of coal at high stresses and added brittle failure parameters at the low stress range using the values recommended for strong rock masses; the adopted spalling limit (major to minor principal stress ratio) value of 7–10 does not compare well with measured values for coal (Buzzi et al. 2014; Kim et al. 2020).
Analysis
Modelling the role of the bedding partings in coal
The constitutive models adopted for the analysis of stresses and strengths of bedded coal and rock masses should include consideration of transverse isotropy. Bedded coal and rock masses can be modelled as an equivalent continuum by adjusting the shear modulus (Seedsman 2018). The Young's Modulus/shear modulus ratio (E/G) is a convenient metric for a transversely isotropic continuum and can be readily implemented in numerical analyses. An E/G of 30 value has been found to adequately match the available data on pillar behaviour – this value has been determined by back-analysis (Seedsman 2017). A later section of this paper discusses the current limitations in estimating the E/G metric from engineering geology knowledge. By definition, the E/G ratio for an isotropic material is 2.6 for a Poisson's Ratio of 0.30. In this paper, a further simplifying assumption that the coal mass can be considered to be homogeneous allows the use of a boundary element code to determine the stress field around an excavation (Examine2D has been used). For an inhomogeneous layered coal mass, a volume method such as finite elements could be required.
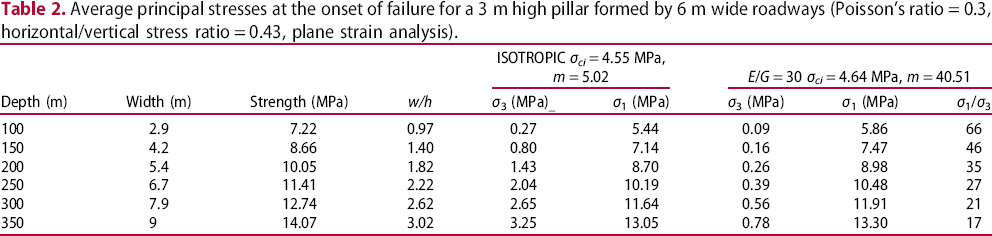
Compared to the common isotropic assumption, adopting transverse isotropy results in a large difference in the way in which stresses are redistributed close to an excavation boundary and hence in a small pillar between two excavations (Figure 6). At the centre of the pillar being considered, the minor principal stress is 0.53 MPa for the transverse isotropic case with an E/G = 30 (Figure 6(a)) compared to 3.21 MPa for the isotropic case (Figure 6(b)). Whilst there is little difference in the magnitude of the major principal stress averaged across the pillar there is at least a doubling at the excavation boundaries when compared to an isotropic assumption (Figure 6(c)). Figure 6(d) shows how some of these stress parameters vary with the E/G ratio; the decreases in the minor principal stresses are pronounced for E/G ratios less than 30, compared to progressive increases in the peak major principal stress with increasing E/G ratios.
Distribution of σ3 in a 6.7 m wide pillar for (a) a material with a E/G ratio of 30 compared to (b) a isotropic material; (c) the distribution of the differential stress and stress ratio across a 6.7 m wide pillar for isotropic and E/G = 30 cases; (d) variation in a number of stress parameters with the E/G ratio. ‘Images are available in colour online.’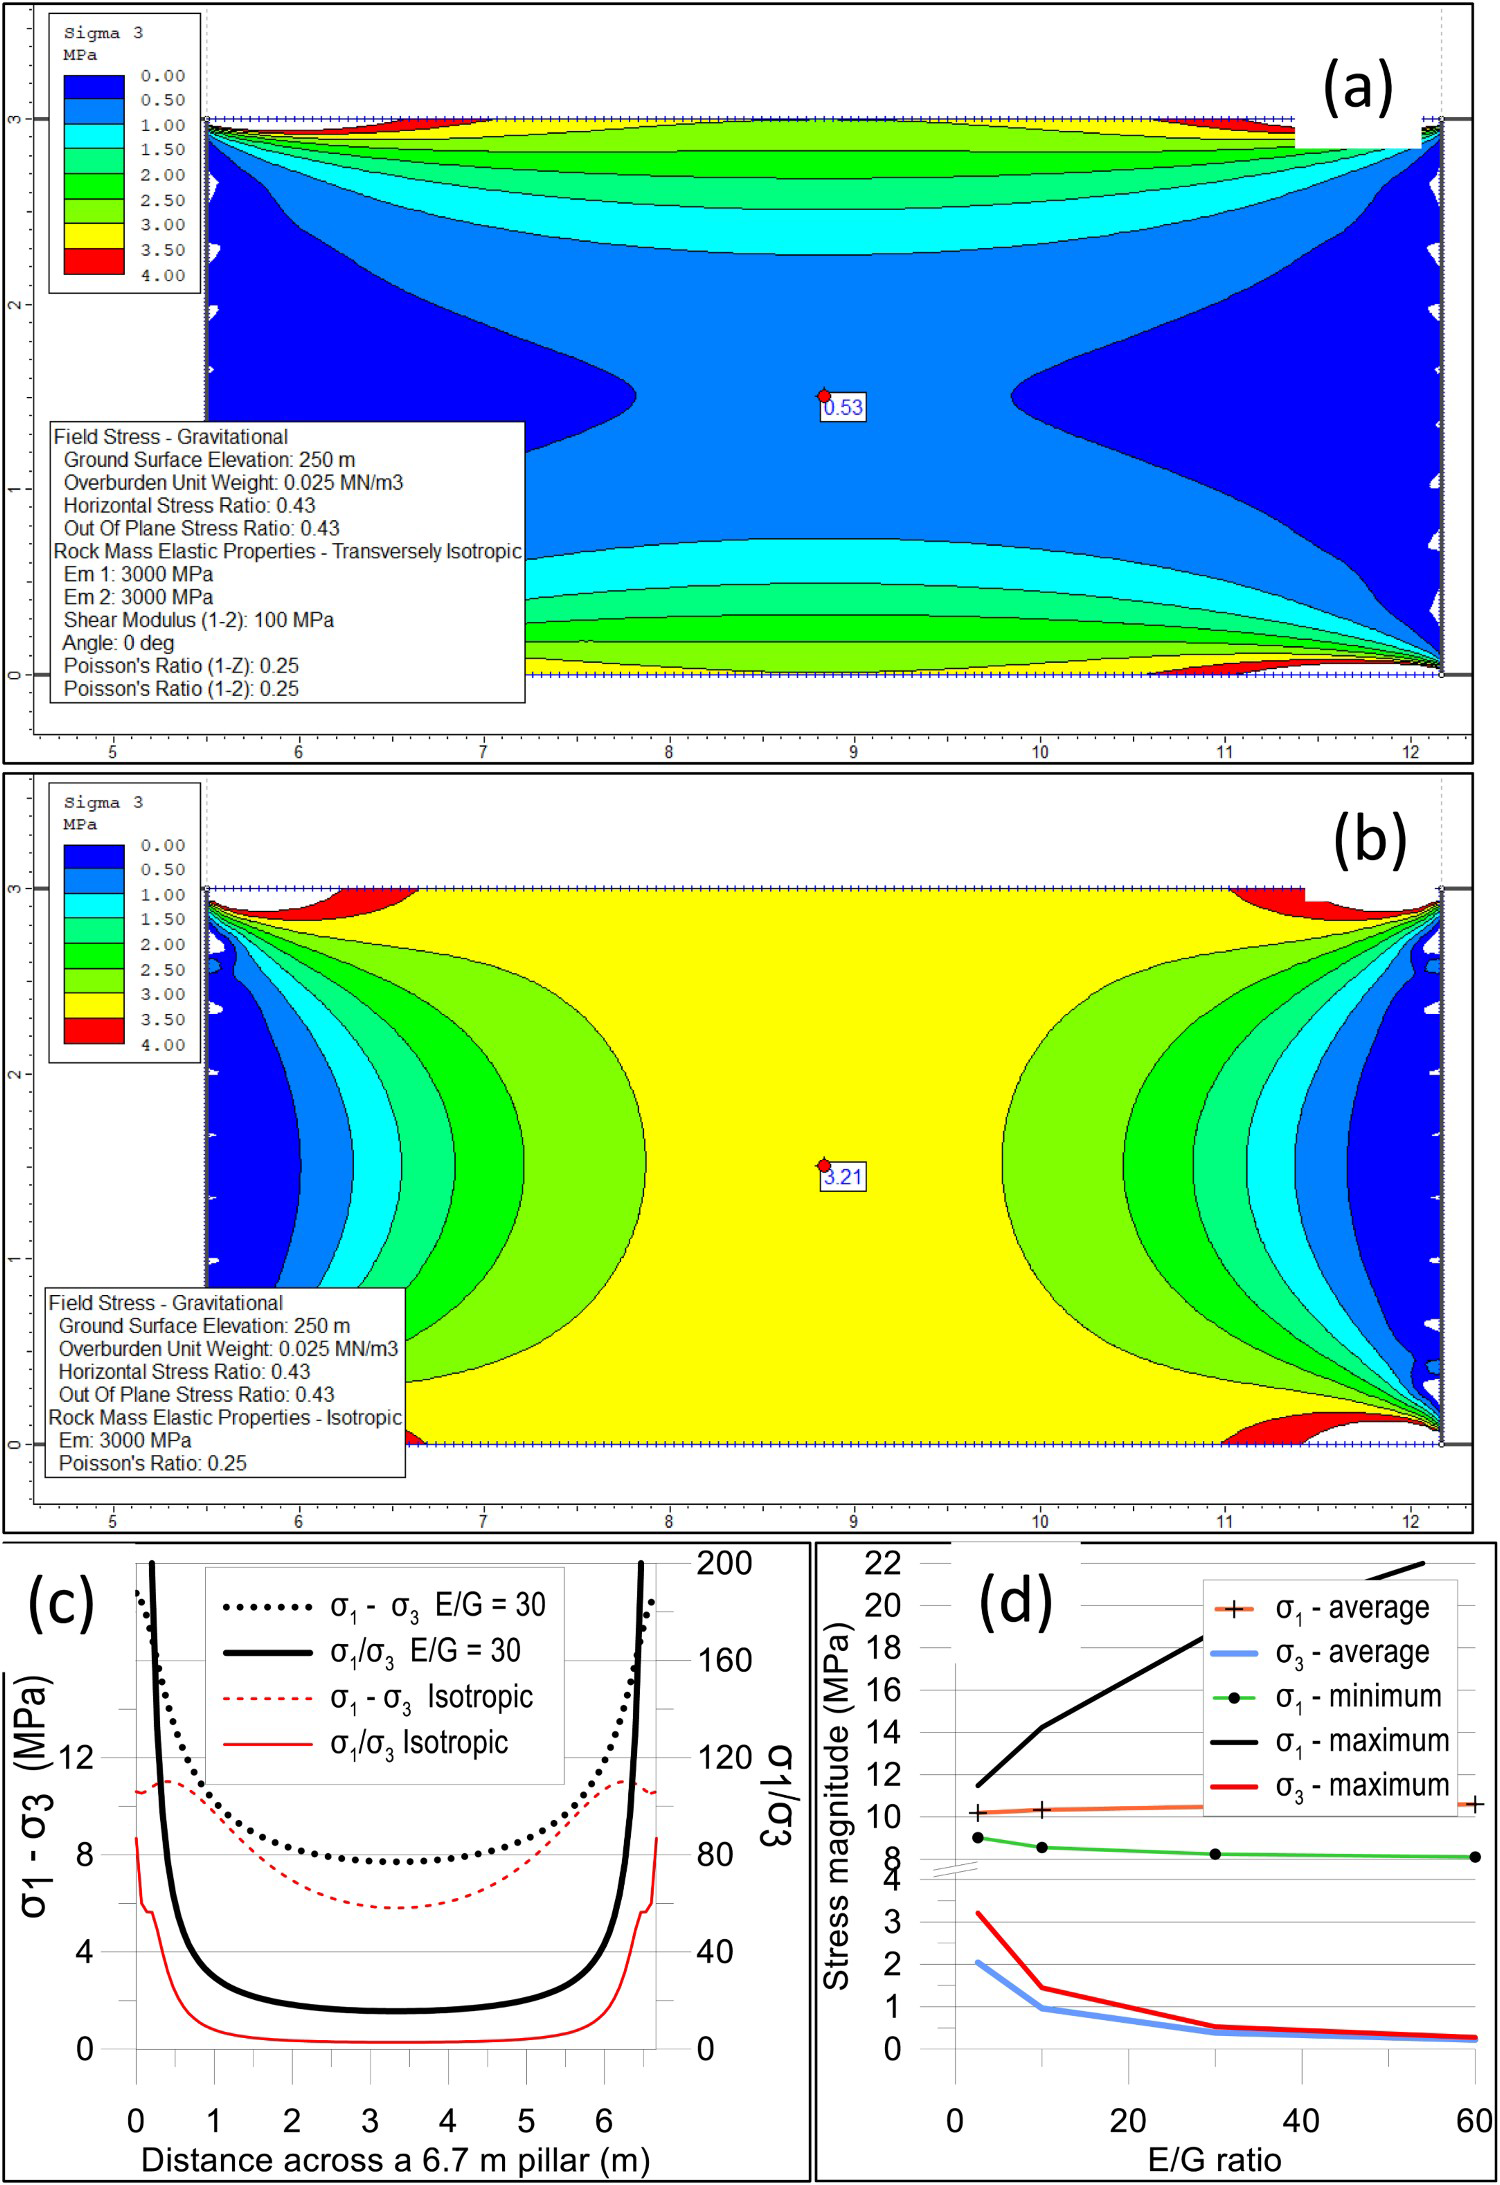
Excavation boundary
An interpretation of the available data is that the spalling or scaling depth relative to the pillar height tends to a maximum value independent of the mining depth of about 0.2 for roadways in non-caving layouts and about 0.4 in caving layouts. This suggests that the failure of the coal near the excavation boundary is controlled more by a frictional relationship than by a cohesive strength factor. Observations of excavation boundaries have indicated that sedimentary rock masses behave in a brittle manner (Martin et al. 1999) and to model this there is a need to separate considerations of cohesion from friction. These observations have since been developed into the ‘S-shaped criterion’ (Kaiser and Kim 2015) and discussed extensively by Kaiser (2019). Referring to Figure 7, the cohesive component is considered in terms of the uniaxial compressive strength (UCS) relative to the deviatoric stress (referred to as damage initiation) and the frictional component is considered in terms of the major to minor stress ratio (referred to as the spalling limit).
Transversely isotropic brittle strength critieria for excavations in coal (inner shell) and coal pillars (outer shell). ‘Images are available in colour online.’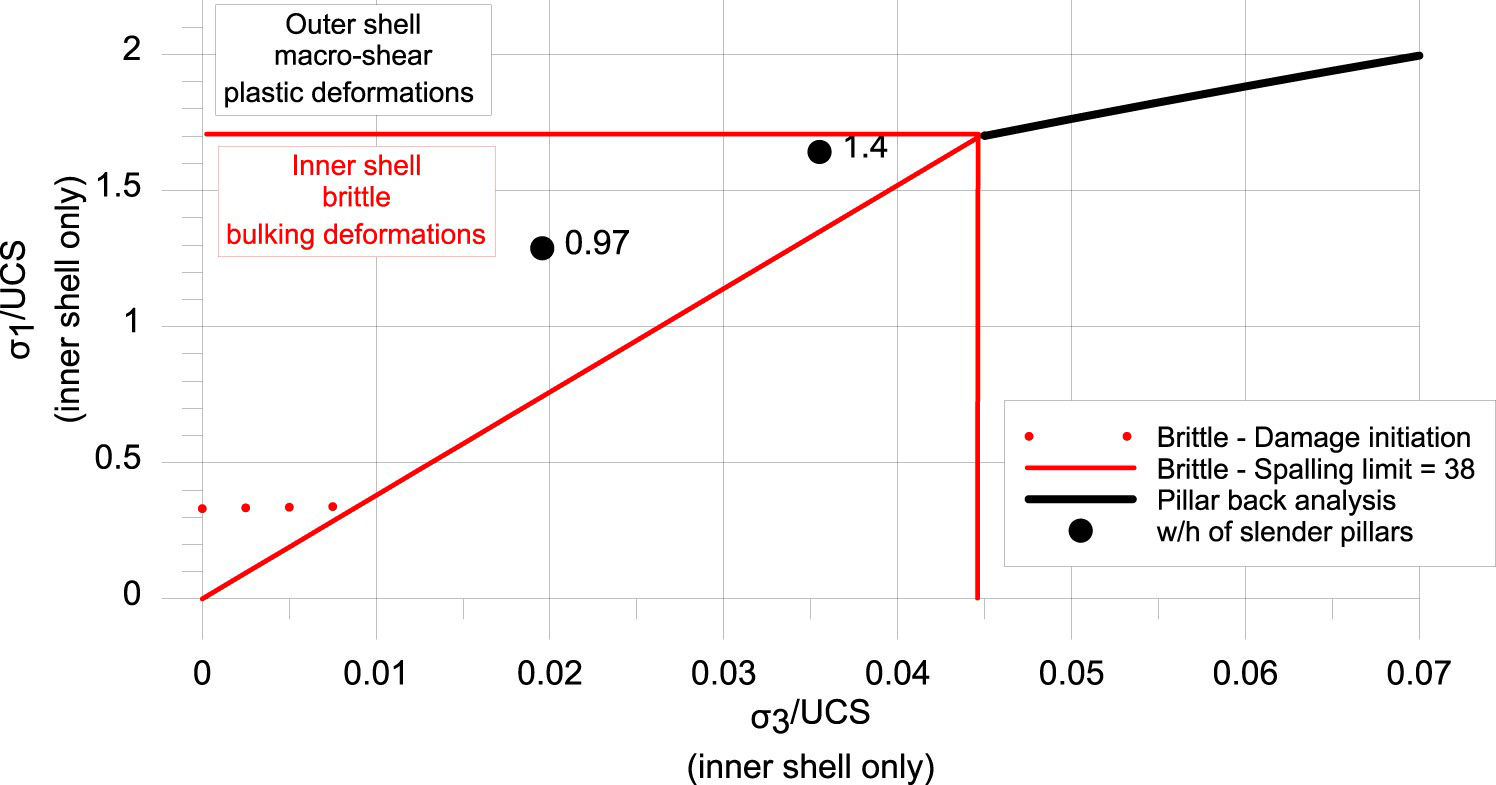
Figure 6(c) shows that the adoption of transverse isotropy results in much lower minor principal stresses, higher deviatoric stresses, and larger principal stress ratios across a pillar when compared to an isotropic assumption. Except for very low mining depths or high strength coals the damage initiation of UCS/3 will be exceeded in most underground coal mines such that the depth of rib failure is determined by the adopted spalling limit.
The shape of a failure zone in the sides of a rectangular roadway defined by a constant principal stress ratio is parabolic (left side of Figure 8(a,b)) and the depth of the failure is a function of the adopted spalling limit value and the E/G ratio. For a depth of 0.2 times the roadway height, a data pair of E/G of 30 and a spalling limit of 36 for the spalling limit applies. Seedsman (2017) adopted a value of 38 based on laboratory studies by Buzzi et al. (2014). Subsequently, other researchers have reported spalling limits for coal of 29, 40, and 41–57 (Kim et al. 2020). A spalling limit of 38 has been adopted in the following discussion.
Contours of a strength factor for the stress ratio relative to a spalling limit of 38 considering (a) transversely isotropic and (b) isotropic materials for rectangular and parabolic shaped excavations; (c) the combination of E/G ratio and spalling limit values to give the same relative depths of failures. ‘Images are available in colour online.’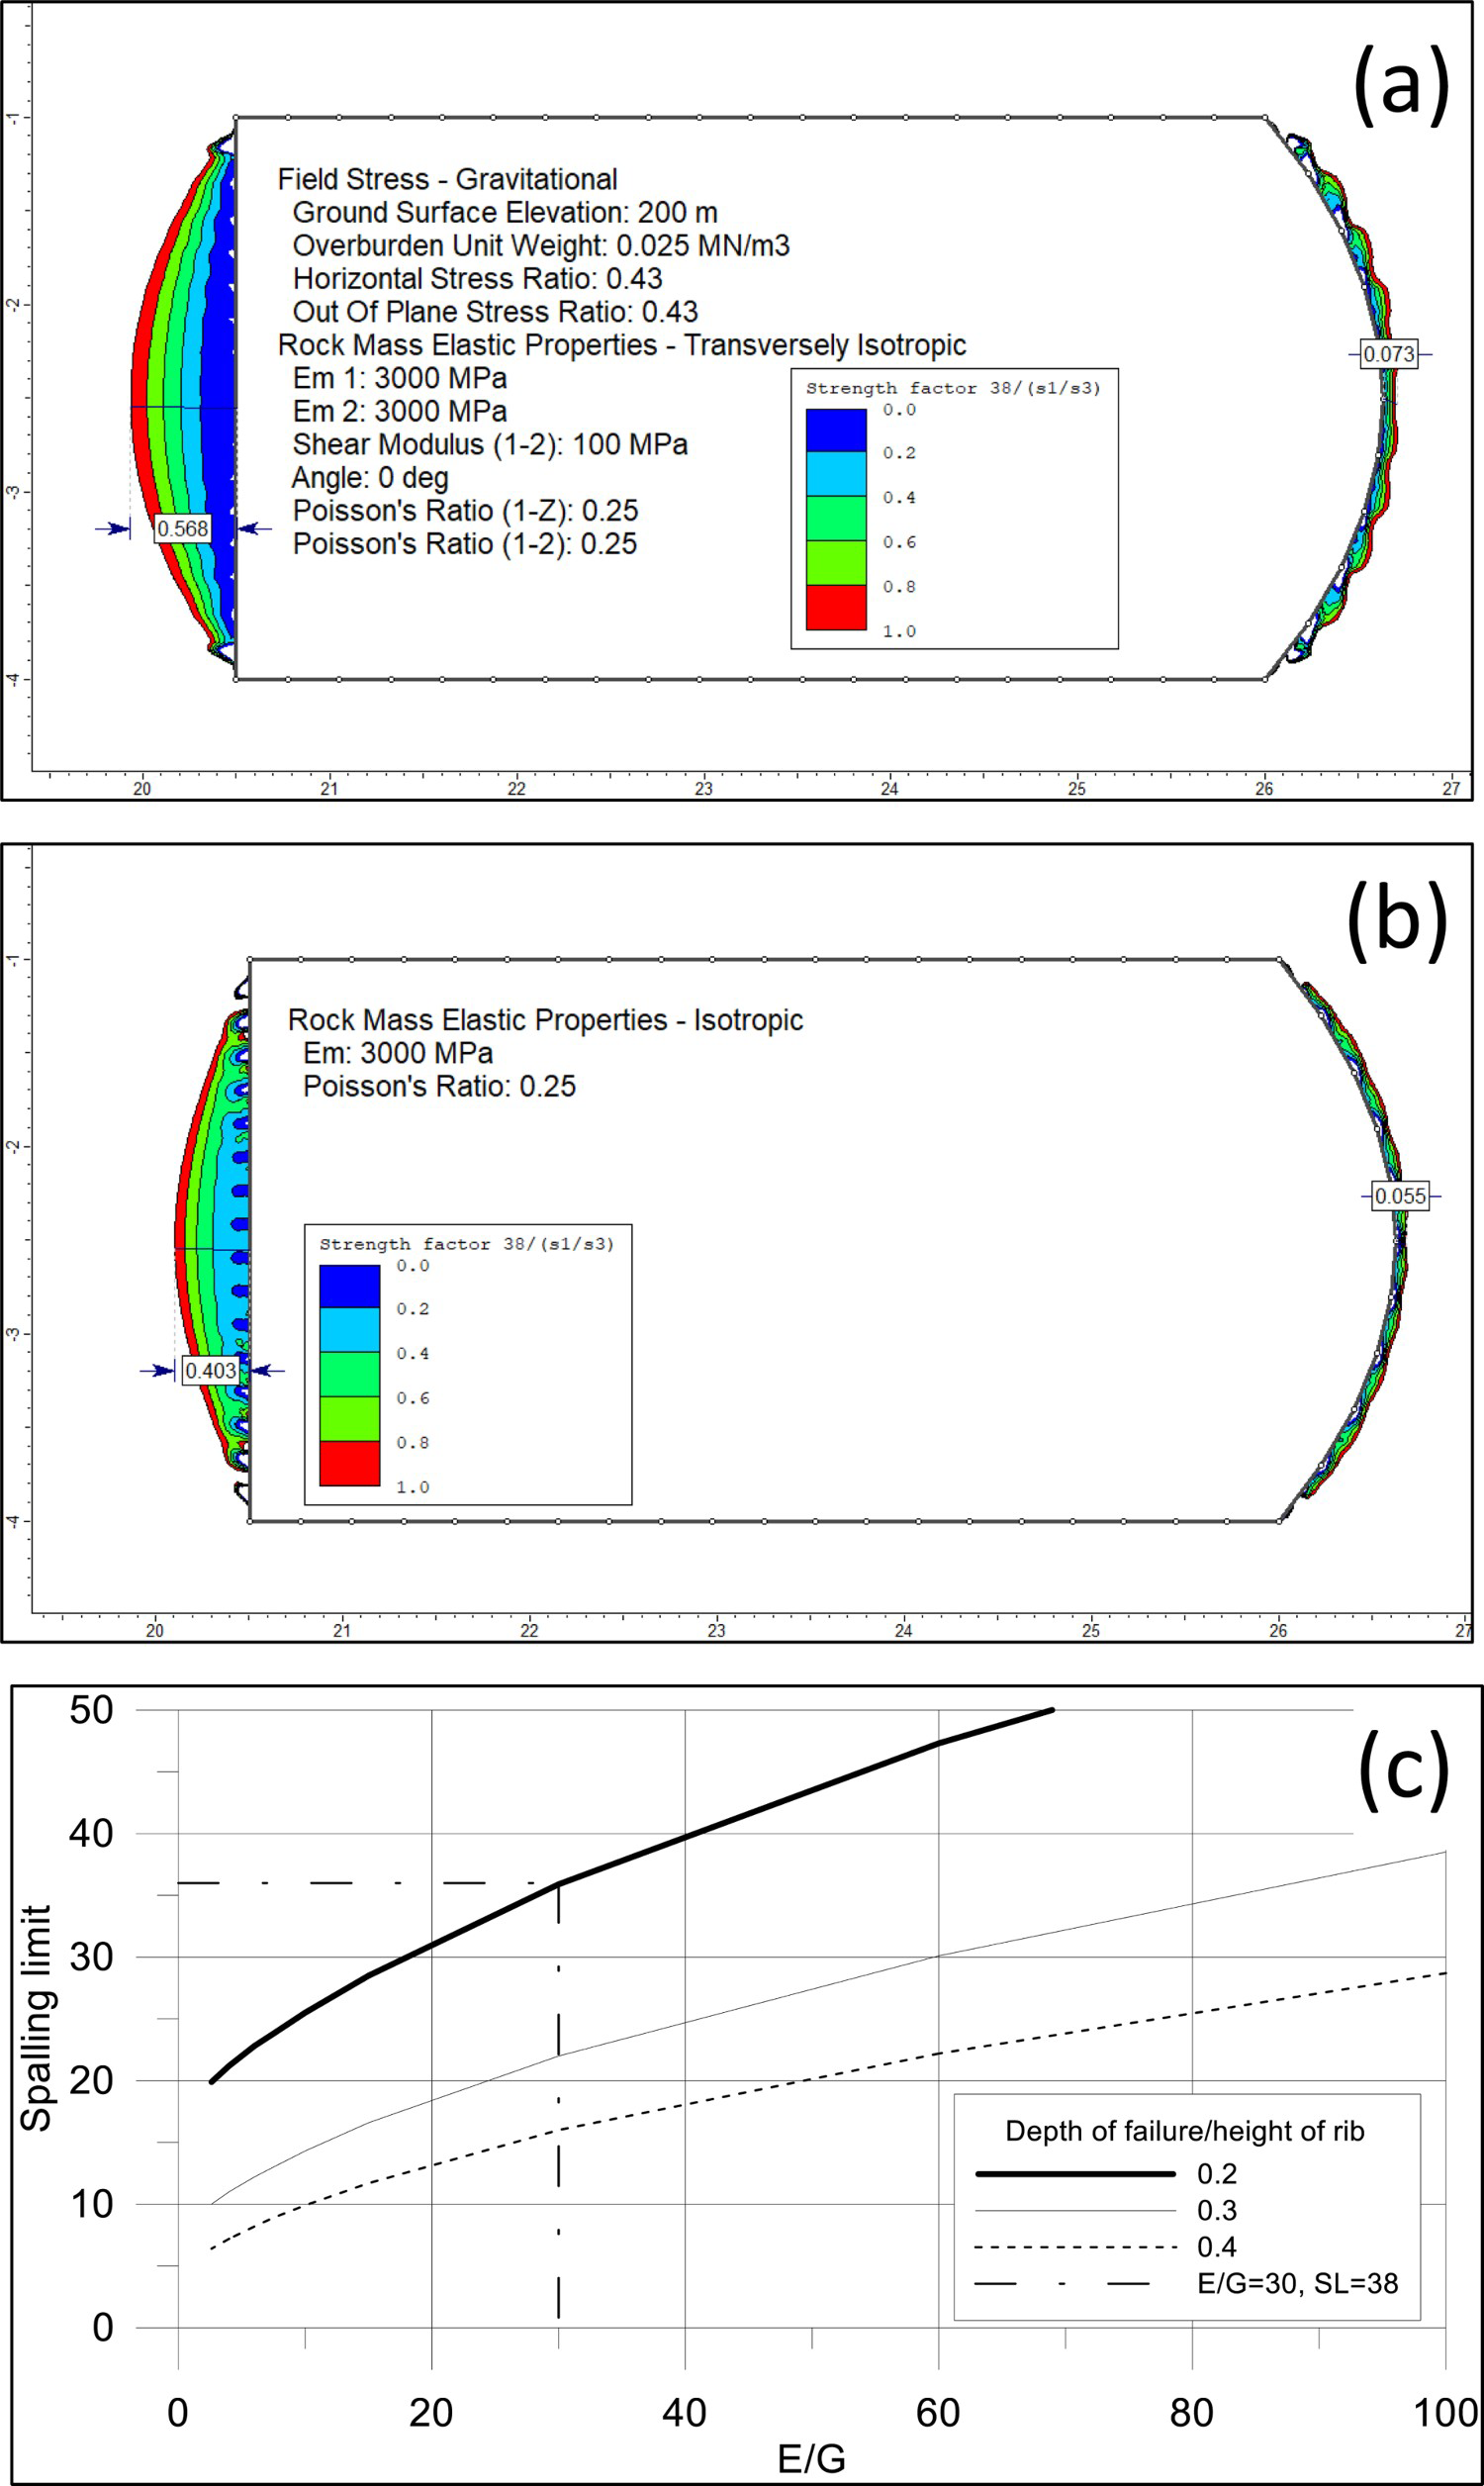
The parabolic shape of the brittle failure zone based on a spalling limit of 38 is consistent with the pillar scaling reported from South African mines. If the side of the excavation is modified to reflect the parabolic shape of the predicted brittle failure the extent of subsequent brittle failure is much reduced. For an E/G = 30 case the depth of failure reduces from 0.57 to 0.07 m and for the isotropic case the depth of failure reduces from 0.40 to 0.06 m (right-hand side of Figure 8(a,b)).
Mass strength
Average principal stresses at the onset of failure for a 3 m high pillar formed by 6 m wide roadways (Poisson's ratio = 0.3, horizontal/vertical stress ratio = 0.43, plane strain analysis).
The resulting parameters for the isotropic case differ from those of Esterhuizen et al. (2010) mainly due to the adoption of an s value of 1.0 (Table 1) but the strength envelopes are similar (Figure 5) suggesting that this 2D approach is valid and allows a comparison with a transversely anisotropic analysis. The strength envelope for the E/G = 30 assumption plots in a similar location for low σ 3 values but increases more rapidly than the isotopic cases as the σ 3 increases.
Discussion
A strength criterion for bedded coal
The strength envelope for a transversely isotropic coal with an E/G ratio of 30 combines damage initiation, spalling limit, and macro shear strength parameters (Figure 7). This strength envelope differs substantially from those of other researchers (Figure 5) for two main reasons – the adoption of transverse isotropy and a spalling limit based on laboratory testing of coal. Adopting the terminology of Kaiser (2019), this strength criterion is applicable for the inner shell where failure is brittle; the macro shear properties apply to the outer shell and here the resulting deformations may be plastic.
It is important to note that the extensometer data used in the analysis is drawn from roadways located about 30–40 m distant from the longwall caving such that the vertical stress change is relatively small – less than 4 MPa (Colwell 2004). Greater depths of failure, possibly within the outer shell, could be recorded in excavations closer to the caving zone for which there is no data at this time. It is also important to note that failure in the ribs may be induced on low strength non-coal layers – for example the clay horizons such as seen in Figures 1 and 4(c).
Scaling and pillars
The concentration of the major principal stress (vertical) near the excavation boundary in transversely isotropic coal means that the damage initiation threshold is readily exceeded. An implication of this is that, except at very low stresses in strong coal, there will be spalling of all coal ribs and consequent scaling if the ribs are unsupported. If scaling does develop, the resulting effective shape of the excavation means that failure may not progress (compare the left- and right-hand sides of the excavation in Figure 8).
Figure 7 includes values for average stress pairs for narrow pillars with w/h ratios of 0.97 and 1.47. It can be seen that they lie above the adopted spalling limit as the stress ratios are in excess of 38 (see also Table 2). The interpretation of this is that such pillars would fail due to the spalling/scaling behaviour. This is consistent with the reported collapse of pillars with a w/h ratio of less than 2.0.
Since the reported scaling can be explained by a stress/strength analysis, it is suggested that scaling is not a time-dependent phenomenon related to loss of coal strength – this differs from the Van Der Merwe (2016) interpretation. It is possible that the reported scaling rates relate to delays in the subsequent collapse of ribs that underwent brittle failure when they were first formed. It is also possible that there could be deeper spalling and scaling in more bedded coals that have higher E/G ratios.
The rib collapse and coal burst hazards
In terms of workplace safety, it is suggested that the rib hazard relates to how the coal fractures subsequent to brittle failure. As discussed above and shown in Figure 8 the onset of brittle failure results in an effective opening shape such that the stress concentrations are more benign.
In situations where rib failure develops progressively as the mining face is advanced, thin slabs may form (Figure 2(a,c)) or the ribs may be better described as rubble – these conditions are shown diagrammatically in Figure 9. The slabs on the left-hand side of the roadway present a greater workplace hazard as they may topple into the roadway. The ribs on the right-hand side present a different and possibly lesser hazard related to how a small talus slope develops at the base of the rib. Both ribs have the same hazard associated with a potential overhang near the roof line. An important corollary of this interpretation is that flat ribs standing vertically may present a greater workplace hazard that must be supported or removed.
Rib hazards in a deep mine after the onset of brittle failure including a toppling hazard if slabs develop and an overhang near the roof line. ‘Images are available in colour online.’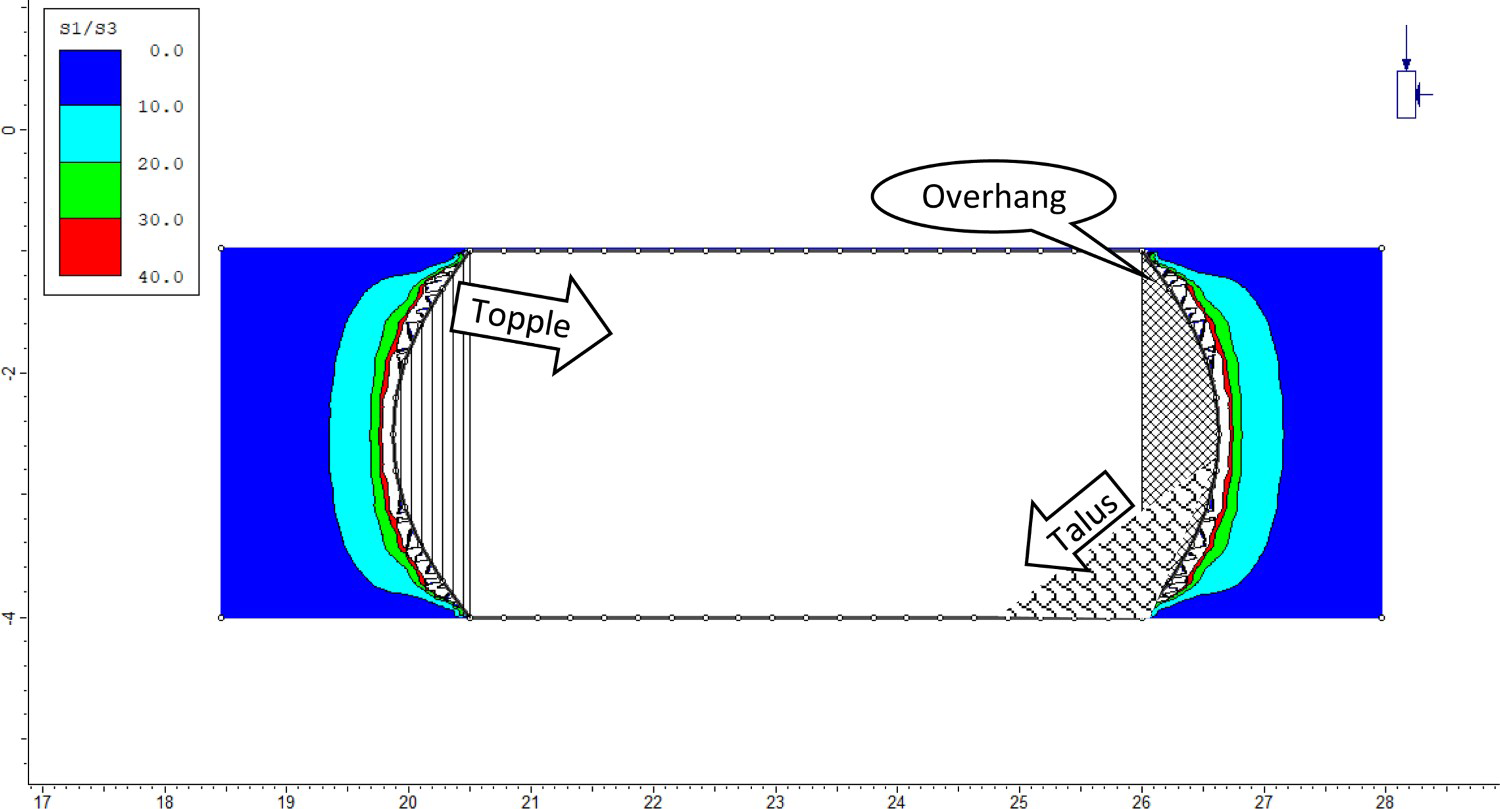
For coal bursts, the collapse of the rib is associated with the rapid (almost instantaneous?) onset of brittle failure. This rapid onset of failure is usually proposed to be associated with stored stain energy but it may also be related to delayed development of the vertical stress regime (Seedsman 2017). The bedded and cross jointed nature of the enclosing rock mass may provide circumstances whereby the rock temporarily arches across the mining face. This arching may be greater in the presence of thickly bedded or massive units which tend to have much wider spaced cross joints (Price and Cosgrove 1990). The topping and rubble hazard in Figure 9 are compounded by the addition of a horizontally-directed acceleration associated with the bulking of the rib unless there is a retain/hold support regime in place.
Predicting and calibrating to deformations
The strength criterion has been developed based on the interpretation of failure/collapse – either the shape of scaled pillars or pillar collapse. Stresses developed in the yield zone of pillars could not be used because of the adoption of transverse isotropy. Neither of these collapse modes provide acceptable strategies for validation in a routine mining operation and ongoing confirmation will need to be based on deformation monitoring and extensometry. Based on the extensometry data reviewed earlier, the deformation of a supported rib can be estimated by applying a 3% bulking factor to the predicted depth of failure.
Inspection of the extensometry (Figure 4) suggests that there is no discernible movement beyond the brittle failure zone. This implies that either the coal is behaving with a much lower E/G ratio (approaching isotropic) or that the deformations associated with the relatively low stress change are below the resolution of the instrumentation. Data on the displacements of heavily loaded excavations such as the belt road or tailgate in a longwall operation would be particularly useful in validating the proposed criterion.
Deriving the shear modulus from engineering geology knowledge
The E/G ratio of 30 used in this work was obtained by back analysis after adopting a spalling limit value for coal. Recognising the significance of the adoption of transverse isotropy in numerical analyses, there is a need to consider how it can be used in mine design and this requires consideration of how it can be related to engineering geological conditions.
The E/G ratio of an equivalent anisotropic continuum can be estimated from a knowledge of the spacing (S) of the discontinuities (Brady and Brown 2006) assuming that the discontinuity remains elastic, the layers themselves are isotropic with a deformation modulus (E), and the shear stiffness (Ks) is independent of normal stress:

The Bandis et al. (1983) data on shear stiffness is primarily for joints and not bedding partings and is limited to conditions where the normal stress is less than 2.0 MPa. Their data shows that shear stiffness is strongly dependent on normal stress and joint length and close inspection of the data for joints in sandstones suggests that there is a hyperbolic relationship between shear stiffness and normal stress (Figure 10). Their empirical model for shear stiffness invokes an approximately linear relationship with increasing normal stress which is possibly adequate over the data range but results in a major overestimation compared to the hyperbolic relationship when extrapolated to higher normal stresses.
Comparison between shear stiffness for joints in sandstone as reported by Bandis et al. (1983) and data on bedding partings for shale and sandstone reported by Bertuzzi (2016) and Bastola and Chugh (2015); a plot of Equation (3) is also included.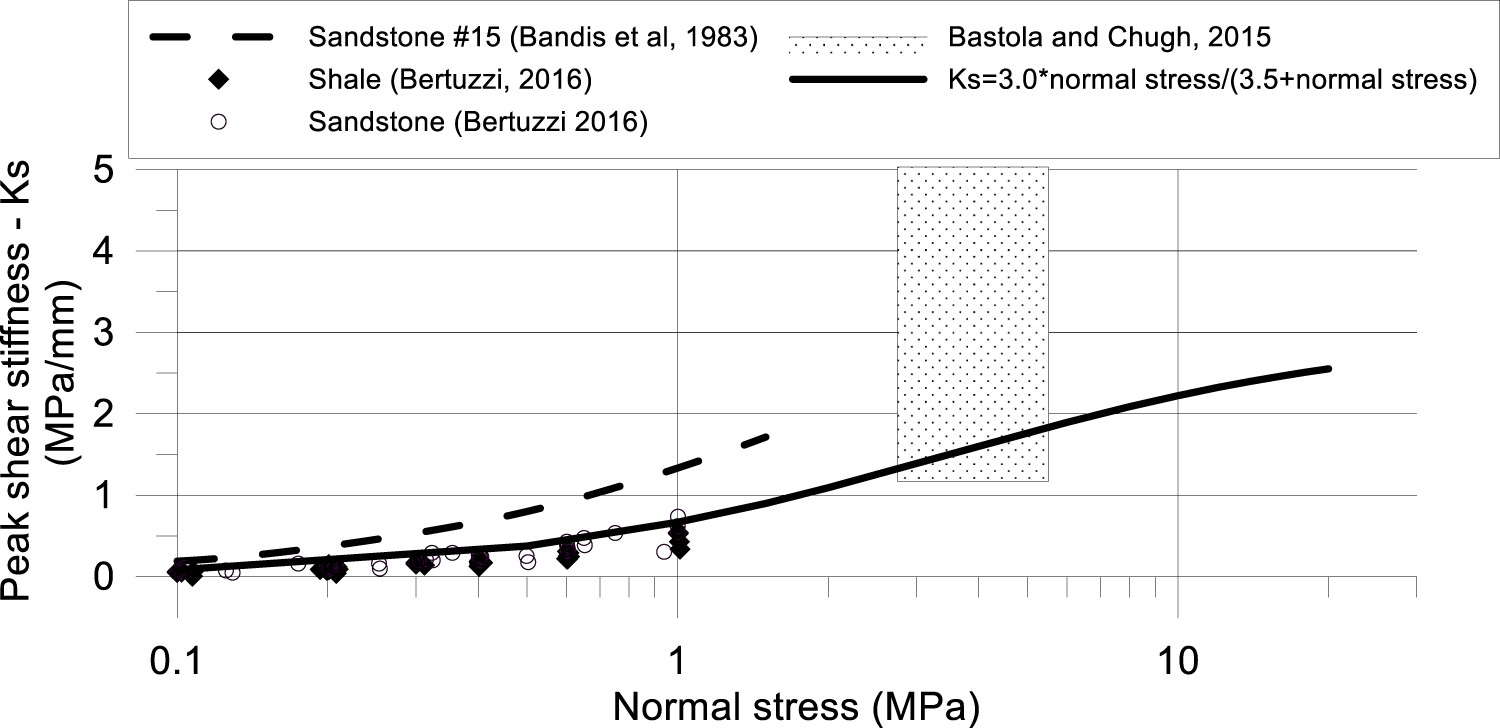
The normal stresses applied in the laboratory tests are low compared to those that can develop in coal pillars – possibly up to 12 MPa for pillars at 300 m depth. No experimental data has been found on shear stiffness of joints or bedding partings at very high normal loads. Bastola and Chugh (2015) report values ranging between 0.9 and 5.0 MPa/mm for normal stresses between 2.75 and 5.51 MPa with JRC values between 2 and 12 – UCS values are not given. Bertuzzi (2016) provides data for normal stresses less than 1 MPa for bedding partings in sandstone and shale (Figure 10). Bertuzzi (2014) describes bedding surfaces as rough (JRC of 1–4) and allocates UCS values of 25–30 MPa. In Figure 10, it can be seen that stiffness values for bedding partings are less than for joints in sandstone but the test range is not sufficient to indicate if a hyperbolic relationship applies.
Many of the partings in coal are related to thin layers of clay/mud introduced into the peat swamp during formation. Based on the information in Figure 10 and accepting the inherent dangers of extrapolation an appropriate hyperbolic relationship may be:
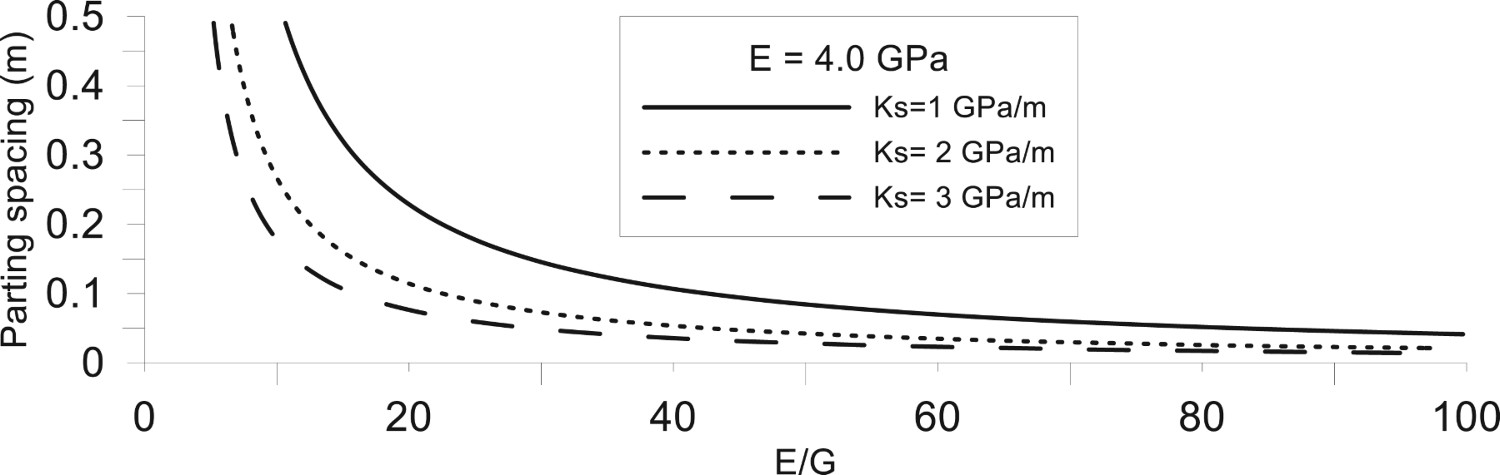
Relationship between E/G ratio for coal with a modulus of 4 GPa and the spacing of bedding partings for three values of shear stiffness.
Conclusion
The observed spalling and scaling of the sides of excavations in coal seams can be produced in a numerical stress model if the seam is treated as bedded and hence transversely isotropic and the coal is considered to fail in a brittle manner. Hazards associated with the sides of rectangular excavation can be considered in terms of how the ribs subsequently collapse after failure.
One corollary of proposed strength criteria is that pillar scaling results from overstressing at the excavation boundary and is not a time-dependent weathering feature of coal. Spalling provides an explanation for the failure of pillars and it is suggested that the use of empirically-derived strength equations should be reviewed for w/h ratios less than 1.5.
Footnotes
Disclosure statement
No potential conflict of interest was reported by the author(s).