
Abstract

A useful addition to the single-cell analysis repertoire would be the ability to image the location of specific genes.
Mazhar Adli, Ph.D., and colleagues at the University of Virginia recently succeeded in fluorescent labelling of different genomic areas using the RNA-guided CRISPR-Cas9 gene-editing tool.
“What this live cell imaging allows us to do is to look at a single living cell, and see what is the position of a particular gene in three dimensional nuclear space,” explained Dr. Adli.
“For example, we can track two separate genes or genomic regions that we know have different expressional status… when we look at the expressed ones they are in the nucleus and they are moving much faster than the non-expressed genes on the periphery of the nucleus.”
While other groups have used CRISPR technology to label chromosomal locations before now, these have always been at highly repetitive areas such as centromeric or telomeric regions. This is the first time this technique has successfully labelled non-repetitive regions.
“With CRISPR we can target this to anywhere in the genome,” Dr. Adli told Clinical Omics. “We can target expressed genes and non-expressed genes; we can target intergenic regions that don’t code for anything. That gives us the opportunity to look anywhere in the genome that we want.”
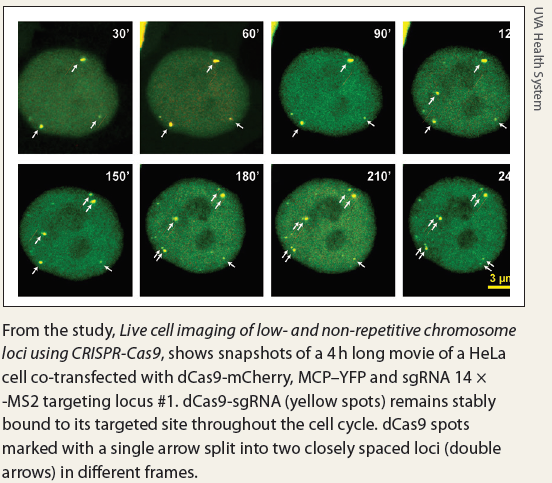
From the study, Live cell imaging of low- and non-repetitive chromosome loci using CRISPR-Cas9, shows snapshots of a 4 h long movie of a HeLa cell co-transfected with dCas9-mCherry, MCP–YFP and sgRNA 14 × -MS2 targeting locus #1. dCas9-sgRNA (yellow spots) remains stably bound to its targeted site throughout the cell cycle. dCas9 spots marked with a single arrow split into two closely spaced loci (double arrows) in different frames.
UVA Health System
Dr. Adli and his team are using the new technique they have developed to track the location of enhancer elements that regulate gene expression, but are not necessarily located near the gene they have influence over.
He explained: “We know that they regulate the expression level of the gene. What we don’t know is exactly how do they work? Are they always together for example? Do they come together once in a while? Are they coming together just once in a week or once in a day? How dynamically are they interacting with each other? We don’t get this kind of information from this population analysis, but when we label with multicolor then we can study this dynamic information.”
While this type of fluorescent labeling technique has wider implications, it could be a useful tool for cancer researchers.
“What we think it will allow us to do in cancer cells is that we can compare a malignant cell to a normal cell in terms of the location of the particular gene, in terms of how dynamically this particular gene is moving around inside the nucleus,” said Dr. Adli.
“Then, if you do the multicolor labeling, we can look at regulatory enhancer elements. For example, we can label them to see that in normal cells an enhancer element is not interacting with a specific gene, but in cancer cells this element does interact with this gene.”
Dr. Adli believes it is too early to predict if this technique could be used to help develop cancer therapies, but suggests it could be useful for diagnostic purposes.
The lab’s team includes (left to right) Mazhar Adli, Tom Wei, Jackie Yang, Stephen Shang, and Turan Tufan.
UVA Health System
“In cancers there is copy number variation where one gene is duplicated many, many times so we end up with multiple copies of the same gene. We could simply use our technique to see how many copies of a gene are there in a cell,” he explained.
“In normal cells we should have two copies, one from Mum, one from Dad, so we should see two dots. But in cancer cells, when there is amplification of a genomic region we should see many dots.”