
Abstract
Abstract
Objective:
The aim of the study was to compare objectively measured physical activity (PA) between greenway users playing and not playing Pokémon Go.
Materials and Methods:
A sample of 100 participants walking on a greenway wore an Omron pedometer and ActiGraph accelerometer and provided demographic data through an intercept survey during a natural experiment. Mann–Whitney U tests and multiple regression compared greenway PA variables between Pokémon Go (n = 13) and non-Pokémon Go (n = 87).
Results:
Pokémon Go users were significantly younger (P < 0.01) than non-Pokémon Go users. Despite no differences in greenway walking time (42 ± 18 minutes), Pokémon Go users took fewer aerobic steps (2361 ± 1663 steps vs. 4144 ± 2591 steps; P = 0.03), walked shorter distances (1.38 ± 0.68 miles vs. 1.98 ± 1.05 miles; P = 0.049), burned fewer calories (119 ± 79 kcal vs. 202 ± 158 kcal; P = 0.04), spent more time in sedentary (16% ± 12% vs. 2% ± 7%; P < 0.01) and light (29% ± 24% vs. 15% ± 21%; P < 0.01) intensity activity, less time in moderate (52% ± 30% vs. 71 ± 29%; P = 0.02) and moderate-to-vigorous PA (MVPA) (55% ± 29% vs. 82% ± 23%; P < 0.01), and took fewer steps/min (67 ± 24 steps/min vs. 103 ± 23 steps/min; P < 0.01) than non-Pokémon Go users. Pokémon Go step rate rarely exceeded 100 steps/min for >5 minutes at a time. Multiple regression confirmed differences in sedentary, light, vigorous, MVPA, and steps/min between Pokémon Go and non-Pokémon Go users after controlling for covariates (P < 0.05). Age was significantly positively associated with aerobic steps, steps, walking distance and time, more light, but less vigorous, and MVPA (P < 0.05).
Conclusion:
While playing Pokémon Go greenway users are likely stopping more and walking at a slower pace than walkers not playing Pokémon Go.
Introduction
In the United States, a mere 21% of adults obtain the recommended level of 150 min/week of physical activity (PA).1,2 Due to the positive impact of PA on many health outcomes, interventions that are able to increase the PA levels of the population may significantly improve public health.3–6 Recently, a promising new mode of stimulating PA, phone-based mobile games, has become increasingly popular. Unlike active videogames of the past that aimed at increasing PA inside, often still tethered to a TV screen (i.e., Wii Fit™ and Xbox® Kinect), new “exergames” such as Pokémon Go allow players to be active outdoors with their smartphones using augmented reality.6–8 While Pokémon Go has the potential to be used as a large-scale intervention for promoting PA, how it impacts PA is still being determined. 6
The mobile phone-based Pokémon Go game was released in the summer of 2016 and was quickly embraced worldwide with >500 million downloads. 9 It is estimated that there are ∼25 million active users in the United States and 40 million who play globally. 10 Pokémon Go appears to have a positive impact on players' PA levels. A study by Althoff et al. reported that Pokémon Go accounted for nearly 144 billion extra steps in the United States alone. 6 Studies by Howe et al. 11 and Xian et al. 12 using participant's iPhone “Health” application documented an increase of 1976 and 975 steps/day, respectively. Howe et al. also noted that this modest increase was short lived due to the rapid decline of interest in playing the game. 11 Pokémon Go players who were previously sedentary had the greatest increases in PA, and therefore Pokémon Go could serve as a gateway for beginning an active lifestyle. 13
In addition to capturing the changes in the volume of PA attributed to the Pokémon Go phenomena, it is important to consider whether playing Pokémon Go promotes unique patterns of PA. We hypothesize that Pokémon Go users may exhibit unique walking patterns characterized by many short, intermittent bouts of walking, rather than one continuous bout because the players regularly stop moving to interact with their phone screens to capture Pokémon or collect game rewards at “PokéStops.” While several studies documented changes in PA volume,6,11–13 none have described the unique patterns or intensity of Pokémon Go users' PA. Therefore, using both pedometers and accelerometers, this study sought to identify the unique PA patterns of Pokémon Go users. It examined whether the walking behaviors of Pokémon Go users were different from adults who were not playing Pokémon Go while walking on a greenway shortly following the release of Pokémon Go.
Materials and Methods
Study setting
This study was conducted in two small cities, Maryville, TN and Alcoa, TN, connected by a relatively large greenway system (a 9-mile-long paved trail).14,15 The greenway is a primarily linear design that incorporates several looped sections.
Data collection occurred at two local parks, Sandy Springs Park in Maryville and Springbrook Park in Alcoa, at either end of the greenway trail. Both sites have large parking areas, access points to the trail, picnic tables/shelters, playground areas, and sports fields/courts. The data for this analysis were obtained as part of a larger study that was examining demographic characteristics and PA behaviors of greenway users. The larger study involved 12 days of direct observation, trail intercept surveys, and objective measurements of PA of greenway users at the two park locations between the months of June and August 2016. In total, 2338 individuals were observed, 495 greenway users were interviewed, and 103 adults wore the PA monitors.
Participants and recruitment
To be included in this analysis, participants had to be over the age of 18, starting and ending their greenway PA (walking or jogging) at a study site, and willing to wear an Omron pedometer and ActiGraph accelerometer on an elastic waist belt. After learning about the study requirements, those interested signed an informed consent form that outlined requirements and human protections. The Maryville College Institutional Review Board approved all procedures within this study.
Instrumentation
An Omron HJ-322U (Bannockburn, IL) pedometer and ActiGraph GT3X (Pensacola, FL) accelerometer were worn on the right hip to capture a participant's single bout of greenway-related PA. The Omron HJ-300 series pedometer has been found to be a highly valid and reliable step tracker in laboratory and free-living conditions.16,17 In free-living walking trials, it recorded 100% of actual steps when worn on the waist. 17 In this study, the Omron pedometer was used to measure steps, aerobic steps (60 steps/min for at least 10 minutes, or with less than a 1-minute rest), distance, and calories burned. The Omron pedometer was initialized for each participant by entering self-reported height, weight, and measured stride length. The ActiGraph GT3X accelerometer has been validated for determining PA intensity, and is the most used research-grade accelerometer on the market due to its ability to accurately measure PA intensity levels.18–21
The ActiGraph is also the PA measurement tool of choice in the National Health and Nutrition Examination Survey. 21 Previous models of ActiGraph accelerometers have proved valid for measuring walking at varying gradients and velocities. 22 The ActiGraph recorded second-by-second data, which were used to calculate the percentage of time spent in sedentary, light, moderate, vigorous, and moderate-to-vigorous PA (MVPA), as well as total steps and stepping rate during the walk/jog.18–20
Procedures
Data collection occurred on the greenway on six Wednesdays and Saturdays for the first 2 hours of daylight (∼7:00 AM–9:00 AM), at lunch time (11:00 AM–1:00 PM), and the last 2 hours of daylight (∼6:30 PM–8:30 PM) from June to August 2016. Passing greenway users were asked to complete a 15-minute trail intercept survey that asked about their greenway use, proximity to the greenway, and demographic information. Participants who were just beginning their greenway activity session were asked if they would be willing to wear an Omron HJ-322U pedometer and an ActiGraph GT3X accelerometer to track their activity while on the greenway. Consented participants were given the devices on an elastic waist belt to wear and were told to return it to the researchers before leaving the greenway. A total of 103 participants agreed to wear the belts with pedometers and accelerometers. Data from 2 cyclists and 1 participant with incomplete Omron data were excluded, resulting in an analytic sample of 100 participants. Researchers documented whether participants were playing Pokémon Go (PMG) while walking on the greenway, and the time when the participants began and ended their bout of PA. Participants received a business card that provided their PA summary based on the Omron pedometer data.
Statistical analyses
SPSS Statistical Software version 24 (Armonk, NY) was used for data analysis. Chi-square tests compared the categorical demographic variables between PMG and non-PMG users. Mann–Whitney U tests were used to compare all non-normally distributed continuous variables: age, Omron pedometer-derived aerobic steps, total steps, distance walked (miles), calories burned (kcal), and GT3X accelerometer-derived percentage time in sedentary, light, moderate, vigorous, and MVPA activity, steps, and stepping rate between PMG and non-PMG users. In addition, multiple linear regression was used to examine the relationship between Pokémon Go user status and Omron and GT3X accelerometer-derived continuous variables when controlling for potential covariates (age, gender, income [<25,000, 25,000–50,000, 50,000–75,000, and >75,000], and education [high school or less, 1–3 years college, and 4+ years college]). Significance was set a priori at P < 0.05. Minute-by-minute accelerometer data (vector magnitude and steps) curves were generated to describe and compare greenway activity profiles between Pokémon Go and non-Pokémon Go users.
Results
Characteristics of the 100 users of the Maryville–Alcoa greenway are shown in Table 1. Thirteen percent of the sample were playing Pokémon Go. There were no statistically significant differences in gender or race between Pokémon Go and non-Pokémon Go users; however, education level trended toward significance (P = 0.06). Pokémon Go users were significantly younger (P < 0.01) and were more likely to have a lower income level (46% <25,000 vs. 9% <25,000, respectively; P < 0.01) than non-Pokémon Go users.
Demographics of Pokémon Go and Non-Pokémon Go Users (Mean ± SD and %)
Significant differences (P < 0.05) are bolded.
HS, high school; SD, standard deviation.
Omron pedometer data revealed significant differences in aerobic steps, distance walked (miles), and calories burned (kcal) between Pokémon Go and non-Pokémon Go users (Table 2). Despite spending nearly the same amount of time on the greenway (41.6 ± 18.2 minutes), Pokémon Go users took significantly fewer aerobic steps (2361 ± 1663 steps vs. 4144 ± 2591 steps; P = 0.03), walked shorter distances (1.38 ± 0.68 miles vs. 1.98 ± 1.05 miles; P = 0.049), and burned fewer calories (119 ± 79 kcal vs. 202 ± 158 kcal; P = 0.042) than non-Pokémon Go users. Pokémon Go users also trended toward taking less total steps (3210 ± 1583 steps vs. 4539 ± 2302 steps; P = 0.056) than non-Pokémon Go users. Multivariable analyses showed no significant relationship between Pokémon Go user status and Omron variables; however, age was significantly positively associated with aerobic steps, total steps, distance and time walking (P < 0.05) (Table 3).
Differences in Omron Pedometer Physical Activity Variables Between Pokémon Go and Non-Pokémon Go Users (Mean ± SD and %)
P-value for Mann–Whitney U test, P < 0.05. Significant differences (P < 0.05) are bolded.
Adjusted Models for Omron Pedometer Physical Activity Variables
All models are adjusted for Pokémon Go use (PMG = 1, Non-PMG = 0), age (years), gender (1 = female, 0 = male), education (1 = HS or less, 2 = 1–3 years college, 3 = 4+ years college), and income (1 ≤25,000, 2 = 25,000–50,000, 3 = 50,000–75,000, and 4 ≥ 75,000). Level of significance is noted: **P < 0.01; *P < 0.05.
PMG, Pokémon Go.
ActiGraph accelerometer data showed that Pokémon Go users spent a significantly greater percentage of their time on the greenway in sedentary intensity activity than non-Pokémon Go users (16% ± 12% vs. 2% ± 7%, P < 0.01) and light (29% ± 24% vs. 15% ± 21%, P < 0.01; respectively). Further, Pokémon Go users spent a significantly smaller percentage of their walk in moderate (52% ± 30% vs. 71% ± 29%; P = 0.024) and MVPA (55% ± 29% vs. 82% ± 23%; P < 0.01) than non-Pokémon Go users (Table 4 and Fig. 1). There was no difference in vigorous intensity activity between PMG and non-PMG users (3% ± 9% vs. 12% ± 25%, respectively; P = 0.2). Multiple regression predicted that Pokémon Go users had a significantly greater percentage of sedentary, and light, and less vigorous, MVPA, and steps/min than non-Pokémon Go users after controlling for covariates (P < 0.05) (Table 5). Age was also significantly positively associated with more light and total steps, but less vigorous, and MVPA (P < 0.05).
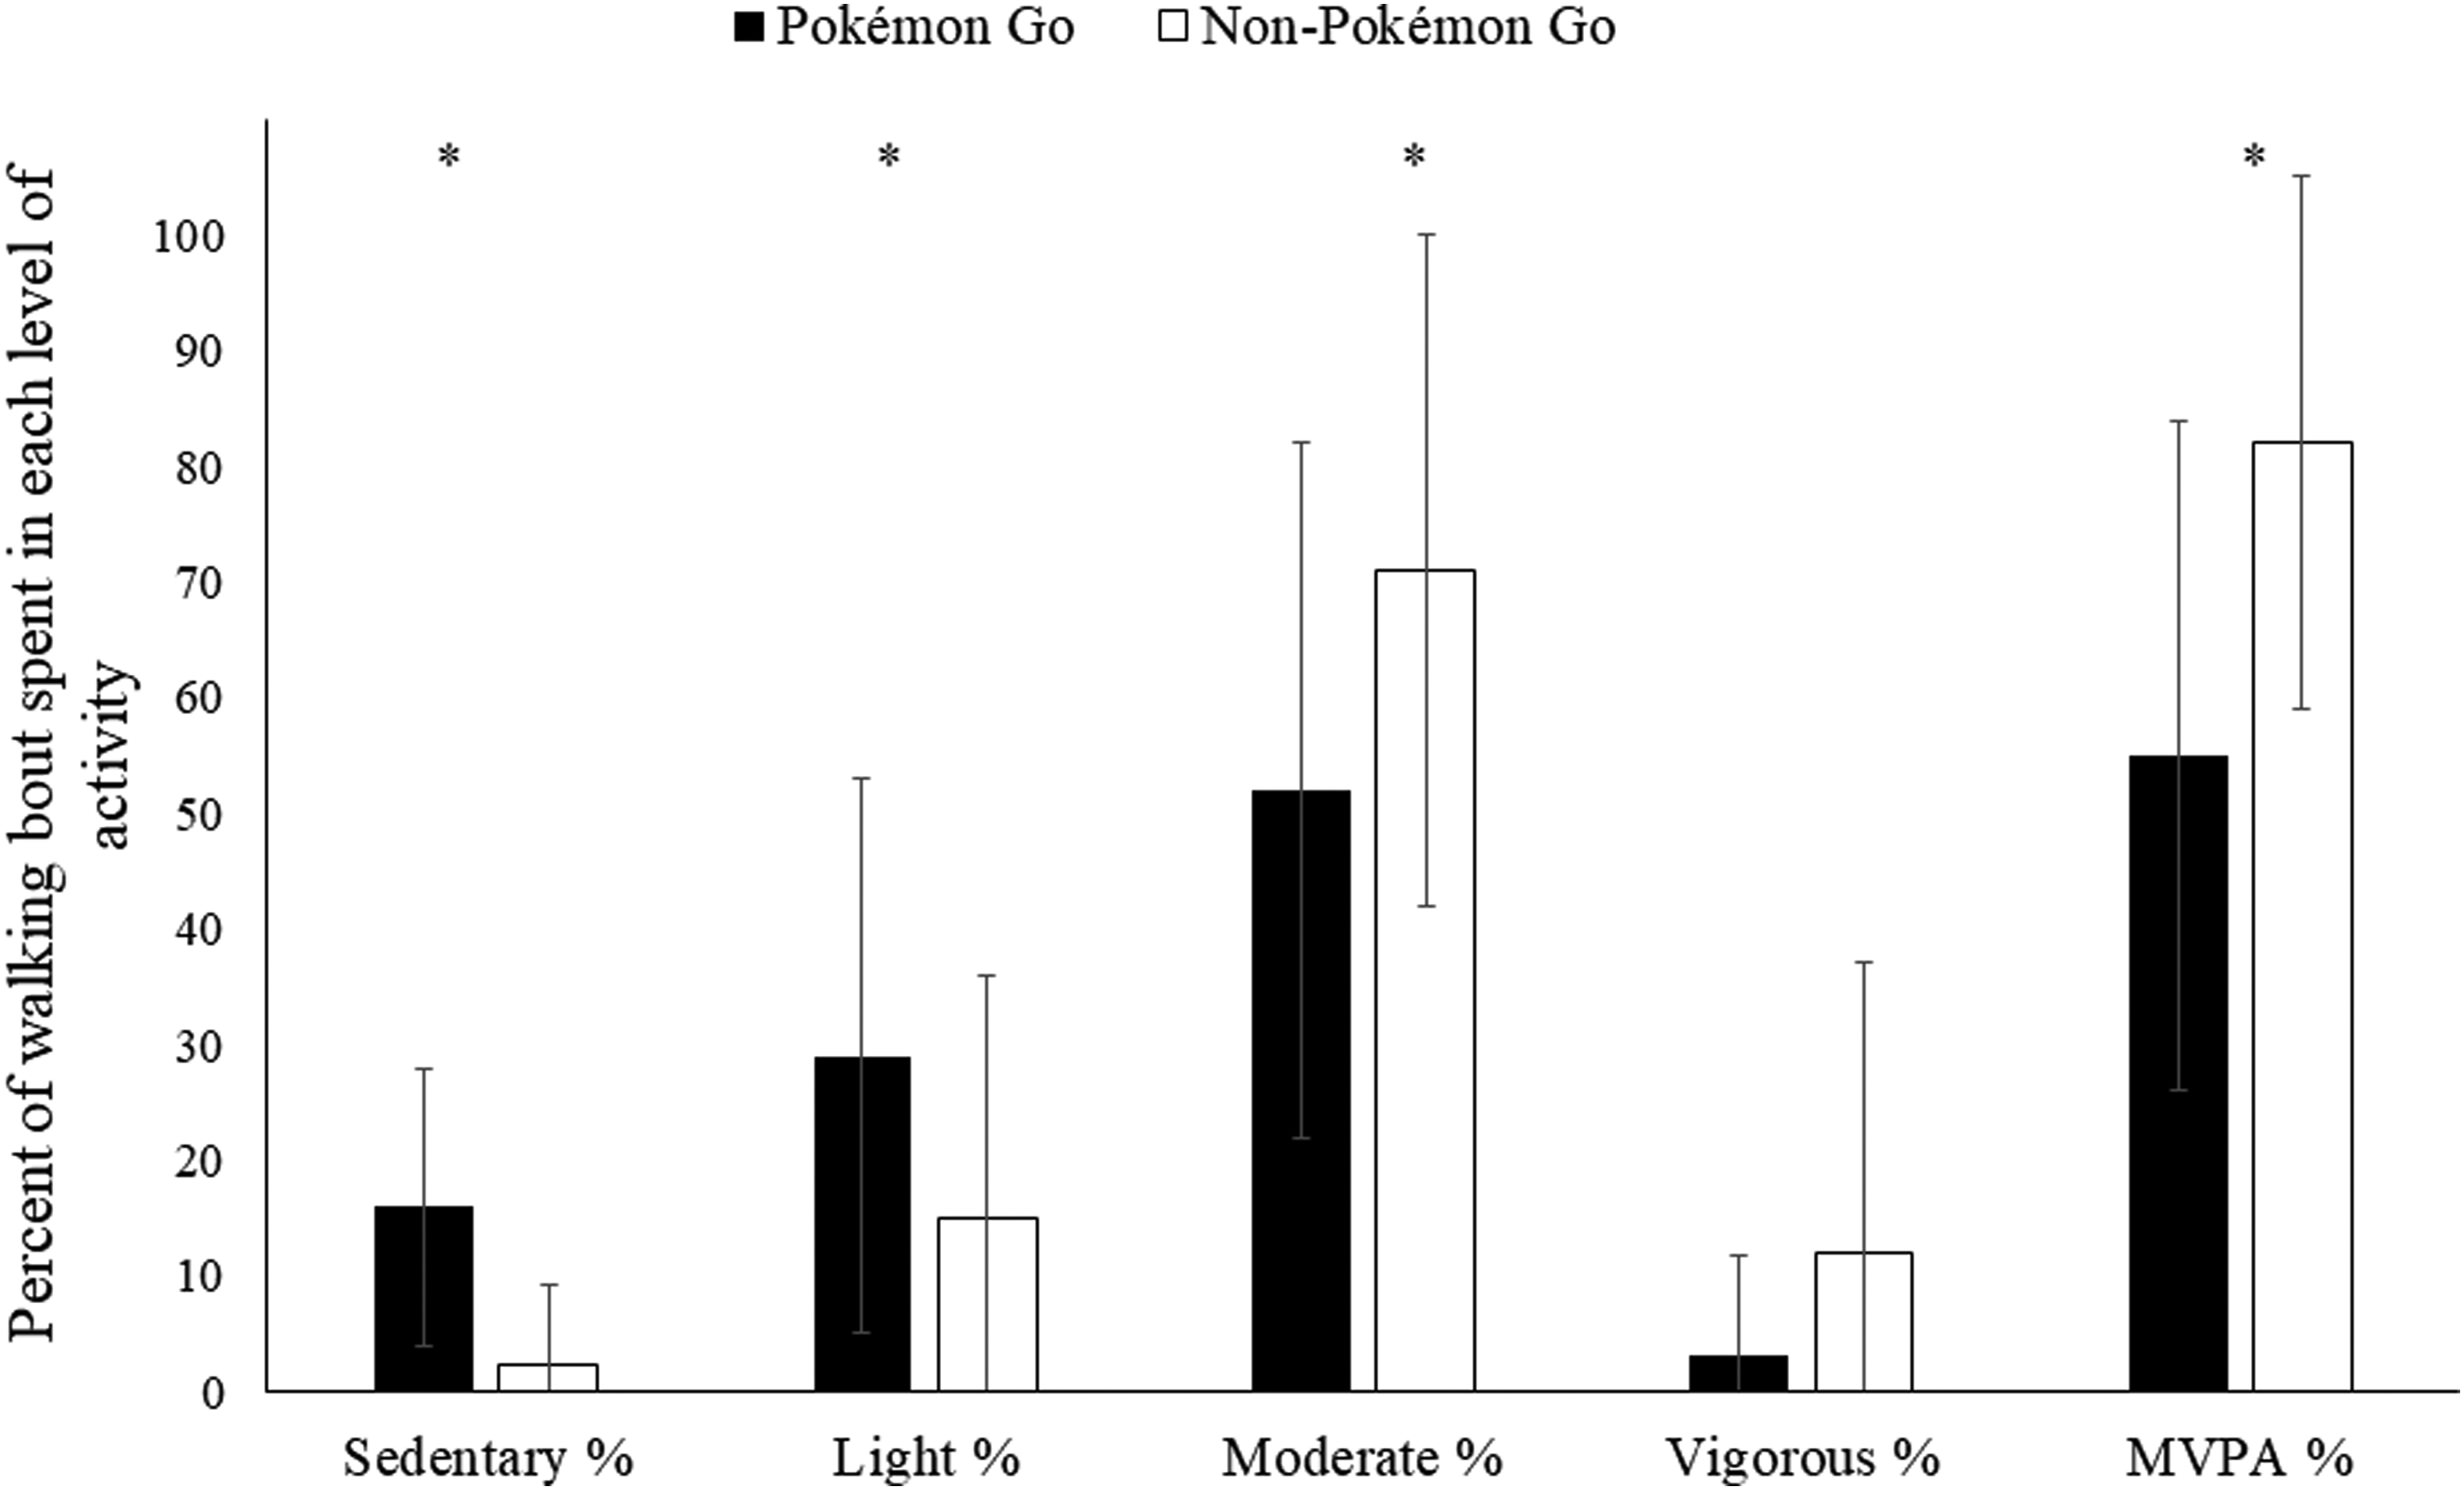
ActiGraph activity intensity comparisons of greenway walking bouts between Pokémon Go (n = 13) and non-Pokémon Go (n = 87) users. *Significant difference between Pokémon Go and non-Pokémon Go.
Differences in Accelerometer Measured Physical Activity Intensity Between Pokémon Go Users and Non-Pokémon Go Users (Mean ± SD and %)
P-value for Mann–Whitney U test, P < 0.05. Significant differences (P < 0.05) are bolded.
MVPA, moderate-to-vigorous physical activity.
Adjusted Models for Actigraph Accelerometer Measured Physical Activity Intensity Variables
All models are adjusted for Pokémon Go use (PMG = 1, Non-PMG = 0), age (years), gender (1 = female, 0 = male), education (1 = HS or less, 2 = 1–3 years college, 3 = 4+ years college), and income (1 ≤ 25,000, 2 = 25,000–50,000, 3 = 50,000–75,000, and 4 ≥ 75,000). Level of significance is noted: ***P < 0.001; **P < 0.01; *P < 0.05.
Thirty-nine percent of Pokémon Go users reported using the greenway for <1 year compared with 13% of non-Pokémon Go users (P = 0.03). The ActiGraph accelerometer and Omron pedometer step measurements were highly correlated (Pearson's correlation = 0.97, P < 0.01).
The minute-by-minute plots of vector magnitude, a proxy for overall PA, and steps provide a visual of the differences in activity patterns between the two groups (Fig. 2). Figure 2 includes two sets of PMG and non-PMG users matched on greenway walking bout duration (Set 1 walked <1 hour, Set 2 walked >1 hour). The non-Pokémon Go users consistently maintained a high level of activity (vector magnitude and stepping rate were typically ∼7000 counts/min [CPM] and 110 steps/min, respectively) from the onset to the end of their activity bout, creating a box-shaped activity profile. In contrast, the Pokémon Go users' activity profile was inconsistent, characterized by many peaks and valleys, which resulted in a wide range of vector magnitudes and stepping rates throughout the walking bout. Pokémon Go users' step rate rarely exceeded 100 steps/min for >5 minutes at a time, and their vector magnitude was ∼50% less than non-Pokémon Go users, rarely reaching >4000 CPM.
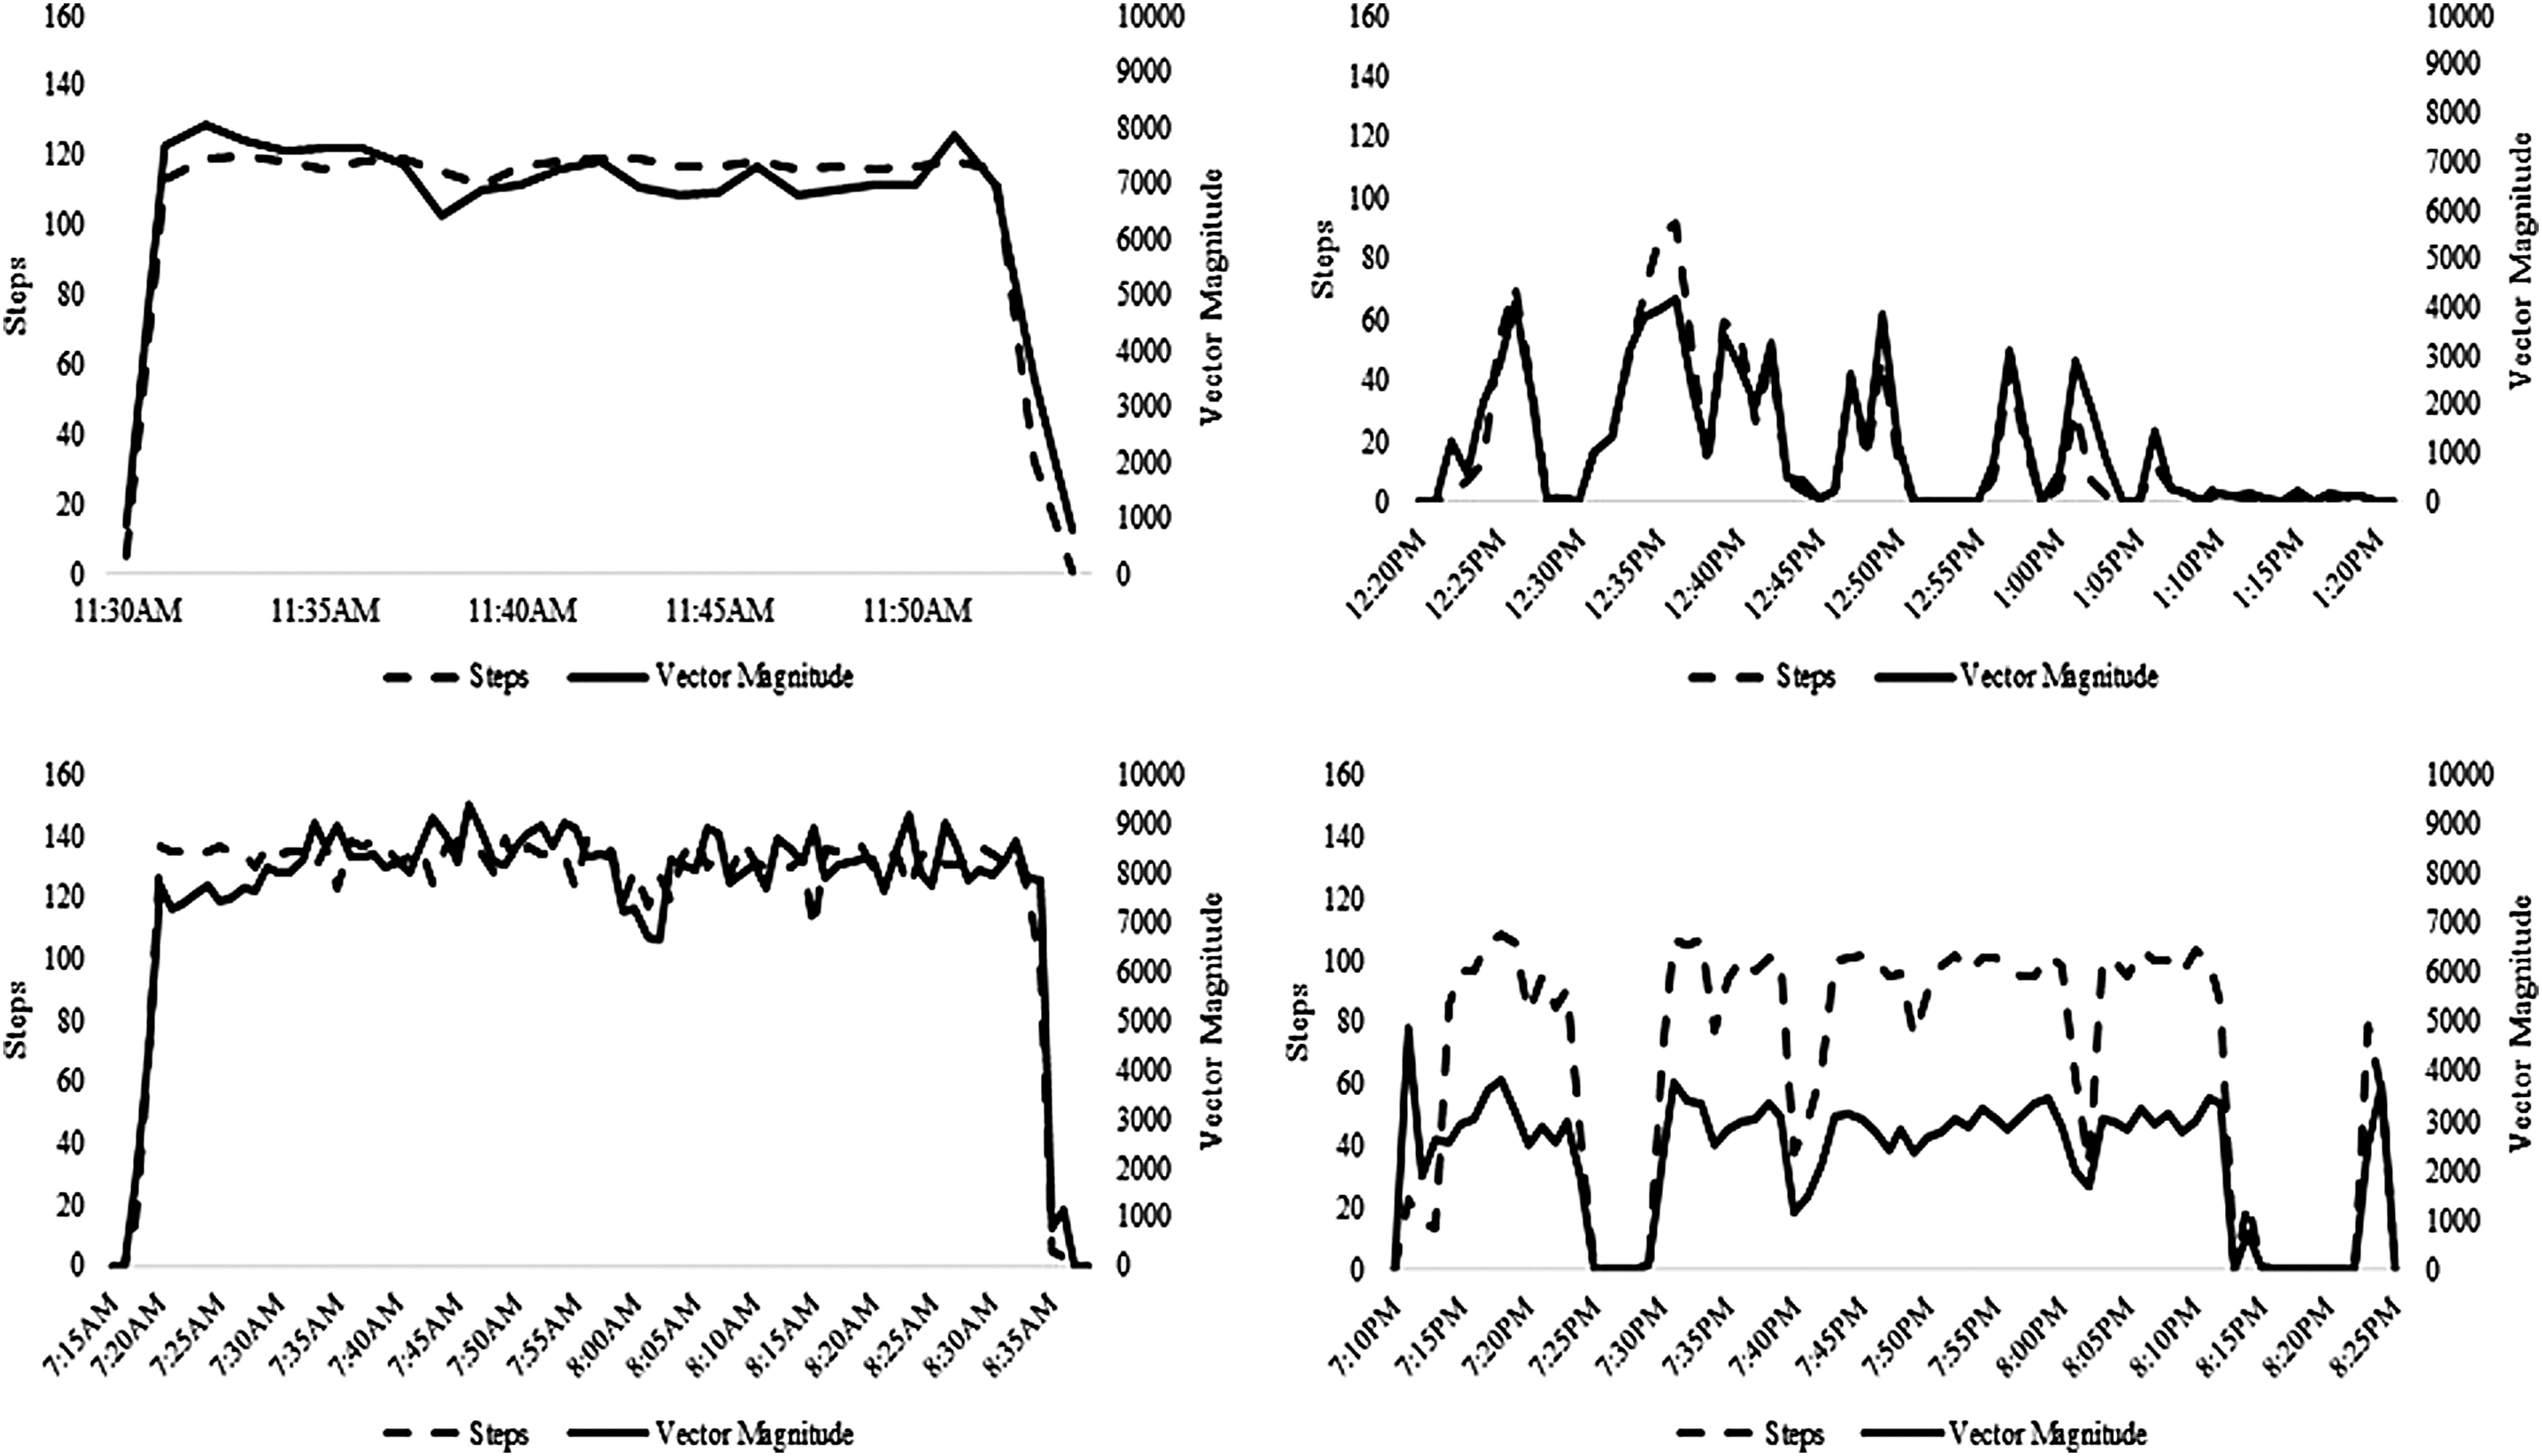
Accumulation pattern of activity (vector magnitude CPM) and stepping (steps/min) for two pairs of participants (Pokémon Go [right side] vs. non-Pokémon Go [left side]) matched on the duration (Set 1 walked <1 hour [top panel], Set 2 walked >1 hour [bottom panel]) of their greenway walking bouts from accelerometer recording. CPM, counts per minute.
Discussion
Pokémon Go was the most downloaded iOS application in 2016 with >650 million downloads.23,24 Most of the people who downloaded the game and played it were younger (on average 26 years old or less). 10 Our findings showed that those playing Pokémon Go were indeed of a younger demographic. During the transition from high school to college there is a steep decrease in PA, and currently 40%–50% of college students are physically inactive.25,26 Pokémon Go could be used to help reduce the decline in PA seen in many young adults because of its marketability and success with this demographic who spent their childhood playing the original Pokémon game. A recent study by Barkley et al. (2017) showed that Pokémon Go reduced sedentary behavior by increasing self-reported walking in college students. 27 Older generations, not raised with Pokémon games, likely never developed a connection to the game. 28 Also, since Pokémon Go is an application downloaded and played on a smartphone, an unfamiliarity with technology may explain the lack of participation by older generations.
A major strength of this study is the use of previously validated pedometers and accelerometers to measure PA of Pokémon Go users. The Omron HJ-322U pedometer has been found to be 100% accurate at recording steps while worn on the waist in a free-living environment. 17 Also, the ActiGraph GT3X used in this study is the most widely used research accelerometer available for measuring PA intensity.18–21 These highly accurate devices provided a unique opportunity to quantify the PA of Pokémon Go and non-Pokémon Go users in the natural environment during the height of Pokémon Go popularity.
The ActiGraph accelerometer provided information about real-time PA behaviors of PMG and non-PMG users who were using a greenway. The ActiGraph accelerometer provided information not only about the total time spent in activity, steps, and percentage time spent in different intensities but also about the manner in which activity and steps were accumulated. This study suggests that playing Pokémon Go on a greenway may result in unique PA patterns. Non-Pokémon Go greenway users typically had one, long, constant bout of activity, and consistently had a vector magnitude of ≥8000 CPM and ≥100 steps/min (a threshold for moderate intensity activity). 29 In addition, the stepping bouts were continuous, lasting >10 minutes and would therefore count toward meeting the guidelines for aerobic activity (≥150 min/week).
In contrast, Pokémon Go users tended to have many short, intermittent bouts of varying lengths, and their activity bouts rarely reached a vector magnitude >4000 CPM or the 100 steps/min threshold. It was hypothesized that Pokémon Go users were stopping to “catch Pokémon,” collect items from “Pokéstops,” or visit virtual gyms to progress in the game, resulting in many short bouts of activity. There are two problems with this pattern of activity: the bouts are too short and the intensity is too low. These intermittent bouts of low intensity PA typically lasted <10 minutes, and therefore would not count toward meeting the aerobic activity recommendations and may do little to enhance health. 4
Without some other form of activity, Pokémon Go users may be less likely to meet the daily PA guidelines. 4 Despite spending the same time on the greenway, Pokémon Go users were participating in a lower total volume of PA; walking fewer steps, aerobic steps, miles, and burning fewer calories than non-Pokémon Go users. Individuals who are sedentary or inactive can benefit from as little as 20 minutes of PA a day, and Pokémon Go could serve as a stepping stone for inactive or sedentary individuals looking to achieve a more active lifestyle.13,30
While the volume of PA related to Pokémon Go has been reported in several studies, no previous study has presented objectively measured intensity of playing Pokémon Go.6,11–13 Shortly after its release, Pokémon Go was heralded as a possible tool for encouraging individuals to be active outdoors and improving the health of its users.31–33 However, Pokémon Go users in this study spent significantly more time in sedentary and light PA compared with non-Pokémon Go users, and spent only 55% of their time on the greenway engaged in MVPA compared with 83% for those not playing. It must be acknowledged that typical greenway users likely use the greenway for continuous bouts of walking, which is a very different behavior goal than playing Pokémon Go. Our results show that compared with continuous greenway walking, playing Pokémon Go while walking on a greenway produced significantly less PA, but this is still better than not participating in PA at all.
Various studies have found that Pokémon Go was most effective at improving the PA levels of users who were previously sedentary or inactive, for example, the gaming community, who may typically engage in completely sedentary gaming indoors with console or computer-based games.6,12,13 Pokémon Go could be an innovative way to motivate individuals to participate in outdoor PA. 13 Many Pokémon Go users in our study reported using the greenway for <1 year, which might be related to the recent release of the game. Being outside has been shown to encourage PA in younger individuals and children.34–36 Therefore, if Pokémon Go has the potential to reduce sedentary inside gaming and increase outside activity, it could serve as a tool toward meeting the PA guidelines.1,4
This study was a natural experiment that explored differences in the PA patterns of Pokémon Go users and non-Pokémon Go users on the greenway. The opportunity to utilize a natural experiment study design was made available due to the timing of ongoing data collections that matched the release of Pokémon Go. Natural experiments offer a unique opportunity to collect data on a change to the environment that otherwise may prove too costly due to the scale of the change. 37 The researchers had no control over the release of Pokémon Go, the appearance of Pokémon in parks, or the selection of certain points within the parks that become “PokéStops” or “PokéGyms.” This lack of control is a common limitation of natural experiments and can lead to an unpredictable setting. 37 Natural experiments are considered ideal by some but are rarely conducted because they are challenging to coordinate. 37 The timing of this study adds a valuable contribution to the small but growing literature on Pokémon Go and augmented reality gaming.
The convenience sampling method used to capture data is low cost and easy to use but does have limitations. There was a potential for selection bias, since we were unable to obtain measurements on all greenway users and our sampling method may have under- or over-represented specific populations. Our demographic results such as gender, income, ethnicity, and education level may have all been skewed due to the inherent bias associated with convenience sampling. The location of our study sites, on sections of the greenway close to park-like amenities, may have increased the likelihood of Pokémon Go compared with sections of the greenway further away from park structure areas. Greenway users on other parts of the greenway may exhibit different behaviors, and it is unknown whether Pokémon Go would be played on parts of the greenway that are not within proximity to park structures, where there was a greater concentration of “Pokestops” and “Pokegyms.”
Also, the participants we sampled may have been more likely to live far from the greenway and used motorized transportation to access it since our study sites were adjacent to access points with parking lots and bathroom facilities. We obtained objective PA measures on 20% of the 495 greenway users who were interviewed as part of a larger study, and 78% of the objective PA measures sample arrived by car compared with 68% of the 495 interviewed participants. Because we did not use a random sampling technique our sample may not be representative of all greenway users, and we must be cautious about generalizing our findings to all Pokémon Go players, and the PA of Pokémon Go players when not on a greenway.
It is possible that people who were willing to wear the devices have a particular interest in the subject matter or the research itself than those who were less interested, but it is unclear whether that interest was due to their connection with the institution conducting the study, or because they were more interested in quantifying their level of greenway-related PA. Because those responding were essentially self-selected, it is possible that their data may not provide any credible statistics about walking behaviors of the population as a whole. Relying on a convenience sample may have also affected the sample size. Both the overall sample size and the sample size of Pokémon Go are relatively small. Therefore, a study with a larger sample size should be used to confirm these findings, and the results of this study should be interpreted cautiously because convenience sampling limits the generalization of the results of our study due to its inability to capture the complete population.
It was expected that non-Pokémon Go would likely be a highly active group while on the greenway. The most interesting finding of this study was how different the PA behaviors of people who came to the greenway to walk versus those who came to the greenway to play Pokémon Go. This short-term study provided a cross-sectional view of Pokémon Go user's greenway behavior and did not document whether participants' PA behaviors were sustained over time or would be similar in other environments. We have no knowledge of the PA behaviors of study participants before the release of Pokémon Go, or of nongreenway-related PA of either Pokémon Go, or non-Pokémon Go.
Because of this, the whole picture of these player's PA patterns is not known. It is likely that individuals play Pokémon Go elsewhere too, but we cannot speculate about their PA profile while playing Pokémon Go off the greenway. Future research should compare the contribution of Pokémon Go-related PA to total PA in Pokémon Go users, and greenway-related PA to total PA in the non-Pokémon Go users, but that was not possible based on the natural experiment design of this study.
This study confirms the findings that Pokémon Go does have some impact on PA. Playing Pokémon Go on a greenway results in unique PA patterns that are characterized by many short, low intensity bouts of activity. In conclusion, this study shows that while Pokémon Go may encourage younger individuals to engage in PA, in their quest to “Catch'em all!,” Pokémon Go users appear to be spending only 55% of their 42-minute walk in health-enhancing MVPA. This may be due to the fact that despite spending the same amount of time on the greenway as others, Pokémon Go users are likely stopping more, and when walking, walking at a slower pace due to their focus on playing Pokémon Go. However, Pokémon Go's engagement of younger individuals could serve as an effective gateway into an active lifestyle.
Footnotes
Acknowledgments
We thank the Active Living Research Program of the Robert Wood Johnson Foundation for the loan of accelerometer equipment used in this study and the Maryville College Naylor Fund for their support.
Author Disclosure Statement
No competing financial interests exist.