
Abstract
Background
The six-minute walk test (6-MWT) is widely used to assess exercise tolerance in chronic heart failure patients (CHF). The aim of this study was to analyse cardiorespiratory parameters kinetics during the 6-MWT in CHF and in healthy subjects.
Methods
A treadmill, symptom-limited exercise test and a 6-MWT were performed by 14 CHF under optimal drug treatment (CHFD), 17 CHF with cardiac resynchronization (CHFP), and 12 healthy subjects. Cardiorespiratory responses were assessed by a validated portable system.
Results
All subjects exceeded their ventilatory threshold during the 6-MWT. Healthy subjects and CHF performed the 6-MWT around 75 and 90% of peak oxygen uptake (V'O2) respectively (P<0.001). In CHF, a steady state was observed only for walking speed and V'O2, with a slight delay in comparison with healthy subjects, for whom a steady state was also observed for carbon dioxide production and ventilation (V'E). During the 6-MWT, the V'E adaptation was due mainly to an increase in tidal volume (VT) in CHFD, whereas in CHFP, it was due to a similar increase in VT and breathing frequency (f). In these patients, the 6-MWT VT/f slope was lower than in CHFD (P<0.01).
Conclusions
During the 6-MWT, the V'O2 steady state is slightly delayed in CHF, which could be related partly to their higher exercise intensity. Moreover, each CHF group is characterized by a specific ventilation components response during the 6-MWT. Eur J Cardiovasc Prevention Rehab 11:171–177 © 2004 The European Society of Cardiology.
Keywords
Introduction
Submaximal exercise cardiorespiratory kinetics have been investigated mainly during a constant workload ergocycle exercise. In healthy subjects, a cardiorespiratory steady state is normally obtained from the third minute of exercise [1–3]. This steady state highly depends on the exercise intensity. The higher the intensity, the more difficult to obtain the steady state [1–3]. In chronic heart failure patients (CHF), kinetics of oxygen uptake (V'O2) and cardiovascular parameters are delayed from the onset of the exercise compared to healthy subjects [4, 5]. In these patients, the cardiorespiratory adaptations depend on both the exercise intensity and the severity of functional impairment [4–7].
Another constant workload exercise, the six-minute walk test (6-MWT) is used more and more to assess daily functional capacity, exercise tolerance and/or physical training effects in healthy subjects [8–10] and in patients with cardiac disease [11, 12]. This test differs from the other constant exercise tests, as it is self-paced and based on the natural activity of walking. The 6-MWT intensity differs according to the population studied. In healthy subjects, it corresponds to a moderate exercise [8, 10]. In CHF, it is considered as an intensive test [13, 14]. However, only V'O2 and heart rate (HR) values at the end of this test have been assessed in the previous studies. Moreover, despite the 6-MWT use in drug-refractory severe CHF treated with cardiac resynchronization therapy (CRT) [15–17], no cardiorespiratory data has been published in this population.
Thus, to our knowledge, the 6-MWT cardiorespiratory parameters kinetics or steady state have never been studied. The aim of this study was therefore to analyse the 6-MWT cardiorespiratory time course in chronic heart failure patients with or without CRT and in healthy subjects.
Materials and methods
Subjects
Three groups of subjects entered this study (n = 45, mean age: 65.0 ± 1.4 years). The first group included healthy subjects (n = 12, six women) having no significant medical history or treatment. The other two groups composed CHF in a stable condition, with an echographic left ventricular ejection fraction < 40% and NYHA class II to IV. One group included CHF under optimal drug treatment (ODT) (CHFD, n = 14, five women) and the other CHF receiving both ODT and CRT (CHFP, n = 19, five women). Cardiac resynchronization therapy had been proposed for severe CHF, NYHA class III or IV despite ODT, and intraventricular conduction delay as indicated by intrinsic QRS duration ≥ 150 ms.
Classical cardiovascular and pulmonary exclusion criteria to perform exercise tests were used [12, 18]. Moreover, subjects whose activity was limited due to factors other than fatigue and exertional dyspnoea, for example, neurological or orthopaedic impairment and psychiatric disorders were also excluded. Before entering the protocol, all subjects were familiarized with both treadmill [19] and 6-MWT [10, 20] during run-in tests.
The investigation conformed to the principles outlined in the Declaration of Helsinki. The Institutional Ethics Committee approved the protocol and all subjects gave written informed consent.
Protocol
Each subject performed a treadmill, symptom-limited exercise test and a 6-MWT within a maximal time interval of 48 h. They exercised 2 h after a light meal, and in CHF at least 2 h after any oral drug ingestion. In the CHFP group, the device was programmed in an atrio-biventricular pacing mode, without any modification between tests. During all exercise tests (treadmill and 6-MWT), subjects wore the same portable metabolic measurement system (Cosmed K4, Rome, Italy) to record simultaneously all cardiorespiratory parameters: heart rate (HR), beats min−1; oxygen uptake (V'O2) ml min−1 kg−1; carbon dioxide production (V'CO2), ml min−1 kg−1; ventilation (V'E), l min−1; tidal volume (VT), l; breathing frequency (f), c min−1. None of the results were divulged to subjects prior the completion of the whole protocol.
Portable device
The Cosmed K4 telemetry system has been previously validated by Hausswirth et al. [21]. This system has been extensively described [10]. Briefly, it includes a soft facemask with a turbine flow meter. The expired air is drawn to the transmitter unit containing gas analysers. This unit and its battery (weighing around 0.8 kg) are worn by the patient. The sampling of the respiratory and HR (Polar electro OY, Kempele, Finland), measurements were taken at 5-s intervals, and all data recorded by telemetry downloaded via an interface to a computer for analysis. Data was then averaged over 30-s intervals.
Treadmill exercise test
All subjects underwent a symptom-limited cardiorespiratory exercise test on treadmill (Marquette Electronics, Milwaukee, Wisconsin, USA). A relatively short duration of this test (8–12 min) is recommended [22]; the ‘Chronotropic Assessment Exercise Protocol’ was used in healthy subjects [23] and the ‘Weber’ protocol in CHF [24]. Left arm blood pressure was manually measured at each end-stage. A 12-lead electrocardiogram (Cardiosystem Marquette Hellige, Milwaukee, Wisconsin, USA) was continuously monitored and recorded every minute. In healthy subjects, the exercise test was stopped when at least three classical criteria of achieving peak V'O2 were observed [25]. All CHF were encouraged to exercise until they were unable to continue because of severe fatigue or dyspnoea.
Three blinded well-trained investigators determined the ventilatory threshold using the method by Beaver et al. [26]. Peak cardiorespiratory values were defined as the mean of the data recorded during the last minute of exercise.
Six-minute walk test
The 6-MWT was administrated by a therapist blinded to the treadmill exercise test results. It was conducted in an 18-m-long unobstructed corridor. Subjects were instructed to walk at regular pace as far as they could from end to end during the allotted time [11]. Stops for resting were authorized. Every 30 s, subjects were encouraged in a standardized fashion. The elapsed time was also given every 2 min [27] and the subjects stopped walking at 6 min.
The total distance walked was measured in metres (m) and the walking speed was calculated in km h−1. The time course of the cardiorespiratory parameters was recorded. The 6-MWT relative intensity was assessed by calculating the ratio between the V'O2 recorded on the last minute of the 6-MWT (end 6-MWT V'O2) and the peak V'O2 recorded on the treadmill, symptom-limited exercise test. As recently suggested [28, 29], the VT/f relation was plotted in each group to investigate the 6-MWT pattern of breathing.
Data and statistical analysis
Statistical procedures were performed using Statistica software version 5.97 (StatSoft Inc., France). Data is reported as mean ± SEM. Groups were compared using an ANOVA on ranks, followed when significant, by a Mann-Whitney test. A Wilcoxon test was used in each group to compare the end 6-MWT V'O2 with the ventilatory threshold V'O2. During the 6-MWT, walking speed and cardiorespiratory time course were analysed in each group using a Friedman test, followed when significant, by a Wilcoxon test. The beginning of the steady state corresponded to the first value after which no more significant difference was observed. A stepwise regression was done to analyse the increase in V'E during the 6-MWT, using the increases in VT and f as independent variables. The 6-MWT VT/f slope was calculated using a linear regression and then correlated with the 6-MWT distance using a Spearman correlation coefficient. Significant difference was accepted when P<0.05.
Baseline characteristics in healthy subjects and chronic heart failure patients. Results are reported as mean ± SEM
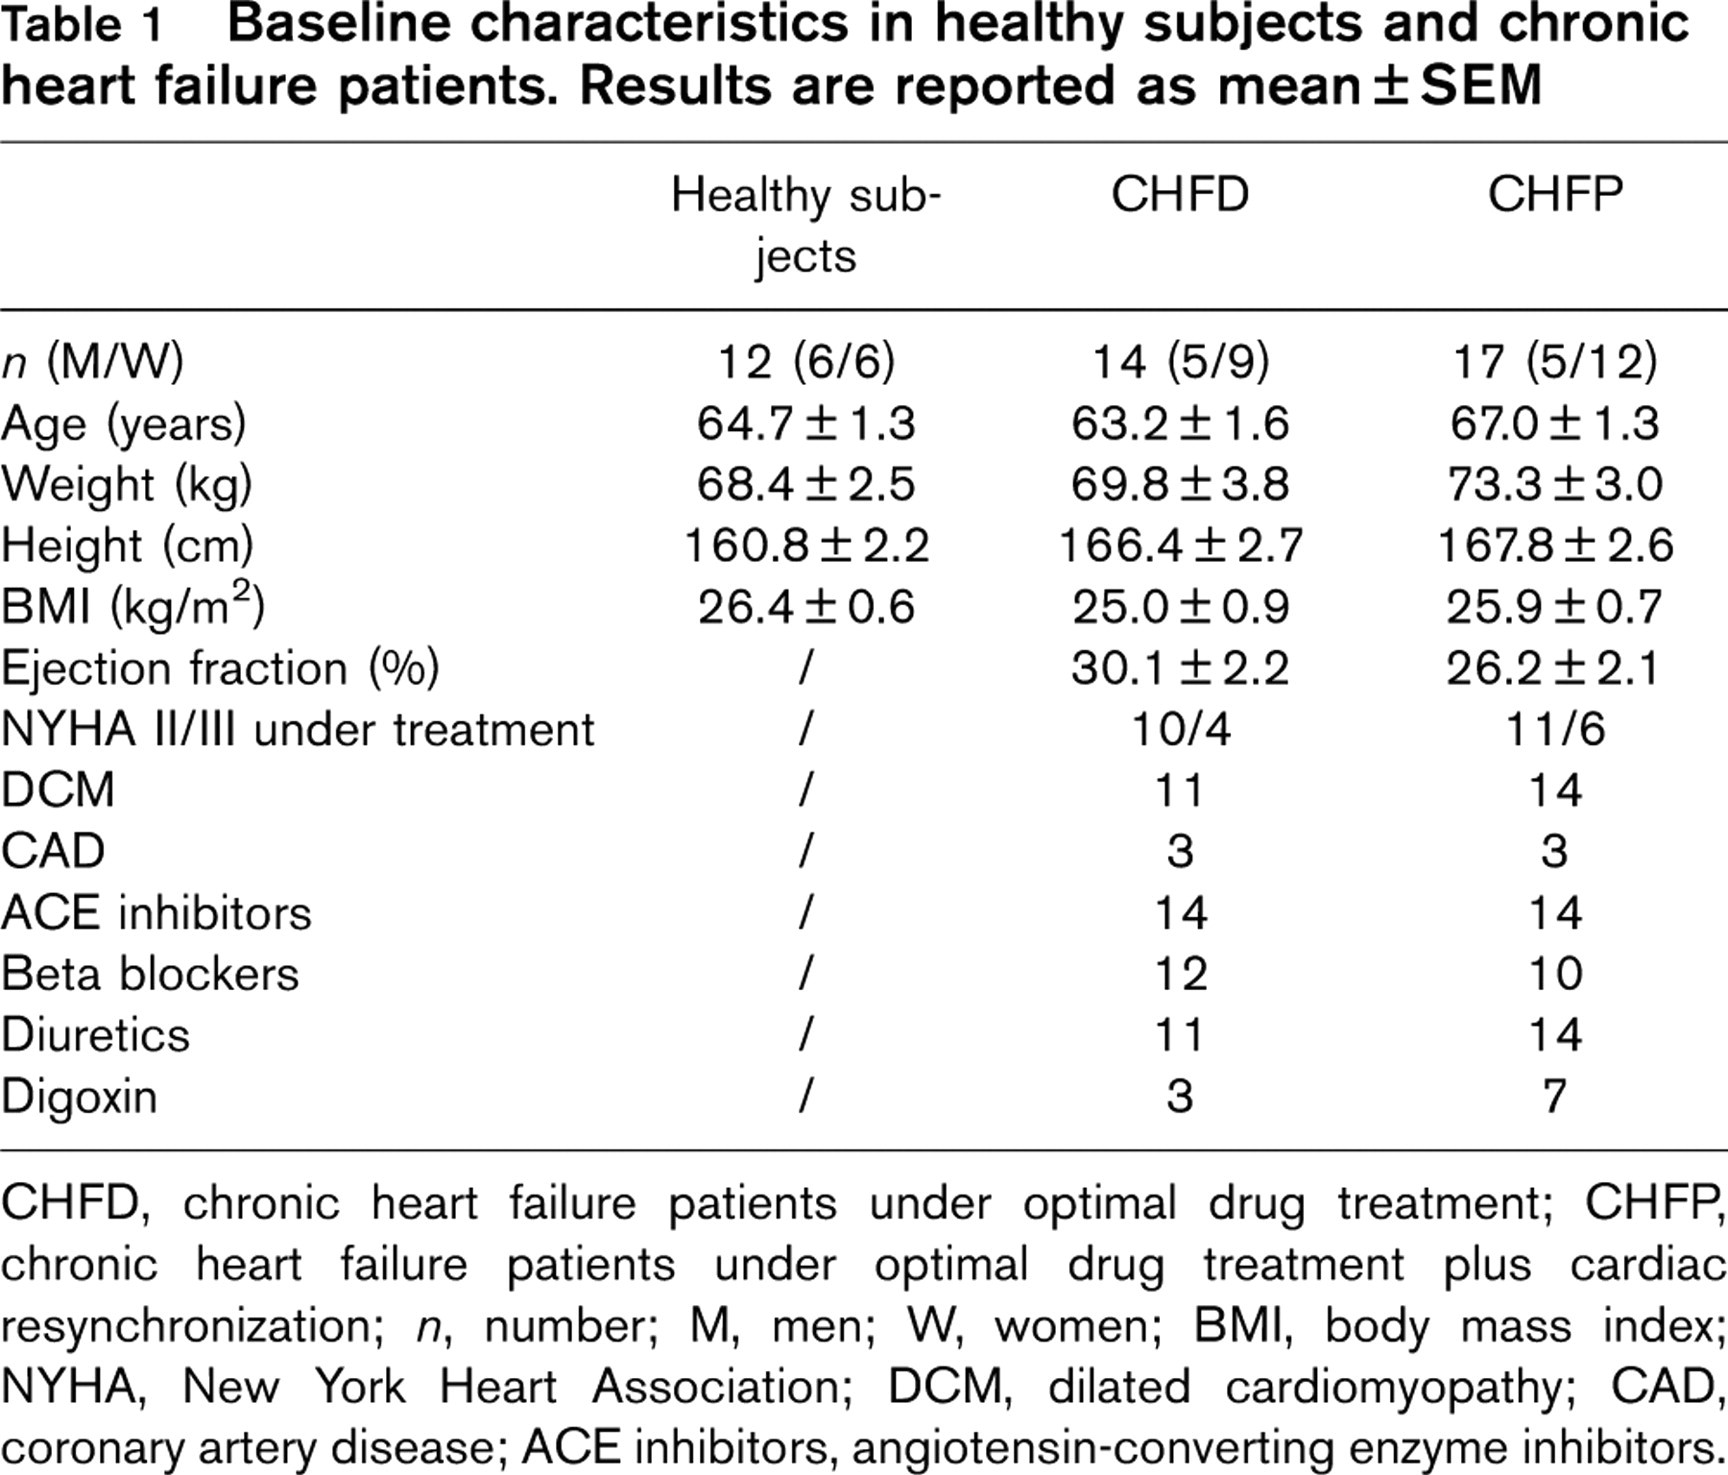
CHFD, chronic heart failure patients under optimal drug treatment; CHFP, chronic heart failure patients under optimal drug treatment plus cardiac resynchronization; n, number; M, men; W, women; BMI, body mass index; NYHA, New York Heart Association; DCM, dilated cardiomyopathy; CAD, coronary artery disease; ACE inhibitors, angiotensin-converting enzyme inhibitors.
Results
Two CHFP prematurely stopped the 6-MWT because of fatigue. Thus, 12 healthy subjects, 14 CHFD and 17 CHFP completed the study. Baseline characteristics are displayed in Table 1. Anthropometric data did not differ significantly between healthy subjects and both CHF groups. At the time of the study, 21 patients were classified in NYHA II and 10 in NYHA III (Table 1), and the aetiology of CHF was non-ischemic in 25 patients and ischemic in six (Table 1). Drug treatment was angiotensin-converting enzyme inhibitors (n = 30), beta-blockers (n = 22), diuretics (n = 25) and digoxin (n = 10) (Table 1). The average dosage of each drug remained unchanged throughout the study.
As expected, healthy subjects had the higher values of ventilatory threshold V'O2, peak V'O2, 6-MWT distance, walking speed and end 6-MWT V'O2 (P < 0.001, Table 2). Although anthropometric and clinical characteristics did not differ significantly between both CHF groups (Table 1), peak V'O2 (P<0.05, Table 2), 6-MWT distance, walking speed (P<0.01, Table 2) and end 6-MWT V'O2 (P<0.05, Table 2) were higher in CHFD than in CHFP. No significant difference for the ventilatory threshold V'O2 was observed between both CHF groups (Table 2).
The end 6-MWT V'O2 was significantly higher than the ventilatory threshold V'O2 in each group (Table 2). The 6-MWT relative intensity was significantly lower in healthy subjects (77.4 ± 4.5% of peak V'O2, P<0.05) than in CHFD and CHFP (87.5 ± 2.7 and 90.3 ± 2.8% of peak V'O2, respectively). It was not different between both CHF groups.
In each group, a 6-MWT speed steady state was obtained during the first 2 min. Figure 1 shows the main cardiorespiratory kinetics in the three groups. In healthy subjects, V'O2 was stabilized on average from 2.5 min, V'CO2 and V'E from 3.5 min, and f and VT from 2 and 2.5 min respectively. Heart rate reached a plateau between 2.5 and 5 min, before re-increasing significantly during the last minute. In CHFD, V'O2 stabilized from 3 min and in CHFP from 5 min, whereas in these two groups V'CO2, V'E and HR continued to increase significantly until the end of the test. In CHFD, f stopped increasing significantly from 30 s, as did VT from 3 min. In CHFP, f and VT increased concomitantly and significantly throughout the exercise.
Exercise data in healthy subjects and chronic heart failure patients. Results are reported as mean ± SEM
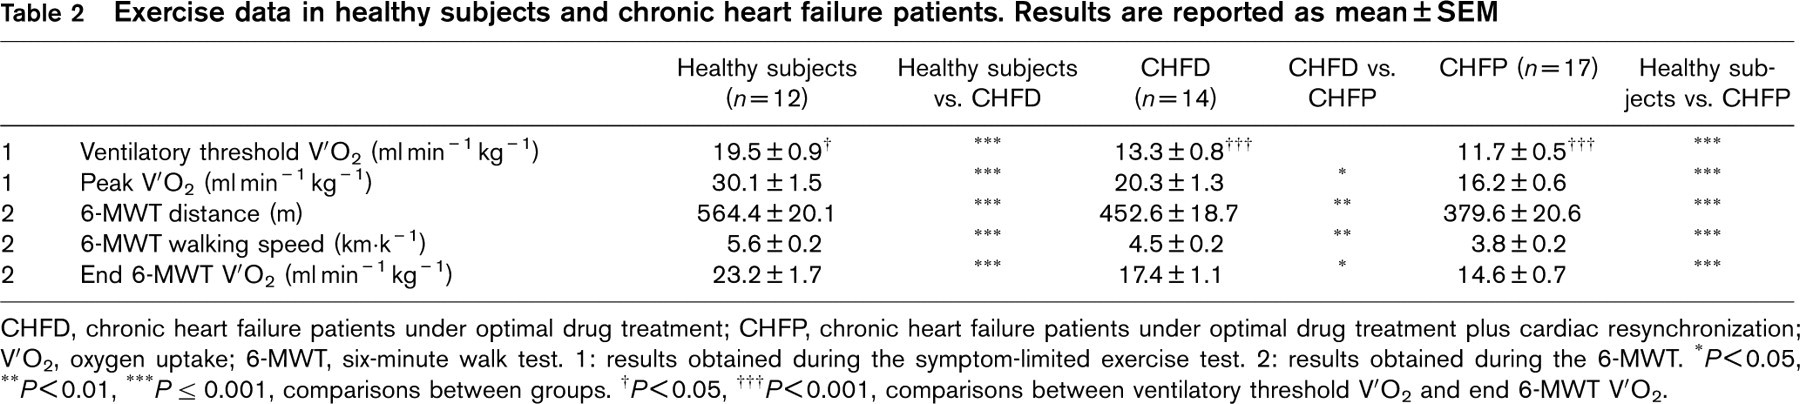
CHFD, chronic heart failure patients under optimal drug treatment; CHFP, chronic heart failure patients under optimal drug treatment plus cardiac resynchronization; V'O2, oxygen uptake; 6-MWT, six-minute walk test. 1: results obtained during the symptom-limited exercise test. 2: results obtained during the 6-MWT. ∗P<0.05, ∗∗P<0.01, ∗∗∗P < 0.001, comparisons between groups. † P<0.05, ††† P<0.001, comparisons between ventilatory threshold V'O2 and end 6-MWT V'O2.
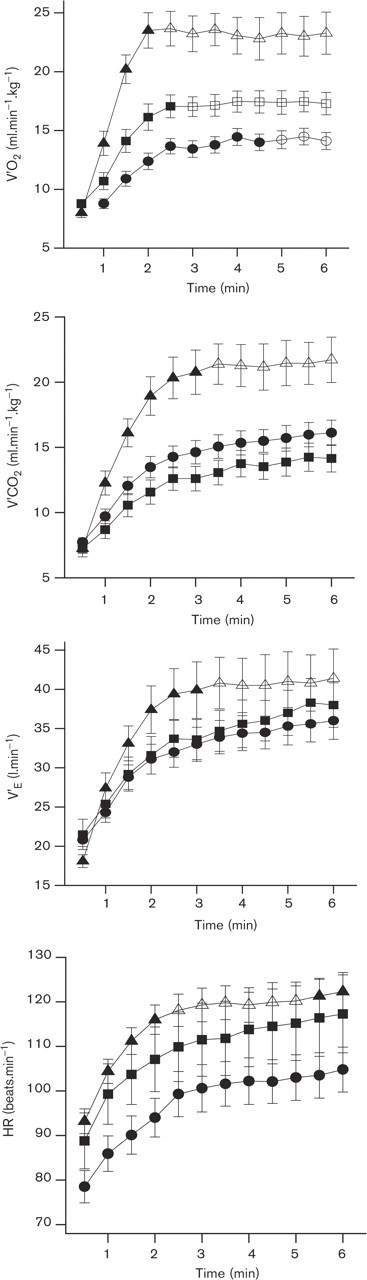
Kinetics of the cardiorespiratory parameters (oxygen uptake, V'O2; carbon dioxide production, V'CO2; ventilation, V'E; heart rate, HR) during the 6-min walk test, in healthy subjects (▴), chronic heart failure patients under optimal drug treatment (CHFD, ▪) and chronic heart failure patients under optimal drug treatment plus cardiac resynchronization (CHFP, •). The open symbols indicate the cardiorespiratory parameters steady state.
Concerning the 6-MWT pattern of breathing, from the first 30 s to the end of the test, the increase in V'E in healthy subjects was mainly due to an increase in VT (+ 77.8 ± 5.7%, r 2 = 0.90) and to a lesser degree in f (+ 28.7 ± 6.7%, r 2 = 0.45). Healthy subjects have not been compared to CHF as they did not perform the test at the same proportion of their peak V'O2. Between both CHF groups, V'E was not significantly different at rest and at the end of the 6-MWT. When we compared the pattern of breathing all along the 6-MWT, the adaptations of VT and f were different in CHFD and CHFP. In CHFD, the increase in V'E was due mainly to an increase in VT (+ 56.6 ± 9.7%, r 2 = 0.61) and to a lesser degree in f (+ 12.3 ± 7.8%, r 2 = 0.36). In CHFP, the rise in V'E was related to a similar increase in VT (+ 35.6 ± 7.5%, r 2 = 0.64) and in f (+ 35.1 ± 8.3%, r 2 = 0.86). The VT/f slope was significantly higher in CHFD than in CHFP (0.07 ± 0.01 versus 0.03 ± 0.00, P<0.01, respectively). In these patients, the VT/f relation was shifted downwards and to the right in the initial phase of the 6-MWT and throughout the test compared to CHFD one (Fig. 2). In CHF pooled, a weak but significant and positive correlation was observed between the 6-MWT VT/f slope and distance (r = 0.45, P < 0.01).
Discussion
The present study concerns the cardiorespiratory adaptations during the 6-MWT in age-matched healthy subjects and two groups of CHF: mild-to-moderate and moderate-to-severe. The main results show that during this submaximal test at constant workload (1) only oxygen uptake reaches a steady state in the three populations, and (2) each CHF group is characterized by specific ventilation components response.
This original study assessed the cardiorespiratory time course during the 6-MWT in sexagenarian CHF and healthy subjects. Indeed, to the best of our knowledge, previous studies have compared the V'O2 and cardiovascular kinetics between CHF and healthy subjects only during a constant workload exercise test on cycloergometer [4, 5]. Kinetics were seen to be slower at the onset of the rectangular exercise in patients, implicating a greater O2 deficit [4, 5].
As shown by the walking speed steady state, the 6-MWT represents a constant workload test. Indeed, this parameter remained stable after 2 min in the three groups studied. Otherwise, this test that is performed above the ventilatory threshold in all subjects, corresponds to a moderate intensity exercise in healthy subjects and to an intense exercise in CHF [30]. The high intensity level of the 6-MWTobserved in CHF confirms previous observations that showed a 6-MWT ventilatory demand higher than 85% of the peak values [13, 14].
The V'O2 also plateaued before the end of the 6-MWT in each group (Fig. 1). However, the ‘steady state’ appeared sooner in healthy subjects (2.5 min) than in CHF, and in CHFD (3 min) than in CHFP (5 min), which is in agreement with the respective 6-MWT intensities. The same V'O2 adaptation has been previously observed in COPD during the 6-MWT [31]. Because of the high workload intensity performed by the CHF groups, this ‘steady state’ can seem somewhat surprising [2]. Some hypotheses can be proposed to explain it. The duration of the 6-MWT could be too short to induce a significant V'O2 drift [32]. Moreover, because of the numerous turnings achieved by CHF patients during the 6-MWT, the exercise-load performed was not as constant as on a treadmill [31]. Lastly, it is also possible that patients attained a V'O2 ‘limited state’ and not a real V'O2 ‘steady state’ [31].
The V'CO2 and V'E parameters recorded during the 6-MWT reached a steady state only in healthy subjects. Conversely, they increased throughout the test in CHF. This respiratory drift in patients could be due to their higher intensity maintained during the test. Concerning the ventilation, no significant difference was observed between CHF groups for resting and end-exercise 6-MWT values. However, as illustrated by the stepwise regression and by the VT/f relation, the pattern of breathing adopted during the 6-MWT was different between both CHF groups. Indeed, CHFD mainly increased their VT, whereas CHFP increased their VT and f in the same proportion during the test. Moreover, the VT/f slope in CHFD was higher than in CHFP. Thus, these patients have an altered ventilatory pattern throughout the 6-MWT, with an increased f at a given VT in comparison with CHFD (Fig. 2). These data indicate therefore a rapid shallow breathing in CHFP [28, 29], which has a lower energetic cost than deep breathing but is less efficient in terms of alveolar ventilation because of the relative increase of the dead space ventilation [33]. It has been previously demonstrated during a symptom-limited exercise test, that the VT/f slope is positively correlated with peak V'O2 [28] and that a downwards and to the right shift of the VT/f relationship is associated with a greater impairment of the functional capacity in CHF [29]. For the first time, we have studied the VT/f relationship during the 6-MWT. In our CHF population, the VT/f slope is weakly and also positively correlated with the distance walked, another classical index of CHF severity [27, 34]. As attested by the lower peak V'O2 and 6-MWT distances observed, our CHFP group is the most severe one. Thus, the present data confirms that in the most severe CHF, the ventilation adaptation to physical exercise is mainly due to the f increase.
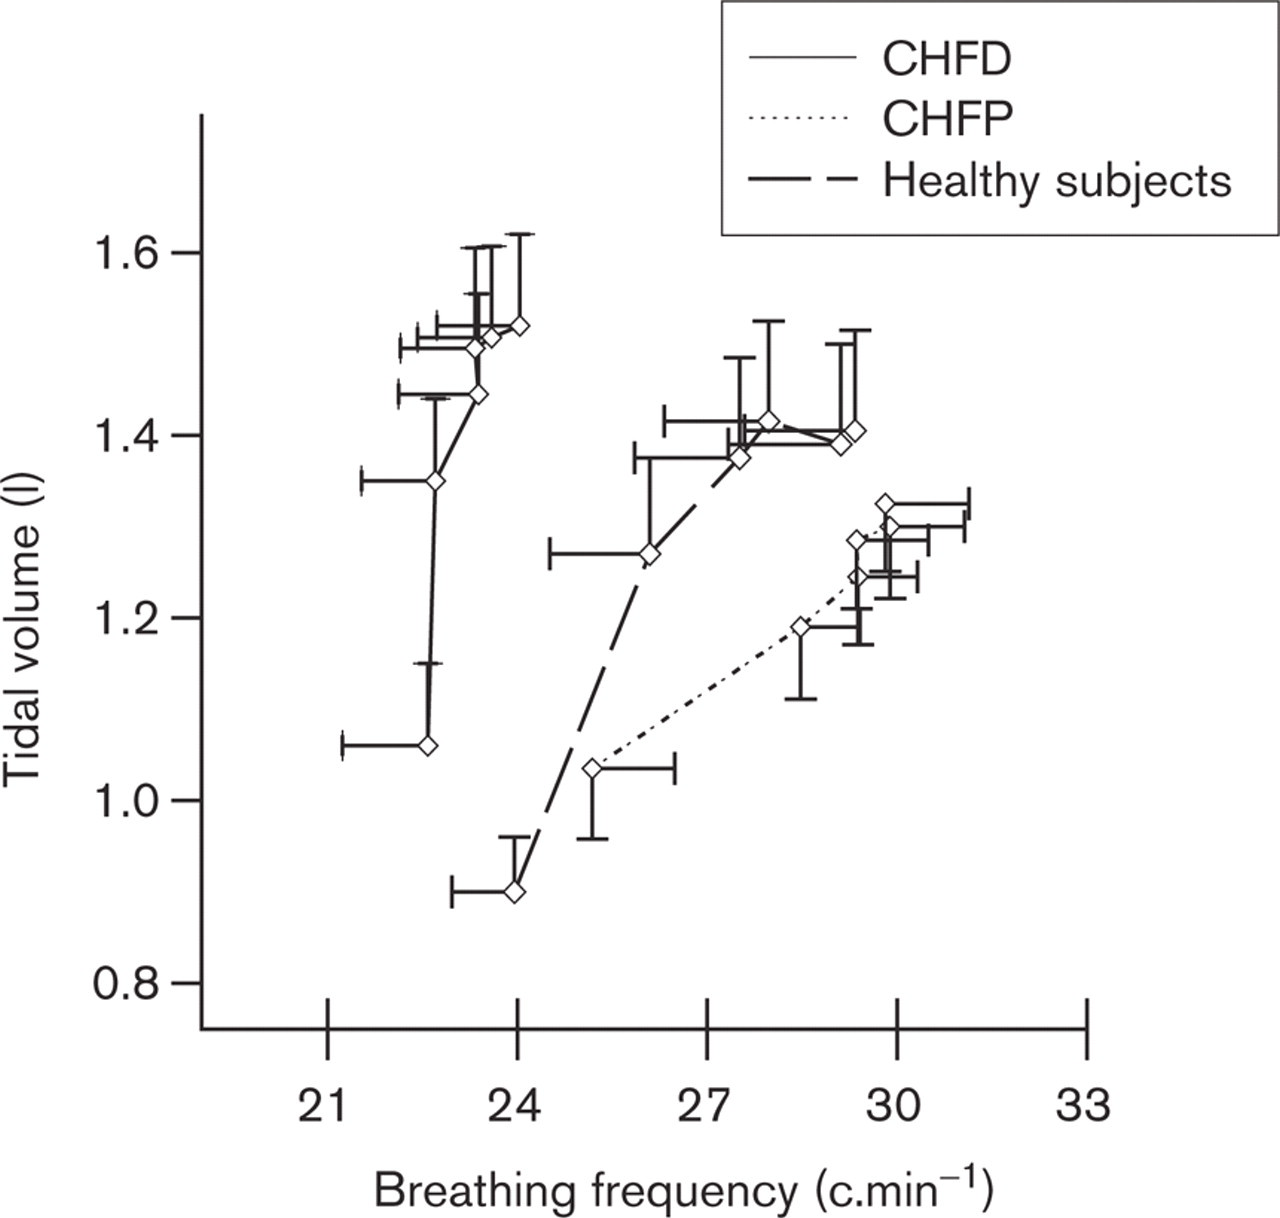
Relation between tidal volume and breathing frequency during the six-minute walk test in healthy subjects, chronic heart failure patients under optimal drug treatment (CHFD), and chronic heart failure patients under optimal drug treatment plus cardiac resynchronization (CHFP).
A HR drift has been observed in the three populations during the 6-MWT. However, as shown in Figure 1, the drift appeared over the last minute of the walking test in healthy subjects, whereas it was continuous throughout the 6-MWT in CHF. The higher relative intensity of exercise could explain the continuous drift observed in CHF.
Some potential limitations of our study should be considered. Firstly, the biomechanical factors and the numerous laps could limit the 6-MWT speed, mainly in healthy subjects. Secondly, because of the lack of breath-by-breath gas exchange recordings, we could not develop our analysis of the 6-MWT cardiorespiratory on-kinetics. Further investigations of the fast and slow components are needed. Thirdly, healthy subjects and CHF did not perform the same symptom-limited exercise test protocol. However, the stage duration was the same in both protocols (2 min) and the total duration of exercise was comparable in all populations (12.1 ± 0.4 min in healthy subjects versus 10.5 ± 0.6 min in CHF). Finally, since healthy subjects and CHF were not at the same absolute or relative work rates, we could not compare the 6-MWT cardiorespiratory parameter adaptations between them. In further studies, it would be interesting to investigate the effects of CHF on cardiorespiratory kinetics during a walking test performed at a given constant speed.
Conclusion
The 6-MWT is a constant-load exercise during which a V'O2 steady state is observed in CHFD and CHFP as in healthy subjects, with a slight delay observed in CHF. The 6-MWT intensity is above the ventilatory threshold and around 75 and 90% of peak V'O2 in healthy subjects and CHF, respectively. Moreover, the 6-MWT showed that each CHF group is characterized by specific ventilation components response, according to their own functional capacity. The lowest 6-MWT distance, and the most altered pattern of breathing were achieved by CHFP.
Footnotes
Acknowledgements
We sincerely thank doctors Christine Alonso, Alain Le Helloco and Dominique Pavin, and Christine Poulain for their invaluable help, and the medical and technical staff of the Centre Cardio-Pneumologique (Rennes). The authors also gratefully thank patients for their contribution and David James for English proofreading and rewriting