
Abstract
Background
No methodology is currently available to allow the combining of individual risk factor information derived from different longitudinal studies for a chronic disease in a multivariate fashion. This paper introduces such a methodology, named Synthesis Analysis, which is essentially a multivariate meta-analytic technique.
Design
The construction and validation of statistical models using available data sets.
Methods and results
Two analyses are presented. (1) With the same data, Synthesis Analysis produced a similar prediction model to the conventional regression approach when using the same risk variables. Synthesis Analysis produced better prediction models when additional risk variables were added. (2) A four-variable empirical logistic model for death from coronary heart disease was developed with data from the Framingham Heart Study. A synthesized prediction model with five new variables added to this empirical model was developed using Synthesis Analysis and literature information. This model was then compared with the four-variable empirical model using the first National Health and Nutrition Examination Survey (NHANES I) Epidemiologic Follow-up Study data set. The synthesized model had significantly improved predictive power (x2 = 43.8, P < 0.00001).
Conclusions
Synthesis Analysis provides a new means of developing complex disease predictive models from the medical literature.
Keywords
Introduction
An estimate of a person's risk for coronary heart disease (CHD) is important for many aspects of health promotion and clinical medicine. A risk prediction model may be obtained through multivariate regression analysis of a longitudinal study. For example, the CHD prediction model derived from the Framingham Heart Study has been widely used [1] and has been incorporated into the latest National Cholesterol Education Program Adult Treatment Plan III guidelines for the management of hypercholesterolemia [2]. However, the study was started long before many currently known risk factors were suspected. Therefore, new risk factors such as serum albumin, lipoprotein (a), homocysteine, C-reactive protein and plasma fibrinogen were not included in the Framingham CHD model [3,4]. Nevertheless, the relationship of those new risk factors with heart disease has been repeatedly demonstrated in many other longitudinal studies [5,6].
A key question would be: is it possible to update the Framingham CHD model? To answer these questions, all known risk factors, traditional as well as the emerging risk factors, need to be statistically evaluated together in a single longitudinal data set in a single study. Unfortunately, these data are rarely available. This is partially due to the prospective longitudinal study design; 5 to 10 years of follow-up are often required before a complete data set becomes available.
In this study, we introduce a method that we have named Synthesis Analysis. This method allows for the evaluation of the contributions of newer relevant risk factors and then allows for the development of a comprehensive prediction model from data derived from different studies. Without the requirement that all needed information come from a single data set, as with the usual empirical analysis, Synthesis Analysis is able to combine evidence from numerous longitudinal studies so that a comprehensive evidence-based disease prediction model can be built where an empirical model is not presently possible.
The purpose of this study is to evaluate the validity of the comprehensive prediction models derived from Synthesis Analysis.
Material and methods
Synthesis Analysis methodology
Synthesis Analysis constructs multivariate regression equations for the estimation of disease risk by integrating information from: (1) the univariate association (or age-and gender-adjusted association) of each independent variable with disease onset; and (2) correlations among all the independent variables. The univariate regression coefficients of each variable with the disease of interest may be derived from different longitudinal studies or from more comprehensive meta-analyses of the medical literature. The correlations between the independent variables would be available from a cross-sectional data set, which contains all the independent variables but not necessarily the outcome of interest.
The details of the Synthesis Analysis methodology are explained in the following six steps in a logistic regression format.
Step 1
The univariate association of the dependent variable (for example, D1 = logit of the probability of the onset of a disease) is calculated with the first independent risk factor variable (RF1), such as age, as the baseline equation, D1 = a + bu1RF1, where bu1 is the univariate regression coefficient (log of the relative risk or odds ratio) for the first variable. The intercept, a, is the mean of D1 if RF1 is mean-centered (value of RF1-mean of RF1). In other words, the intercept reflects the average incidence rate of the disease in a target population before the first variable is added.
Step 2
Using a cross-sectional data set of the predictor variables, such as the third National Health and Nutrition Examination Survey (NHANES III), D1 is calculated from the baseline equation, for each member of the data set.
Step 3
With the same cross-sectional data set, D1 is fitted as the dependent variable to the second risk factor of interest, RF2, using a weighted linear regression equation to obtain a regression coefficient (bc2). This regression coefficient represents the association of D with RF2 that has been ‘captured' in the baseline equation.
Step 4
The regression coefficient (bc2), derived from step 3, is compared to the univariate regression coefficient of RF2 (bu2) with the disease of interest. This coefficient is usually derived from the medical literature. The difference between them (bu2-bc2) reflects the association of RF2 with the disease that was not previously captured in the baseline equation. The difference will be treated as the ‘extra' regression coefficient (be2). If RF1 and RF2 are highly positively correlated then the difference could be very small and RF2 should not be added to the model.
Step 5
The new equation that reflects the joint association of RF1 and RF2 with the disease has the form D2 = a + bu1RF1 + be2RF2. This new equation is treated as a new baseline equation. The constant, a, remains approximately the same if RF2 is mean-centered.
Step 6
Steps 2 to 5 are repeated until all the independent variables are included in the final equation.
The key assumption of Synthesis Analysis, which is similar to any other meta-analysis, is that the input information, namely the associations of each risk factor with the disease outcome and the correlations among the multiple risk factors, are representative of the same underlying population. Therefore, the differences between the findings of different studies are assumed to be attributable to the random error of sampling and not to inherently different populations. If, however, significant heterogeneity is found between cohorts for a particular variable then its inclusion in the model should be reconsidered.
Comparison between Synthesis Analysis and regression analysis in one data set
The objective of this analysis was to see whether Synthesis Analysis could generate models that were close to what would be derived from regression analysis should a data set exist for a comparison. A second objective was to determine the magnitude of prediction power increase by adding a new risk variable while the input information was all from a single data set.
The data used were the follow-up study data set from the Framingham Heart Study. These data are the public-release version, which contain data from 5209 subjects. Data include baseline health risk information and up to 40 years of follow-up for onset of CHD. Details of the study design and procedures have been previously described [1].
Logistic regression was used as the empirical regression approach. CHD onset within 40 years was used as the outcome (1844 events), while gender, age, serum cholesterol, systolic blood pressure and body mass index were the risk factors or independent variables. Instead of using literature information for this analysis, all the input information used by Synthesis Analysis, the univariate regression coefficients of each independent variable and the correlation information among independent variables, was all from the same data set. A number of prediction models with different numbers of risk factors were developed by both logistic regression and Synthesis Analysis. Area under the curve (AUC) of the receiver operating characteristic (ROC) curve for each model was calculated.
Comparison of a base empirical model and a synthesized model in predicting CHD death
The objective of this analysis was to use an empirical data set to compare a simple empirical prediction model with a comprehensive synthesis model which used literature information. For this objective two comprehensive longitudinal data sets were needed, one for the development of a simple empirical risk model and one to compare this base model with a synthesized model developed by the addition of several risk factors to the base model using literature information. The Framingham Heart Study data set with follow-up outcomes, including CHD deaths, was the data set used to develop the base model. The first National Health and Nutrition Examination Survey (NHANES I) Epidemiologic Follow-up Study (NHEFS) met the requirement for a data set in which to compare the base and synthesized models. NHEFS included 20 years of follow-up outcomes including CHD deaths. The baseline survey of NHANES I was conducted on a nationwide probability sample of approximately 32 000 people, ages 1 to 74, from 1971 to 1975. Follow-up surveys were conducted among 14 407 subjects who were 25-74 years old at baseline (11 593 had complete data available). CHD mortality was recorded during the follow-up (591 events). The details of the study design were published elsewhere [7].
The base empirical logistic model included risk of age (in years), gender (male = 0, female =1), serum total cholesterol (TCHOL, mg/dl), and systolic blood pressure (SBP, mmHg).
Logit CHD death = −10.15741 −1.28756 × GENDER + 0.06662 × AGE + 0.00909 × TCHOL + 0.01962 × SBP.
The 20 year probability of CHD death = 1/(1 + exp [-logit CHD death]).
The synthesized CHD death model considered five additional risk factors; diabetes, smoking, BMI, serum albumin, and leukocyte count. These variables were chosen because they were available both in NHEFS (the test data set) and NHANES III (the data set used in the actual synthesis process). They were each widely accepted risk factors for CHD. The literature was searched for a consensus on the univariate effects of these variables. An exhaustive search and meta-analysis was beyond the scope of the needs for this validation. Published results from the NHEFS and the Framingham Heart Study were deliberately avoided where possible. Relative risks were chosen for use in modeling from studies that were relatively large and were representative of the literature in general.
For the effect of diabetes on CHD, the gender-specific risk among the ARIC cohort, as published in 1997, was chosen [8]. After adjustments (for sociodemographic characteristics, smoking status, ethanol intake, sports participation, and hormone replacement therapy), the relative risk of CHD onset for women was 3.45 and for men 2.52, for people with diabetes compared to those without diabetes. The effect of smoking on CHD death came from the Chicago Heart Association Detection Project in Industry [9] with a follow-up of 22 years. The univariate relative risk for female current smokers compared to non-smokers was 2.49; for men the relative risk was 1.72. The effect of body mass index on heart disease onset was derived from the Nurses Health Study and the Health Professional Follow-up Study [10]. The relative risk (adjusted for age, smoking status, and race) per body mass index unit was estimated from body mass index quintiles for both men and women. The relative risk for men was 1.077 per increase of 1 body mass index unit; for women the relative risk was 1.040. These values we used for diabetes, smoking, and BMI compared favorably with other reports on these risk factors.
Danesh et al. [11] published a meta-analysis of several risk factors for heart disease including serum albumin and leukocyte count. For albumin the relative risk (adjusted for smoking, lipid levels, blood pressure, obesity, and socioeconomic class) for CHD was 0.904 for each increase of 1 g/l. For leukocyte count the relative risk (usually adjusted for smoking, blood pressure, and obesity) was 1.156 per a rise of 109/l.
A synthesized model was developed using the Synthesis Analysis method as mentioned earlier:
lcdp1 = −10.15741 −1.28756 × GENDER + 0.06662 × AGE + 0.00909 × TCHOL + 0.01962 × SBP.
For men;
lcdp2 = lcdp1 + 0.8751 × (DIABETES −0.133)
lcdp3 = lcdp2 + 0.6079 × (SMOKE −0.417)
lcdp4 = lcdp3 + 0.0596 × (BMI −28.02)
For women;
lcdp2 = lcdp1 + 1.0304 × (DIABETES −0.234)
lcdp3 = lcdp2 + 1.0315 × (SMOKE −0.296)
lcdp4 = lcdp3 + 0.0245 × (BMI −29.45)
For both;
lcdp5 = lcdp4-0.800 × (ALBUMIN −4.0935)
lcdp6 = lcdp5 + 0.137 × (LEUKO −7.624)
cdp6 = 1/(1 + exp(-lcdp6))
The dependent variables lcdp1 to lcdp6 are the stepwise calculations of the logit of the probability of CHD death after adding each variable. The variable cdp6 was the final synthesized probability of CHD death within 20 years. Each variable was centered with a subtractant (e.g. 0.133 for diabetes among men) that was close to the mean for each variable. This was determined empirically and was used to keep the average probability of CHD death the same from step to step.
The prediction power of the two models was compared by applying both models to the NHEFS data set and testing the goodness of fit using logistic regression weighted by the length of follow-up. Observed CHD death was the outcome and the computed probability by the models was the independent variables. The statistical significance of the incremental improvements, in term of goodness of fit of the series of synthesized models over the base model, was assessed by the χ2 test of the likelihood ratio. The predication power of the two models were also compared by sensitivity, specificity and ROC curves, but when those parameters were calculated the length of follow-up time were not considered.
Results
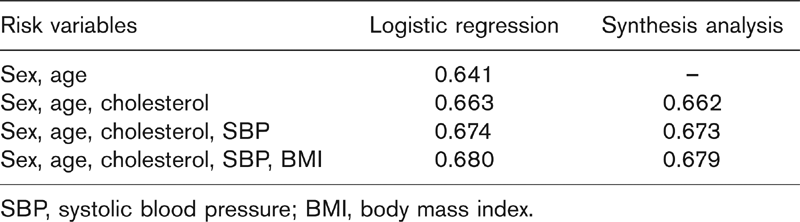
The comparison between Synthesis Analysis and conventional regression analysis was first made within a context that all information used to build both models are all contained in one data set. As shown in Table 1, when both models considered the same risk factors, the area under the curve (AUC) of the synthesized models were lower than the logistic models by about 0.001. The addition of the risk factors cholesterol, systolic blood pressure and body mass index by the synthesized model increased the AUC by 0.022, 0.011 and 0.006, respectively.
The comparison between Synthesis Analysis and conventional regression analysis was then made within a context that the conventional regression analysis generated a simple empirical model in one data set and a comprehensive synthesized model was developed by adding additional risk factor to this base model using literature information. Then the predictive power of the two models were compared in another empirical data set. As shown in Table 2 the goodness of fit of the final synthesized model was significantly higher than the base empirical model with χ2 of 43.8 (P < 0.00001). When the length of follow-up was not considered, comparisons of the AUC for the ROC curves showed an improvement from 0.802 to 0.812 (P = 0.13). Defining the top quintile of risk as high risk generated a sensitivity of 58% in the synthesized model, significantly higher than the empirical base model 55% (χ2 = 8.0, P = 0.005). The specificities were the same (82%) for both models.
Area under the receiver operating characteristic curve of a synthesized coronary heart disease model and a logistic regression model with different number of risk factors, from the Framingham follow-up study data
Discussion
Synthesis Analysis builds multivariate meta-analytic models by drawing the needed data from different sources rather than from a single source as is normally done. The initial model in the stepwise Synthesis process is either a simple incidence model (probability of disease onset based on age and gender) or a more complex risk model derived from the literature for a specific disease. Relative risks for additional risk factors for the disease are also derived from the literature. The actual construction of the model is done using a cross-sectional data set such as NHANES III. All of the necessary calculations are usually done with this data set. The process is stepwise in which, at each step, a new independent risk factor is added to the model. The beta used for each new factor is based on how much it adds to the model that exists at that point. If the new risk factor is highly correlated with the risk as predicted by the existing model, then there is little point in adding that new factor since it does not add any new risk information to the existing equation. The contribution of each risk factor to the emerging model (its beta) is based on its univariate (or solitary) contribution to disease risk minus the contribution that is already explained by the existing model up to that step. Hence a risk factor that is not highly correlated with the existing model, and also is a strong risk factor in its own right, will certainly be included.
Comparison of synthesized models of coronary heart disease death for incremental improvement in predictive ability among first National Health and Nutrition Examination Survey (NHANES I) Epidemiologic Follow-up Study (NHEFS) data
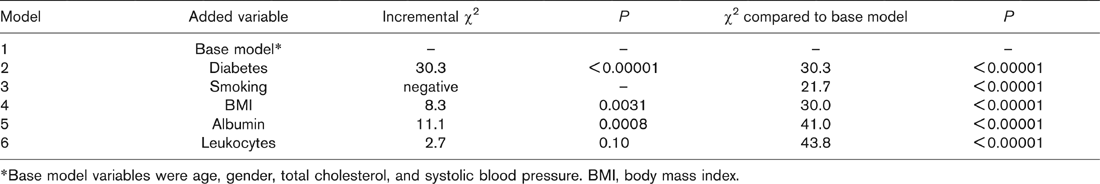
∗Base model variables were age, gender, total cholesterol, and systolic blood pressure. BMI, body mass index.
The first feature of Synthesis Analysis is that it is an approximation of the conventional regression approach which can be viewed as a drawback. The second feature of the Synthesis Analysis is that new risk factors can be added while the comprehensive data are not yet available. This should be viewed as an advantage. The comparison between those advantages and disadvantages were made in the first analysis and shown in Table 1. In that example, the benefits of including any of the considered risk factors, as measured by the increase in the AUC of the ROC (from 0.006 to 0.022), outweighed the approximation drawbacks which reduced the AUC of ROC by 0.001.
The third feature of Synthesis Analysis is that it is based on the assumption that the information on the correlations between risk factors and disease outcome are exchangeable across different studies, representing the same underlying population. Even though similar assumptions have been made by other across-study methodologies [12], deviation from this assumption is common because of the heterogeneous nature of different study populations.
This third feature can be viewed as both a disadvantage and an advantage of Synthesis Analysis. It is a disadvantage because variations will be generated from synthesized models depending on which study results are used as inputs even though this variation can be lessened by careful, comprehensive meta-analyses. Those disadvantages could be reflected as a lower prediction power when using a specific empirical data set which may contain different risk-outcome associations than were used as the input of Synthesis Analysis. On the other hand however, this unique feature of Synthesis Analysis also could be viewed as an advantage because relying on a wide range of studies may increase the external validity of the method. The more robust and stable meta-analyzed betas could better represent the underlying population. Hence, the synthesized model might be more generally applicable to a wider population than any single empirical model based on one cohort of subjects. The disadvantageous part can be tested by applying the model to a specific data set; the advantageous part however, cannot be empirical tested. A good analogy would be that the validity or the benefit of conventional meta-analysis can only be evaluated by scrutinizing the meta-analysis process itself; it cannot be empirically tested in a given data set.
In the presented second analysis the prediction power in a specific data set, NHEFS in this case, is the outcome for evaluation. Therefore any deviation of risk factor-CHD death associations in these data from what were used as input of Synthesis Analysis would cause a reduction of prediction power in this analysis. In other words, the second analysis tested the disadvantageous part of the previously mentioned third feature of Synthesis Analysis. This made this validation analysis very conservative, meaning the benefit of the synthesized model could be higher than that shown in the results.
Similar to the first analysis, the second analysis also tested the effect of a synthesized model on the predication power because of the mathematic approximation (drawback) and benefit of adding additional risk factors.
The results showed that the prediction power of the more comprehensive synthesized model is statistically higher than that of the simple empirical model while the prediction power was evaluated as the goodness of fit in the NHEFS data.
NHEFS is a longitudinal and censored data set meaning different individuals may have different lengths of follow-up time. When the goodness of fit was evaluated, the length of follow-up time in the NHEFS data was controlled, but they were not considered when the sensitivity, specificity and ROC were calculated. This may partially explain why the synthesized model was only shown to be modestly improved when those parameters were used.
In this second analysis, the increase of predication power by Synthesis Analysis was achieved even though the input information used in the Synthesis Analysis was different from the risk factor-outcome association in the NHEFS data. When developing the synthesized model we were not aware of the predictive power of the variables available in NHEFS. It is not too surprising that two of the nine variables we chose were not significantly predictive of CHD death in the NHEFS. The robustness of the Synthesis Analysis was demonstrated by its ability to obtain increased predictive accuracy despite deviations among variables in a given cohort. The strength of this technique is in developing models where all the variables are not available in a single data set.
Synthesis Analysis has some inherent limitations. First, subjective selection is involved in identifying the univariate associations of individual risk factors with disease from multiple studies from the literature. Careful meta-analysis can reduce this selection bias somewhat. Second, Synthesis Analysis cannot provide an estimate of the standard deviation for each estimated probability from the equation. Therefore, no statistical test can yet be done to test the significance of the estimated probabilities. Third, Synthesis Analysis is unable to detect, and then include, any previously undetected interactions among any of the new variables in the model. Synthesis Analysis, like meta-analysis, cannot generate new information but only summarize currently existing information. However, if interactions have been detected and documented in the literature then these terms can be added in a manner similar to terms without interactions. This was done for the three variables with different betas for men and women. Fourth, the validity of one synthesized model will not guarantee the validity of others. Diseases and their predictors are different. The validity of any synthesized model will depend on the balance of the benefit of including more risk factors and the cost of the noise that is introduced in the process. Noise would come from the variability in literature reports, the added assumptions, and the inherent approximation of the Synthesis Analysis procedure.
In this paper we introduced a statistical method, Synthesis Analysis, which can combine multiple longitudinal research findings from the medical literature to build evidence-based chronic disease prediction models where none now exist. Synthesized models could provide useful tools for health professionals, health promotion and managed care organizations in assessing the disease risks of individuals. Research will continue to further define the applicability and limitations of this method.