
Abstract
Background
Imprecision in measurement of risk factors leads to underestimation of associations with disease outcomes (through regression dilution bias). We examine the extent of this bias for established and novel risk factors for coronary heart disease (CHD) and consider the consequences for CHD prevention.
Design
Prospective cardiovascular study of middle-aged British men followed up over 20 years.
Methods
Repeated measurements of blood lipids, blood pressure and insulin were available at intervals of 1 week, 4, 16 and 20 years; repeated measurements of homocysteine and haemostatic factors were available over 1 week and 4 years.
Results
The use of single baseline measures of both established and novel risk factors in analysis results in marked underestimation of risk associations, increasing over time. The use of a single baseline measurement of total cholesterol results in a 47% (95% confidence interval 44 to 50%) underestimation of its association with CHD risk during the third decade of follow-up; for diastolic blood pressure the corresponding underestimation is 76% (95% confidence interval 73 to 78%). Ignoring the consequences of regression dilution can also lead to error in the assessment of other risk markers, even those measured precisely.
Conclusions
The importance of risk factors for CHD can be greatly underestimated by using a single baseline measure in prospective study analyses. Studies that wish to estimate associations between disease risk and usual exposure levels need to take regression dilution effects into account. Failure to do so can lead to serious misinterpretation of the importance of CHD risk factors. Eur J Cardiovasc Prevention Rehab 11:125–134 © 2004 The European Society of Cardiology.
Introduction
In prospective studies the analysis of incident disease in relation to ‘baseline’ risk factors measured on a single occasion tends to underestimate associations between disease rates and ‘usual’ exposure levels, a statistical phenomenon known as regression dilution [1]. Regression dilution bias is caused by random fluctuations in baseline measurements, a combination of measurement error and real but temporary deviations from the usual level, as well as true long-term changes in the usual level. These variations result in biased estimates of usual exposure levels, primarily due to the phenomenon known as ‘regression to the mean’ [2]. The importance of the bias is its tendency to underestimate the strength of potentially important aetiological associations, and therefore to underestimate the potential for coronary heart disease (CHD) prevention.
Regression dilution bias is particularly relevant to coronary heart disease, in which several of the key established and novel risk factors are imprecisely measured. Previous reports based on the Whitehall and Framingham studies [3, 4] have estimated that for risk factors for heart disease, the true associations for established risk factors, particularly total cholesterol and blood pressure, can be underestimated by approximately one-third during the first decade, one-half during the second and by as much as two-thirds during the third decade of follow-up [5]. However, with the exception of these studies, there is little published information on the extent of regression dilution at different follow-up intervals either for established or for novel coronary risk factors. Moreover, although the effects of regression dilution in individual factors have been explored, the impact of regression dilution of one risk factor on the relations of other factors (either imprecisely or precisely measured) with disease risk have been little studied. In this study we explore regression dilution for a range of measurements, including the established risk factors for CHD (blood lipids and blood pressure), a range of novel potential risk factors (including glucose, insulin, fibrinogen, fibrin D-dimer, homocysteine, C-reactive protein and von Willebrand factor, all of which have been associated with coronary heart disease risk [5–11]), and other potentially relevant haemostatic measurements [factor VII and tissue plasminogen activator (t-PA)]. We also examine how regression dilution of blood pressure and total cholesterol affects estimates of hazard ratios for CHD (both those measured precisely and those subject to variation over time) and consider the implications for CHD prevention.
Methods
The British Regional Heart Study (BRHS) is a prospective study of cardiovascular disease in one general practice in each of 24 British towns, representing all major British regions [12]. Participants were enrolled in 1978–80 aged 40–59 years and have been followed up for all-cause mortality using the NHS Central Registers and for cardiovascular morbidity through regular 2-yearly reviews of general practice records [13]. Assessments of study men took place at baseline (in all towns), at 16 years [in two towns only, one with high and one with low CHD mortality (Dewsbury and Maidstone)] and at 20 years (in all towns). Three observers made all measurements at baseline and 20 years; one observer made all measurements at 16 years. At all examinations (carried out between 0830 and 1830 h), measurement of blood pressure, blood lipids (total, low-density lipoprotein (LDL) and high-density lipoprotein (HDL) cholesterol, triglyceride), glucose and insulin were made. At the 16- and 20-year re-examinations additional measurements of potential risk factors including homocysteine, haemostatic and inflammatory markers (including fibrinogen, factor VII, C-reactive protein, D-dimer, t-PA antigen and von Willebrand factor) were measured. Men were not asked to fast at the baseline or 16-year screenings; at the 20-year re-screening, all men not taking insulin or oral hypoglycaemic treatment for diabetes were asked to fast for a minimum of 6 h, during which they were instructed to drink only water. In order to estimate short-term within-subject variability in both established and novel risk factors, physical and biochemical measurements were repeated 1 week apart on an age-matched sample from a local general practice in Islington (North London) studied in 2000 at the same time as the BRHS 20-year re-screening and using identical measurements. At each time point men completed a questionnaire ascertaining whether they had ever had a doctor diagnosis of angina, myocardial infarction or other form of CHD [14] and about their current and previous history of cigarette smoking.
These data therefore provide measurements of risk factor variability over periods of 1 week (local general practice participants studied in 2000), 4 years (Dewsbury and Maidstone 1996–2000), 16 years (Dewsbury and Maidstone 1980–1996) and 20 years (all towns 1978/80–1998/2000).
Blood pressure
At each screening, assessment of blood pressure was measured twice in succession in the right arm, with the subject seated and the arm supported. At the baseline screening blood pressure was measured using the London School of Hygiene and Tropical Medicine sphygmomanometer. At the 16- and 20-year re-screenings, as well as at the short-term repeatability study, a Dinamap 1846 oscillometric blood pressure recorder was used; over-reading of systolic pressure by the instrument [15] was corrected in analysis. For the baseline and 20-year screenings, blood pressure readings were adjusted for observer variation within each town [16]. The mean of the two blood pressure measurements on each individual was used in analyses throughout.
Blood analyses
At the baseline survey, blood samples were separated and transferred overnight to central laboratories; at follow-up they were separated and frozen at −20°C on the day of collection and transferred in batches to central laboratories.
Blood lipids
At baseline, serum total cholesterol was measured by a modified Liebermann–Burchard method on a Technicon SMA 12/60 analyser and HDL cholesterol by the Liebermann–Burchard or enzymic procedures after precipitation with magnesium phosphotungstate; triglycerides were measured using an enzymic method [17]. At both 16 and 20 years, total cholesterol was measured using the method of Siedel [18] and HDL cholesterol using the method of Sugiuchi [19], both on a Hitachi 747 automated analyser which also analysed triglyceride concentrations. LDL-cholesterol values were calculated using the Friedrickson–Friedwald equation throughout. All measurements were adjusted for the effects of time of day and (at 20-year follow-up) for time since last meal [20, 21].
Insulin
Serum insulin was measured on all occasions using the same enzyme-linked immunosorbent assay (ELISA) assay which does not cross-react with proinsulin [22].
Haemostatic and inflammatory variables and homocysteine
Haemostatic and inflammatory variables were measured in citrated blood plasma. Fibrinogen was measured with the Clauss method. Plasma levels of t-PA antigen and D-dimer were measured with ELISA as was von Willebrand factor (vWF) antigen. C-reactive protein was assayed by ultrasensitive nephelometry. Serum total homocysteine was determined using a modified automated assay, based on pre-column derivatization with monobromobimane, followed by reverse phase high performance liquid chromatography with fluorescence detection.
Assessment of coronary events
Information on death was collected through the established ‘tagging’ procedures provided by the National Health Service registers in Southport (England and Wales) and Edinburgh (Scotland). Fatal events were defined as deaths with ischaemic heart disease (ICD-9 410–414) as the underlying cause including sudden death of presumed cardiac origin. Evidence regarding non-fatal heart attacks were obtained by reports from general practitioners and by 2-yearly reviews of the patients’ notes including hospital and clinic correspondence, through to the end of the study period [13]. A non-fatal heart attack was diagnosed according to the World Health Organization criteria, which included any report of myocardial infarction accompanied by at least two of the following: a history of severe chest pain, electrocardiographic evidence of myocardial infarction, and cardiac enzyme changes associated with myocardial infarction. Major coronary heart disease was defined as non-fatal myocardial infarction or death from coronary heart disease.
Statistical methods
Estimating the regression dilution ratio
The regression dilution ratio (RDR) is the ratio of the uncorrected association (usually on a log scale) to the corrected association. Various methods have been proposed for its estimation [23]. In this paper, we consider two ‘regression-based’ methods developed by MacMahon et al. [1] and Rosner et al. [24]. MacMahon's method identifies pairs of observations for each individual at various time intervals (the ‘baseline’ and ‘follow-up’ measurements), and categorizes individuals into five groups defined by the quintiles of the baseline measurements. For each group the mean follow-up level is an unbiased estimate of the ‘usual’ level for the group, and the range of these means relative to the range of the original baseline means provides an unbiased estimate of the RDR. Rosner's method also uses the relationship between the follow-up and baseline measurements to correct for regression dilution bias, estimating the RDR by regressing the follow-up measurement on the baseline, and obtaining the regression slope. Although estimates of the regression dilution ratio are consistent between the two methods applied, estimates based on Rosner's method are referred to in the remainder of this paper as they can be estimated more precisely (since they use all the data in the estimation). MacMahon's method is quoted in the discussion when comparing results with other studies that have used this method of estimation, and is used in Figure 1 to display graphically the effects of regression dilution. We note that neither method assumes that the mean risk factor level needs be the same at the baseline and follow-up measurements. Estimates are presented with 95% confidence intervals (CI) (see Appendix).
Association between baseline/usual measurement levels and disease risk
A Cox proportional hazards model was used to examine the relative hazards for major CHD. Analyses were adjusted for baseline age, smoking status, history of previous coronary heart disease, diastolic blood pressure and total cholesterol. In multivariate models when two or more variables are measured with error, it has been shown that observed regression coefficients may either underestimate or overestimate the true regression coefficients [24, 25], particularly if the variables are highly correlated [26]. To account for this, we have used estimates of the corrected hazard ratios based on methods developed by Rosner et al. [24] for the correction of regression estimates in logistic regression (see Appendix). These estimates have been shown to be appropriate (consistent) for the analysis of survival data in Cox regression models [27].
Results
Of the 7735 men examined at baseline in 1978–80, 5658 survived the following 20 years and 4252 of these attended the 20-year re-screening. In Dewsbury and Maidstone, of 643 men examined at baseline, 532 survived to 1996 and 425 (80%) participated in the 16-year re-screening. Of these, 400 survived to 2000 and 297 (74%) participated in the 20-year re-screening. The short-term variability study included 112 men who completed all measurements at two screenings taken a week apart. Data on regression dilution ratios for the various measurement outcomes after 1 week and 4, 16 and 20 years of follow-up are therefore based on 112 men, 297 men, 425 men and 4252 men respectively.
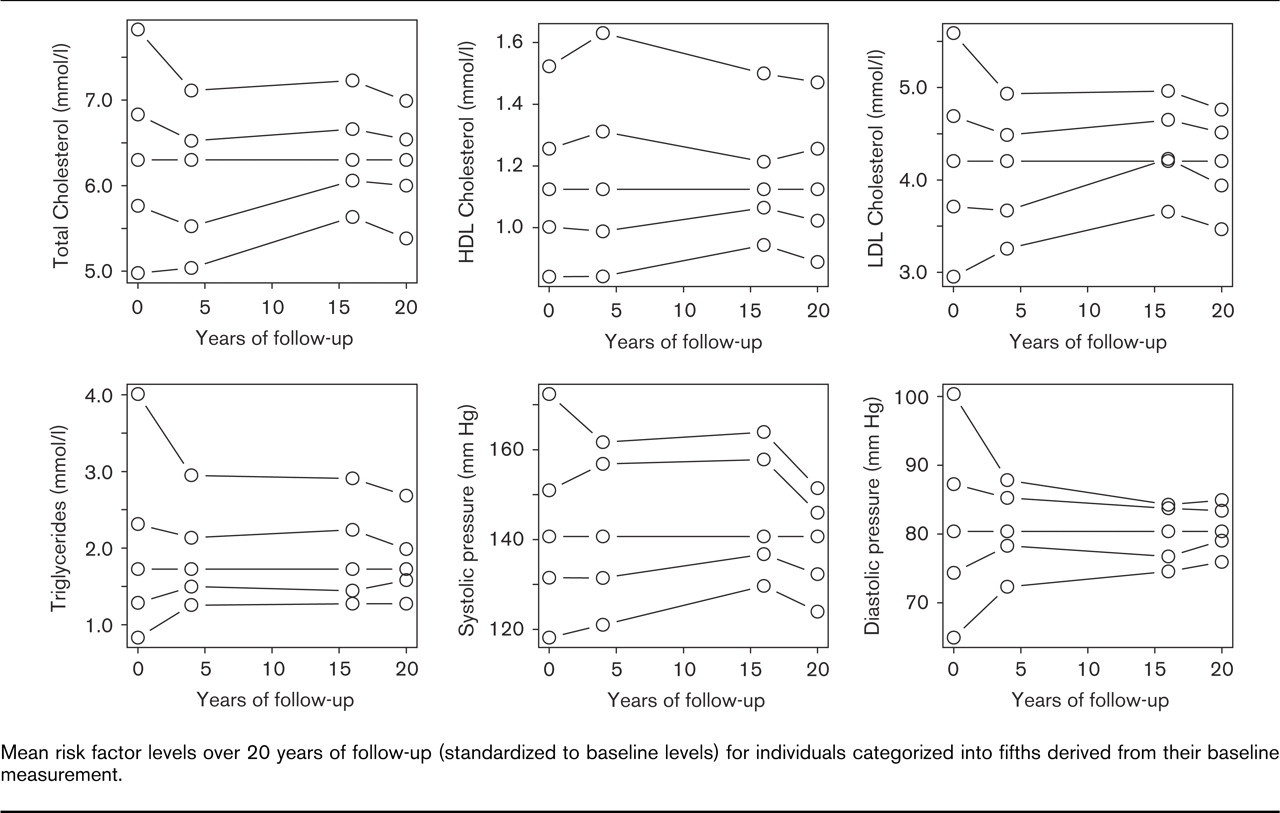
Mean risk factor levels over 20 years of follow-up (standardized to baseline levels) for individuals categorized into fifths derived from their baseline measurement.
Characteristics of the study population
Table 1 shows the mean values of selected characteristics of the men who attended each of the screening examinations. For blood pressure, it is noticeable that for the short-term variability study the mean blood pressure (both systolic and diastolic) was lower at the second measurement than the first. Over 20 years, mean blood pressure increased by approximately 6 mmHg (systolic) and 4 mmHg (diastolic). Blood lipids were reasonably constant over short periods, but generally fell over 20 years (mean total cholesterol decreased from 6.3 mmol/l in 1980 to 6.0 mmol/l in 2000). Men who died before the 20-year examination or survived but failed to attend the 20-year examination had higher baseline systolic and diastolic blood pressure than surviving men that attended the 20-year examination (both P < 0.0001). However, baseline levels of triglyceride, total cholesterol, LDL cholesterol and HDL cholesterol did not differ significantly between these groups. For men in Dewsbury and Maidstone, there were no differences in baseline blood lipids (triglycerides and total, LDL and HDL cholesterol) or blood pressure levels between those men that attended both the 16- and 20-year screenings and those who did not.
Estimates of the regression dilution ratio
Table 2 shows estimates of the regression dilution ratio (RDR) with 95% confidence limits for each of the measurements after 1 week and 4, 16 and 20 years of follow-up; Figure 1 shows corresponding data for blood lipids and blood pressure. Estimates of the RDR are presented for both of the described methods.
The effects of regression dilution are immediate and become more marked with increasing length of follow-up. Irrespective of the duration of follow-up, the effect of regression dilution is greatest for diastolic blood pressure, and lowest for HDL cholesterol. The ranking of RDRs appear consistent over different follow-up periods, with the exception of insulin and glucose where short-term regression dilution is modest, but becomes considerably more marked from 4 years onwards. The RDRs for novel risk factors are similar in magnitude to those of established risk factors, generally lying between those of total cholesterol and diastolic pressure.
Mean (standard deviation/interquartile range) measurement levels of selected characteristics of the men over periods of 1 week, 4, 16 and 20 years. In each case, men that attended only the first screening in the pair are presented alongside those that attended both screenings
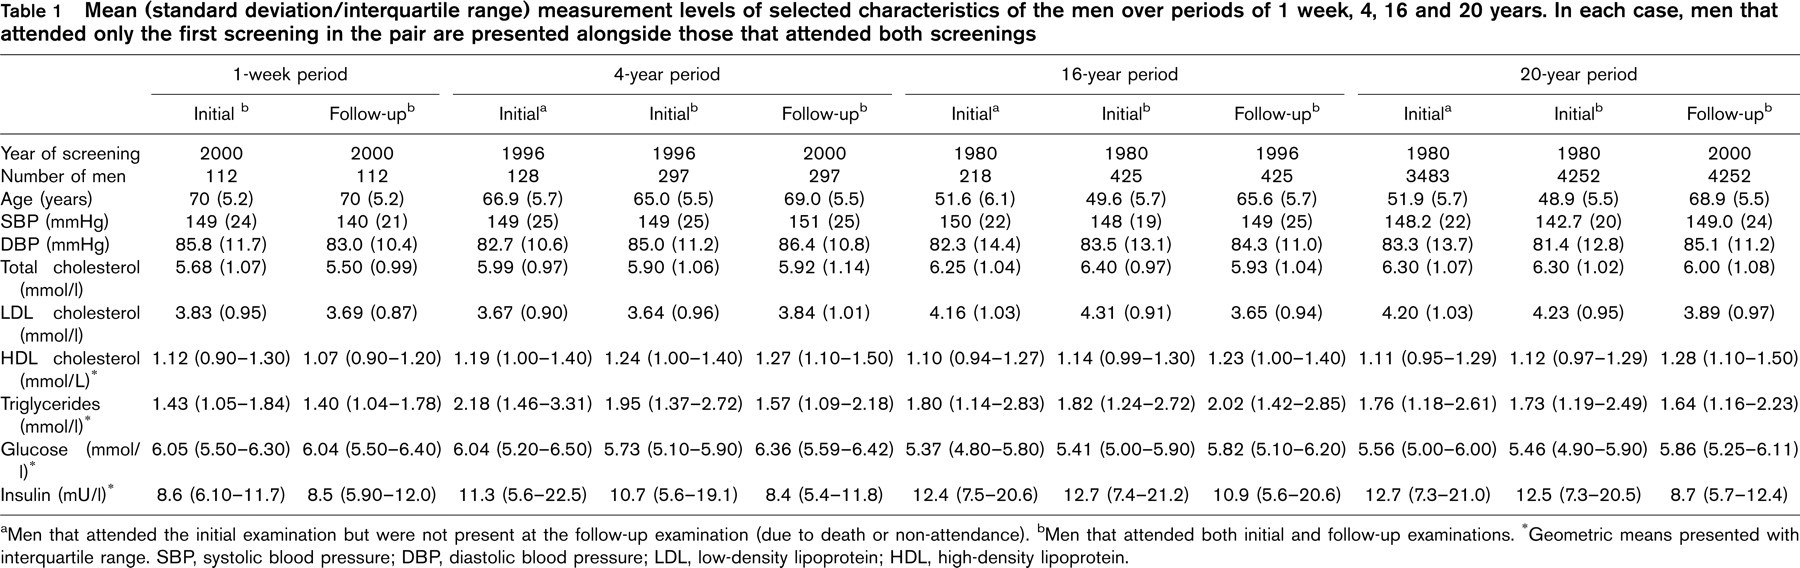
aMen that attended the initial examination but were not present at the follow-up examination (due to death or non-attendance). bMen that attended both initial and follow-up examinations. ∗Geometric means presented with interquartile range. SBP, systolic blood pressure; DBP, diastolic blood pressure; LDL, low-density lipoprotein; HDL, high-density lipoprotein.
The effects of measurement error and short-term variation are apparent even over a 1-week period; use of baseline measures as estimates of usual levels would result in short-term associations being underestimated by approximately 10–15% for total cholesterol, LDL cholesterol, triglycerides, insulin, fibrinogen, factor VII, D-dimer and homocysteine, by approximately 20% for glucose and von Willebrand factor, by a quarter for C-reactive protein and a third for t-PA and systolic and diastolic blood pressure. Associations with HDL cholesterol and the ratio of total to HDL cholesterol are the most accurately measured, being hardly affected over this period. After 4 or more years, associations with usual levels would be underestimated by less than 15% for HDL cholesterol, by between 25–35% for total cholesterol, triglyceride and total: HDL cholesterol, 40–50% for systolic and diastolic blood pressure, LDL cholesterol and glucose and by over 60% for insulin. For homocysteine and the haemostatic and inflammatory markers, the use of baseline measures to estimate associations with usual levels 4 or more years later would result in underestimation by between 40–50% for fibrinogen and C-reactive protein, approximately 30% for von Willebrand factor and t-PA, and 25% for factor VII, D-dimer and homocysteine. For long-term associations, say those occurring 20 or more years after baseline, the effects of regression dilution are greatest for diastolic blood pressure and insulin, where ‘baseline’ associations would underestimate true associations at this time by up to three-quarters (76% for diastolic blood pressure and 73% for insulin). Associations would be underestimated by approximately two-thirds for glucose, one-half for systolic blood pressure, total cholesterol, LDL cholesterol and triglyceride, one-third for the ratio between total and HDL cholesterol and one-quarter for HDL cholesterol.
Disease severity, treatment, screening attendance and the RDR
Estimates of the RDR over 20 years for men with no evidence of CHD at the 20-year examination were compared with those for men who developed CHD (myocardial infarction or angina) during the follow-up period (Table 3). The effects of regression dilution for total, LDL, HDL and total: HDL cholesterol, systolic and diastolic blood pressure and glucose were significantly greater amongst individuals with established CHD than for individuals with no evidence of CHD. No differences were observed for the regression dilution ratio for triglycerides or insulin estimated over 20 years. Estimates of the RDR for blood pressure over 20 years were also compared between men that started receiving blood pressure-lowering treatment during follow-up (n = 1139), and all remaining men (n = 3113). For both systolic and diastolic pressure, the observed RDR estimates for individuals starting medication during follow-up was somewhat lower than for those not starting medication (0.37 versus 0.60 for systolic, 0.18 versus 0.30 for diastolic; both P< 0.0001). Of the 425 men who attended for examination at 16 years, RDR estimates over the 16-year period were similar for men who attended the 20-year examination (n = 297) and those who did not (n = 128) (data not presented).
Estimates of the regression dilution ratio [95% confidence interval (CI)] over intervals of 1 week, and 4, 16 and 20 years
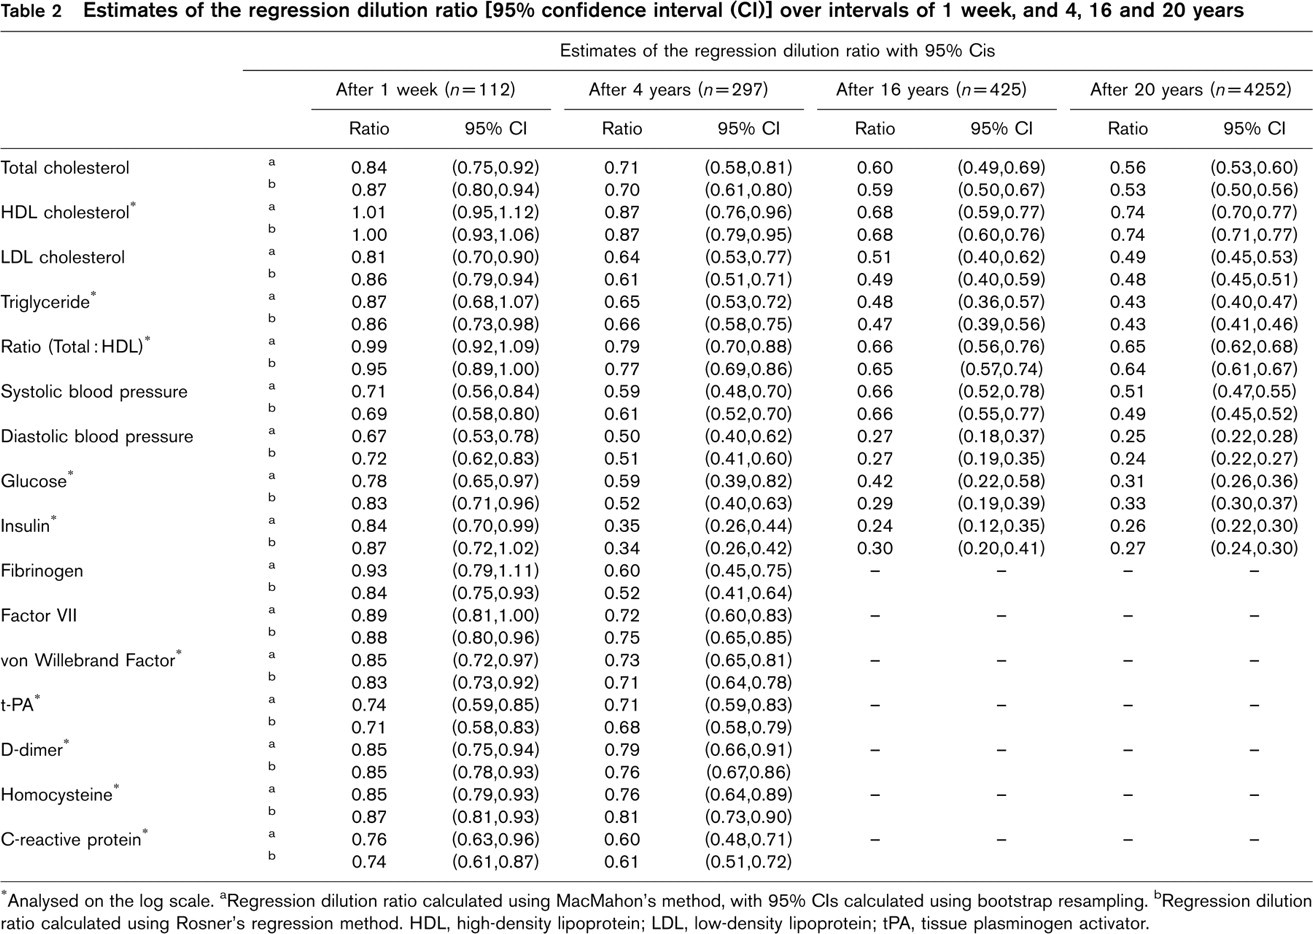
∗Analysed on the log scale, aRegression dilution ratio calculated using MacMahon's method, with 95% CIs calculated using bootstrap resampling. bRegression dilution ratio calculated using Rosner's regression method. HDL, high-density lipoprotein; LDL, low-density lipoprotein; tPA, tissue plasminogen activator.
Effects of adjustment for regression dilution bias on risk of major CHD, and on other risk factors
We investigated the effect of adjustment for regression dilution in two major imprecisely measured CHD risk factors, blood pressure and serum total cholesterol, on their relations with CHD outcome, and with the influence of other factors generally regarded as precisely measured – age, previous history of CHD and smoking status. Relative hazards for major coronary heart disease risk in the long term (15–25 years after baseline) adjusted for age, baseline evidence of CHD, diastolic blood pressure, total cholesterol and smoking status are shown in Table 4 both before and after correcting for the effects of regression dilution at 20 years. Four models are presented, all of which assume that age, history of previous CHD and smoking status are known precisely. The first model corresponds to an analysis using baseline measures alone, and ignores the effects of regression dilution for both total cholesterol and diastolic blood pressure. This analysis provides the ‘naïve’ hazard ratio estimates corresponding to a 10 mmHg increase in DBP and a 1 mmol/l increase in cholesterol of 1.19 (95% CI 1.15 to 1.24) and 1.35 (95% CI 1.28 to 1.41), respectively. The second model corrects for the effects of regression dilution for DBP only. This results in an increase of the adjusted hazard ratio for DBP to 2.03 (95% CI 1.72 to 2.47), and small increases in the hazard ratios of the other factors. Similarly, the third model in Table 3 corrects solely for regression dilution of total cholesterol, increasing its hazard ratio to 1.73 (95% CI 1.56 to 1.89). Again, slight increases in the hazard ratios for the other factors are observed. Correction for regression dilution of both total cholesterol and DBP is shown in the final model, where hazard ratio estimates for DBP and total cholesterol increase to 2.55 (95% CI 2.08 to 3.28) and 1.91 (95% CI 1.69 to 2.15), respectively. These estimates are greater than those obtained using single adjustments alone (models 2 and 3). In model 4, where multiple correction for regression dilution in both DBP and total cholesterol is performed, the estimated hazard ratios for age, smoking and history of CHD also increase due to the within-person variation in DBP and total cholesterol. The hazard ratio for age increases from 1.07 to 1.10, whilst for history of coronary heart disease it increases from 2.22 to 2.74. Estimated hazard ratios for ex-smokers and current smokers relative to non-smokers increase from 1.31 and 1.96 before correction to 1.38 and 2.24 after correction.
Estimates of the regression dilution ratio (RDR) (SE) over 20 years for men with doctor diagnosed coronary heart disease (CHD) (definite myocardial infarction or angina) compared with men with no history of CHD. Results are derived from Rosner's method of estimation (see statistical methods)
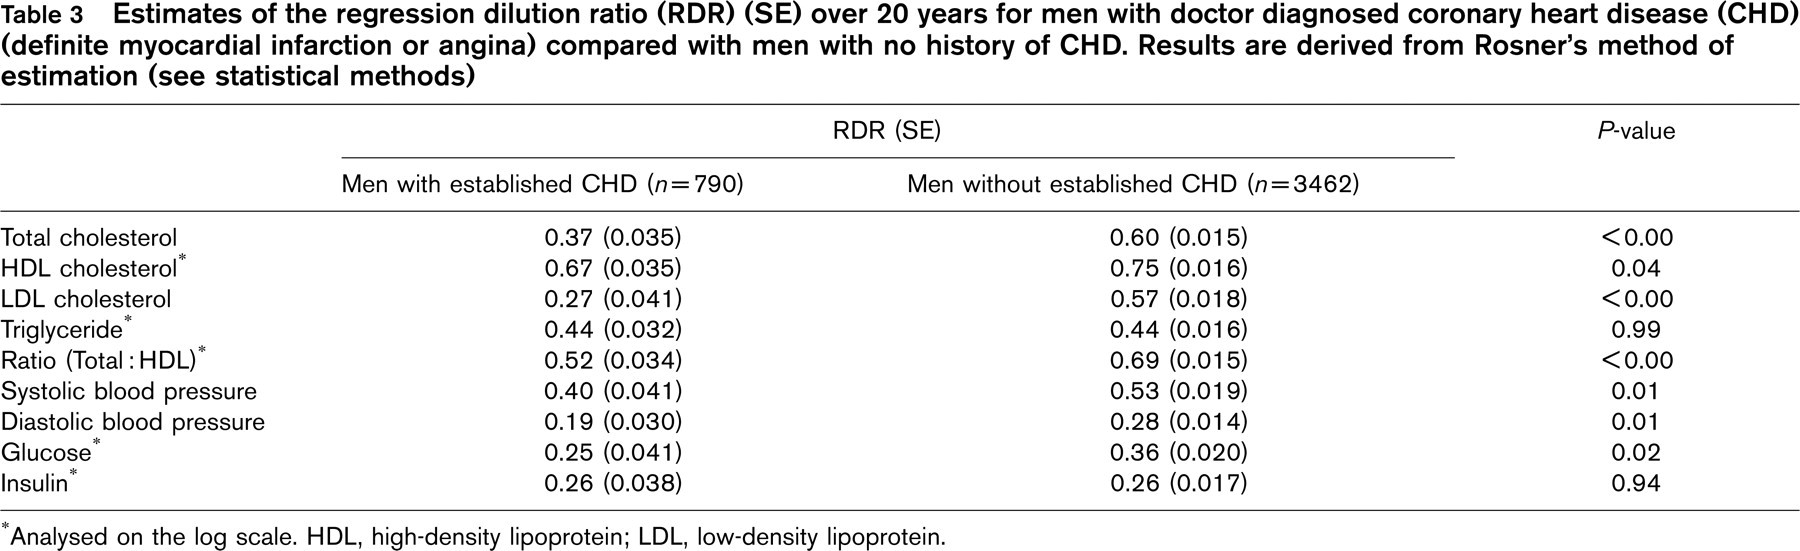
∗Analysed on the log scale. HDL, high-density lipoprotein; LDL, low-density lipoprotein.
Discussion
The results of this study suggest that the use of baseline levels of physical, biochemical and haemostatic measurements leads to marked underestimation of their associations with disease risk, and that the extent of this underestimation increases with duration of follow-up. Long-term associations with CHD (say those occurring 15–25 years after baseline) would be underestimated by about one-half for systolic blood pressure and blood lipids (total cholesterol, LDL cholesterol and triglyceride) and three-quarters for diastolic blood pressure, whilst associations between glucose tolerance or insulin resistance and CHD would be underestimated by two-thirds or more if based on single baseline measures of insulin and glucose. In contrast, regression dilution effects for HDL cholesterol and the ratio of total to HDL cholesterol were less marked, so that the use of a baseline HDL measurement to estimate associations with disease risk 20 years later would only result in underestimation by about one-quarter.
Validity of regression dilution estimates
The ‘regression-based’ methods used in this paper can be used to calculate a valid correction factor when the distributions of the baseline and follow-up measurements are different (as may be expected in an ageing cohort), and it is for this reason that they have been preferred to other correlation-based approaches [23]. Though the estimates of RDRs over different follow-up periods in this paper are based on different individuals at somewhat different ages, it has previously been shown that RDR estimates are reasonably independent of age [5]; indeed, in this study estimates of the RDR evaluated over 20 years were generally similar between men originally aged 40–44, 45–49, 50–54 and 55–59 years at entry. Moreover, our estimates of RDRs for systolic, diastolic blood pressure and total cholesterol after 20 years, 0.51, 0.25 and 0.56, respectively, are reasonably consistent with those of the Framingham Study (0.34, 0.26 and 0.43, respectively) and the Whitehall Study (0.32, 0.29 and 0.28, respectively) measured after a longer follow-up period (26 years) [5]. A recent study of the effects of regression dilution for homocysteine levels [28] presented RDRs of 0.83 at 2 years, 0.71 at 6 years and 0.53 at 12 years. Again this is consistent with our estimate of 0.76 taken over a 4-year period (estimated using the same method). With regard to haemostatic and inflammatory variables, our analyses are also in agreement with the limited number of previous publications [9, 11, 29–31]. Though the loss of subjects to follow-up may have introduced some bias to the RDR estimates, our finding that the effects of regression dilution are generally greater among subjects developing CHD during the study period (which would presumably also apply among subjects dying of CHD and not re-examined) suggest that our estimates of the extent of regression dilution are essentially conservative.
Earlier reports on the effects of regression dilution have restricted themselves to considering one risk factor at a time. However, our analyses have shown that simultaneous adjustment for regression dilution of more than one variable can actually lead to hazard ratio estimates greater than those obtained through single adjustments alone (see Table 4). These effects apply not only to factors measured imprecisely (for example, total cholesterol or blood pressure) but also factors characterized with reasonable precision (for example, cigarette smoking history, doctor diagnosis of CHD). In our analyses, correcting for regression dilution in both DBP and total cholesterol had the residual effect of increasing estimated hazards for age, smoking status and history of CHD, three variables that can be thought of as precisely measured.
Implications for CHD prevention
These results suggest that the strength of the relationships between both established and novel risk factors and CHD outcomes are markedly underestimated unless regression dilution is taken into account. This underestimation may also have implications for other risk factors, including those measured imprecisely and those measured precisely. The findings are of particular importance for the aetiology of CHD, and particularly for those established risk factors known to be causally related to CHD, particularly total cholesterol and blood pressure. Adjusting for regression dilution in both DBP and total cholesterol, a usual increase in DBP of approximately 7 mmHg or total cholesterol of 1.1 mmol/l was found to correspond to a two-fold difference in the risk of a major CHD event 15–25 years after baseline. These results are in general agreement with those from the Prospective Studies Collaboration [32] (estimating that for men aged 40–60 a 10 mmHg difference in DBP corresponds to approximately a two-fold difference in CHD risk), and those of Law et al. [33] who estimate that a 0.6 mmol/l difference in serum total cholesterol corresponds to approximately a 40% difference in CHD risk (and thus a 1.2 mmol/l difference leads to a two-fold difference in risk). These estimates suggest that relatively modest reductions in levels of blood pressure and blood cholesterol at the population level would produce marked reductions in CHD event rates, considerably greater than would be predicted if regression dilution bias was not accounted for, and suggest that population attributable risks and risk fractions associated with blood pressure and total cholesterol may be greater than previously estimated [34]. Correction for regression dilution can also help to evaluate how rapidly, and to what the extent, epidemiologically expected reductions in CHD can be achieved through the lowering of risk factors due to treatment interventions, as has already been demonstrated for blood pressure [35]. However, adjustment for regression dilution does not directly apply to the clinical management of CHD in individuals, as current risk assessment methods are usually based on the risk factor levels presented by the individual at the time of examination.
Implications for epidemiological studies
Estimates of the extent of regression dilution are important if unbiased estimates of associations between usual risk factors and disease outcomes are to be obtained. Long-term prospective studies need to take regression dilution into account and adjust measures of association between risk factors and disease rates. If repeat measurements are not available within the individual study, the use of RDR estimates from studies such as this one may be helpful. The comparability of RDR estimates in the present study with those of Whitehall and Framingham suggests that these estimates are reasonably robust and should be applicable in women as well as in men [5]. If adjustment for regression dilution is to be made when more than one variable is measured with error, simultaneous adjustment should be employed in preference to single adjustments, as the combined effects may be greater than the individually estimated effects. When assessing the impact of regression dilution for associations over a specific follow-up period, one would ideally use regression dilution ratio estimates based on repeat measurements taken at the beginning or mid-point of the period [5]. For instance, our 4-year estimates of the RDR are likely to be of particular value for modifying the association between baseline risk exposure and disease risk during the first decade of follow-up, while 16-year estimates are of corresponding value for the second decade and the 20-year estimate for the third decade. Short-term estimates are valuable in assessing the immediate effects of regression dilution (random measurement error plus short-term variability), isolating these effects from those caused by longer-term variation in risk factor levels.
Estimated relative hazard of major coronary heart disease (CHD) after 15–25 years of follow-up before and after correcting for the effects of regression dilution in serum total cholesterol and diastolic blood pressure (DBP)
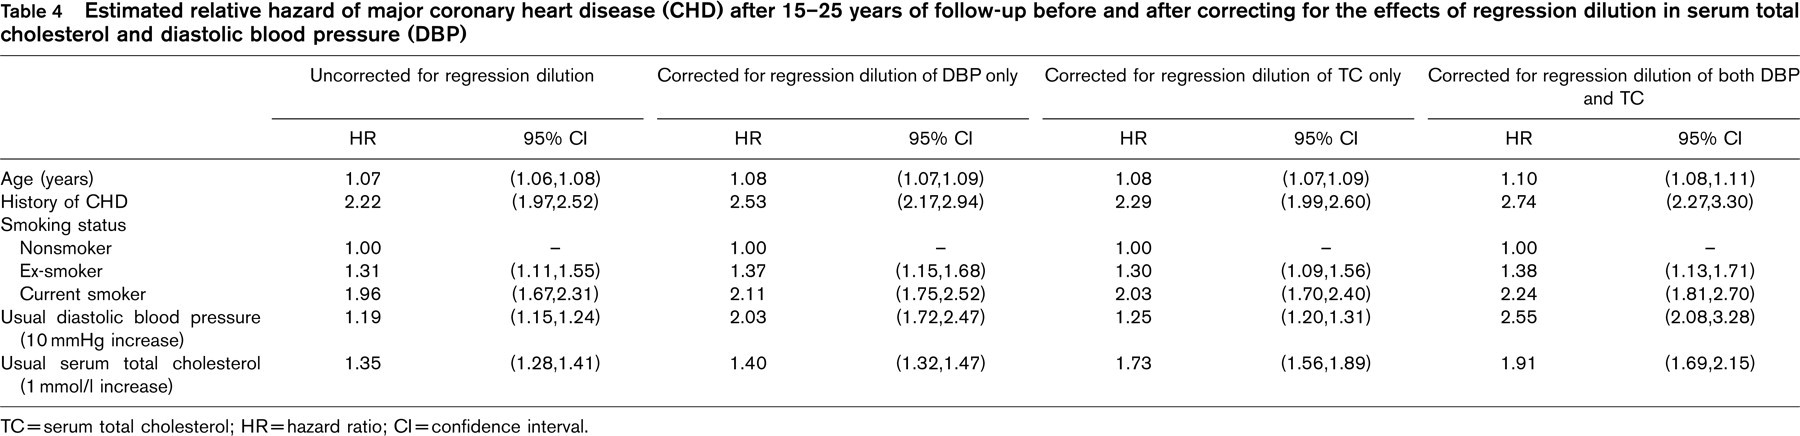
TC = serum total cholesterol; HR = hazard ratio; CI = confidence interval.
Footnotes
Acknowledgements
The British Regional Heart Study (established by Professor A.G. Shaper) is a British Heart Foundation (BHF) Research Group and receives additional support from the Department of Health, England. J.R.E. is supported by a BHF Junior Research Fellowship. Baseline serum total cholesterol and HDL cholesterol were measured at the Wolfson Research Laboratories, Birmingham (Prof T. Whitehead), triglycerides were measured at the Department of Chemical Pathology, Royal Free Hospital (Dr D Cramp). Sixteen- and 20-year blood lipid and glucose measurements were carried out in the Department of Chemical Pathology, Royal Free Hospital (Prof A. Winder, Dr M. Thomas), insulin measurements in the Department of Diabetes and Metabolism, University of Newcastle (Prof K.G.M.M. Alberti, Ms Pat Shearing) and homocysteine measurements at the Department of Pharmacology, University of Bergen (Prof H. Refsum, Prof P. Ueland). Haemostatic and inflammatory variables were measured at the Department of Medicine, University of Glasgow (Prof G.D.O. Lowe, Dr A Rumley). The views expressed in this publication are those of the authors and not necessarily those of the funding agencies.