
Abstract
Background
Important modern prognostic markers such as heart rate recovery (HRR), chronotropic index, delayed systolic blood pressure (SBP) response and Duke treadmill score (DTS) have been evaluated by treadmill exercise testing. Their value in bicycle exercise testing is unclear.
Methods
Patients (n = 211, age 64 ± 10; 75% male) with known or suspected coronary artery disease randomly underwent either bicycle (n = 105) or treadmill (n = 106) exercise electrocardiography. They were matched for age, gender, body mass index, hypertension, smoking, lipid status, prevalence of diabetes, medication, haemoglobin level, extent of coronary artery disease and left ventricular ejection fraction.
Results
Despite a higher peak heart rate (pHR) patients stressed by treadmill had a slower drop in HR during the early phase of recovery with a significantly higher rate of abnormal HRR (pHR; HR 1 min into recovery ≥ 12 bpm) with 37% in treadmill versus 19% in bicycle (P=0.004). Abnormally delayed SBP response [(SBP 1 min into recovery/SBP 3 min into recovery) >1.0] was also more common in treadmill (41%) compared to bicycle (12%, P≤0.001). However, the rate of chronotropic incompetence [(pHR - rest HR)/(220 - age - rest HR) ≤0.8] was significantly lower in treadmill than in bicycle (60 versus 76%, P≤0.001). Mean DTS was also significantly higher in treadmill compared to bicycle (4.8 ± 6.5 versus 3.6 ± 5.1, P=0.03) mainly due to the higher workload achieved when patients were stressed by treadmill (8.5 ± 2.5 versus 6.1 ± 1.5 metabolic equivalents, P≤0.001).
Conclusions
Further adjustment is needed prior to routine incorporation of these important measures into interpretation of bicycle exercise testing.
Introduction
Exercise test is currently the recommended first step in the risk assessment for patients with stable or suspected coronary artery disease with normal resting electrocardiogram (ECG) [1]. It is not only an important diagnostic tool but also a valuable and easily available method for prognostic assessment [1–3]. Treadmill and bicycle ergometers are now the most commonly used exercise testing devices. The modality used depends on the local expertise and familiarity, with treadmill being widely used in the USA and bicycle being more popular in European countries [4,5].
During recent years some important novel prognostic variables such as heart rate recovery [6], chronotropic index [7] and – to a lesser extend – blood pressure response in the recovery phase [8,9] have been identified. Duke treadmill score as the most widely used risk score which was initially evaluated in patients who underwent both treadmill exercise testing and coronary angiography [10], has been extended to other patient groups [11,12]. However, these measures have been evaluated in studies looking at treadmill for exercise testing. Although some of them are already being used in clinical routine when patients are stressed by bicycle, it is unknown if the information derived is comparable between the two modalities and if the limits proposed for risk stratification can be directly transmitted to patients stressed by bicycle. Even though there is recent evidence that bicycle testing has indeed important prognostic value [13], specific recommendations for clinical risk assessment in bicycle stress test are currently lacking [2].
Previous studies comparing diagnostic value of bicycle and treadmill exercise testing underlined the fact that the two are indeed different stressors, leading to different haemodynamic and clinical responses [14,15]. Thus, the different reactions may also have important implications on the novel risk variables.
The goal of this study was to assess whether selected risk measures – heart rate recovery, chronotropic index, Duke treadmill score and systolic blood pressure response during recovery – are comparable in the two stressing modalities and if their application can be extended to the interpretation of routine bicycle exercise test.
Methods
Study design
This is a prospective cross-sectional study comparing treadmill and bicycle exercise testing regarding modern prognostic measures.
Two hundred and eleven patients admitted to the University Hospital of Leipzig, Germany, Department of Cardiology for maximum exercise testing were randomly assigned (numbered container) to have a treadmill (n = 106) or bicycle exercise testing (n = 105). Indications for exercise testing were either diagnostic in patients with symptoms and no documented coronary artery disease, or for evaluation of known stable coronary artery disease. We excluded patients with recent acute coronary syndrome (< 6 weeks), patients with paced rhythm, atrial fibrillation, patients with severely depressed left ventricular dysfunction (< 35%), and patients with non-cardiorespiratory conditions, such as osteoarthritis precluding maximal exercise. The study protocol was approved by the hospital's Institutional Review Board.
After obtaining informed written consent and a fasting period of at least 4h participants underwent baseline evaluation including history taking, physical examination, blood pressure measurement, resting ECG, and blood draw. They were randomized to perform a standardized maximal exercise test on a motor-driven treadmill or an electrically braked supine bicycle ergometer.
Current smokers or those who quit smoking within 2 years prior to the examination were classified as smokers, and others were classified as non-smokers. Height (cm) and weight (kg) were measured and body mass index was calculated (weight in kg/height in m2). Waist (cm) and hip (cm) circumferences were documented and the ratio calculated. Hypertension was defined as systolic blood pressure ≥ 140 mmHg, diastolic blood pressure ≥ 90 mmHg, or the use of antihypertensive medication. Diabetes mellitus was defined as fasting blood glucose level higher than 7 mmol/l or the use of anti-diabetic medication. Peripheral blood was sampled prior to exercise testing. The ethylenediamine tetraacetic acid anti-coagulated whole blood was processed immediately.
Exercise testing
The same medical team consisting of a physician and two trained medical technicians aware of study hypothesis supervised all tests. Medication was not withheld prior to test. We used a standard exercise protocol depending on the self-reported activity level, to customize the protocol to the patient to allow 6–12 min of exercise [1]. A Cornell protocol was used for patients undergoing treadmill test [5]. Subjects were not permitted to lean on the handrails during exercise, but balancing with one finger touching the side rails was allowed. The bicycle test started with a power output of 25 or 50 watts and increased in levels of 25 or 50 watts every 2 min [4]. Patients were discouraged from grasping the handlebars tightly. Throughout the test and 5 min into recovery phase, symptoms, heart rate, and ECG were recorded. The test was terminated prematurely if one of the following occurred: severe angina or dyspnoea, claudication, increasing nervous system symptoms like near syncope, > 0.3mV of abnormal ST depression from baseline, ≥ 20mmHg drop in systolic blood pressure between consecutive stages, exercise systolic blood pressure ≥ 250 mmHg, or sustained ventricular arrhythmias. Maximal age-predicted heart rate (MPHR) was not an end-point. Patients performed a cool-down walk of 1 min at 1.5 mph and 2.5% grade in the treadmill group and a 1-min period of pedalling without resistance in the bicycle group. Computerized ST-segment depression was measured at 80 ms from the J-point and was corrected for pre-exercise deviation. An abnormal response was defined as 0.1 mV or more of horizontal or down-sloping depression. Heart rate recovery was defined as (peak heart rate – heart rate at 1 min into recovery) and was classified as abnormal if the value was less than or equal 12 beats per min. Chronotropic index was measured by ([peak heart rate – rest heart rate]/[220 – age – rest heart rate]). A ratio of less than 0.8 was considered as chronotropic incompetence [7]. Blood pressure was taken manually in patients being tested on treadmill and automatically when tested on bicycle. Delayed systolic blood pressure response was defined as a ratio > 1.0 for systolic blood pressure at 3 min of recovery divided by the systolic blood pressure at 1 min of recovery. Workload was expressed in metabolic equivalents (METs). The value for METs was estimated from standard tables on basis of the protocol and duration of exercise for the patients being tested on treadmill [5], and was calculated for the patients being tested on treadmill by using standard formulas [16]. The definition used for calculating Duke treadmill score was (exercise capacity in MET - [5 × maximum net ST-segment deviation in mm] - [4 × angina index]) with angina index defined as a value of 0 if no angina occurred, 2 if test-limiting angina occurred, and 1 if angina occurred during exercise, but was not test-limiting [10].
Coronary angiography
A senior cardiologist assessed the extent of coronary artery disease. Each lesion was visually estimated for percentage diameter stenosis rounded to the nearest 25%. Patients were categorized depending on the number of major vessels with at least one stenosis of more than 50% or a prior intervention on the vessel. Left ventricular ejection fraction was calculated from biplane angiograms.
Statistical methods
The number of patients included in the study was based on the sample size estimation for heart rate recovery. Based on our own unpublished data from routine exercise testing, we assumed the difference between the two groups to be 4 ± 10bpm. Choosing a power of 80% and a two-sided α-value of 0.05 we estimated that 100 patients would be required in each group. A total of 211 patients were included to allow for the possibility of missing data.
Continuous data are presented as arithmetic mean ± SD. Dichotomous parameters are expressed as relative percentages. Comparisons among the groups were evaluated by the two-tailed unpaired t-test for normally distributed variables. Mann-Whitney U test and χ2 test were used for non-normally distributed variables and categorical parameters, respectively.
We used stepwise multiple linear regression analysis to assess the covariate-adjusted association between exercise modality and the risk measures with the latter as the independent variable. Potential confounders included resting heart rate, diabetes, smoking status and use of medication being unequally distributed between the two groups (clopidogrel, digitoxin). These variables were added as covariates into the model. Variables that caused decrease of ≥ 10% in the R 2 of fitness were entered into a model simultaneously. Non-significant variables were removed from the final model. Values of two-sided P < 0.05 were considered significant. The Statistical Package for Social Sciences (Version 10.0) was used for all analysis (SPSS Inc., Chicago, Illinois, USA).
Results
Patient characteristics according to the exercise modality are presented in Table 1. There was no major difference between the two groups; however there was a trend towards a higher incidence of diabetes, smoking status, higher proportion of use of clopidogrel, and lower proportion of use of digitoxin in the bicycle group. Most tests were terminated at maximum exertion (bicycle 80% versus treadmill 83%, P = NS).
On average, patients in the bicycle group had lower values of resting and peak heart rate (Table 2). Consequently, only 32% of the patients in the bicycle group reached 85% of MPHR compared to 52% in the treadmill group. Moreover, the chronotropic index was significantly lower when patients were stressed on bicycle (Table 2).
One minute into recovery, the mean drop in heart rate was 4 bpm higher in the bicycle group than the treadmill group, leading to a significantly lower proportion of abnormal heart rate recovery. This difference between the two groups was no longer evident at 3 and 5 min into recovery (Fig. 1).
Main patient characteristics according to the exercise modality
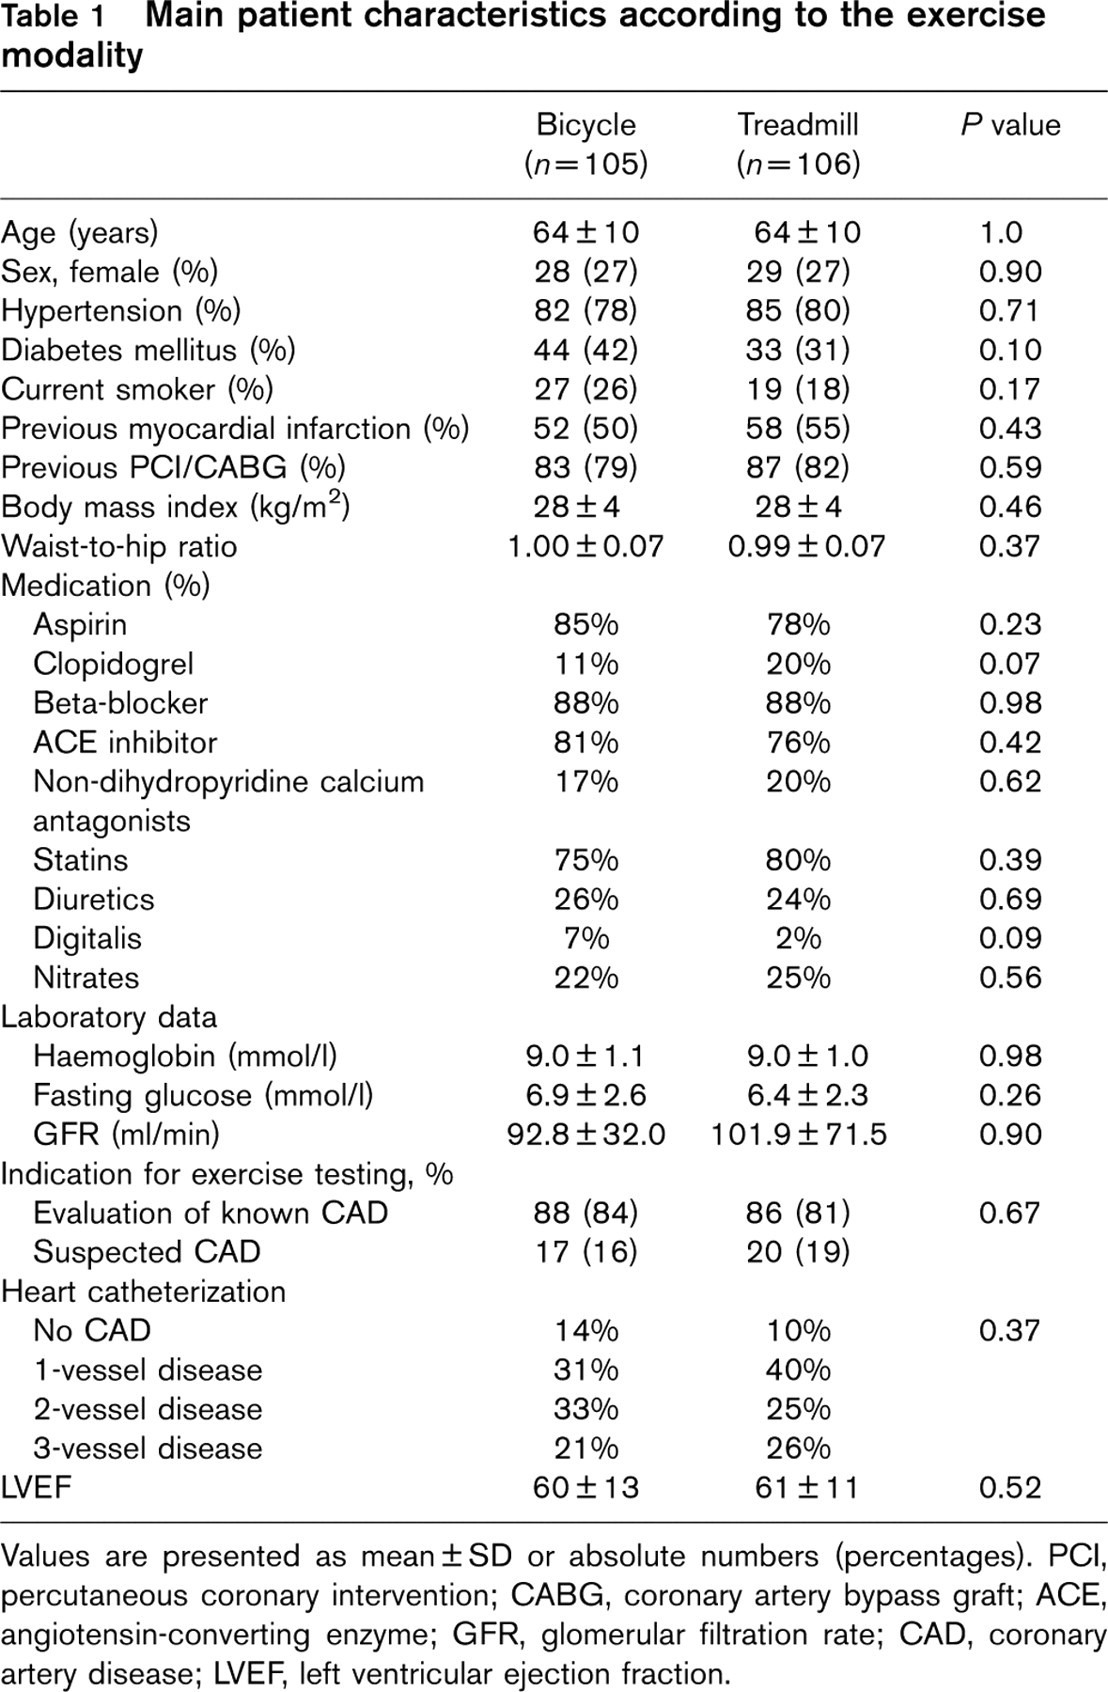
Values are presented as mean ± SD or absolute numbers (percentages). PCI, percutaneous coronary intervention; CABG, coronary artery bypass graft; ACE, angiotensin-converting enzyme; GFR, glomerular filtration rate; CAD, coronary artery disease; LVEF, left ventricular ejection fraction.
Diagnostic and prognostic parameters according to the exercise modality
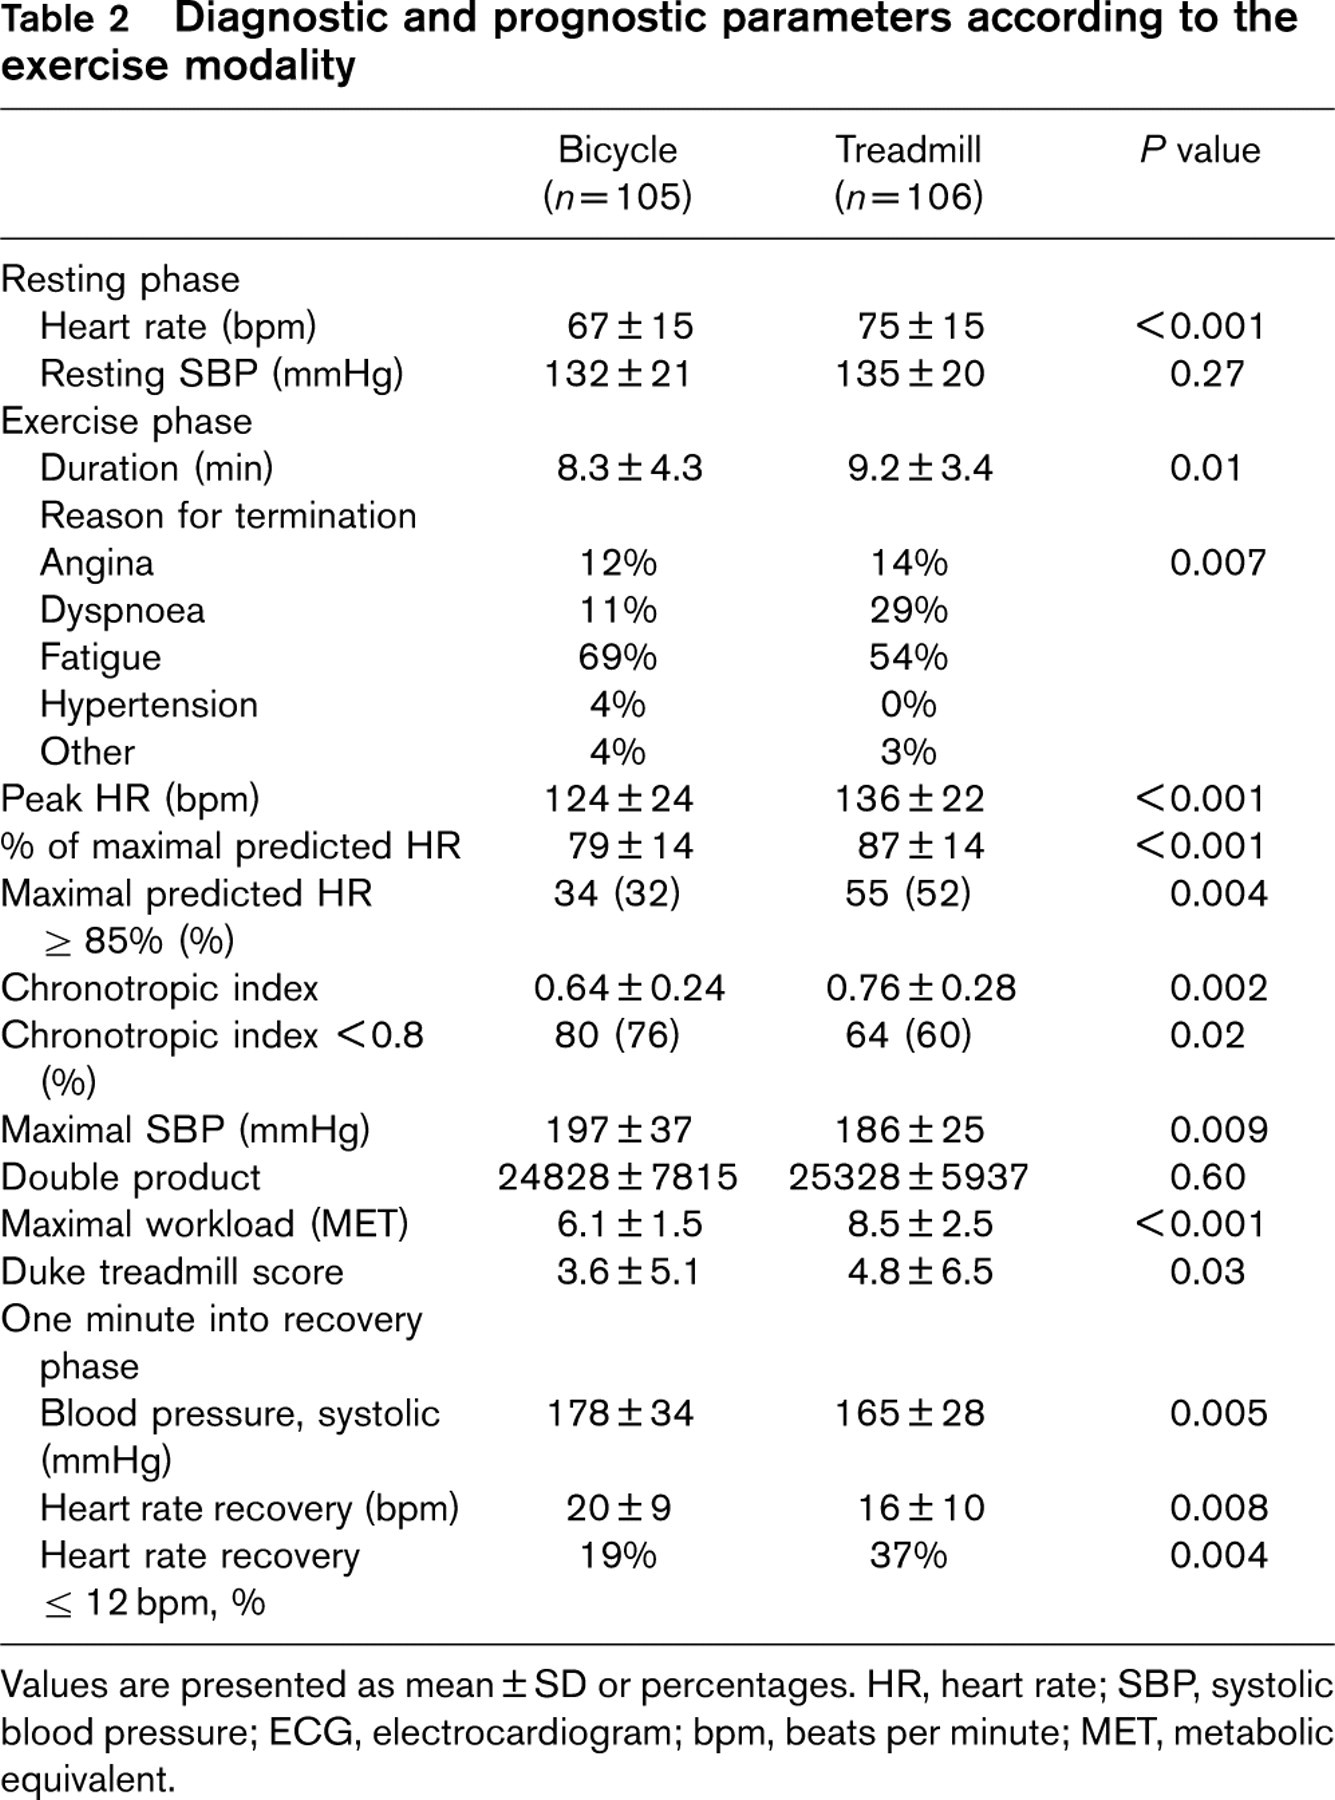
Values are presented as mean ± SD or percentages. HR, heart rate; SBP, systolic blood pressure; ECG, electrocardiogram; bpm, beats per minute; MET, metabolic equivalent.
Mean values of maximal workload achieved, maximal duration of exercise testing, and Duke treadmill score were significantly higher in the treadmill group (Table 2). When patients were categorized into risk groups according to the achieved Duke treadmill score – with patients reaching a score of –11 or lower being categorized into the high risk group, those with a score of higher than 5 classified as low risk, and the rest being in the medium risk group – there was no significant difference between the two exercise modalities (P = 0.47).
The systolic blood pressure response is shown in Figure 2. The two groups had similar systolic blood pressure values at rest. At maximal exertion, the increase in the systolic blood pressure was more pronounced in the bicycle group with the double product being nearly the same due to the higher maximal heart rate in the treadmill group (Table 2). One minute into recovery, systolic blood pressure was still significantly higher in the bicycle group to reach almost the same level as the treadmill group 3 min into recovery. From the first to the third minute into recovery, the drop in the systolic blood pressure was faster in the bicycle group resulting in only 12% of the tests with abnormally delayed blood pressure response in the bicycle group compared to 41% abnormal tests in the treadmill group.
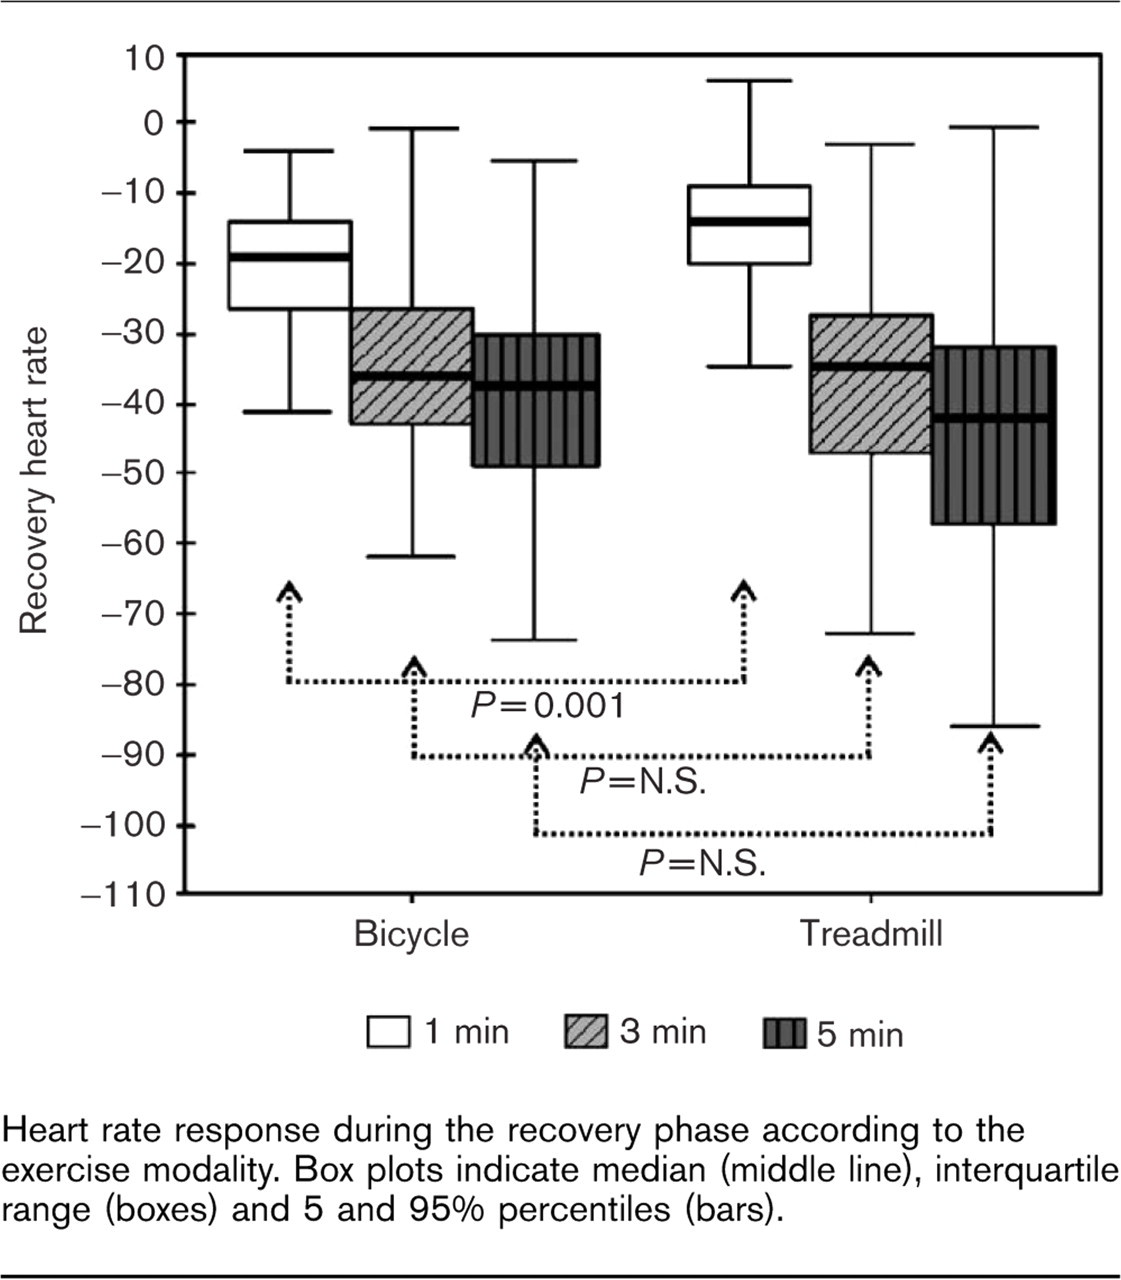
Heart rate response during the recovery phase according to the exercise modality. Box plots indicate median (middle line), interquartile range (boxes) and 5 and 95% percentiles (bars).
Twelve percent of patients in the bicycle group had non-diagnostical ECGs due to use of digitalis, signs of left ventricular hypertrophy, or left bundle branch block. The corresponding rate in the treadmill group was 7% (P = 0.21). In the remaining patients, significant ST segment reduction was evident in 13 and 23% in the bicycle and treadmill group, respectively (P = 0.05). The occurrence of non-limiting angina during the test was similarly frequent in both groups (20% in bicycle versus 18% in treadmill, P = 0.70). Positive exercise testing, defined as occurrence of either angina or ST segment reduction of equal or more than 0.1 mV, was equal in both groups (29% in bicycle versus 34% in treadmill, P = 0.40).
The difference in heart rate recovery, chronotropic index, Duke treadmill score and delayed blood pressure response between the two groups remained significant after adjustment for confounding variables.
Discussion
Today, treadmill and bicycle ergometer are the most widely used exercise modalities, the former having greater popularity in the USA and the latter in Europe [5]. Previous studies comparing the diagnostic strength of the two types of devices showed treadmill testing to be more sensitive for the diagnosis of coronary artery disease [14,15]. Nevertheless, the familiarity of the population with bicycle, lower costs, better quality of ECG tracings, and higher accuracy of blood pressure measurement has made bicycle ergometer the most commonly used exercise device in Europe.
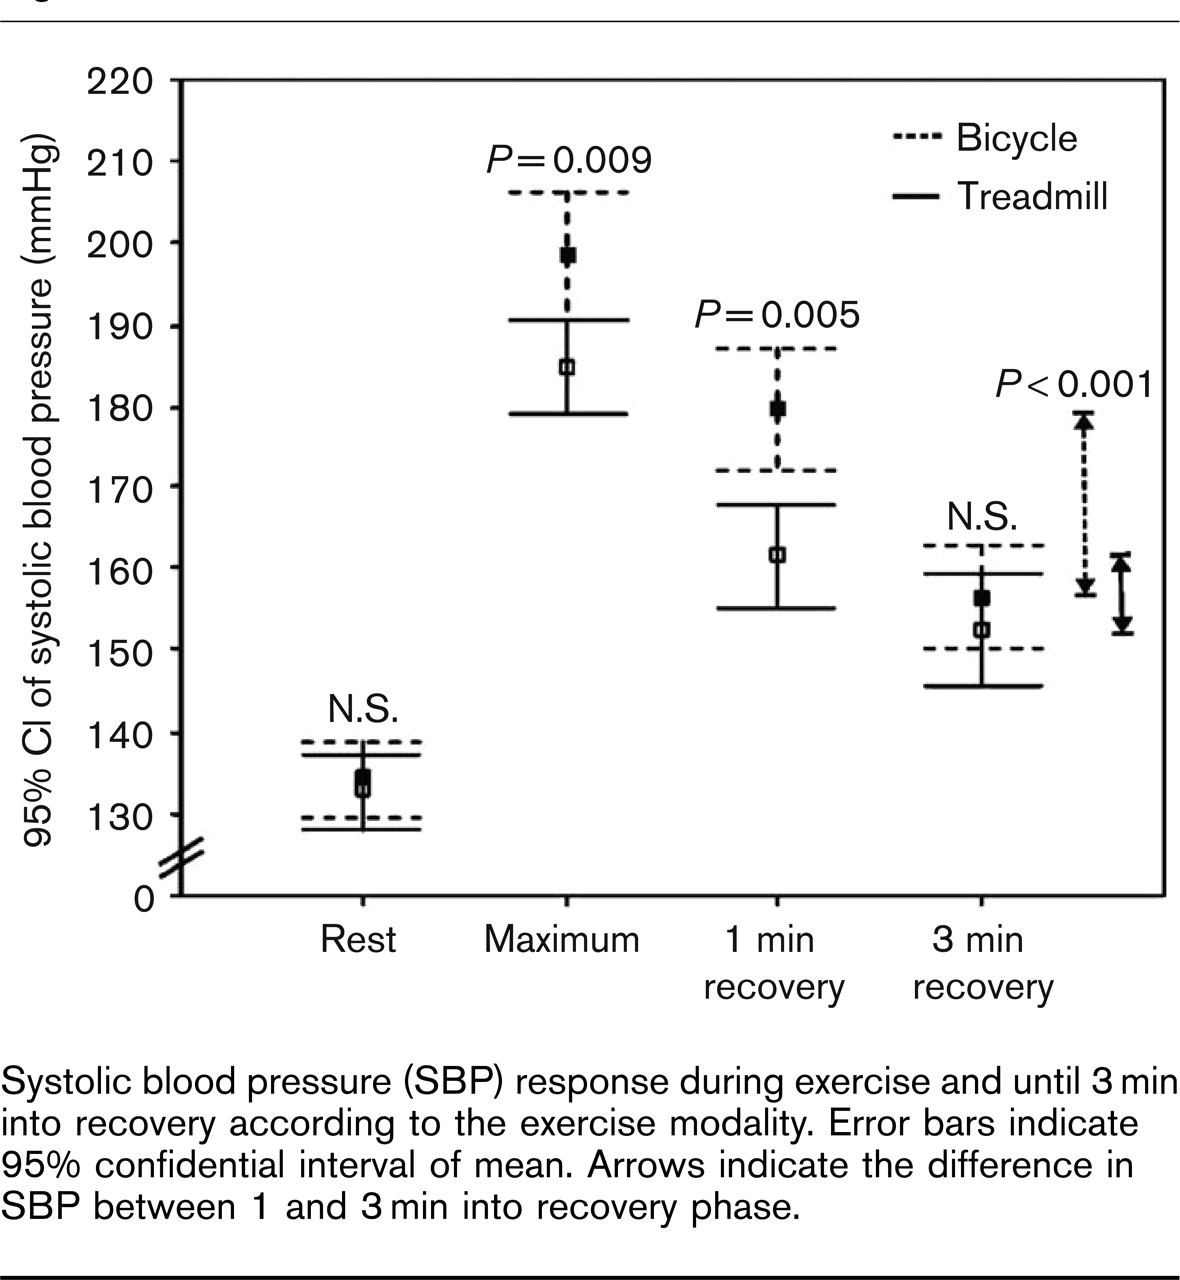
Systolic blood pressure (SBP) response during exercise and until 3 min into recovery according to the exercise modality. Error bars indicate 95% confidential interval of mean. Arrows indicate the difference in SBP between 1 and 3 min into recovery phase.
With the increasing role of exercise testing for assessment of prognosis [17], the question arises whether the known risk measures for treadmill are directly transferable to bicycle testing.
Delayed heart rate recovery measured 1 min after peak exercise in patients with coronary artery disease is independently associated with higher mortality [6,11]. In our study patients stressed by bicycle had a faster drop in heart rate 1 min into the recovery phase despite the lower peak heart rate achieved. Thus, implementing the criteria for abnormal heart rate recovery proposed by Cole et al. [6] in patients stressed by bicycle would reduce the yield in abnormal test results by almost 50%. This was surprising to us taking into consideration the reported potential positive correlation of heart rate recovery and chronotropic response [18] or level of exercise [19]. Abnormal heart rate recovery is believed to be mainly due to a blunted parasympathetic activity during the early phase of recovery, with reduced sympathetic withdrawal becoming more important later in the recovery phase [19,20]. Hambrecht et al. [15] demonstrated that patients stressed by bicycle had 20% less norepinephrine and epinephrine levels at peak exercise compared to treadmill stress testing. Three minutes into recovery catecholamines were still significantly higher in the treadmill group. Assuming similar parasympathetic activity in the recovery period of both groups, the relatively lower sympathetic activation in the bicycle group may explain our findings of the faster drop in heart rate during recovery.
Another important prognostic factor derived from treadmill exercise testing is the chronotropic index [7,21]. Although the underlying mechanisms are not entirely clear, it has been suggested that a blunted heart rate response to exercise is indicative of a baseline sympathetic overload [22]. In this study, bicycle ergometer resulted in higher rate of abnormal chronotropic response. Taking into consideration the equal level of double product in the two groups, it is unlikely that the more pronounced abnormal chronotropic response is an indicator of a worse prognosis in this group. We rather believe that the limits of pathologic response need to be evaluated and adjusted for the bicycle ergometer.
The most widely used exercise prognostic score is the Duke treadmill score [10]. This incorporates exercise capacity, abnormal ST-segment response, and exercise-induced angina, with exercise capacity being the most important prognostic component [11,23]. As shown by previous studies and our data, treadmill exercise testing has a higher sensitivity in detecting exercise-induced ST-segment deviation [15] and results in higher levels of exercise capacity compared to bicycle ergometer [4]. In our study population, when calculating the Duke treadmill score, the lower rate of exercise-induced ST-segment deviation in the bicycle group could not compensate for the lower workload achieved in the same group. As a result the mean Duke treadmill score was significantly lower in the bicycle group (Table 2). This would lead to a higher rate of imaging studies as recommended for patients with intermediate risk score [1]. However, our study lacks the power to investigate the difference in the categories of Duke treadmill score between the two groups.
McHam et al. [8] showed a delayed decline in systolic blood pressure during recovery to be associated with a greater likelihood of severe angiographic coronary artery disease even after accounting for the change in systolic blood pressure during exercise in patients stressed by treadmill. Our results show that changes in systolic blood pressure were not comparable between the two exercise modalities with bicycle ergometer resulting in significantly less abnormally delayed systolic blood pressure during recovery (Fig. 2). Changes in systolic blood pressure during exercise correlate with the level of exercise as a result of increasing cardiac output. But changes depend also on the extent of the use of active muscles. In cycling mainly leg muscles are used, leading to a less total dilation of the arteries and higher rate of increasing peripheral resistance in tissues that do not function in the performance of the exercise. In result, the increase in systolic blood pressure is higher in bicycle ergometer.
Study limitations
Despite controlling for covariates, we cannot completely exclude other potential confounding effects. Our findings derived from patients with known or suspected coronary artery disease may not apply to other patient groups such as asymptomatic populations. The methodology of assessment of heart rate recovery has not been standardized yet [24]. In this study we used the protocol used by Cole et al. with a cool-down period of 1 min [6]. The patients tested in the bicycle group performed a comparable cool-down period with no resistance. However, we cannot exclude that the difference in the exercise protocol rather than the exercise modality is responsible for the different results. Finally, studies looking at chronotropic index in treadmill testing have mostly excluded patients taking beta-blockers. Therefore, our results may lack generalizability for this prognostic factor.
In conclusion, this study shows for the first time that modern prognostic and diagnostic factors derived from treadmill exercise testing need to be validated for risk stratification in patients being stressed by bicycle ergometer, as none of the parameters evaluated in this study delivers the same information in the two exercise modalities. Bicycle ergometer results on average in a lower rate of abnormal heart rate recovery and abnormal systolic blood pressure response in the recovery phase, thus classifying the patients at a lower risk category, whereas more patients are classified into the higher risk categories when chronotropic index and Duke treadmill score are used. Routine incorporation of these parameters into bicycle exercise testing cannot be recommended at this time.