
Abstract
Background
The Framingham risk score has been used for coronary heart disease (CHD) risk assessment. Recently, additional risk factors not included in the Framingham algorithm have received much attention and may help improve risk assessment. We examined the distributions of lifestyle and emerging risk factors by 10-year risk of CHD.
Methods
We calculated 10-year CHD risk (<10%, 10–20%, and >20%) for 8355 participants in the National Health and Nutrition Examination Survey (NHANES) 1999–2002 using the Framingham risk score as modified by the National Cholesterol Education Program Adult Treatment Panel III guidelines. We examined the prevalence of lifestyle risk factors [body mass index (BMI) and waist circumference] and various emerging risk factors [C-reactive protein (CRP), white blood cell count, fibrinogen, homocysteine, glycosylated hemoglobin, and albuminuria] as well as prevalence of high CHD risk by levels of these risk factors.
Results
All examined CHD risk factors were significantly associated with increasing 10-year CHD risk among men and women. Odds of being in the highest CHD risk group were greater at higher levels of examined risk factors. Means for most risk factors were slightly higher for women than the means for men. Sizeable proportions of participants with lower 10-year CHD risk had high levels of lifestyle and emerging risk factors: 60.8% were overweight, 33.8% had high CRP concentrations, 24.1% had serum fibrinogen >400 mg/dl and 6% had an albumin/creatinine ratio ≥ 30.
Conclusions
Lifestyle and emerging risk factors, in addition to those included in the Framingham risk score, may be important in CHD risk assessment.
Introduction
The prevention of coronary heart disease (CHD) often begins with identification of risk factors and risk assessment. The Framingham Heart Study [1] published multivariate models and risk equations to estimate 10-year absolute risk of developing CHD. The Framingham risk score equation, with some modifications, was adopted by the National Cholesterol Education Program Expert Panel in its third report on Detection, Evaluation, and Treatment of High Blood Cholesterol in Adults (Adult Treatment Panel III) (NCEP/ATP III) [2]. The Framingham algorithm served as the basis of clinical guidelines issued by a European task force [3] and British recommendations [4] on prevention of CHD. The algorithm has worked reasonably well in assigning people to three levels of 10-year risk of developing CHD, yet there is room for improvement of risk assessment. Many persons in the lower and middle categories are at increased risk than others in their category. This possibility has led to research to improve the existing algorithm and to explore other algorithms [5]. A better understanding of emerging risk factors could help to improve risk assessment and prediction of CHD.
Several lifestyle and emerging risk factors of CHD that were not included in the original Framingham algorithm and its modification by NCEP/ATP III have recently received much attention. These risk factors include measures of obesity, such as body mass index (BMI) [6] and waist circumference [7, 8], inflammatory markers, such as C-reactive protein (CRP) [9–11] and white blood cell count [12], thrombogenic factors, such as fibrinogen [13], and other non-lipid risk factors, such as homocysteine [14, 15], glycosylated hemoglobin [16–19], and albuminuria [20, 21]. A discussion of the importance and usefulness of these emerging risk factors has been presented elsewhere [22]. The distribution of these risk factors by 10-year CHD risk levels as calculated by the Framingham equation is not known, however. We examined data from the National Health and Nutrition Examination Survey (NHANES) 1999–2002 to describe the distribution of these lifestyle and emerging risk factors by 10-year risk of CHD among the US adult population and to see how well they correlate with calculated 10-year CHD risk.
Methods
We used a representative sample of the noninstitutionalized US civilian population included in NHANES 1999– 2002 [23, 24] with stratified multistage sampling design. African American and Mexican American participants, persons > 60 years of age, and persons with low incomes were over-sampled. The participants were interviewed by trained interviewers using a computer-assisted system. The interviews were conducted at participants' homes and the participants were requested to visit a mobile examination center. Additional questionnaires were completed, various examinations conducted, and blood samples were collected at the mobile examination center. Details of the collection and processing of blood samples are provided in the NHANES Laboratory/Medical Technologists Procedure Manual [25].
We used the modified Framingham algorithm as adopted by NCEP/ATP III, broadening the age range of participants (20–79 years). Measures of low-density lipoprotein cholesterol were not used. Categories of high-density lipoprotein cholesterol were used. Scoring for blood pressure was dependent on treatment status, and points for smoking status were assigned based on age. The modified algorithm for determining 10-year risk for developing CHD included patients' age, sex, serum total cholesterol concentration, serum high-density lipoprotein cholesterol concentration, systolic blood pressure, treatment for high blood pressure and smoking status. The NCEP/ATP III considered patients with existing CHD or CHD equivalent as being in the highest of the three risk levels of <10%, 10–20% and >20%. Separate scores were computed for men and women.
The interview collected information regarding age, sex, and current use of medication for high blood pressure. Participants were considered to be current smokers if they reported smoking at least 100 cigarettes during their lives and were currently smoking. We used self-reported CHD, angina, and heart attack to define CHD. Similarly, self-reports of stroke and diabetes were used to define CHD equivalents. Each participant's height, weight, blood pressure, and waist circumference were measured during the mobile examination center visit.
Total cholesterol and high-density lipoprotein cholesterol were measured by enzymatic assays on a Hitachi 704 Analyzer (Roche Diagnostics, Indianapolis, Indiana, USA) using commercial reagents. The CRP concentrations were measured by latex-enhanced nephelometry on a Behring Nephelometer (Dade Behring Diagnostics Inc., Somerville, New Jersey, USA). The Clauss clotting method, on a STA-Compact (Diagnostica Stago, Parsippany, New Jersey, USA), was used to quantitatively determine the fibrinogen concentration in plasma. Total homocysteine in plasma was measured by the Abbott Homocysteine assay, a fully automated fluorescence polarization immunoassay (FPIA) from Abbott Diagnostics (Abbott Park, Illinois, USA). The glycohemoglobin measurements were performed using Primus CLC330 (Primus Corporation, Kansas City, Missouri, USA). The system was standardized to the reference methods used for the Diabetes Control and Complications Trial. The Beckman Coulter MAXM instrument (Beckman Coulter Corporation, Miami, Florida, USA) was used in the mobile examination center to produce counts and distribution of blood cells, including white blood cells. For measurement of urinary albumin, a solid-phase fluorescent immunoassay was used. A Jaffe reaction was used for creatinine analysis, measured with a CX3 analyzer (Bechman Instruments Inc., Brea, California, USA).
Analysis
Our analyses were restricted to 8747 participants aged 20–79 years who visited the mobile examination center. Of these, 122 participants lacked information on CHD status, leaving 8625 observations. A total of 7812 participants provided complete information on all components needed for calculation of the modified Framingham score. Of the remaining 813 participants, 543 participants were included because, although lacking some information, they remained in the same risk group using the highest (or worst) possible scores for missing components. A resulting 8355 observations were categorized into three groups based on 10-year CHD risk score (< 10%, 10–20%, and >20% risk). Participants with CHD or CHD equivalents were included in the group with 10-year CHD risk >20%. Lifestyle and emerging risk factors examined in this study, except fibrinogen, were measured for most participants. Fibrinogen was measured for persons aged 40 years and older only. Because of some missing data, the numbers of participants included in our models were slightly different for each risk factor.
We categorized lifestyle and various emerging risk factors into high and low risk levels to examine their associations with 10-year CHD risk groups. We separated persons with normal BMI (< 25 kg/m2) from those overweight and obese (BMI ≥ 25 kg/m2). For waist circumference, we used the same cut-points that NCEP/ATP III used, that is, men with waist circumference > 102 cm and women with waist circumference > 88 cm were considered at high risk. For CRP, serum concentrations > 3 mg/l were considered high, as recommended by the American Heart Association and the Centers for Disease Control and Prevention [26]. We used the median value of white blood cell count as a cut-point and separated participants with counts greater than 7.0 × 10⁹/l from those at or below median value. Fibrinogen concentrations > 400 mg/dl were considered high. Total homocysteine concentrations > 15 μmol/l are considered high by the American Society of Human Genetics [15, 27]. We used this cut-point to separate participants into normal or high-level categories. Studies of glycosylated hemoglobin have used various cut-points, ranging from 5 to 7%. We considered participants with glycosylated hemoglobin levels > 6% as persons at higher risk. We used albumin/creatinine ratio to identify albuminuria. A albumin/creatinine ratio of 30 or greater is considered abnormal by the National Kidney Foundation [28]. We used this cut-point to identify participants with micro- and macro-albuminuria.
We computed means, medians, and proportions for lifestyle and emerging risk factors. Geometric means were used for skewed data. We used regression analysis to assess the correlation between these risk factors and 10-year CHD risk. We employed logistic regression and computed odds ratios and 95% confidence intervals (CI) as measures of association between high levels of risk factors and 10-year CHD risk categories, using these risk factors as dependent variables. The proportions for being at highest CHD risk (> 20%) were also calculated with low and high levels of examined risk factors and odds ratios and 95% CI were computed with CHD risk (> 20%) as dependent variable. We used SUDAAN (Software for the Statistical Analysis of Correlated Data) [29] to account for the complex sampling design and to calculate weighted estimates.
Results
Of the 8355 participants included in the analysis, 5779 (weighted proportion 75.4%) had a 10-year CHD risk < 10%, 1073 (weighted proportion 10.9%) had 10–20%, and 1503 (weighted proportion 13.7%) had 10-year CHD risk > 20%. Both lifestyle risk factors examined (BMI and waist circumference) increased with increasing level of 10-year CHD risk. The mean and median BMIs for all levels were greater than 25.0 kg/m2 (Table 1).
Mean and median of lifestyle and emerging risk factors by 10-year risk of CHD among US adults aged 20–79 years (NHANES 1999–2002)
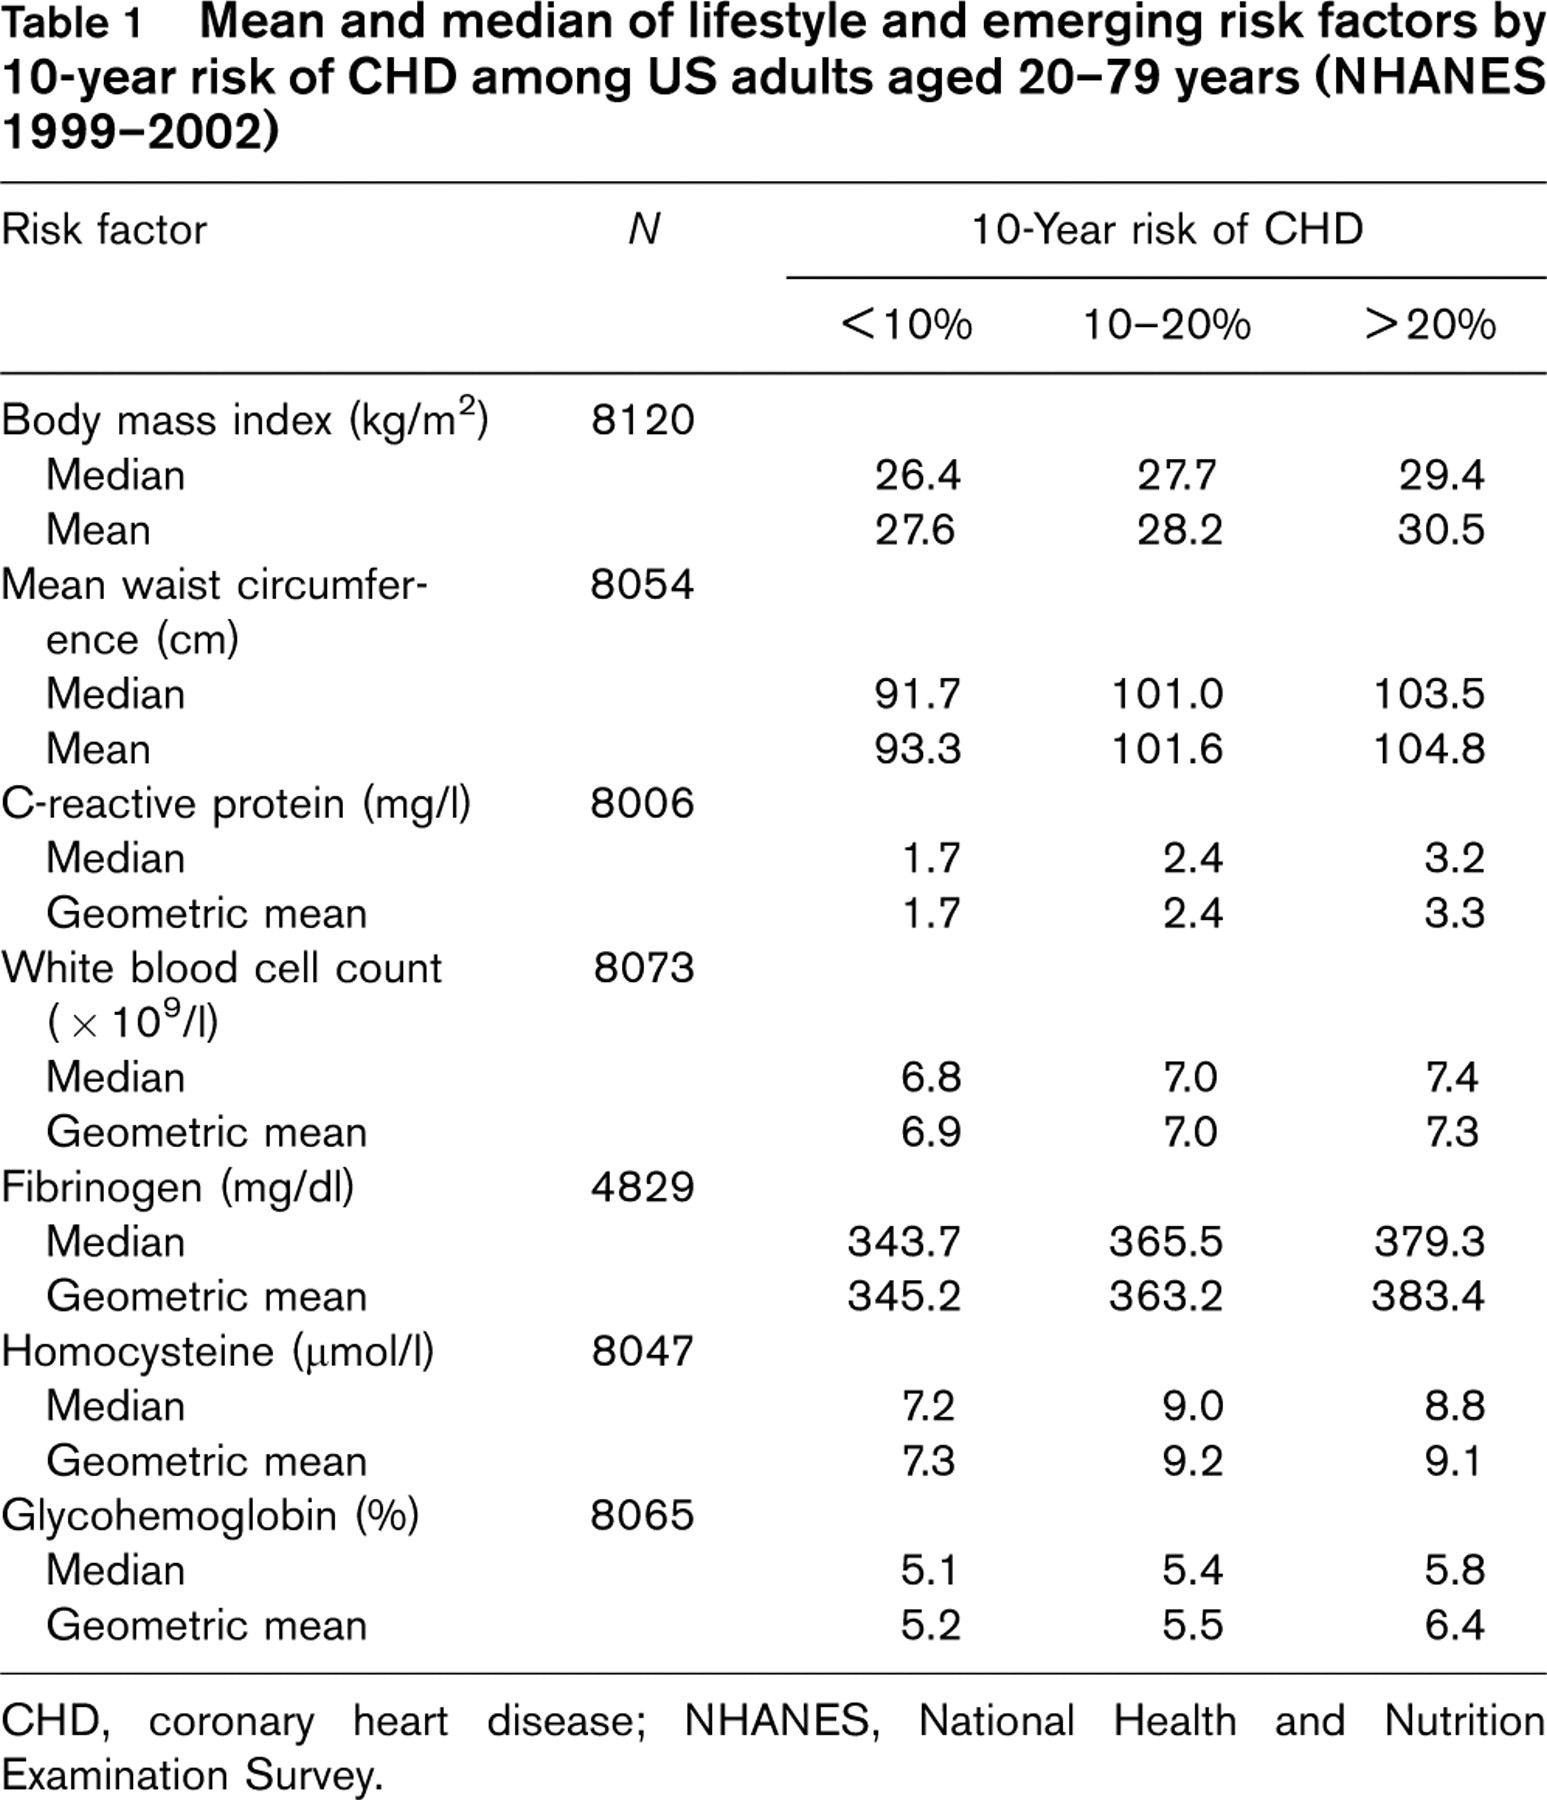
CHD, coronary heart disease; NHANES, National Health and Nutrition Examination Survey.
Increasing concentration of inflammatory markers was observed with increasing 10-year risk of CHD. Geometric mean and median of CRP concentrations increased from 1.7 mg/l for persons with a 10-year CHD risk < 10% to over 3 mg/l for persons in the highest 10-year CHD risk group (> 20%). The means for white cell count increased from 6.8 × 10⁹/l to 7.4 × 10⁹/l from low-risk group to high-risk group. Our results for serum fibrinogen were based on a smaller sample (aged 40 and above only). Even so, increasing concentrations of serum fibrinogen were observed with increasing 10-year CHD risk. Similar findings for homocysteine and glycosylated hemoglobin are presented in Table 1.
In the highest 10-year risk group, four out of five persons were overweight or obese (BMI ≥ 25 kg/m2) and approximately 46% were obese (BMI ≥ 30 kg/m2) (Table 2). The odds for having above-normal BMI or being obese among persons in the highest 10-year risk group were more than twice the odds for persons with 10-year CHD risk < 10%. However, even in the lowest 10-year CHD risk group, more than 60% of persons had BMI ≥ 25 kg/m2 and more than 25% were obese. For abdominal obesity, 68.2% of persons in the highest 10-year CHD risk group had waist circumference greater than the recommended value, compared to 42.7% in the lowest 10-year CHD risk group.
Proportions, odds ratio, and 95% confidence intervals (CI) for lifestyle and emerging risk factors by 10-year risk of CHD among US adults aged 20–79 years (NHANES 1999–2002)
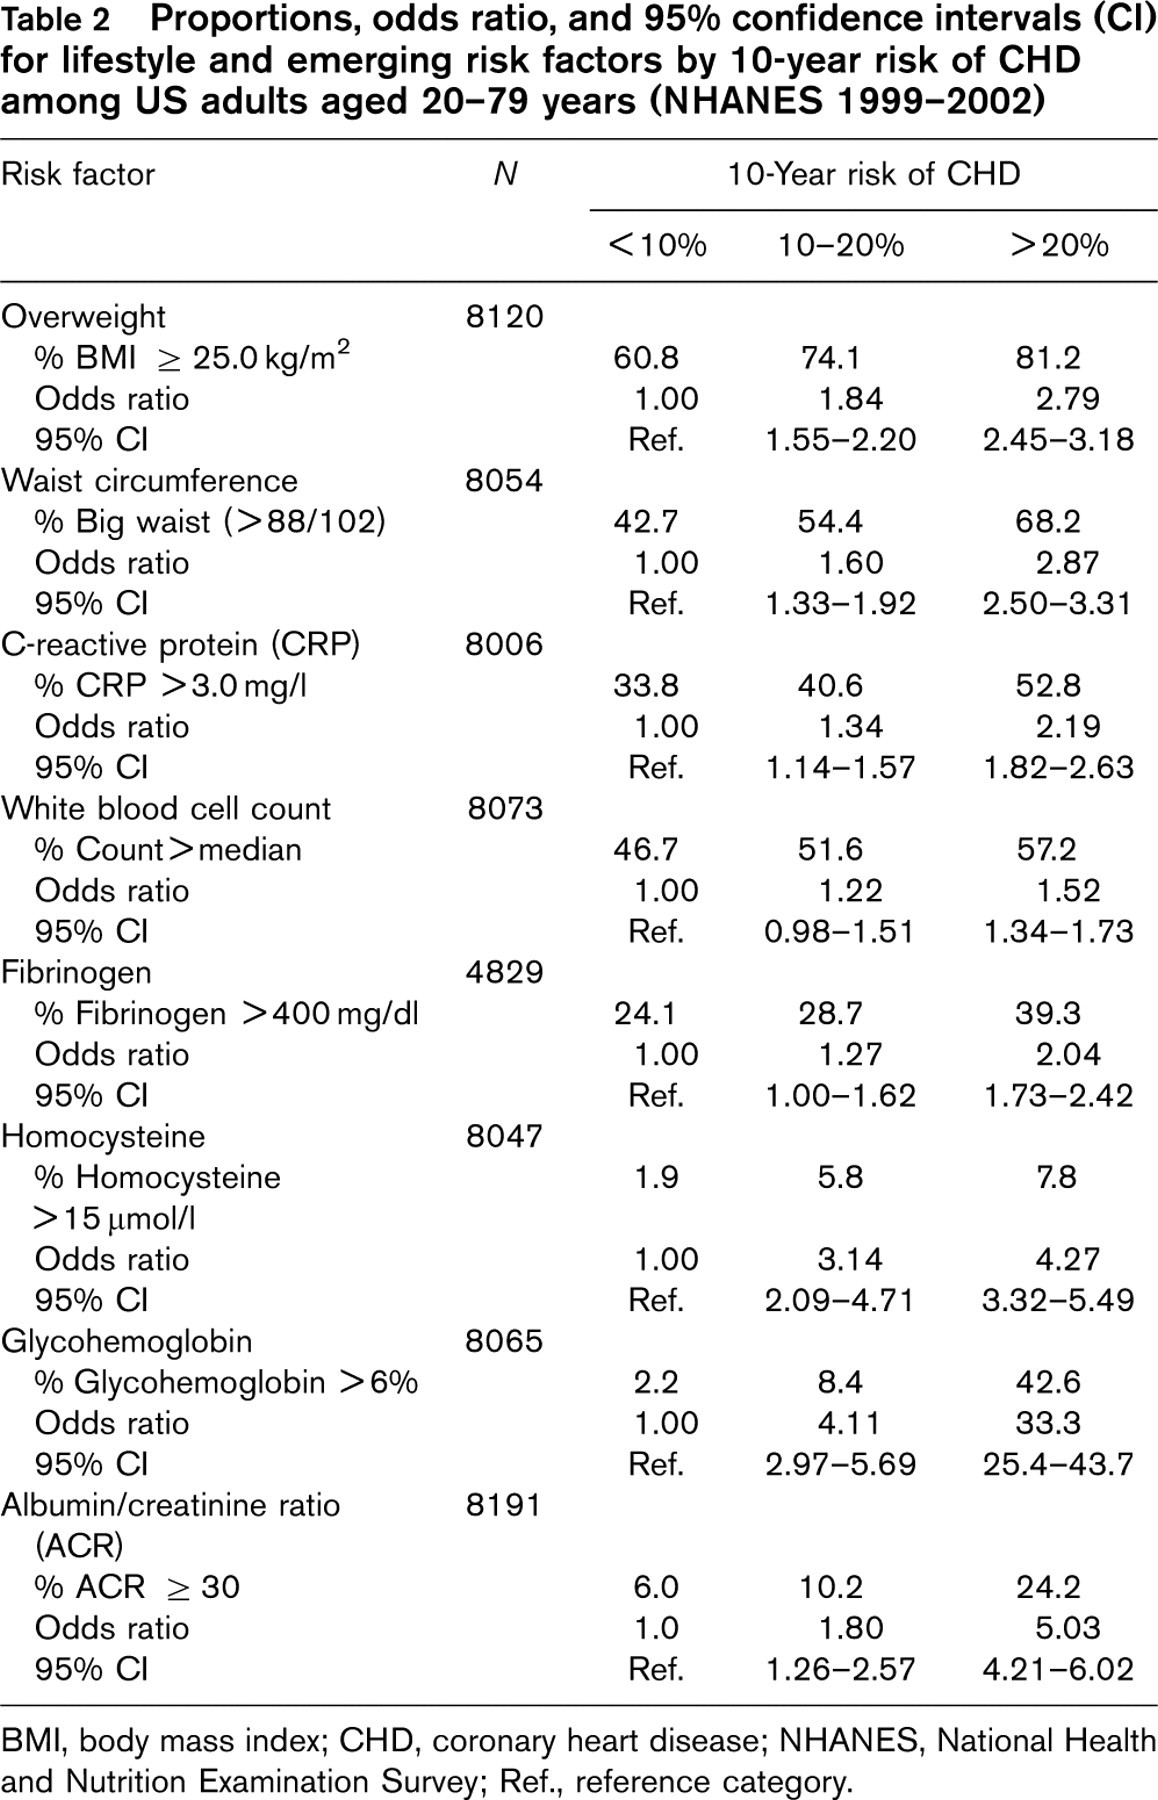
BMI, body mass index; CHD, coronary heart disease; NHANES, National Health and Nutrition Examination Survey; Ref., reference category.
More than half (52.8%) of the persons in the highest 10-year CHD risk group had high CRP concentrations, whereas about one-third (33.8%) of persons in the lowest 10-year CHD risk group had high CRP concentrations. The prevalence of high white cell count ranged from 46.7% in the lowest 10-year CHD risk group to 57.2% in the highest, using median values.
The prevalence of fibrinogen > 300 mg/dl was high in all three risk groups, with about three-quarters (75.8%) in the lowest group to 89% in the highest group. With a higher cut-point of 400 mg/dl, 24.1% of persons in the lowest 10-year CHD risk group had a high fibrinogen level, compared to 39.3% in the highest 10-year CHD risk group.
Among other non-lipid risk factors, the prevalence of high homocysteine was 1.9% among persons in the lowest 10-year CHD risk group, compared to 7.8% among persons in the highest 10-year CHD risk group. Our analyses revealed a high prevalence of glycosylated hemoglobin among the two lower risk groups, with no self-reported diabetes. Among those with 10-year CHD risk < 10% and 10–20%, about 2 and 8% of persons had glycosylated hemoglobin levels > 6%. Using a lower threshold, more than half (67.4%) of those in the lowest risk group (10-year CHD risk < 10%) and 87.5% in the middle risk group (10-year CHD risk 10–20%) had glycosylated hemoglobin > 5%. We found the prevalence of albuminuria to be 24.2% among persons in the highest 10-year CHD risk group. This compared to 6% among persons in the lowest risk group, with an odds ratio of 5.03.
The modified Framingham equation uses separate scoring for males and females, therefore separate analyses were conducted for men and women. We introduced an interaction term in the model to assess the gender difference and observed similar associations between examined risk factors and 10-year CHD risk for men and women. In general, the means for most risk factors, except waist circumference, were slightly higher for women. However, the slopes for white blood cell count and homocysteine concentration were different for the two sexes (Fig. 1). The proportions of high levels of examined risk factors by 10-year CHD risk were similar for men and women, except albumin/creatinine ratio (Fig. 2).
To disentangle a possible causal role of these risk factors, the odds ratios for being in the highest CHD risk group (CHD risk > 20%) were also computed. The odds ratios were significantly greater than unity for higher levels of risk factors examined (Table 3). Most odds ratios were less than 5.0, except for those with high levels of glycosylated hemoglobin (odds ratio 24.13), which may have been due inclusion of diabetes as a CHD equivalent condition. Excluding those reporting diabetes, the odds ratio for being in the highest CHD risk group among those with glycosylated hemoglobin of > 6% was 2.93 (95% CI 2.01–4.25) (data not shown).
Discussion
Data from NHANES 1999–2002 show that the examined cardiovascular disease risk factors are significantly associated with a 10-year CHD risk score calculated using the modified Framingham algorithm. These include lifestyle risk factors (BMI and abdominal obesity), inflammatory markers (CRP and white blood cell count), thrombogenic risk factor (fibrinogen concentration), and other risk factors (homocysteine, glycosylated hemoglobin, and albuminuria). All examined risk factors correlated with high 10-year risk of CHD. The findings validate the importance of these risk factors and underscore their role in CHD risk assessment.
From a clinical perspective, these results raise important issues about the level of CHD risk among persons considered at low 10-year CHD risk (<10%) based on the modified Framingham score. A sizeable proportion of persons who had a low 10-year CHD risk had high BMI (60.8%) and abdominal obesity (42.7%). The concentrations of CRP were high in about a third of persons in this group and high fibrinogen concentrations were observed in about a quarter of this low-risk group. Higher levels of other non-lipid risk factors were also observed in the lowest 10-year CHD risk group. Based on individual risk factors, some persons in the lowest 10-year CHD risk group might have been considered to be at high risk. For example, an obese person with large waist circumference and high levels of glycosylated hemoglobin and CRP might be considered at high risk for CHD, if these factors are considered in risk assessment. Although we do not know whether adding these risk factors would provide additional information to predict CHD deaths or events, our analyses from a causal perspective show that the odds of being at high CHD risk are much greater at higher levels of examined risk factors. Further study is needed to assess whether adding these risk factors to a risk score contribute any additional explanatory power to predicting actual CHD events.
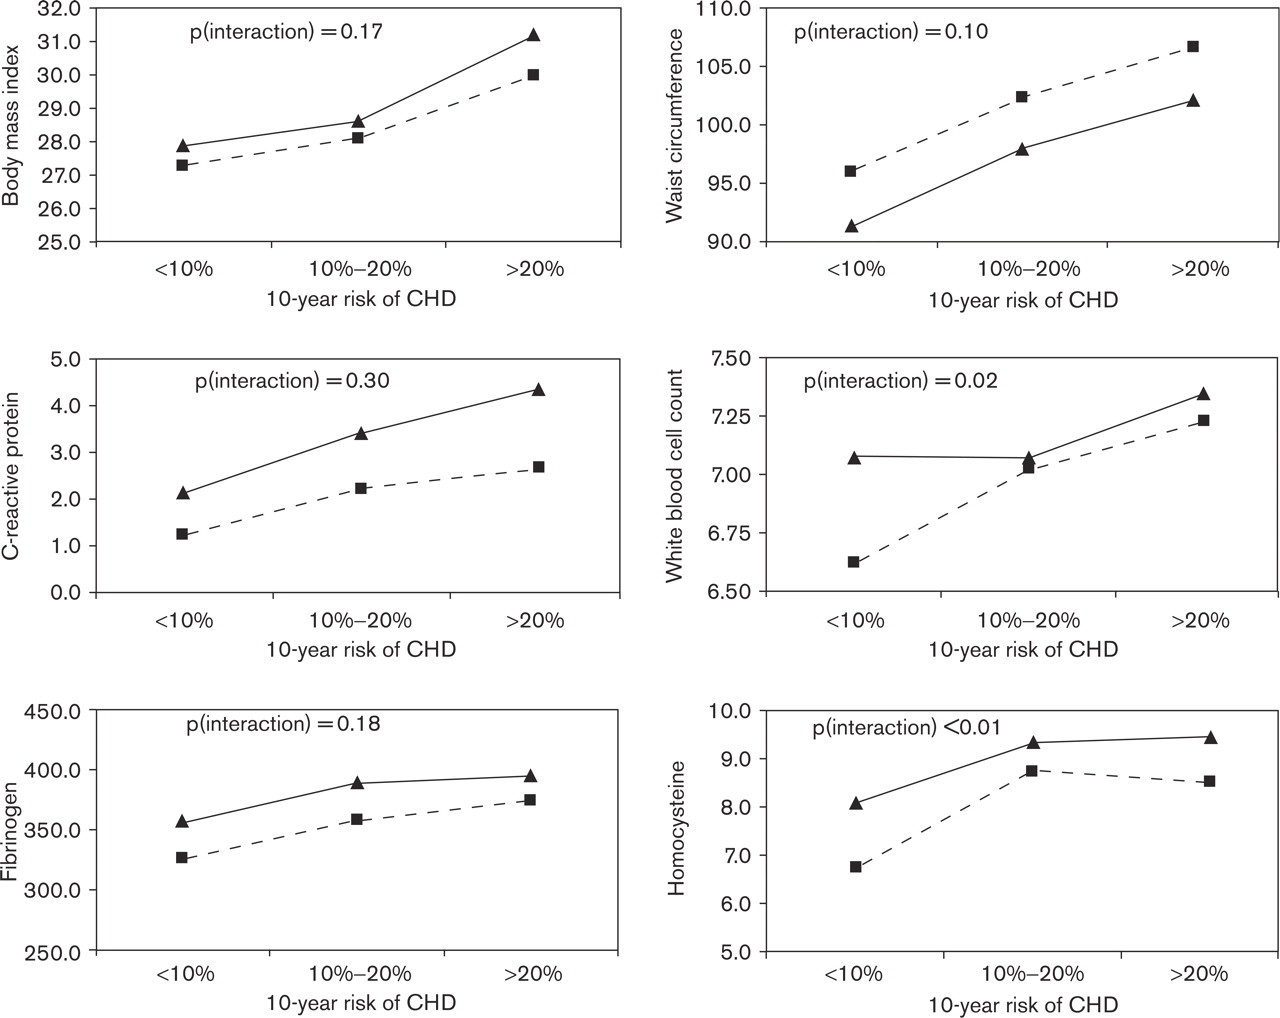
Means of lifestyle and emerging risk factors by 10-year coronary heart disease (CHD) risk and sex. Dashed line: men; solid line: women.
Our findings are not inconsistent with other studies. Earlier studies reported a significant correlation between CRP concentrations and 10-year CHD risk calculated using the Framingham score. Researchers concluded that CRP may have an adjunctive role in risk prediction for cardiovascular disease [30]. An earlier report from NHANES 1999–2000 showed that the prevalence of high CRP in persons with lipid concentrations within the recommended values ranged from 23 to 27% [31]. A study that examined the prognostic value of the Framingham score in individuals with microalbuminuria without a history of cardiovascular disease suggested combining the Framingham score with the level of albuminuria as a primary prevention strategy with higher efficiency [32]. Although the importance of Framingham score and its use in clinical settings cannot be overemphasized, these results demonstrate the presence of a sufficient CHD risk among persons categorized in the lowest 10-year CHD risk group to warrant discussion. The question of whether the current approach to the assessment of cardiovascular disease risk fails to identify a portion of the high-risk population has been discussed elsewhere [22]. Researchers identified limitations of the Framingham calculation and suggested using a combination of information, including risk factors not included in the calculation. Another report regarding the use of novel risk factors in assessing CHD risk concluded that additional markers may add predictive value to the current method of risk assessment [33]. Our findings support the idea of a possible role of these risk factors in overall risk assessment. Better understanding of the actual role of these risk factors in risk assessment is warranted.
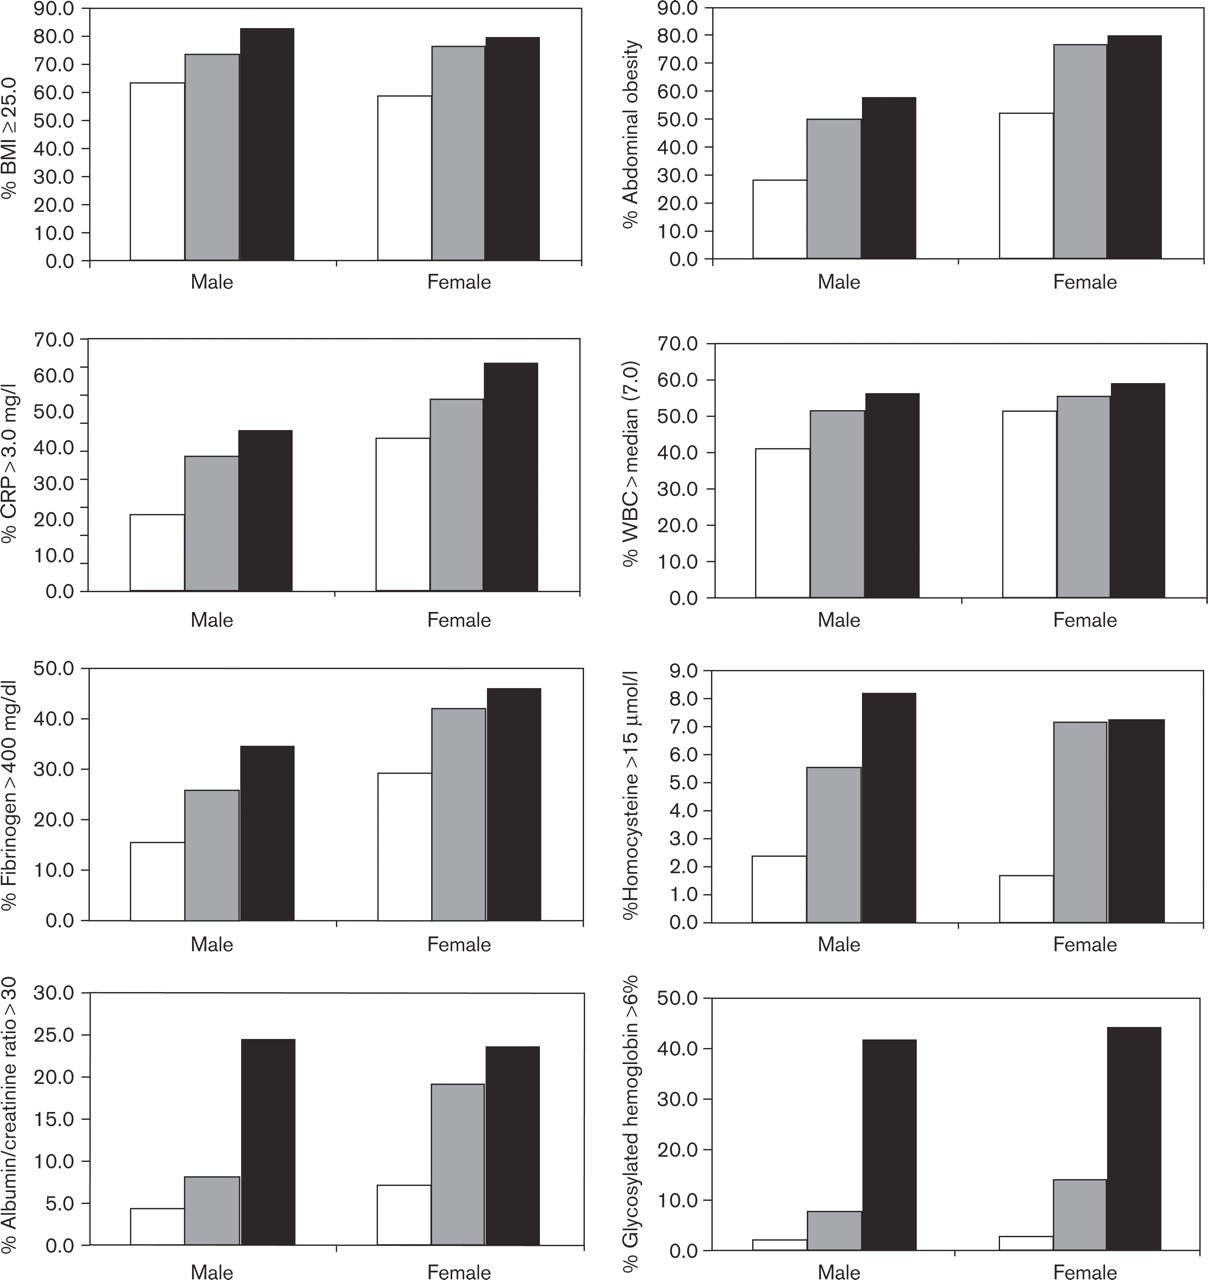
Proportion of persons with high levels of lifestyle and emerging risk factors by sex. White bars: 10-year coronary heart disease (CHD) risk <10%; gray bars: 10-year CHD risk 10–20%; black bars: 10-year CHD risk >20%. WBC, white blood cell count; CRP, C-reactive protein.
Proportions, odds ratio, and 95% confidence intervals (CI) for being in highest 10-year CHD risk group (>20%) by lifestyle and emerging risk factors among US adults aged 20–79 years (NHANES 1999–2002)
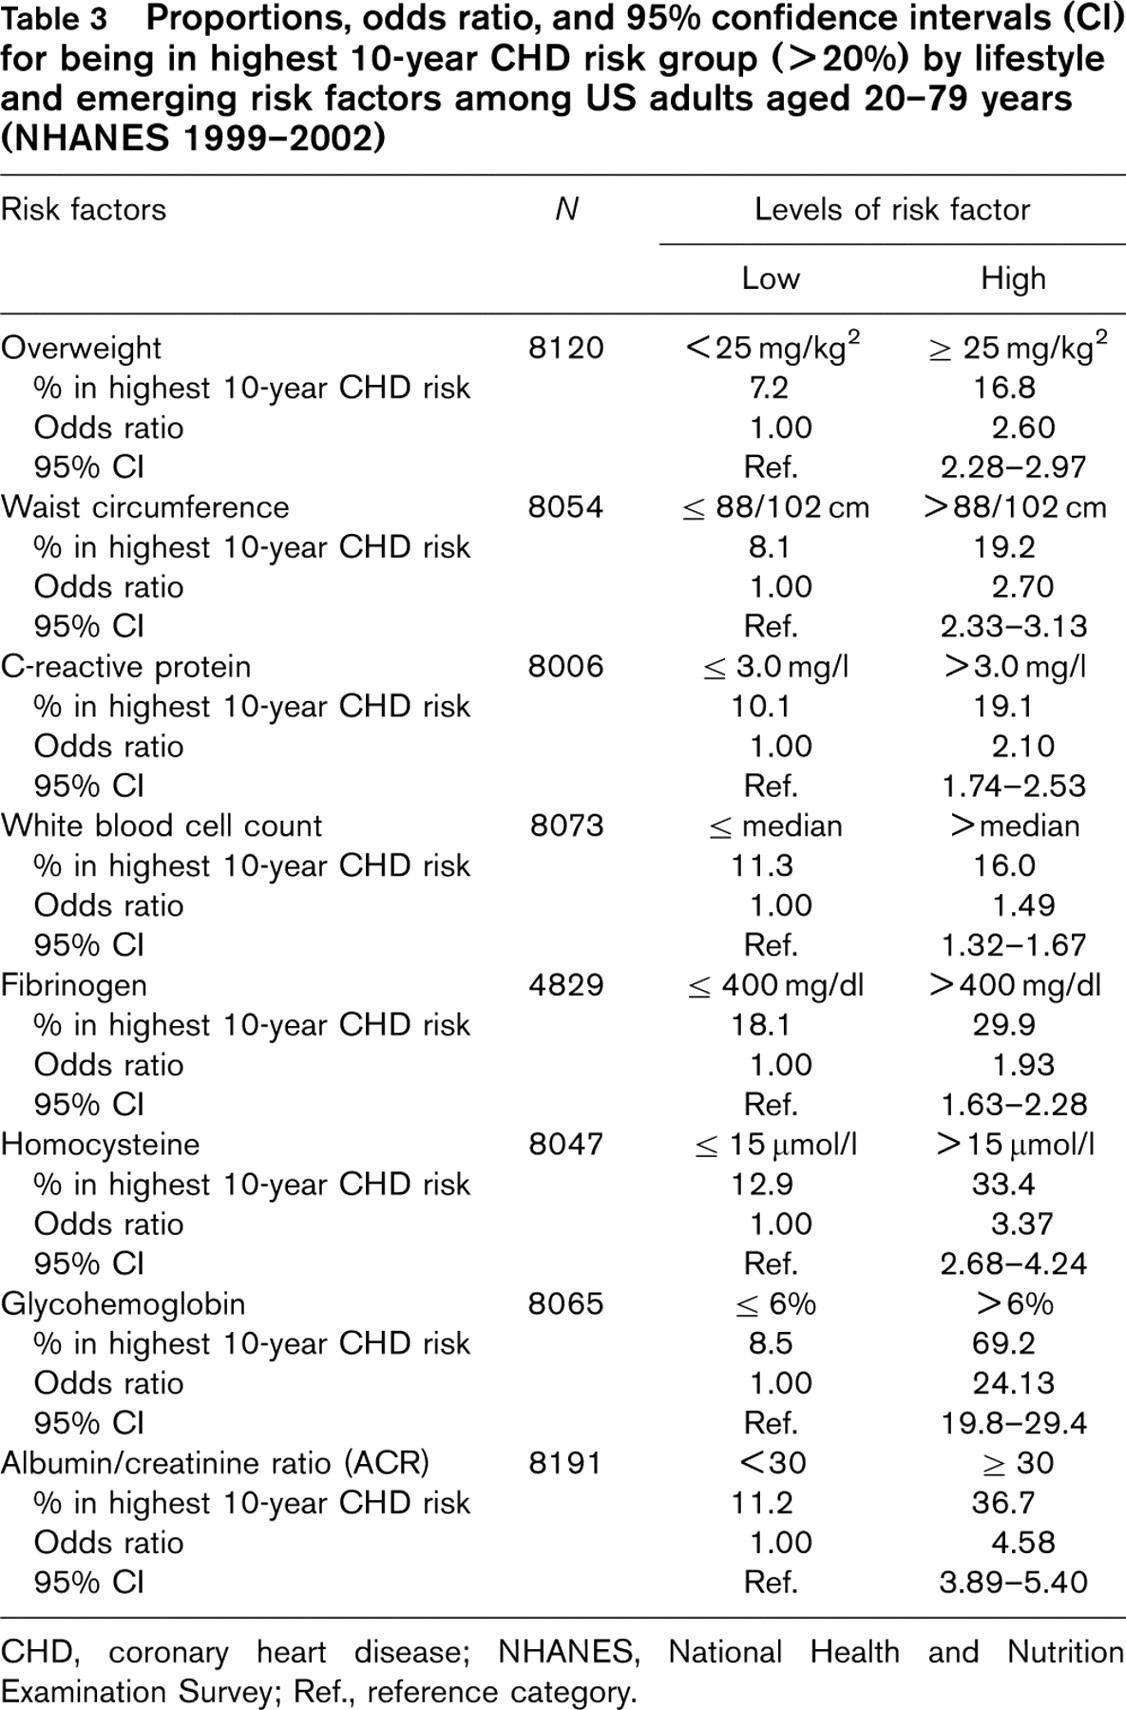
CHD, coronary heart disease; NHANES, National Health and Nutrition Examination Survey; Ref., reference category.
Our findings are based on a large study sample, representative of the US population aged 20–79 years. Therefore the results are applicable to the general US population within this age group. The study was cross-sectional in design and we used self-reports of CHD, stroke, diabetes, and current use of medication for high blood pressure. Therefore, some misclassification cannot be ruled out.
In summary, our results provide important information about the distribution of several emerging risk factors by 10-year CHD risk calculated by modified Framingham scores. They also raise the important issue of risk assessment among persons considered at low 10-year risk of developing CHD. Additional studies and discussions should address this issue, leading to improved risk assessment methods. Such improvements would be especially helpful in current times when an increasing prevalence of associated risk factors, such as obesity, is being reported.