
Abstract
Background
Peak exercise oxygen uptake (peakVo2) is a widely used prognosticator. Novel spirometric parameters, less affected by submaximal performance, such as the rate of increase of minute ventilation per unit decrease of carbon dioxide production (VE/Vco2 slope) and the oxygen uptake efficiency slope (OUES) have recently been introduced.
Aim
To evaluate the discriminative value of OUES, as compared to VE/Vco2 slope in patients with coronary artery disease (CAD) and intermediate peakVo2 values.
Methods and results
Bicycle spiroergometry was applied in 214 patients with CAD (age 67 ± 8 years, 85% men). OUES was strongly related to peakVo2 (r = 0.79). New York Heart Association (NYHA) class, 6-min walking distance, N-terminal probrain natriuretic peptide (NT-proBNP), inflammatory markers, left ventricular (LV) volumes and ejection fraction were evaluated. NT-proBNP levels predicted independently VE/Vco2-slope and OUES. Patients with intermediate peakVo2 (12–18 ml/kg per min) and increased VE/Vco2-slope (≥ 35) had higher NYHA class, lower walking distance, higher NT-proBNP levels and higher LV volumes as compared to patients with a similar peakVo2 but lower VE/Vco2-slope. Similar findings were found for patients with intermediate peakVo2 and high OUES/kg (median value > 15.3).
Conclusion
In CAD patients, OUES was strongly correlated with peakVo2. Both VE/Vco2 slope and OUES were independently associated with NT-proBNP levels. Both VE/Vco2 slope and OUES/kg were able to identify a subgroup of patients with an intermediate peakVo2 that was characterized by advanced remodelling and a higher degree of neurohumoral activation.
Introduction
Spiroergometry is an important tool for assessing functional capacity and defining disease severity [1]. The prognostic value of peak oxygen consumption (peakVo2) in heart failure patients is well established [2], but in asymptomatic subjects and in patients with coronary artery disease (CAD), also, exercise-based measures of functional capacity have been shown repeatedly to provide powerful independent prognostic information [3]. Kavanagh and co-workers [4, 5], for instance, have emphasized the prognostic value of peakVo2 in large cohorts of men and women with established CAD. However, peakVo2 has limitations. First, a true assessment of peakVo2 is dependent on subject motivation. To overcome this problem, submaximal exercise parameters claiming to be independent from subject motivation have been investigated. The relationship between minute ventilation and carbon dioxide production (VE/Vco2-slope) has been shown to be an excellent prognosticator [6–10]. Recently the oxygen uptake efficiency slope (OUES), has been proposed in the evaluation of heart failure patients [11, 12]. OUES, originally used in children, is derived from the single-segment logarithmic relationship between O2 uptake and VE during incremental exercise. OUES correlates significantly with peakVo2 and is not significantly affected by duration of the test, nor by achieved exercise intensity [13–15].
Another limitation of peakVo2 concerns its cut-off value. It is generally accepted that patients with a peakVo2 < 10 ml/kg per min have a poor prognosis and a peakVo2 > 18 ml/kg per min indicates a good prognosis. Many patients, however, have peakVo2 levels between 10 and 18 ml/kg per min. Corra et al. [9] postulated that in these patients the VE/Vco2 slope may represent a proper descriptor of the heterogeneity of haemodynamic and neurohumoral adaptations to exercise and disorders of ventilatory reflex control [9]. They proposed a scheme to evaluate prognosis of heart failure patients using peakVo2 and VE/Vco2 slope (cut-off value 35) in the intermediate exercise group [16].
The aim of the present study was to evaluate the discriminative value of OUES/kg, as compared to VE/Vco2 slope in CAD patients with intermediate peakVo2 values.
Methods
Patient population
We studied 214 consecutive CAD patients, referred for bicycle spiroergometry combined with a 2-day stress–rest gated myocardial perfusion scan. They had a history of myocardial infarction, percutaneous coronary intervention (PCI), coronary artery bypass grafting (CABG) or significant stenosis on coronary angiography, occluding at least 70% of the lumen. Patients with structural valvular disease were excluded. Patients were evaluated remote (> 6 months) from myocardial infarction, PCI and CABG. Moreover, subjects had to be free from infections, systemic diseases, malignancies, treatment with corticosteroids or anti-inflammatory agents, or any other situation that could influence the inflammatory system.
Study protocol
Day 1: Cardiopulmonary exercise testing
Patients came to the laboratory after overnight fasting. Each subject was categorized according to New York Heart Association (NYHA) class. Weight, height and waist circumference were measured; body mass index (BMI) was calculated as weight/height2. Arterial blood pressure was measured with a mercury sphygmomanometer and a 12-lead electrocardiogram (ECG) was recorded. Each subject underwent maximal exercise testing on a bicycle. During the tests patients wore a facemask connected to an Oxycon Pro spirometer (Jaeger, Viasys Healthcare, Hoechberg, Germany). Oxygen consumption (Vo2), CO2 production (Vco2) and minute ventilation (VE) were measured on a breath-by-breath basis. A standard 12-lead ECG was continuously recorded. Heart rate reserve was calculated as (peak heart rate–rest heart rate)/(220–age–rest heart rate) × 100. Blood pressure was measured at each stage and at the peak of exercise. Subjects were exercised to their self-determined maximal capacity or until the physician stopped the test because of significant symptoms, potentially dangerous arrhythmias or ST-segment deviations, or marked systolic hypotension or hypertension. Respiratory exchange ratio (RER; Vco2/Vo2) > 1 was taken to indicate maximal effort. PeakVo2 was defined as the highest Vo2 obtained during the last 20 s of the test.
Calculation of VE/Vco2 slope and OUES VE/Vco2 slope, reflecting the rate of increase in minute ventilation per unit increase in CO2 production, was obtained by linear regression analysis of the relation between VE and Vco2 during exercise, using data of the whole test (including respiratory compensation). OUES describes the relationship between O2 uptake and VE during incremental exercise, via a single-segment logarithmic expression of ventilation. OUES is defined as the regression slope a in Vo2 = alogVE + b. A steeper or higher OUES represents a more efficient O2 uptake, whereas a shallow slope or lower OUES represents a higher amount of ventilation required for any given O2 uptake. OUES can also be expressed per kg body weight: OUES/kg.
Day 2: Blood sampling, resting gated SPECT and 6-min walking test
Serum creatinine concentrations were determined with a rate blanked kinetic Jaffé method and glomerular filtration rate (GFR) was calculated [17]. Serum was frozen at −80°C until further assaying. After blood sampling, patients underwent resting myocardial perfusion. Images were processed using quantified, gated single photon emission computed tomography (SPECT) software to obtain resting left ventricular (LV) end-systolic and end-diastolic volumes and ejection fraction (EF). Finally, patients underwent a self-paced 6-min corridor walk test [18].
Laboratory analysis
Serum concentration of NT-proBNP was measured on an Elecsys 2010 apparatus (Roche Diagnostics, Mannheim, Germany) with an automated electrochemiluminescence sandwich immunoassay. Serum C-reactive protein concentrations were measured by a high-sensitivity, particle-enhanced immunoturbidimetric method on an Integra 400 analyser (Roche Diagnostics, Mannheim, Germany).
Total imprecision was < 3%. Soluble tumour necrosis factor receptors 1 and 2 (sTNFr 1 and sTNFr 2) were measured with ELISA kits from BioSource (Camarillo, California, USA) with sensitivities of 0.05 and 0.1 ng/ml, respectively. Interleukin-6 (IL-6) was measured with a high sensitivity ELISA kit from R&D Systems Europe (Abingdon, Oxfordshire, UK). Sensitivity was 0.1 pg/ml.
Statistical analysis
Data were analysed with a statistical program (SPSS 12.0; SPSS Inc., Chicago, Illinois, USA). Continuous variables are presented as mean ± standard deviation and categorical variables as a percentage. Pearson correlations were used to determine univariate determinants [age, gender, exercise haemodynamics, LV volumes, left ventricular ejection fraction (LVEF), GFR, inflammation and neurohumoral activation] of VE/Vco2 slope and OUES/kg. Significant variables in univariate analysis were entered into linear regression models to determine multivariate predictors. The patients were divided in three groups: 28 patients with peakVo2 < 12 ml/kg per min, 94 patients with peakVo2 between 12 and 18 ml/kg per min and 92 patients with peakVo2 > 18 ml/kg per min. The intermediate peakVo2 group was divided in two subgroups according to VE/Vco2 slope (cut off 35) or according to median value of OUES/kg (cut off 15.3). Analysis of variance (ANOVA) and Student's t-tests were used when appropriate. Significance level P was set at 0.05. NT-proBNP, high-sensitivity C-reactive protein (hsCRP), IL-6, sTNFr 1 and 2 were not normally distributed and underwent logarithmic transformation before statistical analysis. Natural values of hsCRP, NT-proBNP, IL-6 and sTNF receptors are given in the tables.
Ethics
The study protocol was approved by the ethical committee of the University Hospital Ghent and each patient signed an informed consent form before participating.
Results
Study population
Mean age of the patients was 67 ± 8 years (range 47–89 years), 85% male, mean BMI was 28 ± 4 kg/m2 and mean waist circumference was 100 ± 13 cm. Both asymptomatic and symptomatic patients (NYHA: 1.4 ± 0.6, range 1–3) with preserved LV function and with poor LV systolic function (LVEF 55 ± 14%, range 13–86%) were included. Many patients had a history of myocardial infarction (52%), PCI (43%) or CABG (49%); 17% had a history of heart failure. Cardiac risk factors were hypercholesterolaemia (91%), arterial hypertension (36%), diabetes mellitus (25%) and smoking (12%). Patients received standard medication: aspirin (76%), beta-blockers (81%), angiotensin-converting enzyme (ACE) inhibitors or angiotensin (AT)-II receptor blockers (66%), calcium-channel blockers (24%), diuretics (27%) and statins or fibrates (74%). In the low peakVo2 group 86% used beta-blockers, compared to 76 and 71% in the intermediate and high peakVo2 groups, respectively (NS).
The exercise test was stopped because of angina pectoris in eight patients and ECG abnormalities were found in 25% of the patients. Exercise haemodynamics according to peakVo2 category are reported in Table 1. Patients with a peakVo2 < 12 ml/kg reached lower watts and lower peak heart rate, resulting in lower heart rate reserve. Mean RER was 1.2 in the three groups, indicating adequate metabolic stress. Patients in the lowest peakVo2 category had higher VE/Vco2 slopes and lower OUES and OUES/kg. Ten patients were in NYHA class 3, mean peakVo2 in these patients was 11.7 ml/kg per min, mean VE/Vco2 slope was 38.7 and mean OUES/kg was 11.6. Sixteen patients had a LVEF < 30%, mean peakVo2 was 16.1 ml/kg per min, mean VE/Vco2 slope was 37 and mean OUES/kg was 15.4. Patients with a history of heart failure had a mean age of 68 ± 8 years; NYHA class 2.0 ± 0.7; LV end-diastolic volume, 168 ± 110 ml; mean ejection fraction, 47 ± 17%; and mean NT-proBNP levels of 1184 ± 1672 pg/ml. This subgroup reached a peakVo2 of 14.9 ± 5.4, VE/Vco2 slope 35 ± 7 and mean OUES/kg 14.9 ± 5.4.
Basic characteristics and exercise haemodynamics according to peakVo2 categories
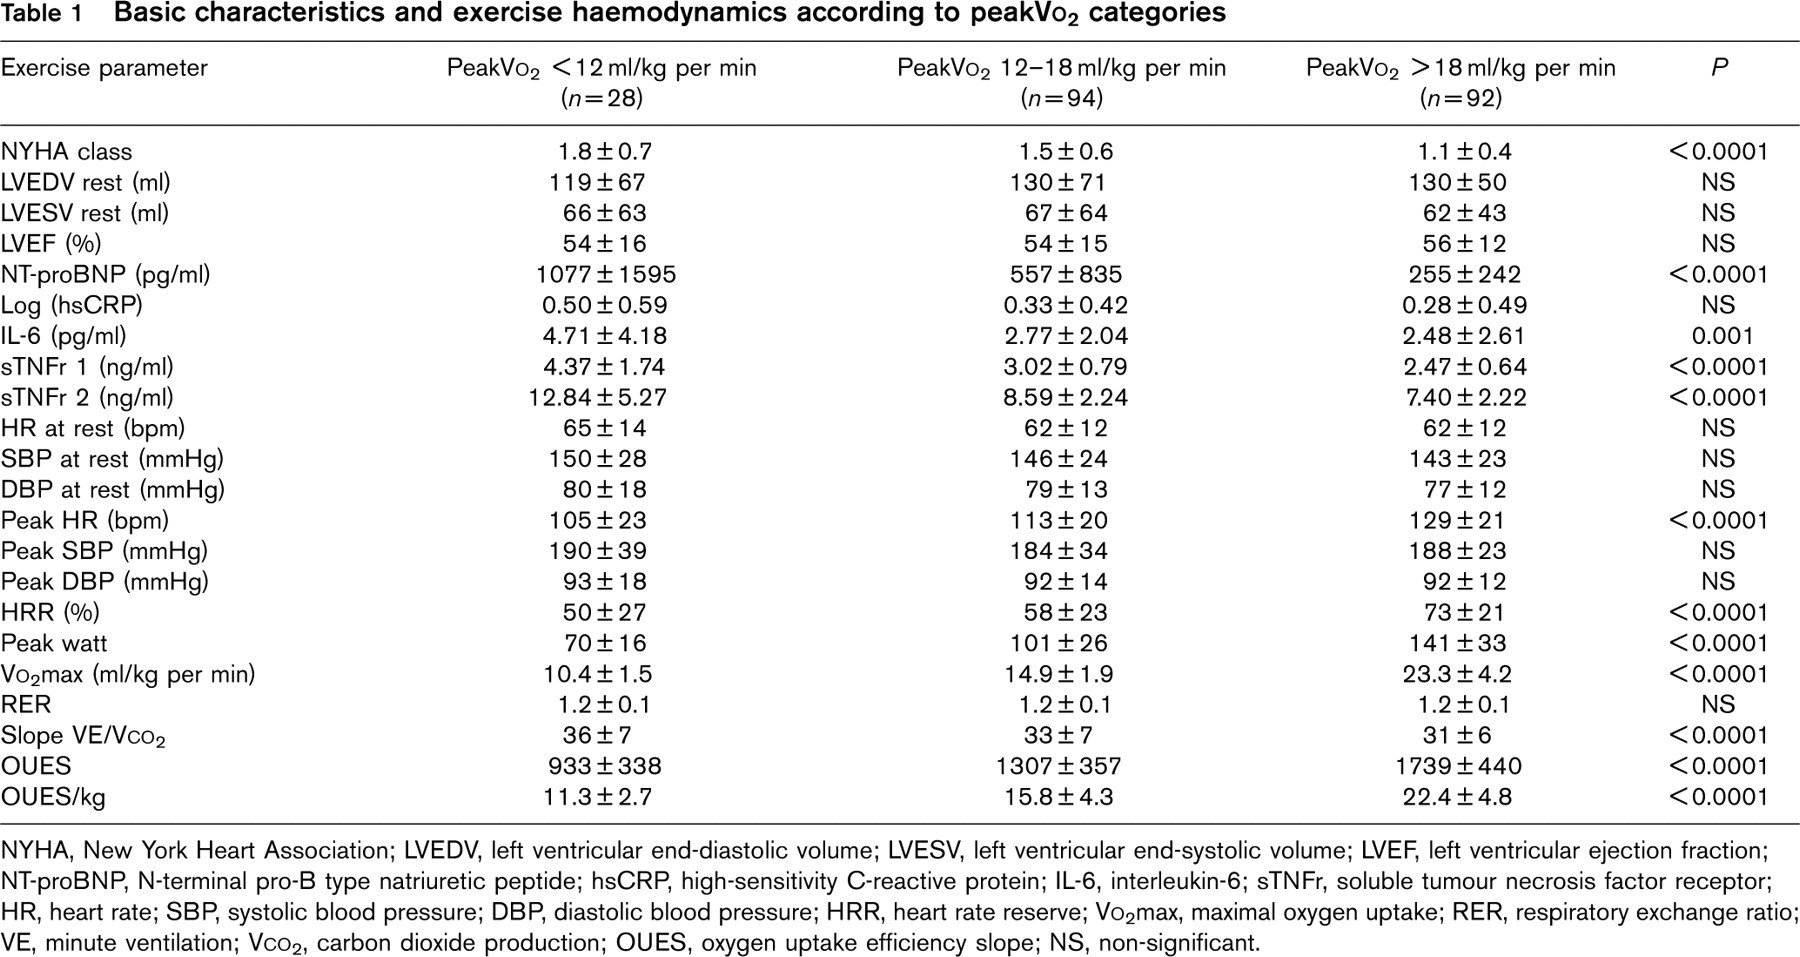
NYHA, New York Heart Association; LVEDV, left ventricular end-diastolic volume; LVESV, left ventricular end-systolic volume; LVEF, left ventricular ejection fraction; NT-proBNP, N-terminal pro-B type natriuretic peptide; hsCRP, high-sensitivity C-reactive protein; IL-6, interleukin-6; sTNFr, soluble tumour necrosis factor receptor; HR, heart rate; SBP, systolic blood pressure; DBP, diastolic blood pressure; HRR, heart rate reserve; Vo2max, maximal oxygen uptake; RER, respiratory exchange ratio; VE, minute ventilation; Vco2, carbon dioxide production; OUES, oxygen uptake efficiency slope; NS, non-significant.
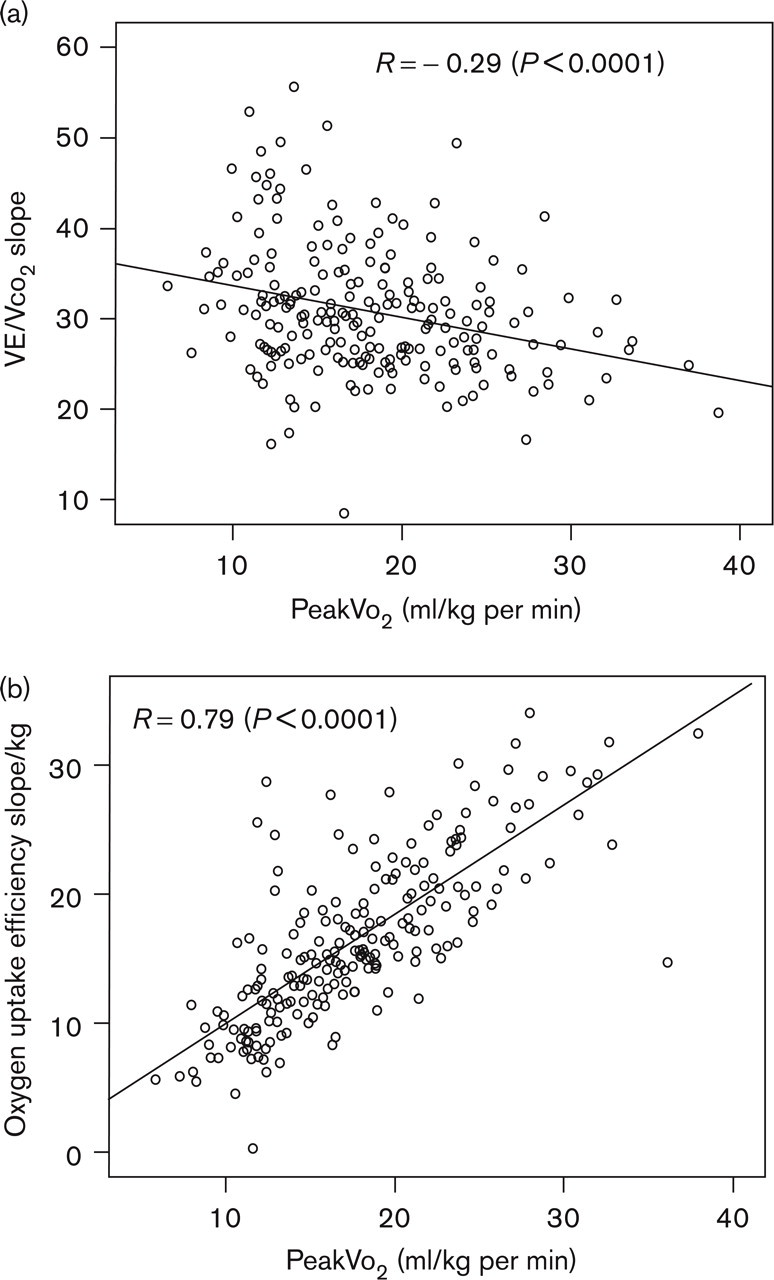
Scatter plots illustrating the correlation between peak oxygen uptake (peakVo2) and (a) VE/Vco2 slope and (b) oxygen uptake efficiency slope/kg. Pearson correlation coefficients are also shown.
VE/Vco2 correlates weakly with peakVo2 (Fig. 1). An excellent correlation was found between OUES/kg and peakVo2. The correlation coefficient between OUES/kg and VE/Vco2 slope was −0.53 (P < 0.0001).
Determinants of VE/Vco2 slope and OUES/kg
Mean VE/Vco2-slope was 32.4 (range 11.4–55.7). Univariate correlates of VE/Vco2 slope were: age, peak heart rate (inverse), GFR (inverse), NT-proBNP, IL-6 and sTNFr 1 and 2 (r ranging from – 0.14 to 0.31, P ranging from 0.04 to < 0.0001). In multivariate regression analysis (model R 2: 0.14, P < 0.0001) only log(NT-proBNP) remained a significant predictor (β = 2.7, P = 0.001).
Mean OUES/kg was 18.1 (range 3.3–34.4). In univariate analysis OUES/kg was correlated with age (inverse), gender, peak heart rate, GFR, NT-proBNP (inverse), IL-6 (inverse) and sTNFr 1 and 2 (inverse) (r ranging from −0.18 to −0.36, P < 0.0001). In multivariate regression analysis (model R 2: 0.27, P < 0.0001) only gender (β = 4.3, P < 0.0001), peak heart rate (β = 0.06, P = 0.001) and log(NT-proBNP) (β = −2.7, P = 0.001) remained significant independent predictors of OUES/kg.
Characteristics of patients with an intermediate Vo2max according to VE/Vco2 slope and OUES/kg
Patients with intermediate peakVo2 and a VE/Vco2 slope ≥ 35 differed significantly from patients with intermediate peakVo2 and a VE/Vco2 slope < 35 in terms of age, 6-min walking distance, OUES, OUES/kg, LVEF and NT-proBNP levels (P < 0.05) (Table 2, Fig. 2). They had significantly larger resting LV end-diastolic and end-systolic volumes. Renal function (GFR) was comparable: 74 versus 80 ml/min per 1.73 m2 (NS). No significant differences were observed in terms of inflammatory markers (Fig. 3).
Characteristics of patients with an intermediate exercise capacity subdivided in two categories using VE/Vco2 slope
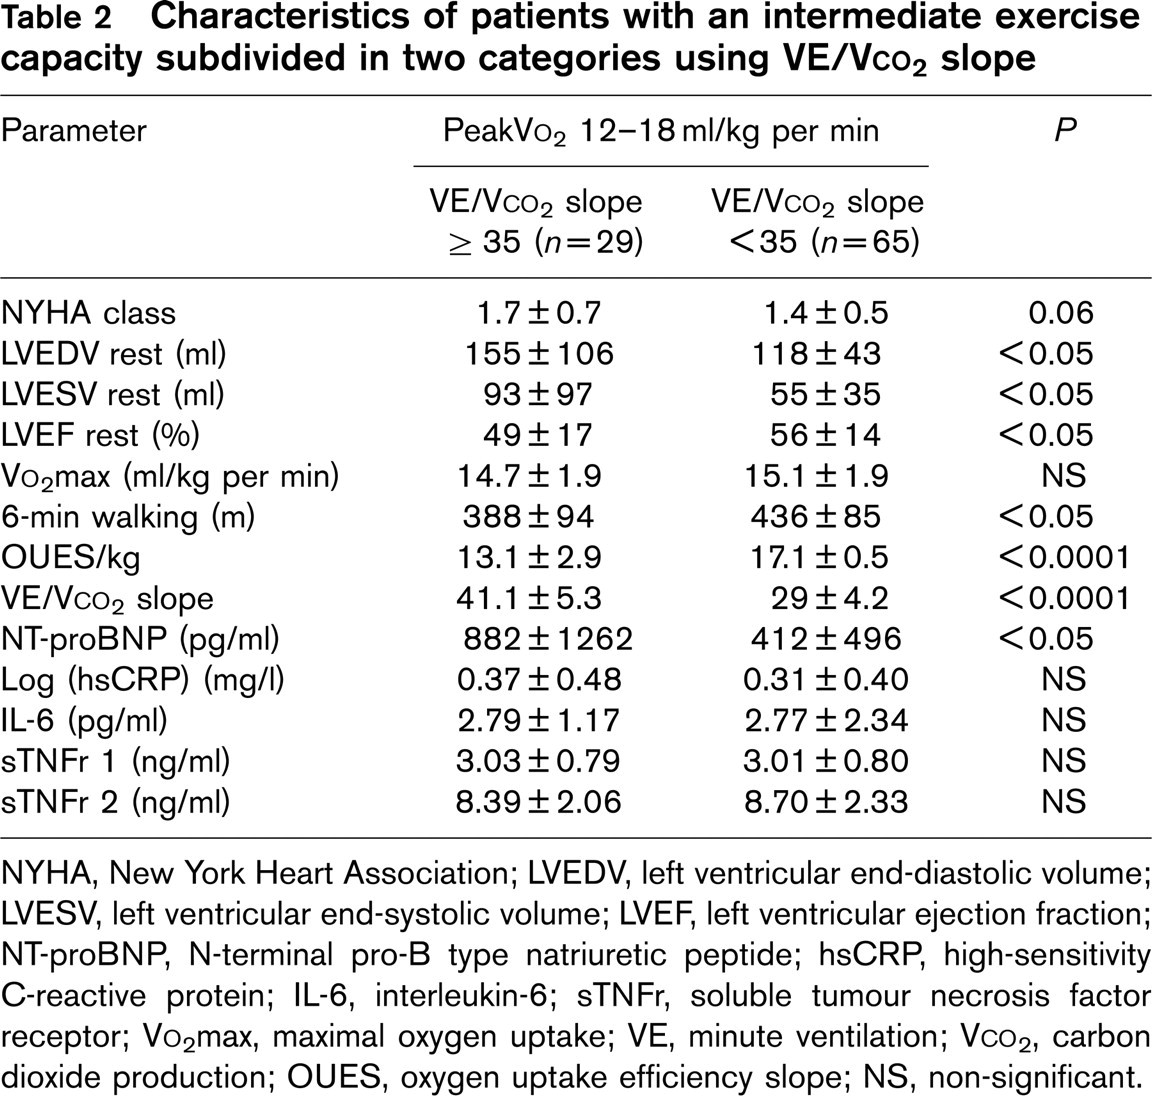
NYHA, New York Heart Association; LVEDV, left ventricular end-diastolic volume; LVESV, left ventricular end-systolic volume; LVEF, left ventricular ejection fraction; NT-proBNP, N-terminal pro-B type natriuretic peptide; hsCRP, high-sensitivity C-reactive protein; IL-6, interleukin-6; sTNFr, soluble tumour necrosis factor receptor; Vo2max, maximal oxygen uptake; VE, minute ventilation; Vco2, carbon dioxide production; OUES, oxygen uptake efficiency slope; NS, non-significant.
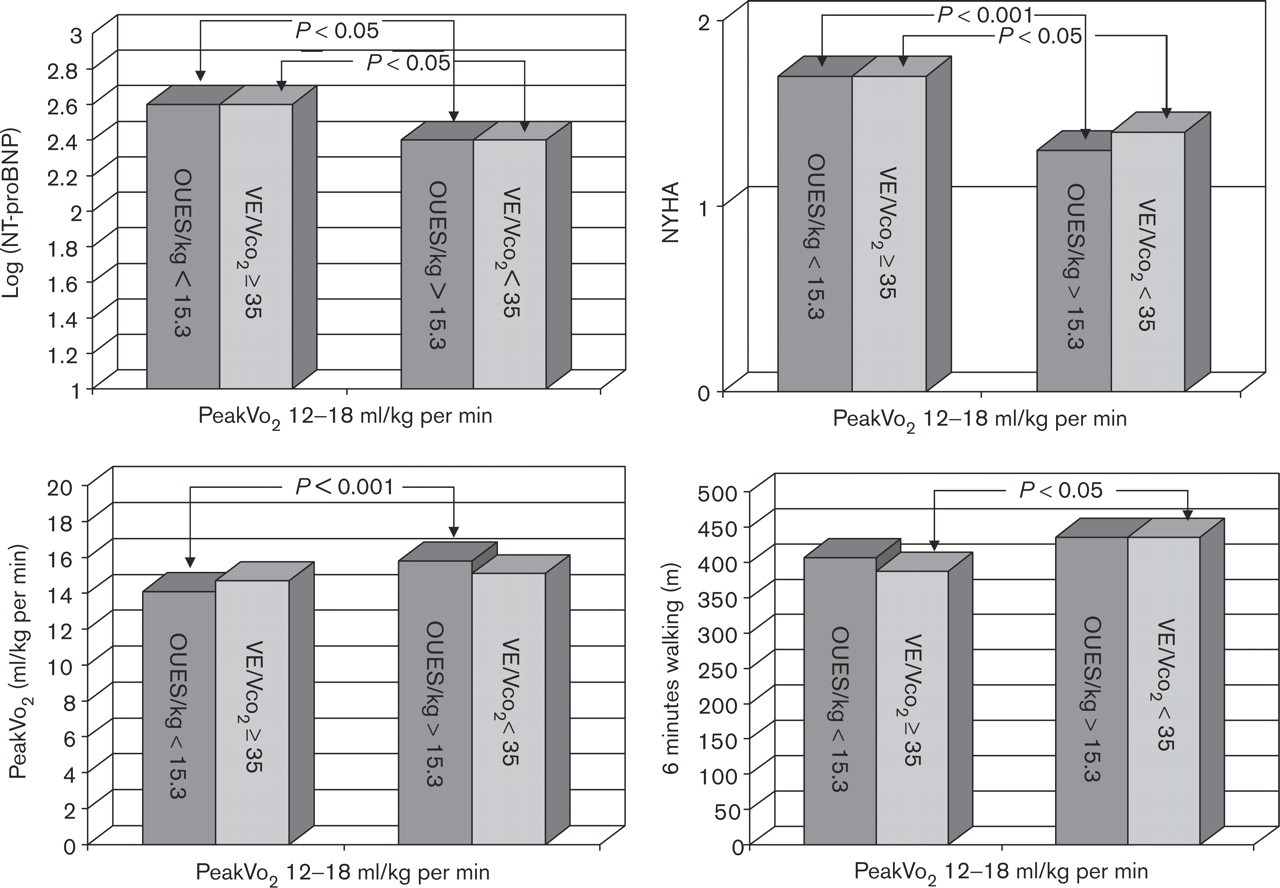
Log N-terminal pro-B type natriuretic peptide [log(NT-proBNP)] (left upper panel), New York Heart Association (NYHA) class (right upper panel), peak oxygen uptake (peakVo2) (left lower panel) and 6-min walking test (right lower panel) in patients with an intermediate exercise capacity (peakVo2 12–18 ml/kg per min), who are further divided in two groups according to VE/Vco2 slope (VE, minute ventilation; Vco2, carbon dioxide production; cut-off value 35) or OUES/kg (oxygen uptake efficiency slope; cut-off value 15.3).
Parameters that differed significantly between patients with intermediate peakVo2 and OUES < 15.3 and patients with intermediate peakVo2 and OUES > 15.3 were NYHA, peakVo2, VE/Vco2 slope and NT-proBNP levels (P < 0.05) (Table 3, Fig. 2). They had significantly larger resting LV end-diastolic and end-systolic volumes (P < 0.05). Renal function was comparable: 76 versus 81 ml/min per 1.73 m2 (NS). No significant differences were observed in terms of inflammatory markers (Fig. 3).
Patients with a VE/Vco2 slope ≥ 35 and OUES/kg below the median value
These 42 patients were on average older (71 ± 8 years), had higher LV end-diastolic volumes (137 ± 99 ml), higher NT-proBNP levels (1142 ± 1608 pg/ml) and higher inflammatory biomarkers.
Discussion
In the present study, comprising 214 patients with established CAD, both OUES/kg and VE/Vco2 slope were related to indexes of progressive LV remodelling, systolic dysfunction and neurohormonal activation. Both OUES/kg and VE/Vco2 slope could be used for further stratification of patients with an intermediate peakVo2.
The search for sensitive prognosticators, applicable in cardiac patients unable to reach true maximal exercise, has recently focused on OUES. Several authors have described an excellent reproducibility in children or healthy adults [13–15, 19] and OUES has been validated in cardiac patients [11, 12, 15, 20]. The present study confirms these previous studies: OUES was easy to calculate and OUES/kg was strongly correlated with peakVo2; OUES and OUES/kg decreased significantly as peakVo2 decreased.
To assess prognosis in heart failure patients, single cut-off values for peakVo2 are widely used. This dichotomizing approach has been questioned by Corra and co-workers [16] because it tends to oversimplify the clinical and prognostic significance of peakVo2. Individuals with a low peakVo2 have a poor prognosis but many patients belong to the intermediate peakVo2 group. Corra et al. [9] analysed 403 patients with intermediate functional capacity, showing that VE/Vco2 slope was the strongest independent predictor of major cardiac events at multi-variate analysis and patients with a VE/Vco2 slope ≥ 35 had a mortality rate similar to that of patients with the lowest peakVo2. Based on these results, Corra et al. proposed an algorithm that considers patients with an intermediate peakVo2 as high-risk patients if their VE/Vco2-slope is ≥ 35, otherwise they are classified as moderate-risk patients.
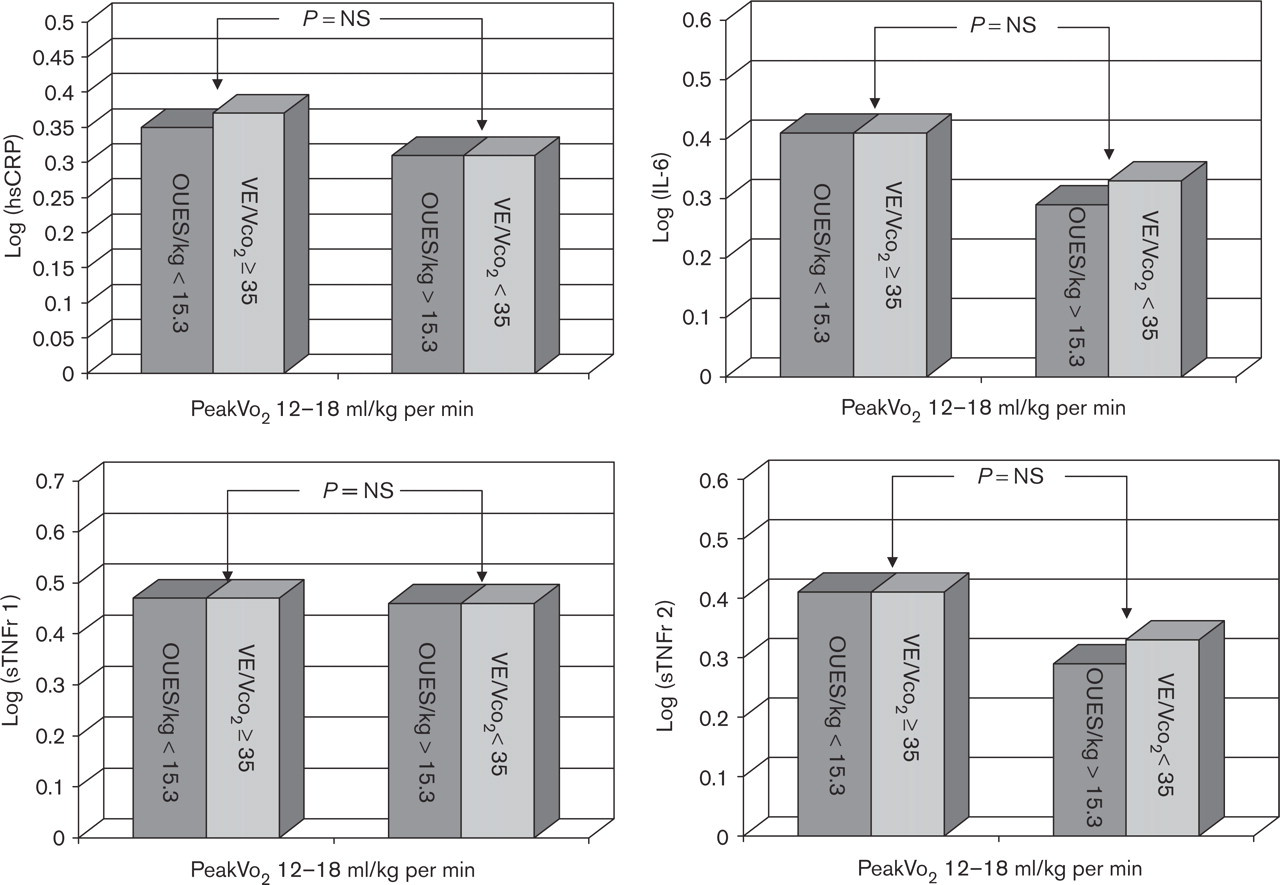
Log high-sensitivity C-reactive protein (hsCRP) (left upper panel), log interleukin-6 (IL-6) (right upper panel), log soluble tumour necrosis factor receptor 1 (sTNFr 1) (left lower panel) and log soluble tumour necrosis factor receptor 2 (sTNFr 2) (right lower panel) in patients with an intermediate exercise capacity (peakVo2 12–18 ml/kg per min), who are further divided in two groups according to VE/Vco2 slope (VE, minute ventilation; Vco2, carbon dioxide production; cut-off value 35) or OUES/kg (oxygen uptake efficiency slope; cut-off value 15.3).
In the present study, VE/Vco2 slope, using the cut-off value of 35, was applied to divide patients with intermediate peakVo2 into two subgroups. Patients with a VE/Vco2 slope ≥ 35 scored worse for several heart failure indices compared to patients with the same peakVo2 but with a VE/Vco2 slope < 35: NYHA class was higher, 6-min walking distance was lower and NT-proBNP levels were higher. Inflammatory biomarkers were not significantly different. Importantly GFR was comparable, thus excluding renal insufficiency as an explanation for the higher NT-proBNP levels. LV volumes were markedly enlarged in patients with a VE/VCO2-slope ≥ 35. Advanced remodelling and increased wall stress could explain neurohumoral activation in these patients. It was suggested by Corra and co-workers that the prognostic pre-eminence of the VE/Vco2 slope may be linked to an underlying abnormal response to exercise and sympathetic overactivity and neurohormonal imbalance [9]. Passino et al. [21] studied 154 heart-failure patients and found NT-proBNP to be the only independent predictor of VE/Vco2 slope [21]. They concluded that NT-proBNP reflects haemodynamic failure (which enhances adrenergic drive) and depressed exercise tolerance and ventilatory inefficiency. In the present study only NT-proBNP was a significant independent predictor of VE/Vco2 slope, confirming the study by Passino et al.
Characteristics of patients with an intermediate exercise capacity subdivided in two categories using OUES/kg
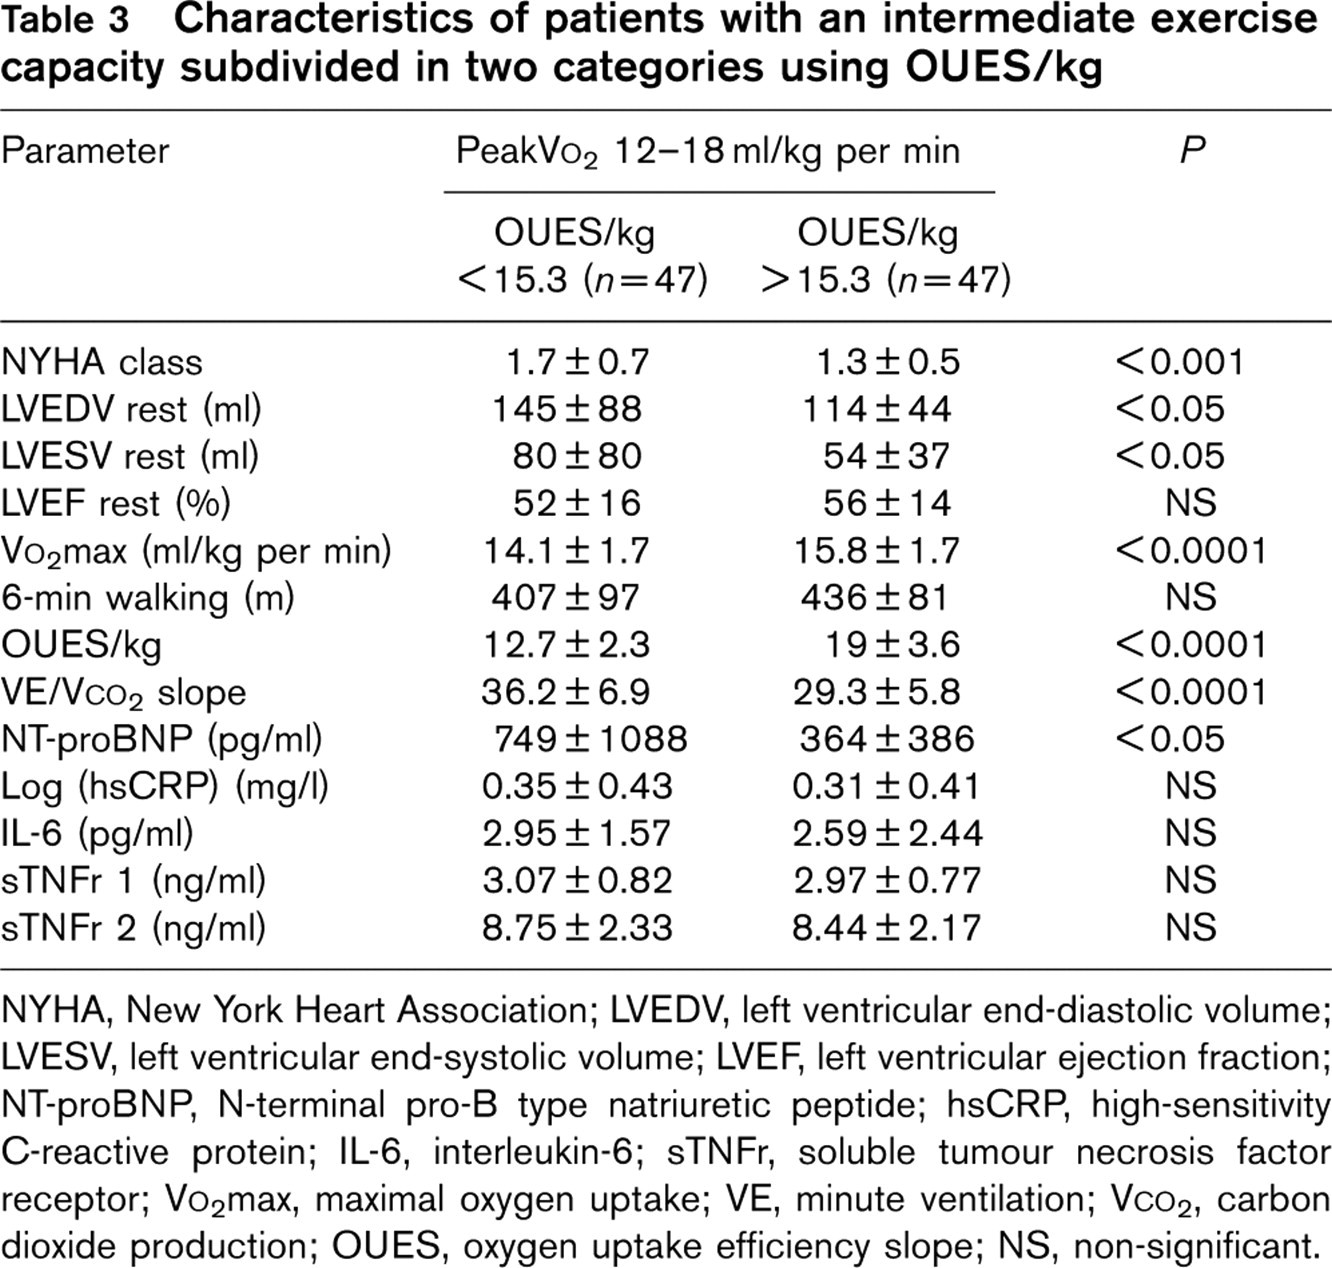
NYHA, New York Heart Association; LVEDV, left ventricular end-diastolic volume; LVESV, left ventricular end-systolic volume; LVEF, left ventricular ejection fraction; NT-proBNP, N-terminal pro-B type natriuretic peptide; hsCRP, high-sensitivity C-reactive protein; IL-6, interleukin-6; sTNFr, soluble tumour necrosis factor receptor; Vo2max, maximal oxygen uptake; VE, minute ventilation; Vco2, carbon dioxide production; OUES, oxygen uptake efficiency slope; NS, non-significant.
Accurate measurement of peakVo2 relies entirely on data from the last part of exercise, whereas VE/Vco2 slope can be computed from submaximal data, which could be interesting in cases of symptom-limited exercise. However, Tabet et al. [22] reported that the prognostic value of a submaximal VE/Vco2 slope was less than that of the overall VE/Vco2 slope or even peakVo2. Van Laethem et al. [12] reported a significant influence of foreshortened exercise duration on calculated peakVo2 and VE/Vco2 values but OUES calculated from data from the first 50 or 75% of the entire maximal exercise duration did not differ significantly from OUES calculated from the entire maximal exercise duration. These findings were confirmed by Davies et al. [23] who were also the first to report on the prognostic value of OUES. They found OUES to be an effective, independent measure of pathological exercise physiology with a prognostic value, which is better than that of standard cardiopulmonary exercise test-derived variables.
We hypothesized that OUES, similar to VE/Vco2, could be used to discriminate two groups within the patients with an intermediate peakVo2. As a cut-off we used the median value of OUES/kg (15.3) within the intermediate peakVo2 group. The two groups also differed from each other in terms of indices of progressive LV remodelling, systolic dysfunction and neurohormonal activation. Patients with lower OUES/kg had higher NYHA class and higher VE/Vco2 slope. Like patients with a VE/Vco2 slope ≥ 35, patients with a low OUES/kg also had higher levels of NT-proBNP. Inflammatory markers were not significantly different from patients with intermediate peakVo2 and high OUES/kg; further studies are needed to clarify this issue. In multivariate analysis OUES/kg was independently predicted by gender, peak heart-rate and log(NT-proBNP). This suggests – but does not prove – that OUES could also potentially be used to identify a subgroup within patients with intermediate peakVo2, who might have a worse outcome.
Limitations
This is an observational study; prospective confirmation of our findings with a long-term follow-up will be necessary to determine whether using OUES in order to stratify patients with an intermediate peakVo2 also identifies patients with a worse prognosis, and to evaluate whether this approach would be as effective as a VE/Vco2 slope-based algorithm. Some authors have questioned the prognostic value of VE/Vco2 slope in patients treated with beta-blockers and the experience with OUES in beta-blocker treated patients is limited [24].
In patients with established coronary artery disease, OUES was easy to calculate and was strongly correlated with peakVo2. Both VE/Vco2 slope and OUES were independently predicted by NT-proBNP levels and were related to indices of progressive LV remodelling, systolic dysfunction and neurohormonal activation. Both VE/Vco2 slope and OUES/kg were able to identify a subgroup within patients with intermediate peakVo2 that was categorized by advanced remodelling and a higher degree of neurohumoral activation.
Footnotes
Acknowledgements
Roche Diagnostics provided the NT-proBNP assay kits but had no other role in the study.