





Abstract
Background
Methods
Results
Conclusion
Keywords
Introduction
Atherosclerosis, the process that leads to the development of cardiovascular disease (CVD) is usually caused by the combined effects of a number of risk factors. For this reason, guidelines on the prevention of CVD stress the importance of the assessment of total CV risk, so that the most aggressive risk factor modification can be directed towards those at highest risk [1, 2].
The Systematic COronary Risk Evaluation (SCORE) system was developed in 2003, at the request of the European Society of Cardiology as a risk estimation system, that would be applicable to European populations [3]. It was derived by using pooled data from 12 European cohort studies, containing over 205 000 people. HeartScore, the electronic counterpart of SCORE, was created by the combination of SCORE and the Danish PRECARD system [4, 5]. These are the risk estimation systems recommended by the Fourth Joint Task Force of the European Societies' guidelines on CVD prevention in clinical practice [1] and have become widely used throughout Europe and worldwide.
Originally, two versions of SCORE were derived with different measures of lipid status. One used total cholesterol (TC) whereas the other used TC/high-density lipoprotein cholesterol (HDL-C) ratio [3]. The two versions of SCORE produced unexpectedly similar results and classified persons to very similar levels of risk. Less than 1% of the population were assigned a 10-year CV risk that differed by greater than 1% [3]. This seemed counterintuitive given the independent association between HDL-C and CV risk [6–15]. As pointed out in the original SCORE paper, it may be possible that entering the TC and HDL-C as separate variables in the function would result in improved risk estimation compared with using the TC/HDL-C ratio [3]. This would not be possible in a two-dimensional chart, but would be feasible as a part of HeartScore [5].
Elevated levels of HDL-C have been shown to be associated with protection against the development of CVD in several populations [4, 6–15]. This independent association coupled with the substantial information that exists regarding the biological mechanism by HDL-C exerts its protective effect [16] and the fact that HDL-C measurement is standardized and reliable makes it a suitable candidate for inclusion in risk estimation systems. However, it should be remembered that causality has not been conclusively proven. Other risk estimation systems including Framingham [17], PRO-CAM [18], CUORE [19], QRISK, [20] and ASSIGN [21] include HDL-C either as a part of the TC/HDL-C ratio [20] or as a separate variable [17–19, 21].
Recently, we have shown an inverse independent relationship between HDL-C and CVD mortality in the SCORE dataset, which was evident in both men and women and in both high and low-risk regions of Europe. The strongest association between CVD mortality and HDL-C was seen in women from high-risk countries [22]. In this study, we describe the derivation of a risk function from the SCORE dataset, which includes both TC and HDL-C as separate variables and explore the performance of this function compared with the one containing TC alone.
Study population
The SCORE function was derived from a pooled dataset containing data from 12 European cohort studies. The data contain 205 178 participants with a combined observation time of 2.7 million person years. During this time 7934 CVD deaths occurred. Seven of the original 12 studies that included data on HDL cholesterol were included in this analysis, comprising 57 302 men and 47 659 women. During this observation time of 991 058 person years, 2463 fatal CVD events occurred. The cohort studies included were from high-risk countries; Finland, Denmark and Britain and from low risk countries; Spain, Italy, Germany, and Belgium. The definition of the high and low-risk countries was the same as that used in the original SCORE project. The details of the numbers from each country and the baseline characteristics are given in supplementary Table A.
Methods
The methods of the individual studies included have been extensively described previously [23–29]. Regarding the laboratory measurement of HDL cholesterol, all studies used the precipitation method for the removal of apolipoproteins B-containing particles, although the reagents used differed, as shown in supplementary Table G. Cholesterol determination was by enzymatic methods in all, apart from 13 of the 24 individual studies in the British regional heart study that used the Liebermann-Burchard method and were adjusted for this using a small correction factor [29]. Four of the seven studies were part of the Multinational Monitoring of Trends and Determinants in Cardiovascular Disease study [23–26] and therefore underwent quality assessment according to the Multinational Monitoring of Trends and Determinants in Cardiovascular Disease protocol [30].
The methods used to derive the risk function were similar to the original SCORE methodology [3]. The Cox proportional hazards model was used. Two functions were derived. One, denoted HDL-C function, contained the following variables: TC, HDL cholesterol, systolic blood pressure (SBP), smoking status (current vs. noncurrent smokers) and the other, denoted function without HDL-C, contained the same variables except for HDL-C. For both functions, age was used as the time variable and the models were stratified by cohort. The second function was derived to compare the performance of the function with and without HDL-C. One important difference between the original methods and those discussed here is that the β-coefficients for the risk factors here are sex specific. This was done because of the difference in the effect of HDL-C in women compared with men [22]. Additional details on the statistical methods for the derivation of the functions are given in the supplementary material. Diabetes was not included as a risk factor in the original SCORE study [3], because the European guidelines on CVD prevention consider those with diabetes to be already at high risk [1].
Hazard ratios for HDL-C function and function without HDL-C for men and women (per 1 standard deviation Increase for continuous variables and for current smoker versus noncurrent smoker)

HDL-C, High-density lipoprotein cholesterol, standard deviation, 0.38 mmol/l in women; 0.34 mmol/l in men TC, total cholesterol standard deviation, 1.3 mmol/l in women, 1.2 mmol/l in men; SBP, systolic blood pressure standard deviation, 22 mmHg in women 20mmHg in men. CHD, coronary heart disease; CVD, cardiovascular disease; SBP, systolic blood pressure; SCORE, systematic coronary risk evaluation.
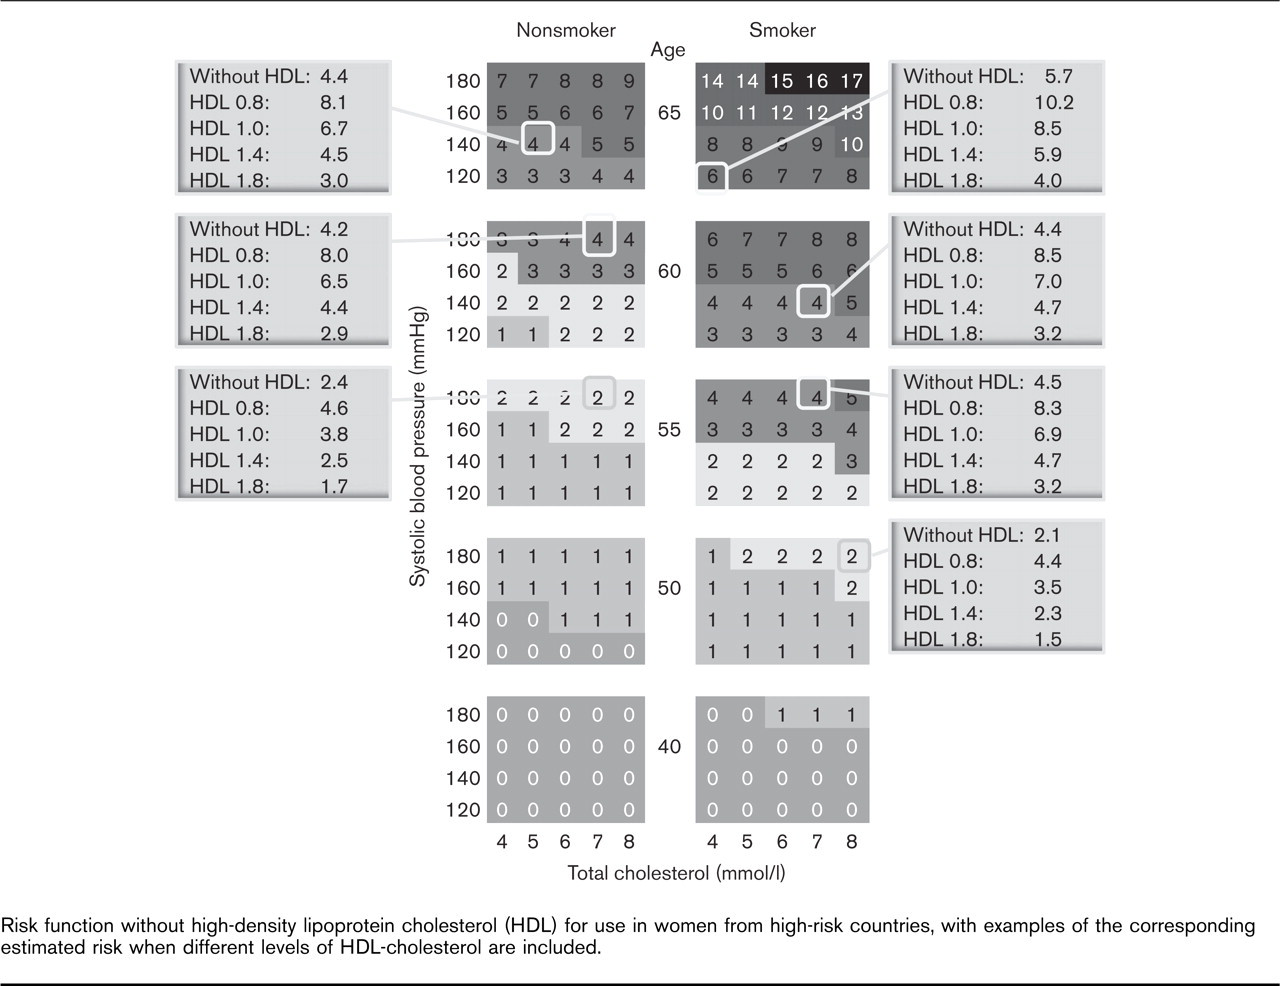
Risk function without high-density lipoprotein cholesterol (HDL) for use in women from high-risk countries, with examples of the corresponding estimated risk when different levels of HDL-cholesterol are included.
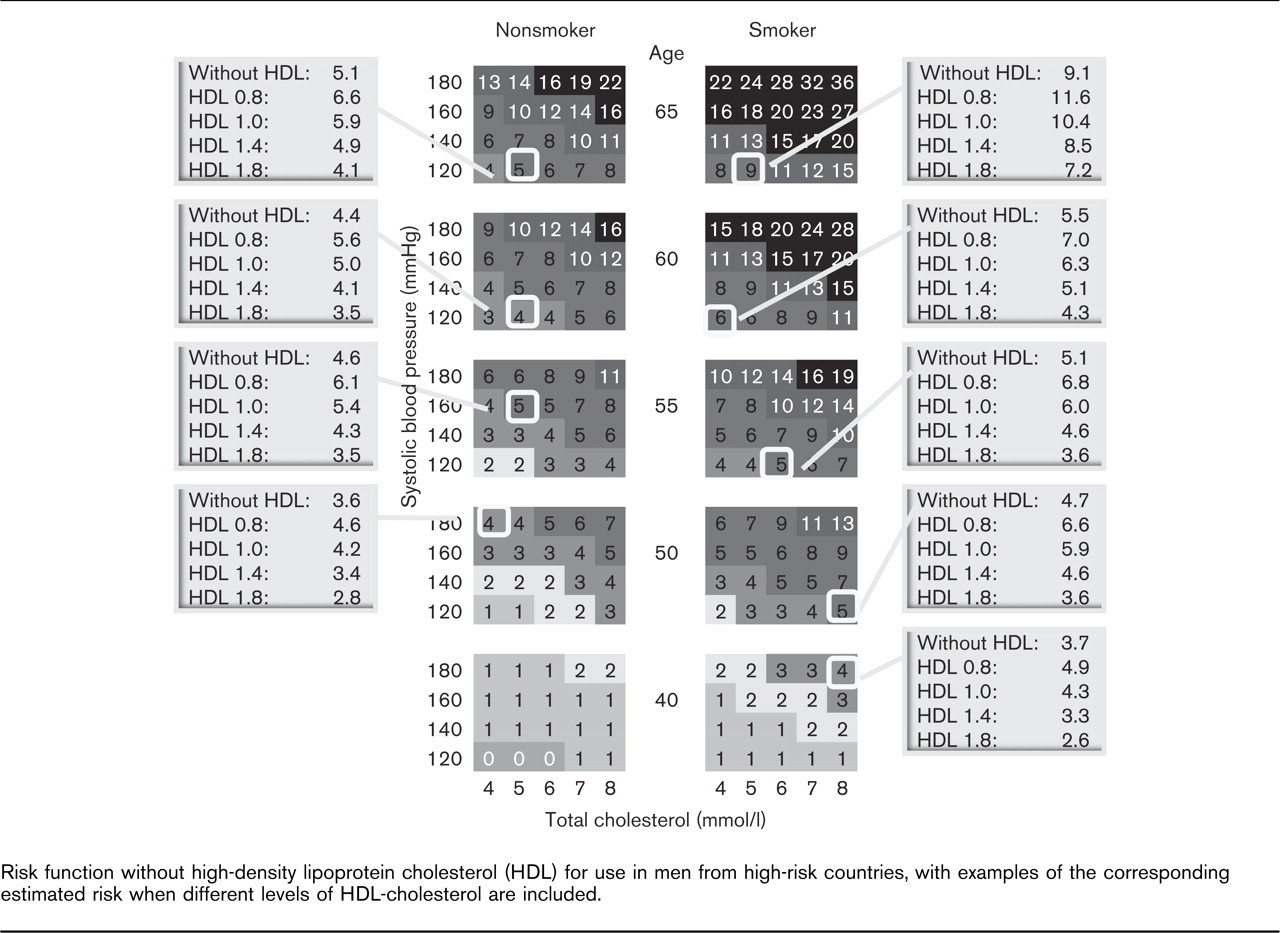
Risk function without high-density lipoprotein cholesterol (HDL) for use in men from high-risk countries, with examples of the corresponding estimated risk when different levels of HDL-cholesterol are included.
The discrimination of the HDL-C function was compared with that of the function without HDL-C using the area under receiver operating characteristic curve (AUROC). A small proportion of the dataset did not have follow-up to 10 years; in this situation we calculated Harrell's C statistic, which can account for variable follow-up times.
Recently, much attention has been focused on the observation that the addition of important variables to risk function may result in very minor changes in AUROC (or Harrell's C). In terms of clinical usefulness, superiority of one risk function over another depends mainly on the ability of each to classify persons into the correct level of risk, as treatment decisions are based on this high or low risk classification [31]. Superior performance at the extremes of risk, where management decisions are already obvious, is less important [32]. For this reason, we also compared the functions by using the net reclassification index (NRI), as recently described by Pencina et al. [33]. This method calculates the net percentage of those who do and do not develop the endpoint and those who are reclassified to a more appropriate risk category when the new function is used. For example, movement to a higher category in an individual who developed the endpoint would be correct and movement to a lower category in an individual who did not develop the endpoint would also be correct. This new method has been the subject of much discussion [34, 35]. The sensitivity and specificity of the two functions at different cut-off points were also assessed.
To assess calibration of the function, in each category of risk, according to the HDL-C function we calculated the rate of CVD mortality (per 1000 person years) and compared this with the predicted risk (mean percentage of 10-year risk of CVD mortality, which equates to the predicted number of CVD deaths per 100 people in 10 years or 1000 person years). The ratio of the predicted to observed risk was also calculated. Full details of goodness of fit testing are given in the supplementary material.
Risk charts of the HDL-C function (for use in high-risk countries) were generated at different levels of HDL-C, for illustration purposes. An interactive electronic tool for calculating both risk functions was developed using Filemaker Pro advanced v9 software (Filemaker Inc., 2007, Filemaker Pro 9 Advanced, Santa Clara, California, USA). Stata version 9 (StataCorp., 2005, Release 9, College Station, Texas, USA) was the statistical package used throughout. Excel 2003 was used in the calculation of the NRIs.
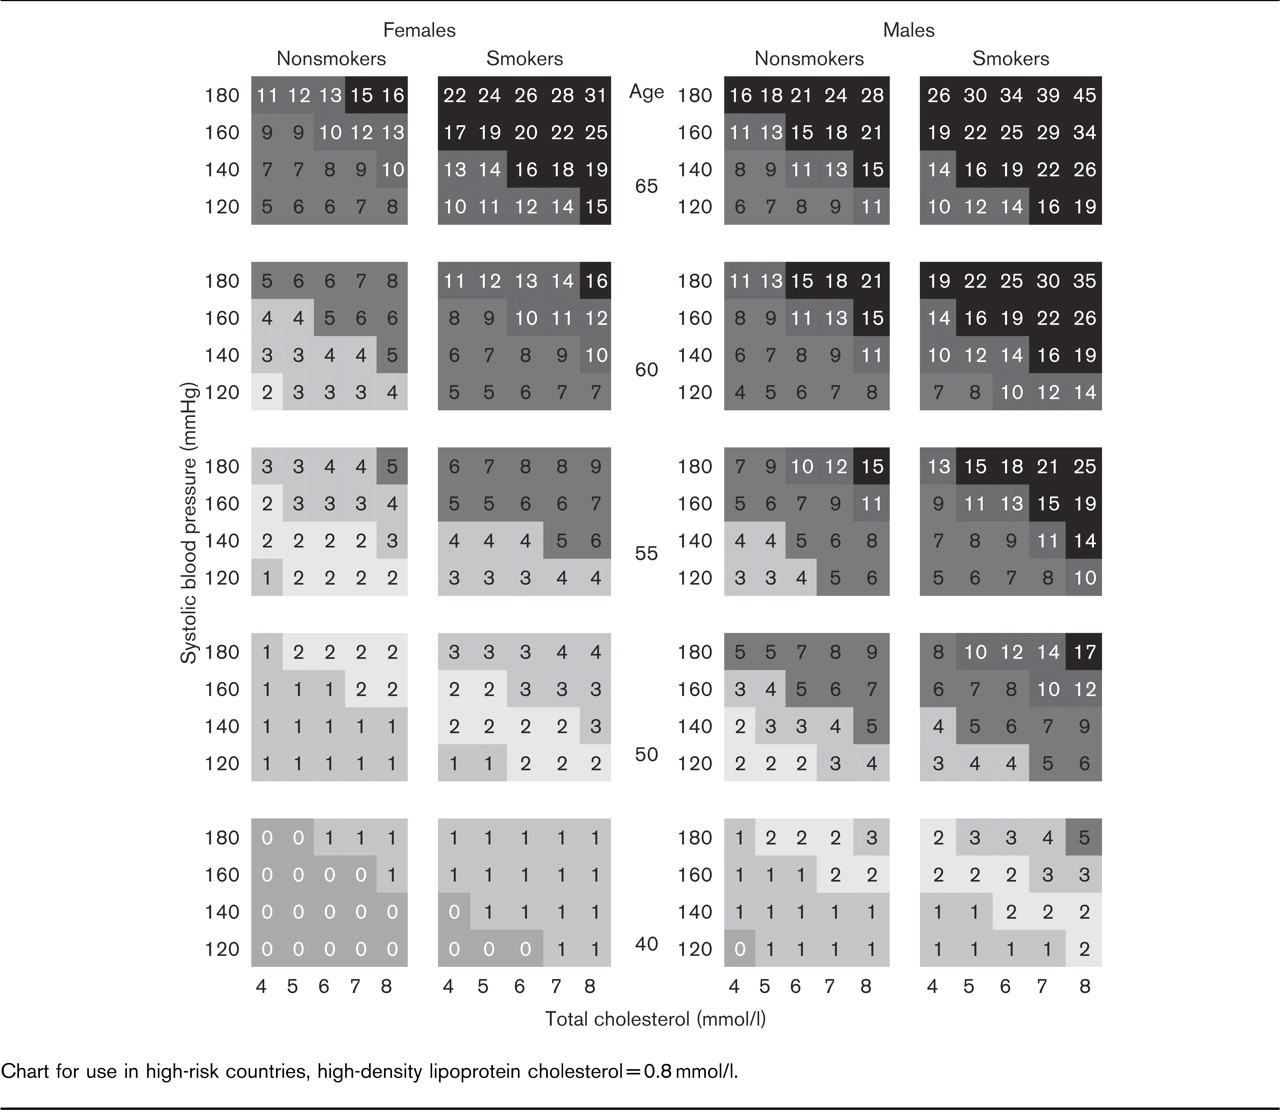
Chart for use in high-risk countries, high-density lipoprotein cholesterol = 0.8 mmol/l.
Results
Data on 104 961 people were available for deriving the risk functions. These data included 991 058 person years of follow-up and 2463 CVD deaths occurred during this time. Supplementary Table A shows the number and baseline characteristics of the 55 899 men and 45 898 women remaining after exclusion of those with previous coronary heart disease or missing data for any of the variables (TC, HDL-C, SBP, or smoking). The hazard ratios for each risk factor for both risk functions are shown in Table 1. The β-coefficients for the risk factors are shown in supplementary Table B.
Figures 1 and 2 show the risk chart without HDL-C for use in men and women from high-risk countries displaying the 10-year risk of CVD mortality in each risk factor combination. The risk associated with some examples of risk factor combinations is shown, first, using the risk function without HDL-C and second, using the HDL-C function at 4 different HDL-C levels; 0.8, 1.0, 1.4, and 1.8 mmol/l. The examples have been selected to show how the inclusion of different levels of HDL-C can change the risk estimate in those at intermediate risk. Figures 3–6 show, for illustration purposes only, separate risk charts, created using the HDL-C function, at four HDL-C levels, 0.8, 1.0, 1.4, and 1.8 mmol/l, for use in high-risk countries.
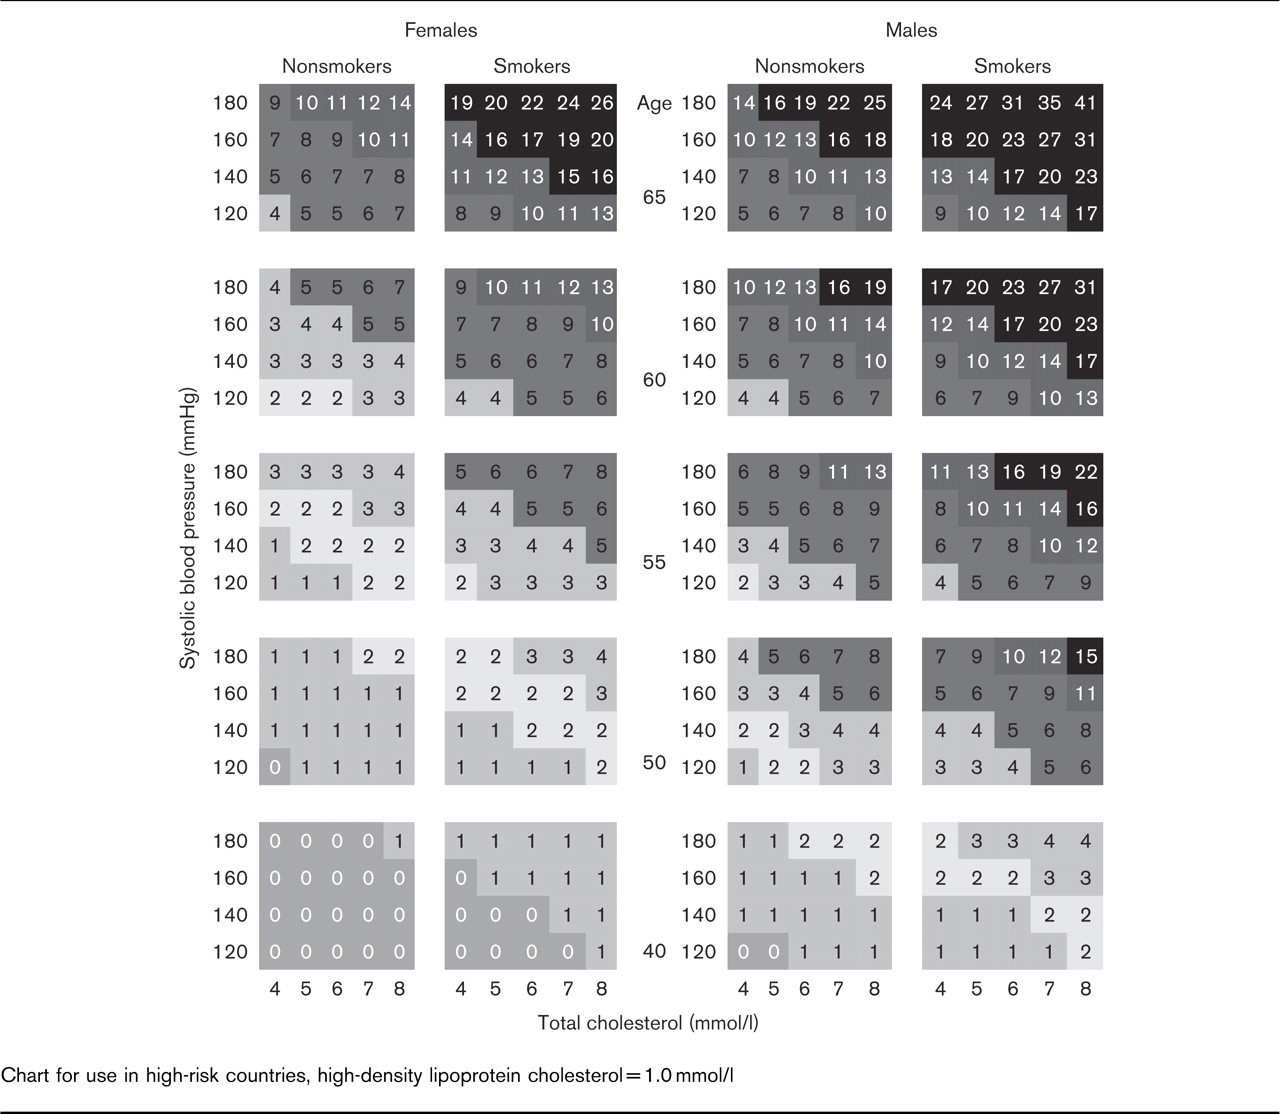
Chart for use in high-risk countries, high-density lipoprotein cholesterol=1.0mmol/l
The AUROC in the entire group was slightly greater for the HDL-C function than the function without HDL-C at 0.814 and 0.808, respectively, (P < 0.0001). Table 2 shows AUROCs for the entire group and for each subgroup. The greatest difference in AUROC was in women from high-risk countries, where inclusion of HDL-C in the function resulted in an AUROC increase from 0.796 to 0.829, P = 0.0001. The sensitivity and specificity for the two functions at different cut-off points for high or low risk are shown in Table 3. Harrell's C statistic values for the entire group and each subgroup were very similar to the AUROC values (data not shown).
NRIs are shown in Table 4. These indicate the net proportion of cases that were reclassified in the correct direction and the net proportion of non-cases who were reclassified in the correct direction, using only two categories — high, ≥ 5%; or low, less than 5%. In each subgroup, use of the HDL function resulted in superior risk classification, as indicated by the positive NRI for each subgroup. The highest NRI (0.115, P = 0.015) was in women from high-risk countries. When classifying individuals into four risk categories (≤ 2%, 3-4%, 5-9%, ≥ 10%) NRIs were greater; 0.038 in the entire group and 0.17 in women from high-risk countries. The full reclassification tables for the four risk categories are shown in the supplementary material. The NRIs for four categories and seven categories in each subgroup are given in supplementary Table F.
Figure 7 shows the observed rate of CVD mortality (per 1000 person years) and the predicted number of CVD deaths in 100 people over a 10-year period, calculated by using the HDL-C function. The ratio between predicted and observed in each category is also shown on the graph. It indicates good correlation between the observed and predicted risk in the HDL-C function. A similar correlation was seen for the function without HDL-C (data not shown).
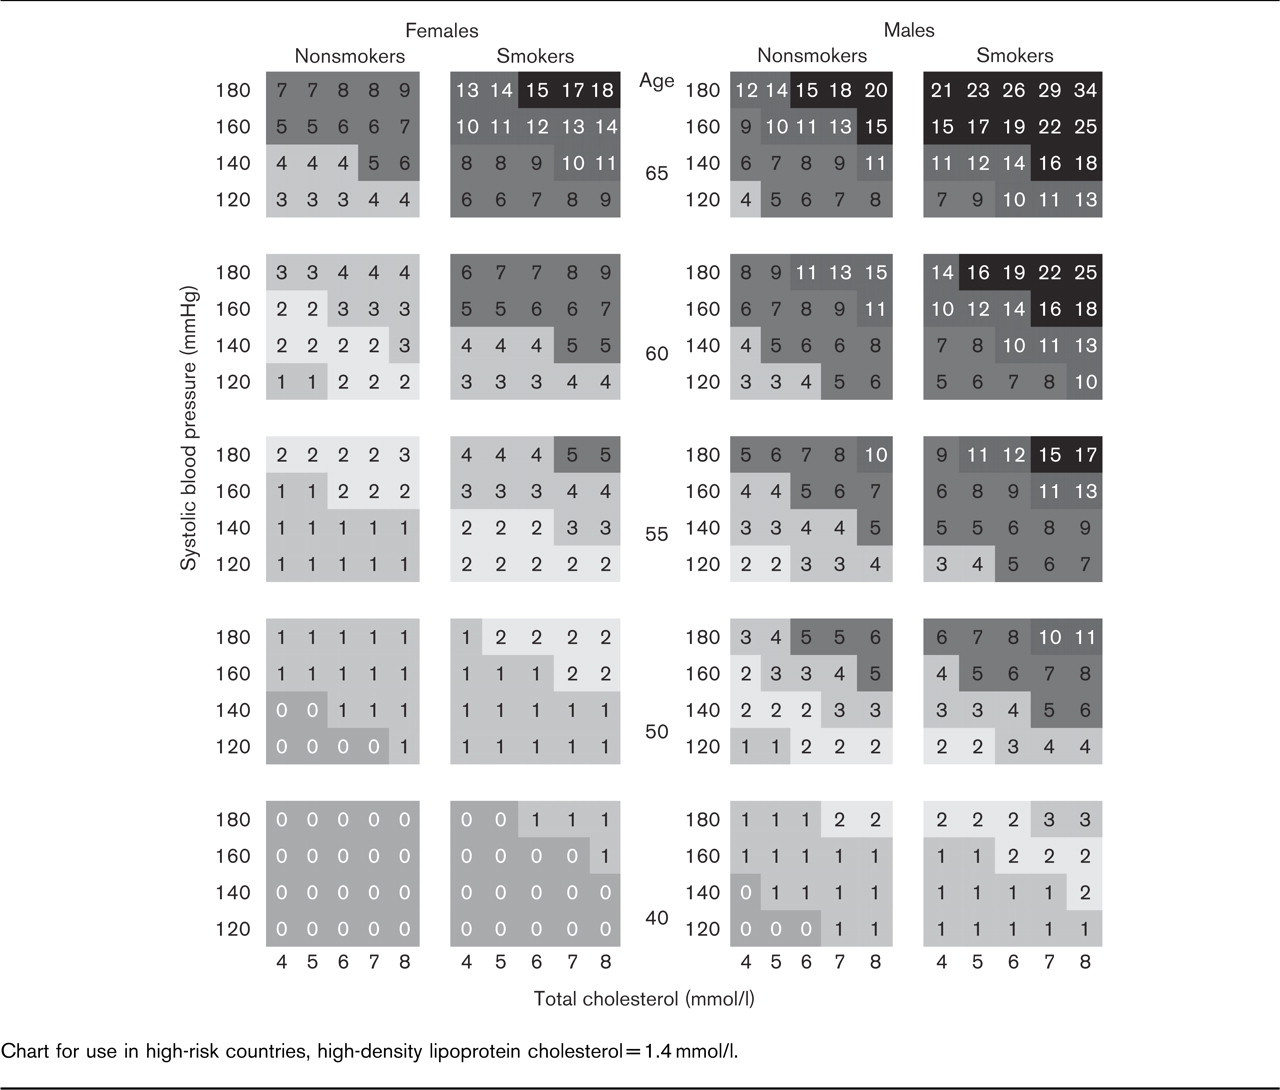
Chart for use in high-risk countries, high-density lipoprotein cholesterol = 1.4 mmol/l.
Discussion
In the original SCORE study [3], using TC/HDL-C ratio or cholesterol alone in the risk function made little difference to the level of risk that individuals were assigned to. This led some, such as the prospective studies collaborators [10], to incorrectly conclude that HDL-C did not add to risk prediction in this study population. Previously, we showed that HDL-C has an independent effect on CVD mortality in this dataset, with a hazard ratio of 0.62 for each increase of 0.5 mmol/l in women and 0.76 mmol/l in men [22]. In this study, we hypothesized that inclusion of TC and HDL-C as separate variables in the risk function would improve risk estimation. Discrimination of the function as measured using AUROC was improved by the incorporation of HDL as a separate variable. The improvement was statistically significant but modest. This is in part because the large sample size of this study generates an impressive P value even when the observed improvement in discrimination may be of modest clinical significance.
Much attention has been focused on the AUROC as a method for comparing the discriminative performance of two risk estimation functions [31, 33]. AUROC compares the tradeoff between sensitivity and specificity was originally developed for the comparison of a diagnostic test with a gold standard. Therefore, this measure may not be the most appropriate one for comparison risk estimation systems, which unlike diagnostic tests do not have yes/no answers regarding the presence or absence of disease. As a large proportion of the ability to predict CVD outcomes is governed by sex and age alone, once even basic CV risk factors are included there is often little potential for the addition of other factors to improve risk estimation, as measured by the AUROC [36, 37]. The Framingham group has previously shown a lack of statistically significant improvement in AUROC after the addition of a multimarker score even though it was associated with a four-fold increase in risk comparing the extreme quintiles [38].
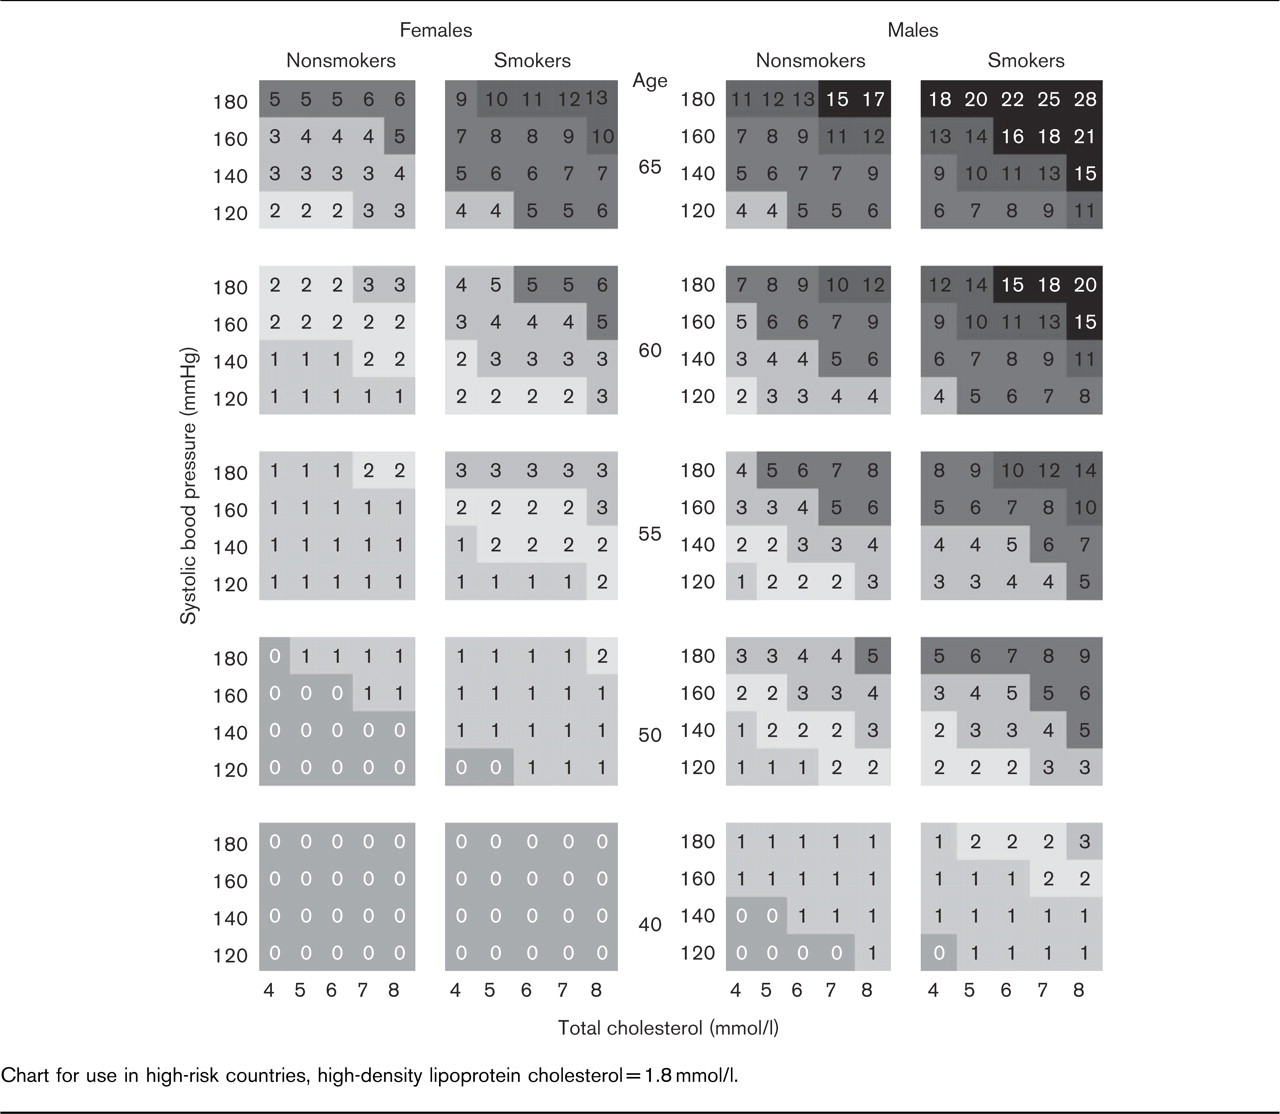
Chart for use in high-risk countries, high-density lipoprotein cholesterol = 1.8 mmol/l.
AUROC for CVD mortality for men and women from low and high risk countries

AUROC, area under receiver operating characteristic curves; CVD, cardiovascular disease; HDL-C, high-density lipoprotein cholesterol.
Sensitivity and specificity at various cut-off points of the functions with and without HDL-C

HDL-C, high-density lipoprotein cholesterol.
More recently, the evaluation of changes in risk categorization has become more clinically relevant than AUROC analysis, in the assessment of possible improvement in risk estimation [31, 38, 39]. As a result, a new measure of performance, the NRI, has been developed [33]. This allows determination of the number and percentage of cases and controls in a population that will be correctly reclassified into a different risk category. Individuals are considered to be correctly reclassified if a person who developed the endpoint moves to a higher risk category or if a person who did not develop the endpoint moves to a lower risk category. Using NRI measure, we have demonstrated that the reclassification resulting from the incorporation of HDL-C in the risk function is in the net correct direction in all groups, when using the two-category classification. In women from high-risk countries, a substantial proportion is correctly reclassified when HDL-C is included (0.115 in the two-category classification). This significant and clinically important NRI results mainly from a substantial number of cases being reclassified into a higher risk category. This improvement in NRI after incorporation of HDL-C has also been shown by the Framingham group [33].
Percentage in each group correctly reclassified into high/low risk of CVD — net reclassification index

CVD, cardiovascular disease, NRI, net reclassification index.
In the original SCORE study it was shown that the inclusion of TC alone or TC/HDL ratio in the function made very little difference to the risk estimate; 79.0% of persons from high-risk countries had the same risk estimate on using the two versions and 98.2% had a risk that differed by not more than 1%. The reason for the lack of change in risk estimates seems to be related to the underlying risk of the study population. In the SCORE dataset the median age is 47 years of age, meaning that the majority of individuals is at low risk. In those at low absolute risk, even factors associated with substantial relative risks will cause only minor changes in the absolute risk. In this analysis, the inclusion of HDL-C and TC as separate variables still resulted in only minor changes in absolute risk in the population overall, with only 6.5% changing their risk by 1% or more. However, the change in risk is much greater in those who have unusually high or low HDL-C levels, especially when they are already at intermediate risk, as illustrated in Figs 5 and 6. Accurate risk estimation is particularly important in this intermediate risk category, as this is the point at which clinical decisions regarding preventive measures are made. This is particularly important because the guidelines for CVD prevention recommend that those with TC above 8 mmol/l or SBP above 180 mmHg or known diabetics are automatically considered high risk [1], but there is no analogous recommendation for those with extremely low levels of HDL-C.
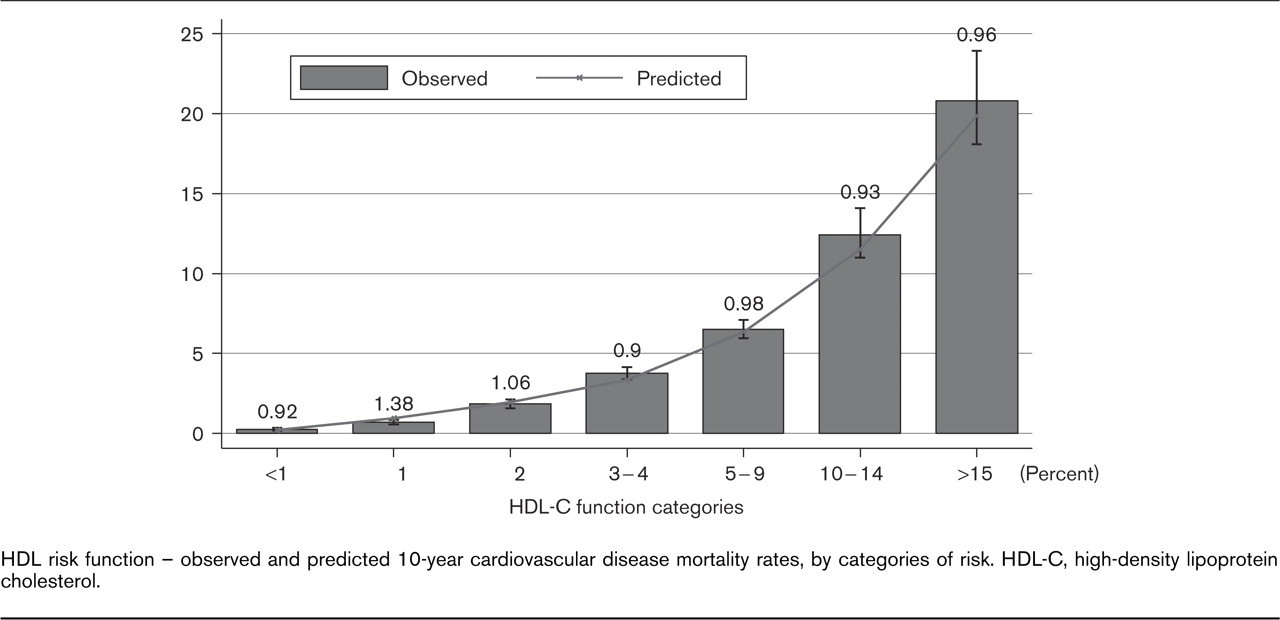
HDL risk function — observed and predicted 10-year cardiovascular disease mortality rates, by categories of risk. HDL-C, high-density lipoprotein cholesterol.
HDL-C is a suitable candidate for inclusion in risk estimation systems; however, it should be remembered that causality has not been proven. Although some trials have indicated a beneficial effect of pharmacologically elevating HDL-C levels [40, 41], others have shown opposite results [42]. HDL-C level is also modified by lifestyle changes such as reducing overweight, increasing physical activity, [43] and smoking cessation [44]; however, it has been difficult to separate the role of HDL elevation resulting from these actions from the other favorable effects these have on CV risk, both independently and through modification of other risk factors.
Some limitations of this analysis should be acknowledged. Some consider the use of CVD mortality only as the endpoint to be a limitation of the SCORE project. CVD mortality was specifically chosen as the endpoint because first, it is a hard endpoint and second, easily standardised across countries. This also means that the country-specific versions and updated versions of the function can be generated using easily available national mortality statistics [5, 45]. A limitation of this project is that the laboratory methods for the measurement of HDL cholesterol were not fully standardized across all cohorts, although, as discussed in the Methods section above and supplementary Table G, all studies used precipitation as opposed to newer direct methods.
New direct methods for the laboratory measurement of HDL cholesterol were introduced in the late 1990s. Recent data from Belgium have shown that HDL cholesterol measurement using these new direct methods may result in higher estimates than those given by the precipitation methods used for measuring HDL cholesterol at baseline of studies included in this analysis [46]. From a clinical point of view, calculating an individual's risk using a HDL cholesterol level measured using modern techniques and a risk estimation system that includes older HDL measurements will result in underestimation of the risk. This situation needs to be assessed in further studies; if this proves to be a consistent result then the calculation of a correction factor should be considered. This problem would affect not only the SCORE project but also most of the currently available risk estimation systems [17–19, 21], whose baseline cholesterol measurements use precipitation laboratory techniques. Potentially, this disparity in the HDL cholesterol level measurements by the two different methods could affect TC measurement also and hence risk estimates based on TC alone also. This issue deserves careful consideration by CVD prevention guideline generating bodies.
The decision regarding whether the routine use of HDL-C in risk estimation should be recommended in all or just in specific individuals has to be taken by national and international guideline-generating bodies. We believe that our derivation of such a function and demonstration of the improvement in risk estimation afforded by the incorporation of HDL may be useful to those undertaking these decisions. However, many other factors also need to be considered, including economic considerations regarding the cost of performing the test. In addition, it should be remembered that one of SCORE's greatest advantages lies in its simplicity and that although incorporation of HDL will result in a superior risk estimation the down side is the requirement for computerized risk estimation instead of the popular two-dimensional paper chart. We suggest that if HDL-C was incorporated into HeartScore, its inclusion would be optional, that is, if HDL-C level was not available, the original equation would be used instead of inserting a mean value for HDL-C as is done in some other risk estimation systems.
Supplementary data
Supplementary data are available directly from authors.
Conclusion
Incorporation of HDL-C as an additional variable in the SCORE function has resulted in a small but significant improvement in the discrimination of the function. The improvement in discrimination was most marked in women from high-risk countries. In this group, a substantial and clinically relevant number of women are correctly reclassified into a different risk category. Although inclusion of HDL-C results in improved risk estimation, for the majority of the population, whose levels are close to the mean, inclusion will result in only minor changes to the estimate. However, for individuals with unusually high or low HDL-C levels, the inclusion of HDL-C is important, especially when the risk is close to the threshold for risk categorization. For this reason, we believe the derivation and assessment of the performance of such a risk function represents an important development and may be of assistance to those involved in the next revision of the European guidelines on CVD prevention.
Footnotes
Acknowledgements
SCORE investigators (not named above as co-authors) are as follows: K Pyörälä, P Ducimetiere, I Njølstad, RG Oganov, A Tverdal, H Wedel. No funding received. No conflicts of interest.