






Abstract
Cardiopulmonary exercise testing (CPET) is a methodology that has profoundly affected the approach to patients' functional evaluation, linking performance and physiological parameters to the underlying metabolic substratum and providing highly reproducible exercise capacity descriptors. This study provides professionals with an up-to-date review of the rationale sustaining the use of CPET for functional evaluation of cardiac patients in both the clinical and research settings, describing parameters obtainable either from ramp incremental or step constant-power CPET and illustrating the wealth of information obtainable through an experienced use of this powerful tool. The choice of parameters to be measured will depend on the specific goals of functional evaluation in the individual patient, namely, exercise tolerance assessment, training prescription, treatment efficacy evaluation, and/or investigation of exercise-induced adaptations of the oxygen transport/utilization system. The full potentialities of CPET in the clinical and research setting still remain largely underused and strong efforts are recommended to promote a more widespread use of CPET in the functional evaluation of cardiac patients.
Keywords
Introduction
Cardiopulmonary exercise testing (CPET) is a methodology that has profoundly changed the approach to patients' functional evaluation, linking performance and physiological parameters to the underlying metabolic substratum and providing highly reproducible exercise capacity descriptors, for example, peak oxygen uptake (peakVO2) [1–3]. Moreover, CPET has dramatically increased the mass of information obtainable from a relatively simple and inexpensive procedure such as exercise testing, furnishing an all-round vision of the systems involvedinbothO2 transport from air to mitochondria and its utilization, and making it possible to identify the link(s) limiting the exercise capacity in the individual patient. However, during the last 20 years, the use of CPET for prognostic purposes [mainly in chronic heart failure (CHF) patients] has overshadowed its application for the functional evaluation of cardiac patients, indeed its original one. This report aims to provide professionals with an up-to-date review of the rationale sustaining the use of CPET for the functional evaluation of cardiac patients in both clinical and research settings (Table 1), describing parameters obtainable either from ramp incremental or step constant-power CPET, as specified in the respective paragraphs.
Aims of cardiac patients functional evaluation

Finally, as treatment of the use of CPET for differentiation of cardiac versus pulmonary causes of dyspnea and/or impaired exercise capacity is not a specific goal of this report, readers interested in this topic are referred to previously published reviews [4], as are those interested in the use of CPET for prognostic stratification of patients with cardiac disease (in particular, CHF) [5].
Use of cardiopulmonary exercise testing for the evaluation of O2 transport and utilization efficiency
Ventilatory anaerobic threshold
During incremental exercise, an energy requirement is reached above which blood lactate concentration increases at a progressively steeper rate [6]. This is because of anaerobic glycolysis activation, that occurs as the oxygen supply rate is not rapid enough to reoxidize cytosolic NADH + H+ [7]. Almost all of the H+ generated in the cell from lactic acid (La) dissociation is buffered by bicarbonate according to the following reaction:
Such a production of CO2, in excess of that produced by aerobic metabolism (excess CO2), makes the CO2 production (VCO2) versus VO2 relationship become steeper. This has been labeled ‘anaerobic threshold’ or also ‘aerobic threshold’ or ‘first lactate turn point’, with some terminology disagreement in the scientific literature [8], and is a reliable index of aerobic fitness used for training prescription in both normal individuals and cardiac patients, especially for sustainable submaximal work [9, 10]. Interindividual variance, exercise protocol (e.g. fast versus slow work rate increments, step versus ramp protocols) [11], blood sampling source (e.g. venous, capillary, arterial, arterialized) [12], and type of exercise (e.g. running, swimming, cycling, rowing, etc.) [13] can all affect blood lactate kinetics.
By measuring gas exchange modifications induced by metabolic changes at the mouth, the ‘ventilatory anaerobic threshold’ (VAT) can be determined analyzing the slope of the VCO2 versus VO2 (plotted on equal scales) relationship during ramp incremental exercise (V-slope method) [14], where VAT is the point of transition of the VCO2 versus VO2 slope from less than 1 (activation of aerobic metabolism alone) to greater than 1 (anaerobic plus aerobic metabolism) (Fig. 1, upper panel). Moreover, the excess CO2 produced above VAT increases ventilatory drive, which keeps the ventilation (VE) versus VCO2 relationship linear and the end-tidal CO2 pressure (PETCO2) value constant (i.e. the individual does not hyperventilate with respect to the volume of CO2 metabolically produced). However, an inversion of the VE versus VO2 relationship behavior (increase versus initial decrease, i.e. hyperventilation with respect to O2) is observed above VAT; this makes both the VE versus VO2 ratio and end-tidal O2 pressure increase, in the presence of a still decreasing or constant VE/VCO2 and PETCO2. VAT is thus also identifiable with the nadir of the VE versus VO2 relationship and with the point where end-tidal O2 pressure begins to increase [2] (Fig. 1, lower panel). In the final phase of exercise, hyper-ventilation does occur also with respect to CO2 (respiratory compensation point), making VE/VCO2 increase and PETCO2 decrease [15] (Fig. 1, lower panel). VAT is usually expressed as a VO2 value relative to predicted maximal oxygen uptake (VO2max), the lower limit of normality being 40% of predicted VO2max [16]. In the vast majority of healthy individuals, VAT occurs at approximately 40-60% of VO2max (Table 2); in trained endurance athletes, VAT can reach intensities as high as 80% of their VO2max [23].
All cardiac diseases affecting the O2 transport chain (typically CHF) can determine a pathologic VAT (i.e. < 40% predicted VO2max) [24], as can deconditioning following bed rest for cardiac events, even in the presence of normal left ventricular systolic function [25]. However, when expressed relative to measured peakVO2 (and not to predicted VO2max), VAT will still occur at approximately 40-60% of peakVO2 in most cardiac patients, with a trend toward higher percentages of peakVO2 in patients with CHF [7, 16, 24, 26]. Notably, VAT may be not detectable in a variable percentage of patients [27], and especially in those with CHF because of exercise oscillatory VE and/or shortness of exercise time.
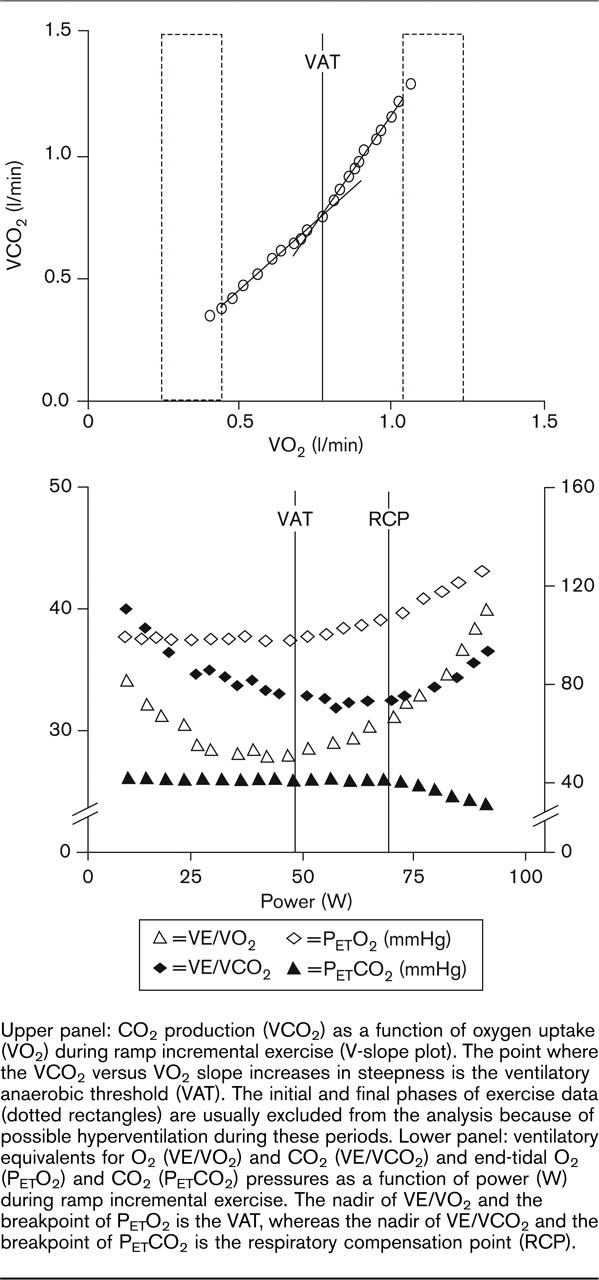
Upper panel: CO2 production (VCO2) as a function of oxygen uptake (VO2) during ramp incremental exercise (V-slope plot). The point where the VCO2 versus VO2 slope increases in steepness is the ventilatory anaerobic threshold (VAT). The initial and final phases of exercise data (dotted rectangles) are usually excluded from the analysis because of possible hyperventilation during these periods. Lower panel: ventilatory equivalents for O2 (VE/VO2) and CO2 (VE/VCO2) and end-tidal O2 (PETO2) and CO2 (PETCO2) pressures as a function of power (W) during ramp incremental exercise. The nadir of VE/VO2 and the breakpoint of PETO2 is the VAT, whereas the nadir of VE/VCO2 and the breakpoint of PETCO2 is the respiratory compensation point (RCP).
Maximal oxygen uptake
VO2max is a parameter which describes the maximal amount of energy obtainable by aerobic metabolism per unit of time (aerobic power). VO2 is defined by the Fick equation:
Failure of VO2 and/or heart rate to increase with further increases in work rate.
Peak respiratory exchange ratio (VCO2/VO2) ≥ 1.10-1.15.
Postexercise blood lactate concentration ≥ 8mmol/dl.
Rating of perceived exertion ≥ 8 (on the 10-point Borg scale).
Normal values of VO2max depend on age and sex, and are influenced by body size, level of physical activity, and genetic endowment [34]. VO2max is measured in liters or milliliters of O2 per minute, or in milliliters of O2 per kilogram of body weight per minute. The highest values of VO2max are reported in endurance athletes (94 ml/kg per min) [35]. VO2max declines on average by 10% per decade after the age of 30, because of decreasing maximal heart rate, stroke volume, blood flow to skeletal muscle, and skeletal muscle aerobic potential with age [36]. VO2max is also 10 to 20% greater in males than in females of comparable age [37], because of higher hemoglobin (Hb) concentration and greater muscle mass and stroke volume in males. Several formulae based on age and body dimensions are available for VO2max prediction in sedentary men and women, the most detailed recommendation being provided by Wasserman et al. [16] (Table 2).
Many cardiovascular diseases can affect VO2max/peakVO2. Namely, all pathologies impairing CO response to exercise will determine some degree of reduction of peakVO2 with respect to predicted VO2max. For example, in patients with CHF peakVO2 is classically reduced with respect to age-matched and sex-matched normal individuals [24], but is also lower than normal in patients with preserved left ventricular function entering a rehabilitation program after recent cardiac surgery [38], because of bed rest-induced deconditioning. When possible, determination of peakVO2 in patients referred for cardiac rehabilitation is a cornerstone for rational exercise prescription and evaluation of training efficacy [39, 40].
Normal values

BSA, body surface area; F, females; M, males; peakVO2, peak oxygen consumption; T1/2, time necessary for VO2 to decrease by 50% from its peak effort value; VAT, ventilatory anaerobic threshold; VO2max, maximal oxygen uptake.
Values are calculated for men of 75 kg and women of 60 kg weight, values in brackets are ml/kg per min.
Formula for normal weight individuals, Ref. [16] also reports formulae for underweight and overweight individuals.
Value for VO2 off-kinetics after incremental exercise.
Values are calculated for men of 1.9 m2 BSA and women of 1.65 m2 BSA.
PeakVO2 in liters/minute for 20-50 year old males.
Values are calculated for VO2max reported above and peak systolic blood pressure of 200 mmHg.
Critical power
Critical power represents the highest power sustainable in conditions of both VO2 and lactate steady state [17], overlapping, as such, the concept of maximal lactate steady state, that is, the highest power sustainable in conditions of stable blood lactate concentration [41]. As aerobic exercise is usually performed in steady-state conditions, the critical power is a crucial (though quite neglected) marker of the upper limit of sustainable aerobic training intensity [42], situated between VATand peakVO2 powers as assessed during ramp incremental CPET.
From a mathematical standpoint, critical power corresponds to the power asymptote of the hyperbolic relationship linking power and duration of the constant-power exercise [17]. The determination of critical power requires the performance of four to five constant-power exercise tests in the above-VAT threshold effort intensity domains (see section ‘VO2 on-kinetics’), with relative intensities ranging between 70 and 120% of peak power reached during an incremental ramp exercise test [17]; the critical power is then obtained by fitting a rectangular hyperbola on the obtained power versus duration points (Fig. 2). Such a procedure is of course not feasible in the routine clinical setting; however, the existence of a very close correlation between critical power and power at respiratory compensation point during ramp incremental CPET has been described [43]. If these data were confirmed, a single and easy-to-perform test, CPET, would provide operators with all the parameters describing O2 transport and utilization system efficiency, that is, anaerobic threshold, critical power, and peakVO2.
Critical power has been evaluated by several authors in sedentary young normal individuals, revealing repeatable values around 65-70% of peak power (or 25-30% of ΔVAT — peakVO2 power) (Table 2) at incremental exercise testing, with a steady-state VO2 mean value corresponding to 70-80% of peakVO2 [17, 42]. Elderly individuals show critical power values similar to those of young individuals when expressed relative to peak power, but with higher relative steady-state VO2 values (approximately 80-90% of peakVO2), demonstrating a broadening of the high-intensity domain of effort, probably aimed at preservation of habitual activities performance in steady-state, nonfatiguing metabolic conditions [44]. Notably, similar to the other O2 transport and utilization system efficiency descriptors, critical power is also increased by aerobic training [45].

Time as a function of power (W) for five constant-power exercise tests (1 = 50% of Δ ventilatory anaerobic threshold (VAT)-peak oxygen consumption (peakVO2) power, 2 = 70% of Δ VAT-peakVO2 power, 3 = 90% of Δ VAT- peakVO2 power, 4 = 100% peakVO2 power, 5 = 120% peakVO2 power). The power asymptote of the hyperbolic relationship is the critical power (CP).
No data are currently available on critical power in cardiac patients. However, there is information suggesting that CHF patients can perform their habitual activities at absolute and relative intensities higher than the individual VAT [46]. This underlines the need for studies addressing critical power in this population.
VO2 on-kinetics
During constant-power exercise below the anaerobic threshold (moderate-intensity effort domain), three phases of VO2 on-kinetics are classically described in human physiology [47–49]: phase I, during which the VO2 increase would rely mostly on pulmonary blood flow (i.e. CO) increment in the presence of an unchanging C(a-v)O2; phase II, characterized by a monoexponential VO2 increase mainly reflecting skeletal muscle VO2 consumption, as described by C(a-v)O2 widening; and phase III, that is, steady-state attainment (Fig. 3). As VO2 does not reach instantaneously its steady-state value at step exercise onset, during phase I and phase II an O2 deficit accumulates, defined as the cumulative difference between steady-state VO2 level and VO2 levels throughout the whole on-response (Fig. 3); the O2 deficit will be larger the greater the recourse to anaerobic energy sources (alactic and lactic) and body O2 stores before steady-state attainment [49, 50]. Above anaerobic threshold and up to critical power (high-intensity effort domain), it is still possible to reach a VO2 steady state for constant-power efforts (see section ‘Critical power’), even if in this intensity domain an additional, delayedonset VO2 component (‘slow component’) adds to the expected steady-state VO2 value according to the below-VAT VO2 versus power relationship [49, 51, 52]. The latter can be determined either by performing multiple constant-power exercise tests at different below-VAT powers and then fitting a linear relationship on the obtained VO2 versus power points, or with an incremental ramp CPET, by fitting a linear function to the breath-by-breath below-VAT VO2 versus power data, excluding from the fitting window the initial nonincreasing or poorly increasing VO2 period [53, 54]; the VO2 versus power slope values obtained with the above two methods have been shown to be superimposable [54]. Beyond critical power (very high-intensity effort domain), a steady state is no longer attainable, and the VO2 slow component makes VO2 increase inexorably up to VO2max [49, 51, 52].
The presence of the VO2 slow component introduces some methodological caveats about VO2 on-response evaluation in the high-intensity and very-high-intensity domains [51, 52]; for this reason, VO2 on-kinetics is more easily assessed during moderate-intensity effort, and can thus be evaluated also in individuals unable to exercise maximally. In this context, phase I is described in terms of its amplitude and duration, whereas the monoexponential VO2 increase during phase II through its time constant (i.e. the time needed to reach 63% of the steady-state value), fitted on the VO2 data starting from the phase I to phase II transition [49] (Fig. 3).
VO2 on-kinetics in the moderate-intensity effort domain becomes more prolonged with age (Table 2), as demonstrated by increasing values of both its mean response time (i.e. the time constant of the whole VO2 on-response, involving both phase I and phase II, fitted on the VO2 data from time = 0 of the exercise phase, see Fig. 3) [18] and phase II time constant [55], which is because of modifications of the O2 transport and utilization system during the aging process described in the section ‘Maximal oxygen uptake’. Moreover, aerobic training affects the VO2 on-kinetics similarly to the other descriptors of aerobic performance efficiency by shortening both the mean response time and the phase II time constant [56], that is, making the system adapt more rapidly to changes of loading conditions.
Cardiac disease can affect VO2 on-kinetics in the moderate-intensity effort domain mainly by reducing O2 delivery to exercising skeletal muscles. This is evidenced by a prolonged mean response time in patients with coronary artery disease and lone atrial fibrillation with respect to normal individuals [57, 58], and is confirmed by the finding of improved VO2 on-kinetics after percutaneous transluminal coronary angioplasty [59]. A significant prolongation of mean response time is also observed in patients with CHF [60], whose pathophysiology affects several steps of the O2 transport/utilization system (see section ‘Patients with chronic heart failure’), whereas a shortening of mean response time is observed in these patients after left ventricular assist device implantation [61].

Oxygen uptake (VO2) as a function of time during constant-power moderate-intensity exercise. Black line shows monoexponential fitting of VO2 on-kinetics phase II starting from phase I to phase II transition, gray line monoexponential fitting of the whole VO2 on-response and off-response. The O2 deficit is calculated as the cumulative difference between steady-state VO2 level and the whole VO2 on-response (gray line). See text for further details. MRT, mean response time.
VO2 off-kinetics
During the resting recovery phase after constant-power moderate-intensity exercise, the O2 debt contracted during the O2 deficit accumulation is paid by a VO2 in excess of the resting level (Fig. 3) [7, 62]; the same phenomenon is observed during recovery from an incremental exercise test. Such an O2 uptake is necessary for the rephosphorylation of creatine in skeletal muscles and, later, conversion of lactate to pyruvate and other mechanisms [63, 64]. VO2 during recovery fits an exponential function, and can be described by the time constant of the VO2 off-response or its T1/2, that is, the time necessary for VO2 to decrease by 50% from its peak effort value [19]. The more efficient the O2 delivery to, and O2 utilization by, exercising skeletal muscles, the faster this time is; hence, it is shorter in athletes and longer in deconditioned patients [65].
After an incremental ramp exercise test, the average T1/2 value in normal individuals ranges between 60 and 90 s (Table 2), and would seem to become more prolonged with advancing age, although no conclusive data are available on age-induced VO2 off-kinetics modifications [19, 66, 67]. T1/2 is largely independent of exercise intensity, at least as long as it remains greater that 75% of the maximum [19]; this can be particularly interesting in individuals who stop exercising before peak effort because of symptoms, poor motivation, or fear and in whom peakVO2 is underestimated. Thus, a low peakVO2 in the presence of normal VO2 recovery kinetics suggests submaximal effort; conversely, a long T1/2 reinforces the value of a low peakVO2.
All pathologies affecting the O2 transport chain from ambient air to exercising skeletal muscle are expected to influence the postexercise VO2 behavior. Indeed, several authors have shown that the kinetics of VO2 recovery both after the constant-power and the incremental exercise testing are slowed in patients with congenital heart disease and CHF [19, 66–69]; data for post-myocardial infarction patients are less clear [70, 71].
Use of cardiopulmonary exercise testing for the evaluation of ventilation efficiency and control
VO2 versus ventilation relationship: the oxygen uptake efficiency slope
The oxygen uptake efficiency slope (OUES) represents the rate of increase of VO2 in response to a given VE during incremental exercise, indicating how effectively oxygen is extracted and taken into the body [72]. OUES is mainly influenced by the onset of lactic acidosis (which depends on the distribution of blood to the working muscles), muscle mass, oxygen extraction and utilization, and the physiologic pulmonary dead space (which in turn is affected by lung perfusion and structural integrity), thus incorporating cardiovascular, musculoskeletal, and respiratory function into a single index.
OUES is determined from the linear relation of VO2 (y-axis) versus the logarithm of VE (x-axis) during exercise, that is, VO2 = a log10 VE + b, where ‘a’ is the OUES and ‘b’ is the intercept [72] (Fig. 4, upper panel). The logarithmic transformation of VE is aimed at linearizing the otherwise curvilinear relation of VO2 versus VE, thus making the OUES theoretically independent of the patient-achieved effort level. Several studies have tested this hypothesis [20, 72–79], showing either equal or slightly higher or lower submaximal versus maximal OUES values, which thus outweigh the substantially larger differences in peakVO2 measurements observed in the case of premature termination of the exercise test. The feasibility and repeatability of OUES determination is superior to that of VAT [20, 73–76, 79–81], and is easily calculated by a simple mathematical formula, thus improving intraobserver and interobserver measurement variability and objectivity [82]. In healthy individuals, OUES has been investigated in children [72] and adults [20, 74, 77]. Age-adjusted OUES values can be predicted using the sex-specific equations by Hollenberg and Tager [20] (Table 2).
In patients with coronary artery disease, OUES is significantly reduced [75, 79, 81]. However, patients who have undergone percutaneous transluminal coronary angioplasty with or without prior myocardial infarction have significantly higher OUES values compared with patients after coronary artery bypass grafting [79]. This may be explained by a higher disease severity, preoperative and postoperative deconditioning, and the impact of chest surgery on lung perfusion and structural integrity in the latter group. Furthermore, OUES is impaired in coronary artery disease patients with atrial fibrillation as compared with those in normal sinus rhythm [79]; this is likely because of the impact of decreased oxygen delivery on the working muscles in patients with atrial fibrillation, owing to lower stroke volume and CO response during exercise [83]. In CHF, the OUES is reduced in proportion to disease severity [20, 75, 76, 81] (see section ‘Patients with chronic heart failure’ and Fig. 4, upper panel).
Physical training has been shown to increase OUES in both coronary artery disease and CHF patients [79, 81], suggesting that, after training, a given oxygen uptake is achieved with a lower ventilatory cost. This OUES increase may be because of a reduced metabolic acidosis and/or ventilatory response at submaximal effort intensities. The training-induced changes of OUES parallel those of peakVO2 [79, 81], showing that OUES is sensitive to improvements in exercise tolerance. OUES would therefore seem to be clinically useful to monitor changes in exercise performance and effects of physical training, particularly in patients who can only perform submaximal exercise.
Ventilation versus VCO2 relationship: the VE versus VCO2 slope
Despite a manifold increase in VCO2 and VO2 during incremental exercise, the ventilatory control mechanisms normally keep arterial CO2 tension (PaCO2) and pH remarkably constant over a wide range of metabolic rates. The slope of the relationship between VE and VCO2 describes the ventilatory efficiency during effort, showing the amount of air that must be ventilated to eliminate 1 l of CO2 (Fig. 4, lower panel). The basic information given by the VE versus VCO2 slope is incorporated in the modified alveolar equation [84]:
If PaCO2 is driven down by a high ventilatory drive from peripheral chemoreceptors and/or V D/V T is high, the VE versus VCO2 slope increases; a low V T with respect to a normal anatomic dead space and/or an abnormally high physiological dead space are potential sources of high V D/V T [85]. Another proposed cause of increased ventilatory drive during exercise is effort-induced muscle metaboreflex (ergoreflex) overactivation [86]. Notably, during incremental exercise VE and VCO2 are linearly related until VE increases disproportionately to VCO2 (respiratory compensation point, see section ‘Ventilatory anaerobic threshold’). There is still controversy about whether the VE versus VCO2 slope should be calculated across the overall exercise data or only up to the respiratory compensation point; although its assessment until this point is the logical one from a physiological standpoint, calculation over the whole exercise period seems to increase the VE versus VCO2 slope prognostic value in CHF patients [87].
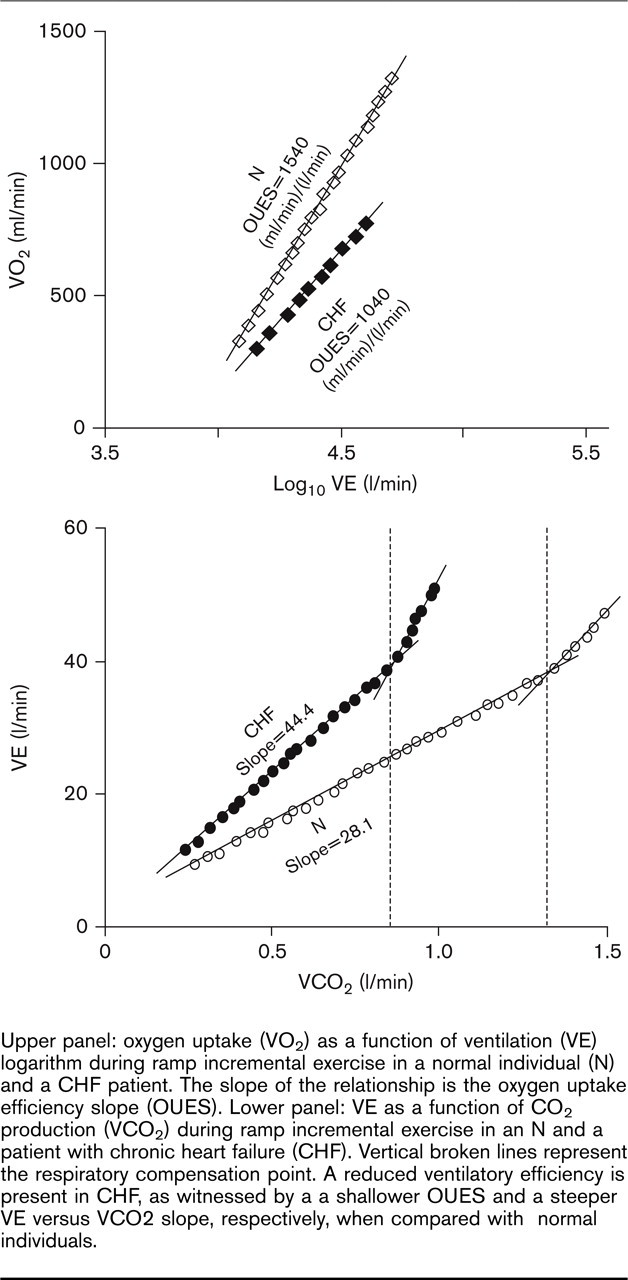
Upper panel: oxygen uptake (VO2) as a function of ventilation (VE) logarithm during ramp incremental exercise in a normal individual (N) and a CHF patient. The slope of the relationship is the oxygen uptake efficiency slope (OUES). Lower panel: VE as a function of CO2 production (VCO2) during ramp incremental exercise in an N and a patient with chronic heart failure (CHF). Vertical broken lines represent the respiratory compensation point. A reduced ventilatory efficiency is present in CHF, as witnessed by a a shallower OUES and a steeper VE versus VCO2 slope, respectively, when compared with normal individuals.
Normal values of the VE versus VCO2 slope range between 20 and 30, with an intercept on the VE axis of some 4-5 l/min because of a reduction of V D/V T ratio after the start of exercise and/or early exercise hyperventilation. The VE versus VCO2 slope is affected by age, showing increasing values with increasing age [21] (Table 2). A higher than normal VE versus VCO2 slope may be of undeterminable origin (primary hyperventilation) or because of hypoxia or respiratory or cardiac diseases that can stimulate VE (secondary hyperventilation). Conversely, a downward displacement of the VE versus VCO2 slope occurs when the PaCO2 set point is raised, that is, in primary alveolar hypoventilation syndrome (impaired ventilatory chemoreflex function).
In patients with coronary artery disease (previous myocardial infarction, percutaneous transluminal coronary angioplasty, coronary artery bypass grafting, and significant chronic coronary stenosis), the VE versus VCO2 slope has been shown to be higher the lower the peakVO2 is [88]. This could be because of a marked sympathetic overactivity and neurohormonal imbalance in these patients, causing an exaggerated ventilatory response to exercise and/or to exercise-induced ischemia, causing a mismatch between CO response to exercise and increasing work rate and a consequent metabolic acidosis. The VE versus VCO2 slope has been found to be increased also in patients with congenital heart disease, probably because of an altered V D/V T ratio in this population [89, 90]. Finally, a high VE versus VCO2 slope is frequently observed in CHF patients (Fig. 4, lower panel) and is associated with the severity of disease [91–93] (see section ‘Patients with chronic heart failure’).
Exercise oscillatory ventilation
Periodic breathing oscillations of VO2, VCO2, and VE may be present in humans during spontaneous breathing while awake (both at rest and during exercise) and during sleep, and their presence is usually associated with an underlying pathological condition [94]. Exercise-induced oscillatory ventilation (EOV) is a slow, prominent, consistent (rather than random) fluctuation of VE during incremental exercise that may be evanescent or transient and has several distinct patterns. It has been observed throughout the entire exercise protocol, or only during early or peak exercise [95–98]. The origin of these oscillations is unclear, and several mechanisms have been proposed, which may be conveniently grouped into ventilatory (i.e. instability in the feedback ventilatory control system) and hemodynamic (i.e. pulmonary blood flow fluctuations) [99].
EOV has been defined in different ways. Kremser et al.'s [95] definition relies on the presence of cyclic fluctuations in VE lasting longer than 66% of the exercise protocol, with an amplitude of more than 15% of the average value at rest, and increasing in the transition from rest to light exercise and diminishing during heavy exercise (Fig. 5). Leite et al.'s [100] description is based on the following criteria: (i) three or more regular oscillations (i.e. clearly distinguishable from inherent data noise); (ii) regularity, so-defined when the standard deviation of three consecutive cycle lengths (time between two consecutive nadirs) is within 20% of the average; and (iii) minimal average amplitude of VE oscillation equals to 5 l (peak value minus the average of two in-between consecutive nadirs). Notably, the detection of VAT is often masked by the presence of EOV [97].
Among cardiac patients, EOV during exercise testing has been specifically detected in those with CHF (see section ‘Patients with chronic heart failure), and associated with cyclic changes in arterial O2 and CO2 tensions; the magnitude of EOV during exercise is correlated with the severity of heart failure [99].
Use of cardiopulmonary exercise testing for the evaluation of central hemodynamics
VO2 and cardiac output
As already shown in the section ‘Maximal oxygen uptake’, VO2 is the product of CO times C(a-v)O2. In the systemic circulation, O2 content increases during incremental exercise above VAT because of an increase in Hb, which is mainly because of the oncotic effect of increased intracellular lactate concentration [101, 102]. In the pulmonary artery, O2 content diminishes progressively throughout the entire exercise; below anaerobic threshold, this is because of a reduction of arterial O2 tension (PaO2) and above anaerobic threshold of both a shift in the oxyhemoglobin dissociation curve (Bohr effect) and a reduction of PaO2 [103]. As a consequence, C(a-v)O2 increases linearly with progression of work rate, and its value is relatively fixed at anaerobic threshold and peak effort in normal individuals, which makes C(a-v)O2 at a given relative intensity of effort predictable, and CO indirectly assessable according to the Fick equation, when the corresponding absolute VO2 value is known [104, 105]. Alternatively, stroke volume at peak exercise can be estimated through the oxygen pulse, which is VO2/heart rate, that is, stroke volume multiplied by C(a-v)O2; assuming normal values of arterial O2 content and C(a-v)O2 at peak effort, peak stroke volume in milliliter can then be calculated as (peak oxygen pulse/15) × 100, where oxygen pulse is in milliliters per beat [30]; however, this estimation must be used with caution in nonperfectly normal and motivated individuals.
Few data are available as to normal CO values during effort. A frequently used formula based on the cardiac index versus VO2 relationship during incremental exercise [106] has been adapted for CO estimation by converting cardiac index into CO values [22] (Table 2). This formula estimates the lower limit of normality for CO increase at a given VO2 (i.e. energy expenditure) value in young to middle-aged healthy males.
In CHF patients, C(a-v)O2 has a lower variability at VAT than at peak exercise, allowing more reliable CO estimates at such exercise intensity [107]. Indeed, estimated CO at VAT has been shown to independently predict multivessel coronary artery disease and the combined end point of cardiac death, reinfarction, and clinically driven revascularization in patients with recent acute myocardial infarction and reduced left ventricular ejection fraction [108]. However, rather than CO estimation during exercise, its direct noninvasive determination by means of CO2 rebreathing or inert gas methods [109] together with VO2 measurement might be a major advance in the evaluation of cardiac patients, allowing to calculate the C(a-v)O2 and to build the CO/C(a-v)O2/VO2 plot (Fig. 6) [110]. This plot helps to discriminate between exercise limitation because of altered left ventricle pump function or other causes, mainly muscle deconditioning; indeed, for corresponding VO2 values, in the former case CO increase is limited in the presence of a maximal widening of the C(a-v)O2, whereas in the latter CO increase is greater with a lesser widening of the C(a-v)O2. This can be useful in CHF patients, in whom both a normal and reduced CO response during effort has been described in the presence of a reduced peakVO2 [22, 111, 112]. Moreover, the role of anemia in functional capacity impairment can be precisely calculated as well [113]. As each Hb gram carries 1.34 ml of O2, and as at peak exercise Hb desaturation is approximately 70%, each gram of Hb delivers to the muscle about 1 ml of O2. In normal conditions, Hb is 15 g/dl, and, if peak CO (dl/min) is known, one can easily estimate the amount of missing VO2 owing to anemia at peak effort. For example, if peak CO is 7.0 l/min, that is, 70 dl/min, and Hb is 10 g/dl, the amount of VO2 lacking because of anemia is 15 (normal Hb) − 10 (observed Hb) × 70 = 350 ml/min. Such a calculation is possible only if patients are normoxic, have no cardiac shunt, and the exercise is performed at sea level. This information can be very useful when planning a training intervention in the cardiac rehabilitation setting.
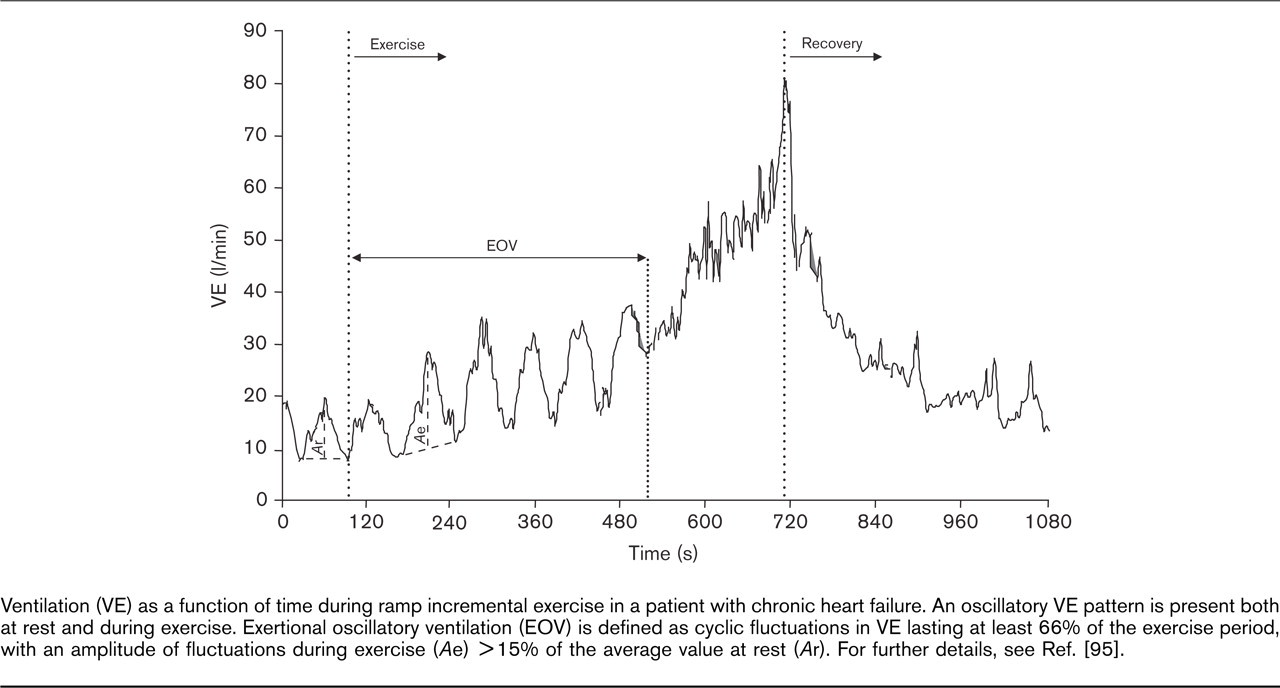
Ventilation (VE) as a function of time during ramp incremental exercise in a patient with chronic heart failure. An oscillatory VE pattern is present both at rest and during exercise. Exertional oscillatory ventilation (EOV) is defined as cyclic fluctuations in VE lasting at least 66% of the exercise period, with an amplitude of fluctuations during exercise (Ae) > 15% of the average value at rest (Ar). For further details, see Ref. [95].
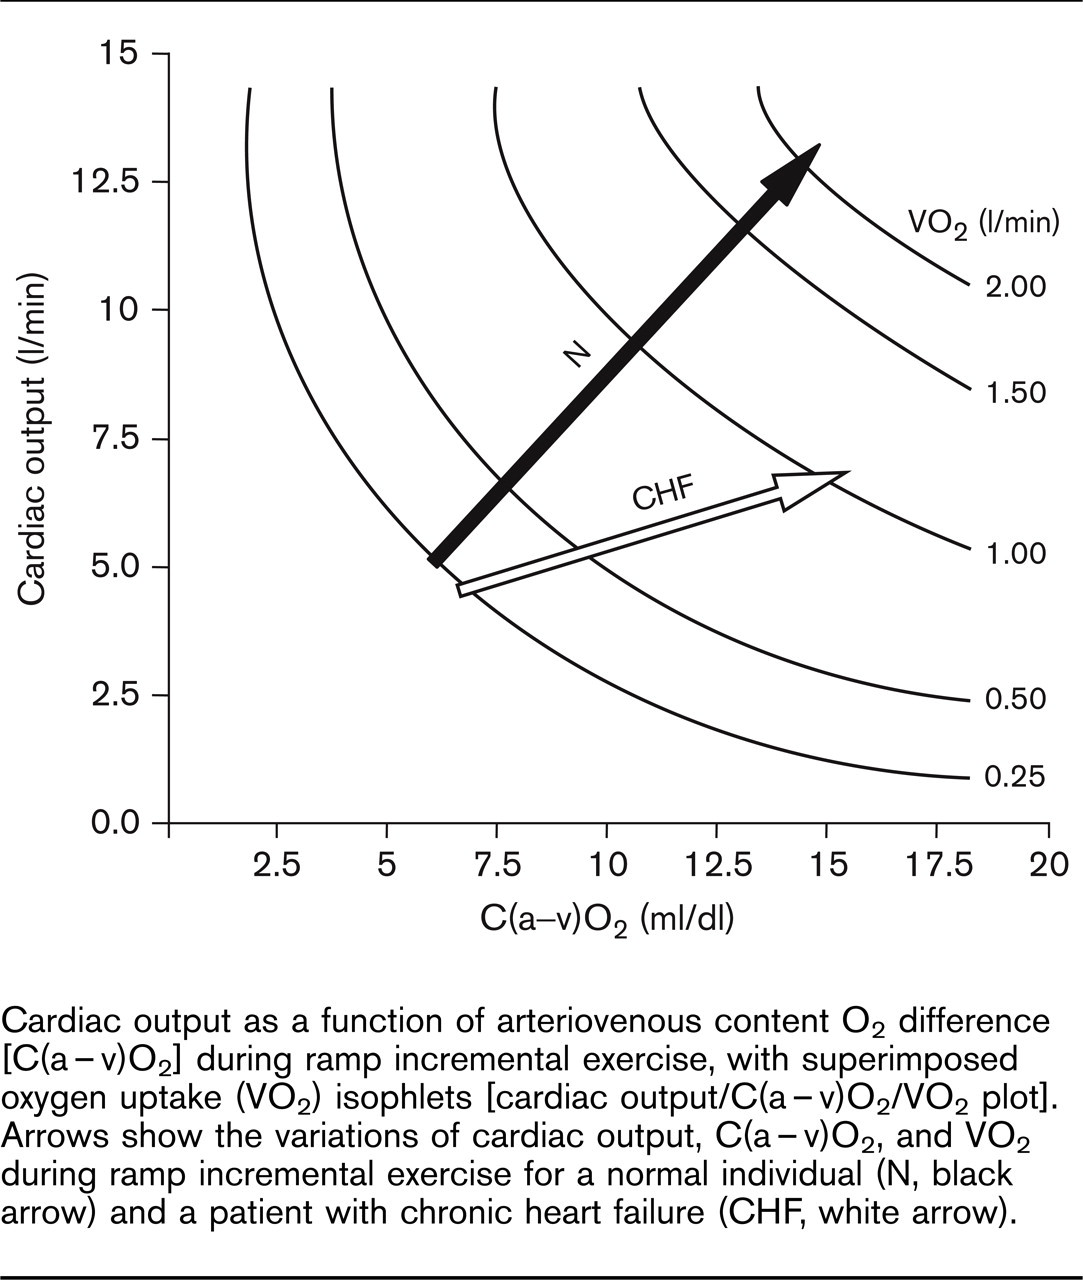
Cardiac output as a function of arteriovenous content O2 difference [C(a-v)O2] during ramp incremental exercise, with superimposed oxygen uptake (VO2) isophlets [cardiac output/C(a-v)O2/VO2 plot]. Arrows show the variations of cardiac output, C(a-v)O2, and VO2 during ramp incremental exercise for a normal individual (N, black arrow) and a patient with chronic heart failure (CHF, white arrow).
Circulatory power
Cardiac power, the product of CO and central aortic (or mean arterial) pressure, is one of the most powerful indices of cardiac systolic function [114–116]. This is because the heart and proximal vascular system are closely coupled and for two similar CO responses to exercise or to any stress, the ability — as opposed to inability — to sustain an optimal pressure testifies to a higher efficiency of the cardiac pump. Indeed, it has been shown that an impaired blood pressure response during exercise is associated with cardiac dysfunction and poor outcome [117]. For cardiac pumping capability determination during effort, cardiac power can be assessed noninvasively by using the CO2 rebreathing or inert gas methods to measure CO [118–121]. The ‘circulatory power’ is a cardiac power surrogate obtainable from CPET, calculated as peakVO2 multiplied by peak systolic blood pressure [122]. As such, circulatory power represents the triple product of CO times; C(a-v)O2 (from the Fick equation) times; systolic blood pressure. For circulatory power to closely estimate cardiac power, there should not be a great difference in C(a-v)O2 at peak exercise in either normal individuals or cardiac patients, which is usually the case [104, 105, 123–125]. Moreover, systolic blood pressure and mean arterial pressure should increase in parallel during exercise. In any case, given the inconsistency of diastolic blood pressure manual recording during exercise, systolic blood pressure measurement is more reliable than mean blood pressure in a noninvasive laboratory setting. Finally, unlike invasive assessment of cardiac power, never possible at truly peak exercise, circulatory power can be easily assessed at maximal effort during incremental exercise testing.
The normal values of peak circulatory power have not been extensively assessed and, like peakVO2, depend on age, sex, body mass, and training level. Considering 25-40 ml/kg per min as normal values for peakVO2 and 150-220 mmHg for peak systolic blood pressure, normal values of peak circulatory power between 3500 and 8800 mmHg times; ml/kg/min are obtained (Table 2), the highest being found in athletes and in hypertensive patients with preserved systolic function. Patients with CHF generally have values less than 3000 mmHgx ml/kg per min, and values less than 1800 mmHg times; ml/kg per min seem to be associated with a very-high short-term risk requiring aggressive treatment, such as in the case of heart transplantation. Circulatory power can also be calculated expressing peakVO2 as a percentage of predicted VO2max [126].
Circulatory power is an interesting parameter for the functional evaluation of cardiac patients as it summarizes heart rate, stroke volume, blood pressure, and C(a-v)O2 responses to exercise (all of which can be altered in several cardiac pathophysiological conditions, in particular CHF), although it does not allow to distinguish between them as to relative responsibility for the exercise capacity impairment. Vasodilators and β-blockers may alter peakVO2 and systolic blood pressure in opposite ways, but the final interaction between drug therapy and circulatory power has not been thoroughly evaluated yet [127].
Use of cardiopulmonary exercise testing for the evaluation of exercise relative intensity
The VO2 reserve (VO2R) is the difference between resting and peakVO2, and, as it describes the O2 used during exercise in addition to basal consumption, is considered a direct measure of the exercise load or energy expenditure [128, 129]. As a consequence, the percentage of VO2R (%VO2R) is now considered the gold standard for estimation, prescription, and monitoring of exercise relative intensity [130], even if limited by possible poor correspondence to exercise intensity as defined by physiological descriptors of effort intensity domains (i.e. VATand critical power, see section ‘VO2 on-kinetics) [131].
Similar to VO2R, heart rate reserve (HRR) is defined as the difference between basal and peak heart rate. In healthy sedentary (on both cycle ergometry and treadmill exercise) and in obese adults, the percentage of HRR (%HRR) has been found to be substantially equivalent to %VO2R, and not to the percentage of VO2max (%VO2max) [128, 129, 132]. Indeed, %HRR has been found to be equivalent to %VO2max in children and adolescents [133]; in contrast, in adults there is a discrepancy between %HRR and %VO2max, which decreases with increasing exercise intensity and seems to be inversely related to individuals fitness [128, 129]. The equivalence between %HRR and %VO2R has been observed also in elite endurance athletes [134]; notably, particularly in trained individuals, there seems to be a better prediction of %VO2R from %HRR for running than for arm exercise [135]. Moreover, in patients with type 2 diabetes, %HRR was found to be an excellent descriptor of %VO2R regardless of the presence of autonomic neuropathy [136]. This finding is consistent with those in patients with previous myocardial infarction both on and off β-blocking therapy [137], in whom an incremental ergometric test without respiratory gas analysis would thus be sufficient for exercise relative intensity assessment. However, in patients with CHF (independently of β -blocking therapy), a considerable uncertainty in prediction of %VO2R on the basis of %HRR has been observed [138]; carrying out a CPET in individual CHF patient thus seems advisable for exercise relative intensity determination and to avoid training stimulus inadequacy or excessive exercise-related risk.
Regarding minimal aerobic training stimulus intensity, analysis of available studies supports the use of 45%VO2R as a minimal effective intensity threshold for fit individuals (peakVO2 > 40 ml/kg per min) and 30%VO2R for those with a peakVO2 less than 40 ml/kg per min [139]. Moreover, guidelines recommend a minimal intensity of 40%VO2R to elicit improvements in aerobic fitness of less fit individuals, 50%VO2R for the physically active, and up to 85%VO2R for highly fit individuals [140].
In patients with coronary artery disease, 45%VO2R is the minimum intensity recommended for improving aerobic fitness [39]; such a relative intensity is higher than that suggested for less fit normal individuals, as most cardiac patients do not reach their maximal effort and thus intensity prescription is based on peakVO2 and not VO2max. In any case, in agreement with the lower fitness-lower training stimulus intensity principle [141], relative intensities as low as 23%VO2R [142], and probably even lower [143], have proved to be effective in CHF patients. From such a low-to-moderate intensity domain, aerobic training stimulus relative intensity can be increased according to individual needs in the high-intensity domain, up to the physiologic limit of aerobic steady-state performance, that is, critical power (see section ‘Critical power). Once exercise-related risk has been thoroughly assessed, such a training intensity can safely be prescribed also in cardiac patients, both with stable coronary artery disease and preserved left ventricular systolic function or CHF [144, 145].
The reported increase in peakVO2 after a period of aerobic training in normal individuals ranges between 10 and 25%, whereas in cardiac patients it has been found to vary between 7 and 54%, with comparable increases described for VO2 at VAT [146, 147]. However, a great discrepancy exists between different studies as to training-induced peakVO2 and VO2 at VAT changes, probably because of differences in study populations, individuals or patients baseline exercise capacity, and training stimulus intensity and duration. Physiological and performance parameters obtainable from CPET, and useful for aerobic training prescription and monitoring, are summarized in Table 3.
Cardiopulmonary exercise testing physiological and performance parameters useful for aerobic exercise training prescription and monitoring

%HRR, percentage of heart rate reserve; %VO2R, percentage of VO2 reserve; HR, heart rate; VAT, ventilatory anaerobic threshold; VO2, oxygen uptake.
Use of cardiopulmonary exercise testing for the functional evaluation of specific populations
Patients with exercise-induced ischemia
CPET can be useful to detect exercise-induced myocardial ischemia, especially among patients with resting ECG abnormalities. Narrowing of the great epicardial coronary arteries does not let adequate blood flow to the myocardium during effort, which increases the myocardial O2 need by increasing heart rate, blood pressure, and contractility. Exercise-induced myocardial ischemia is followed by decreased contractility and development of new regional wall-motion abnormalities; these, in turn, can result in decreasing stroke volume and CO and, consequently, reduced oxygen delivery to the periphery above the ischemic threshold. Indeed, patients with exercise-induced silent or symptomatic ischemia have been found to have lower peakVO2 and oxygen pulse compared with nonischemic controls [148]. Moreover, symptomatic patients had significantly lower values of the same parameters and a higher reduction of left ventricular ejection fraction at peak effort compared with the silent ischemia group [148]. In another study [149], patients with exercise-induced ischemia presented peakVO2 and oxygen pulse values similar to those of patients with normal perfusion; however, patients with extensive transient perfusion defects had a lower peak oxygen pulse than those with lower exercise-induced ischemia. Decreased VAT VO2 has also been consistently shown to be related to the presence [148–152] and the extent [153] of myocardial ischemia.
The ischemia-induced reduction in stroke volume can also decrease the VO2 versus power rise [154] and increase to some extent O2 deficit values, which in turn could slow the VO2 off-kinetics. Based on the above considerations, CPET has also been used for myocardial ischemia diagnostic purposes. Belardinelli et al. [155] showed that CPET improves significantly the diagnostic accuracy of standard ECG stress test for detecting exercise-induced myocardial ischemia, demonstrating a flattening of both VO2 versus power slope and oxygen pulse increase as a consequence of worsening myocardial contraction during ischemia (Fig. 7). Bussotti et al. [150] also demonstrated a significant flattening of VO2 versus power slope above anaerobic threshold in patients with exercise-induced silent ST-segment depression and presence of great coronary artery narrowing, as compared with patients with ST-segment depression but without coronary artery stenosis. In addition, the presence of a ‘hump’ morphology (i.e. a transient convex bulge at approximately 1 min of the VO2 off-kinetics) has been shown to identify exercise-induced ischemia with 57% sensitivity and 97% specificity among patients with anterior Q-wave myocardial infarction [156]; such phenomenon could be because of a paradoxical increase of stroke volume after cessation of effort. Therefore, most pathophysiological factors linked to exercise-induced ischemia can be reliably measured by CPET, which should be used extensively for myocardial perfusion evaluation in patients with coronary artery disease, especially in the presence of an uninterpretable ECG during effort. In any case, it must be considered that a significant overlap of data exists among patients with and without ischemia; as a consequence, information derived from CPET should be integrated with other clinical and instrumental descriptors of exercise-induced myocardial ischemia. Changes of CPET parameters induced by myocardial ischemia are summarized in Table 4.
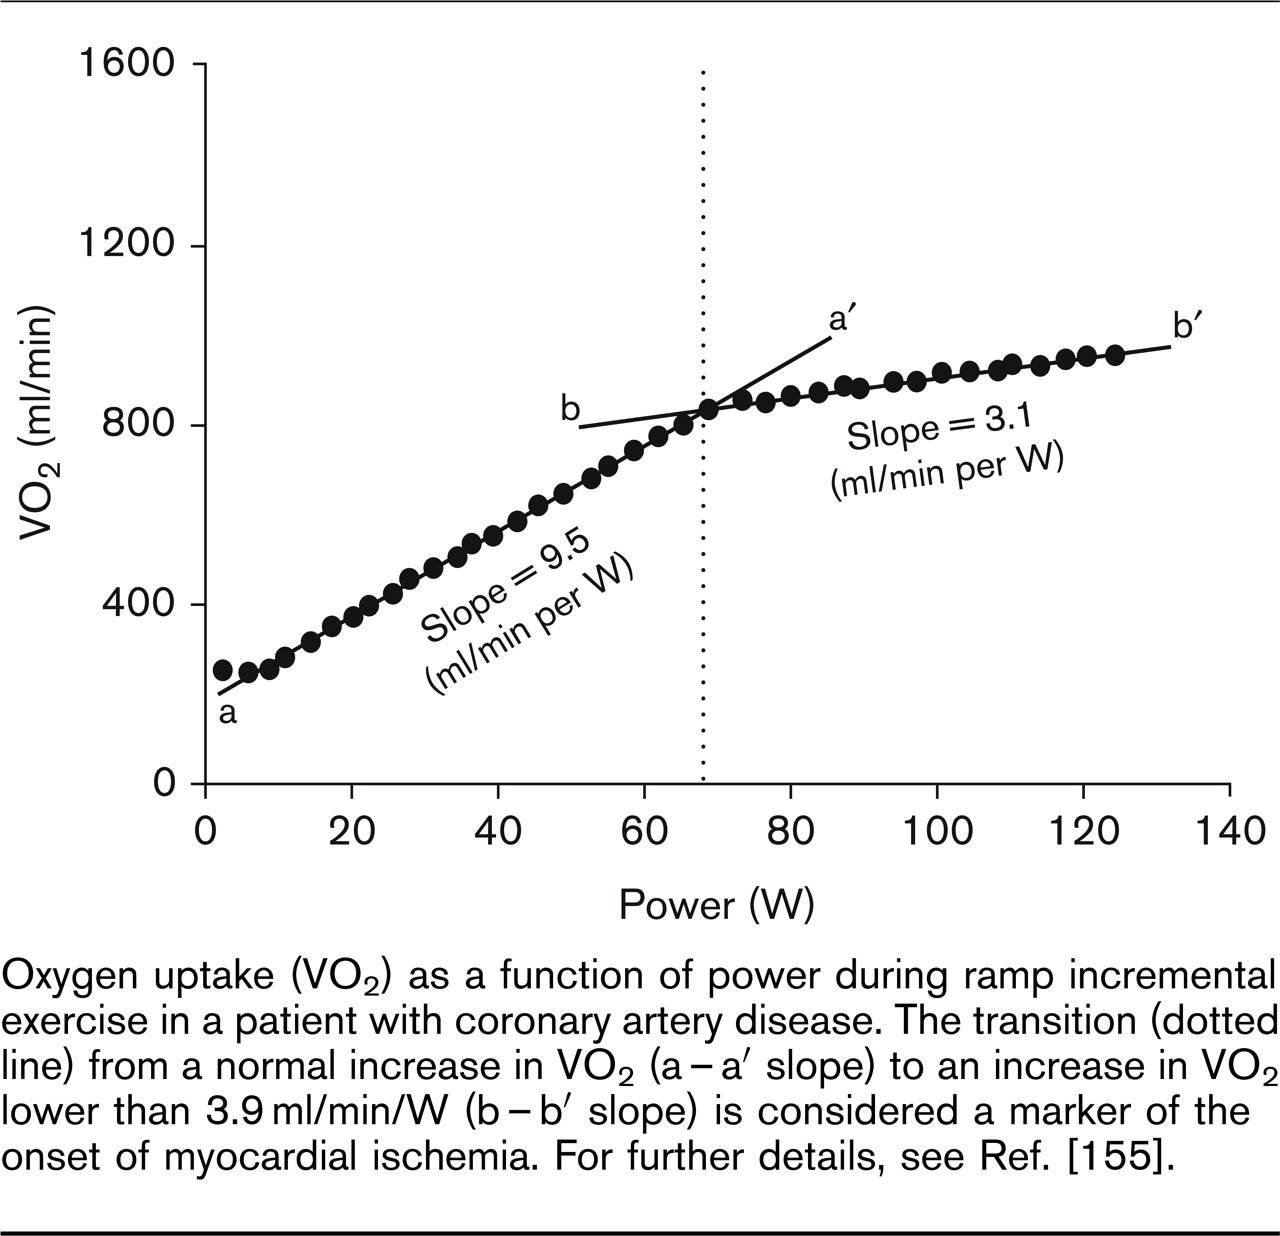
Oxygen uptake (VO2) as a function of power during ramp incremental exercise in a patient with coronary artery disease. The transition (dotted line) from a normal increase in VO2 (a-a′ slope) to an increase in VO2 lower than 3.9ml/min/W (b-b′ slope) is considered a marker of the onset of myocardial ischemia. For further details, see Ref. [155].
Cardiopulmonary exercise testing parameters in special populations

?, not enough data available; ↓, reduced or shortened; ↓↓, severely reduced or shortened; ↑, increased or prolonged; ↑↑, markedly increased or prolonged; N, normal; VAT, ventilatory anaerobic threshold; VCO2, CO2 production; VE, ventilation; VO2, oxygen uptake;
Depending on exercise level with respect to ischemic threshold.
Possible ‘hump’ phenomenon.
Usually detectable in 10-12% of patients.
Patients with recent coronary and valvular surgery
After recent coronary and/or valvular surgery, exercise testing is performed mostly to evaluate exercise tolerance, prescribe individualized training programs, look for residual ischemia and/or exercise-induced arrhythmias, and evaluate prognosis (mostly after coronary artery bypass grafting) [157–160]. Moreover, exercise testing and aerobic training have been recently confirmed to be safe early after heart valve surgery and coronary artery bypass grafting [161]. CPET adds to conventional ergometry the possibility of measuring more precisely patients exercise capacity and providing a sound physiological basis for exercise training prescription, in a population of patients with sometimes significantly impaired exercise performance. Indeed, early after cardiac surgery many factors can contribute to a drop of the exercise capacity with respect to the preoperative level: ventilatory impairment (from atelectasia, pleural effusion, and/or phrenic nerve injury), congestive heart failure, reduction of ribs and sternal mobility, anemia, sinus tachycardia, atrial fibrillation (in about 40% of patients), transient postoperative left ventricular dysfunction, and global fatigue [160, 162]. Indeed, among patients entering a rehabilitation program after a recent acute cardiac event those with recent coronary artery bypass graft have been found to have the lowest peakVO2 [38].
Exercise tolerance may be even more impaired after heart valve surgery, as physiological hemodynamic conditions are not fully restored by valve replacement or repair. All prostheses are more or less stenotic, and this may result in a hemodynamically significant stenosis during exercise, mostly after mitral valve replacement but probably also in the presence of prosthesis/patient size mismatch after aortic valve replacement [163]. Moreover, heart rate is often higher than after coronary artery bypass grafting (because of absence of systematic β-blocking therapy and/or higher incidence of atrial fibrillation) and no formula allows the calculation of the heart rate at the anaerobic threshold, which is often used as a target during the training sessions. Le Tourneau et al. [164] investigated the functional effects of surgical correction of mitral regurgitation by mitral valve replacement or repair in the absence of cardiac rehabilitation. Patients underwent CPET before and 216 ± 80 days after surgery (i.e. after healing of all transient postoperative complications); surprisingly, mitral regurgitation correction did not lead to an overall improvement of peakVO2 in either the valve repair or replacement group; these results were confirmed by Kim et al. [165]. In contrast, a recent study in early postmitral valve repair patients [166] showed that a CPET performed 21 ± 10 days after surgery allowed to prescribe an exercise aerobic training driven by the measured heart rate at VAT; after completion of the training period, peakVO2, peak power, peak oxygen pulse, and chronotropic reserve improved significantly. These results confirmed those of Douard et al. [167], who observed a significant increase of peakVO2 after a 3-month aerobic training period driven by CPET results in patients having undergone mitral balloon valvuloplasty for mitral stenosis. In summary, early after coronary and especially valvular heart surgery, the spontaneous exercise capacity improvement is weak and CPET allows the prescription of an efficient training program focused on the patient s physiological limitations. Changes in CPET parameters induced by recent coronary and valvular surgery are summarized in Table 4.
Patients with chronic heart failure
A reduced ability to perform aerobic exercise is the hallmark of the CHF pathophysiologic feature [24], related to changes in both peripheral (skeletal muscle, endothelium, regional blood flow, and reflex cardiopulmonary control systems) and central (lung, heart, and Hb content of arterial blood) links of the O2 transport chain from ambient air to the skeletal muscle [168–170]. These changes promote a vicious cycle of deterioration involving catabolic drive and reflex neurohormonal over-activation [170, 171], which may lead to disease progression and functional deterioration. As a consequence, in CHF patients peakVO2 is typically reduced with respect to age-matched normal individuals when computed either in absolute (l/min) or weighted terms (ml/kg per min), or as percent of predicted VO2max, and its reduction is proportional to the severity of the syndrome [24, 172]. Together with peakVO2, also all the other descriptors of O2 transport and utilization system efficiency are altered. For example, a reduction in the values of VO2 at VAT, a parameter derived from submaximal work rate and therefore independent of patient motivation, has been classically described [26]. However, in the most advanced stages of the syndrome a clear VAT is often not identifiable, particularly in the presence of EOV. Consistent with the above findings, also a reduction in the VO2 versus power slope and a prolongation of both VO2 on-kinetics and off-kinetics in moderate-intensity constant-power effort and of VO2 off-kinetics after incremental exercise have been described [19, 60] and, in addition to VAT, provide useful submaximal descriptors of O2 transport/utilization system efficiency. Patients with CHF and permanent atrial fibrillation show peakVO2 values even lower than those of CHF patients in sinus rhythm, but with VAT occurring at a higher percentage of peakVO2 [173].
CPET also reveals an increased VE at comparable absolute submaximal levels of effort in CHF patients with respect to age-matched normal individuals [91]. As a consequence, the VE versus VCO2 slope is usually increased [174, 175] (Fig. 4, lower panel), testifying to a reduced ventilatory efficiency, which may be improved by aerobic training [174]. Such ventilatory inefficiency is further evidenced by a decrease of the OUES with respect to age-matched normal individuals [20, 76, 81] (Fig. 4, upper panel). Among the causes of the increased ventilatory response to exercise, a reduced oxygen-diffusing capacity because of an impairment of alveolar-arterial oxygen transfer has been suggested [176], although O2 transfer is preserved and arterial O2 desaturation during exercise is rare in otherwise uncomplicated CHF [177]. An increase in dead space VE can be advocated because of a mismatching of VE relative to pulmonary perfusion of the high alveolar VE versus low alveolar perfusion type [91]. Another likely mechanism explaining the excessive exercise VE of CHF patients is an exaggerated ergoreflex response originating in the exercising skeletal muscles during effort [174], in the context of a generalized myopathy with early acidotic response: this may explain also the sympathetic hyper-responsiveness present in this syndrome [175]. In addition, EOV has been described in a variable percentage (20-60%) of CHF patients (Fig. 5), associated with poor exercise capacity and severe prognosis [177, 178]. It has been attributed to the interaction of altered hemodynamic and neurohormonal regulatory factors [177, 179], even if recent data seem to depict an even more complex pathophysiologic feature [180].
CPETcan also be used to monitor the effects of cardiac resynchronization therapy by biventricular pacing on CHF exercise pathophysiology [181], also when upgrading from right ventricular to biventricular pacing [182]. Moreover, CPET has been used for the functional evaluation of CHF patients after left ventricular assist device implantation, demonstrating a significant short-term peakVO2 improvement [183, 184]. Finally, CPET can describe both functional impairment and prognosis of patients with diastolic heart failure [185]. Changes in CPET parameters induced by CHF are summarized in Table 4.
Patients with recent or previous heart transplantation
Despite a successful replacement of the failing heart and a recovery of cardiac function, most heart transplant (HTx) recipients experience a persistent impairment in maximal exercise capacity. Indices of maximal and submaximal aerobic exercise capacity (peakVO2 and VO2 at VAT) improve significantly during the first 2 years after HTx, remaining, however, around 60-70% of the age-related and sex-related reference values [186, 187].
Several mechanisms, both central and peripheral, may account for this finding. First, surgical-induced cardiac denervation results in a decreased peak heart rate, a delayed heart rate response, and a decreased HRR during incremental exercise (i.e. chronotropic incompetence), which persist for many years after HTx [186]. It has been proposed that the observed chronotropic incompetence, together with cyclosporin-induced diastolic dysfunction, is the major cause of exercise intolerance in HTx recipients; however, recent data obtained in paced and physically trained HTx patients question this hypothesis [188–190]. Second, because of irreversible pretransplant damage of the alveolar-capillary membrane, chronic administration of immunosuppressive drugs, and cytomegalovirus infection, pulmonary diffusion capacity is impaired in most HTx recipients; it is still under debate whether an impaired pulmonary diffusion capacity is a major factor in the limitation of the exercise capacity after HTx [191]. Third, blood flow and oxygen distribution to the skeletal muscles are impaired after HTx. Several authors have demonstrated a decreased capillary density and vascular dysfunction with persistent endothelial dysfunction in the skeletal muscle of HTx patients [192]. It has been shown that improvements in the exercise capacity after exercise training in HTx are highly correlated with improvements in skeletal muscle endothelial function and not to alterations in cardiac or pulmonary function, implying a major role of endothelial function in the observed exercise capacity impairment [193]. Moreover, during the progression of CHF a specific myopathy develops, which persists after HTx and is even worsened by the administration of corticosteroids and cyclosporin, inducing muscle atrophy and a further decrease in oxidative capacity; these detrimental changes result in an inefficient muscle metabolism and a decreased muscle strength [194]. As for endothelial dysfunction, these muscular adaptations can be reversed by exercise training and correlate closely with the observed improvements in exercise capacity [195]. Owing to these muscular metabolic changes, both on-kinetics and off-kinetics of VO2 during constant-power moderate-intensity exercise are delayed in HTx patients [196, 197].
Finally, ventilatory efficiency (expressed both as OUES and VE versus VCO2 slope) improves during the first years after HTx, remaining, however, impaired and reaching values comparable with those observed in moderate CHF. The increased ventilatory response to exercise may be caused by sustained increases in peripheral chemoreceptor sensitivity and increased muscle metaboreflex activity in response to locally produced metabolites during effort [197, 198]. Changes of CPET parameters induced by HTx are summarized in Table 4.
Conclusion
CPET is a methodology now widely available throughout the world and supported by an impressive body of scientific evidence in several different clinical fields. This study emphasizes the opportunities that CPET offers for the functional evaluation of cardiac patients, illustrating the wealth of information obtainable through an experienced use of this powerful tool. The choice of parameters to measure will depend on the specific goals of the functional evaluation in the individual patient, namely, exercise tolerance assessment, training prescription, treatment efficacy evaluation, investigation of exercise-induced adaptations of the O2 transport/utilization system (whether of single links or the whole system), etc. However, the full potentialities of CPET in the clinical and research setting still remain largely underused because of inertia of the cardiologic world in the face of a demanding methodology from the cultural standpoint. Strong efforts are needed to promote a more widespread use of CPET in the functional evaluation of cardiac patients.
Footnotes
Acknowledgements
The authors are grateful to Rosemary Allpress for her careful revision of the English manuscript. There are no conflicts of interest.