






Abstract
Background
Methods
Results
Conclusion
Keywords
Introduction
Over the last two decades, the cardiopulmonary exercise test (CPX) has become increasingly recommended in clinical practice because of its impact on the clinical decision-making process [1]. The information obtained from CPX helps to identify unexplained exercise intolerance, determine disability, make decisions regarding therapeutic interventions, and to estimate prognosis [2, 3]. Among the ventilatory expired gas variables obtained during exercise, maximal oxygen uptake (peak VO2) remains the most frequently applied variable in both research and clinical settings because of its widely recognized value for clinical assessment and for estimating prognosis [4, 5]. Despite the well-established value of peak VO2, a large body of research has been recently published regarding the prognostic value of other CPX variables. Responses such as the slope of the relationship between ventilation and carbon dioxide production (VE/VCO2 slope) [6, 7], the oxygen uptake efficiency slope [8], and maximal oxygen pulse (O2 pulse) [9–11] have been shown to have complementary and even superior prognostic value to that of peak VO2.
O2 pulse (defined by dividing VO2 by heart rate) is generally considered a reflection of cardiovascular efficiency during exercise. As VO2 is the product of cardiac output and the arterio-venous O2 content difference [C(a-v)O2], O2 pulse is in effect the oxygen consumed per heart beat. Although a few previous studies have investigated the prognostic value of maximal O2 pulse in healthy participants and patients with heart failure [9–11], conflicting results have been observed. In addition, previous findings have not incorporated potentially important information such as the degree of chronotropic incompetence, use of β-blockers, and body proportions. Thus, the primary purpose of this study was to investigate the prognostic value of maximal O2 pulse among male adult participants with and without cardiopulmonary disease (CPD) referred for exercise testing for clinical reasons. A secondary purpose was to determine whether maximal O2 pulse has prognostic value that complements other exercise test responses and whether chronotropic incompetence, β-blockers and body weight change this association.
Methods
Population
The study sample consisted of 948 men who underwent maximal CPX for clinical reasons at the Veterans Affairs Palo Alto Medical Center between 1993 and 2003. Detailed clinical history, current medications, and risk factors were recorded prospectively on computerized forms at the time of the tests. We defined participants with CPD as those with a history of angiographically documented coronary artery disease, myocardial infarction, coronary bypass surgery, coronary angioplasty, typical angina, claudication, atrial fibrillation, stroke, or an abnormal result on an exercise test suggestive of coronary artery disease (horizontal or downsloping ST-segment depression ≥ 1.0 mm, exercise-induced angina, or both). Nine percent of the population (88 participants) had a history of mild pulmonary disease and were included in the CPD group, which totalled 442 participants. The remaining 506 participants were classified as non-CPD. All patients with a diagnosis of heart failure were excluded from the study.
Exercise testing
After providing written informed consent, all the participants underwent symptom-limited exercise testing using an individualized ramp treadmill protocol [12]. Before testing, a questionnaire was used to set an individualized treadmill ramp rate such that test duration was targeted to achieve the recommended range of 8-12 min [13]. Standard criteria for termination were used, including moderately severe angina, greater than 2.0 mm abnormal ST depression, a sustained drop in systolic blood pressure, or serious rhythm disturbances. The Borg 6-20 perceived exertion scale was used to estimate the degree of exertion [14]. An electrocardiogram was continuously obtained throughout the exercise test. Blood pressure was obtained manually every 2 min. Heart rate was measured supine, standing, during each minute of exercise, and at maximum exercise from an electrocardiogram. Chronotropic incompetence was defined as the inability to achieve 80% of predicted heart rate reserve, using the regression equation that best fits the population [(174-0.54 (age)] [15]. Thus, the equation used to define percentage heart rate reserve was {(maximum heart rate-resting heart rate)/[(174-0.54 × age) − (resting heart rate)] × 100}. No test was classified as indeterminate, medications were not stopped for testing, and age-predicted maximum target heart rates were not used as endpoints. The use of handrails during exercise was discouraged. The exercise tests were performed, analyzed, and reported using a standard protocol incorporating a computerized database with all definitions and measurements prospectively defined [16].
Oxygen uptake and oxygen pulse assessments
Respiratory gas exchange data were analyzed breath-by-breath and expressed every 10 s using rolling 30 s averages. Peak VO2 was expressed as the highest 30-s average value obtained during the CPX. Maximal O2 pulse was calculated by dividing peak VO2 by heart rate, at the time peak VO2 was achieved and was expressed in milliliters per beat. In addition, this value was expressed as a percentage of age-predicted value, which corresponds to the ratio between the predicted peak VO2 and predicted maximal heart rate. This approach has the advantage of incorporating body weight through the use of relative predicted peak VO2 in ml/(kg-min) [17].
Follow-up
The study endpoint was all-cause mortality. The California Health Department Service and Social Security Death Indices were used to ascertain the vital status of each patient as of 7 December 2007.
Statistical analysis
Clinical and exercise variables comparing CPD and non-CPD participants and survivors versus nonsurvivors were compared using χ
Baseline demographic and clinical characteristics
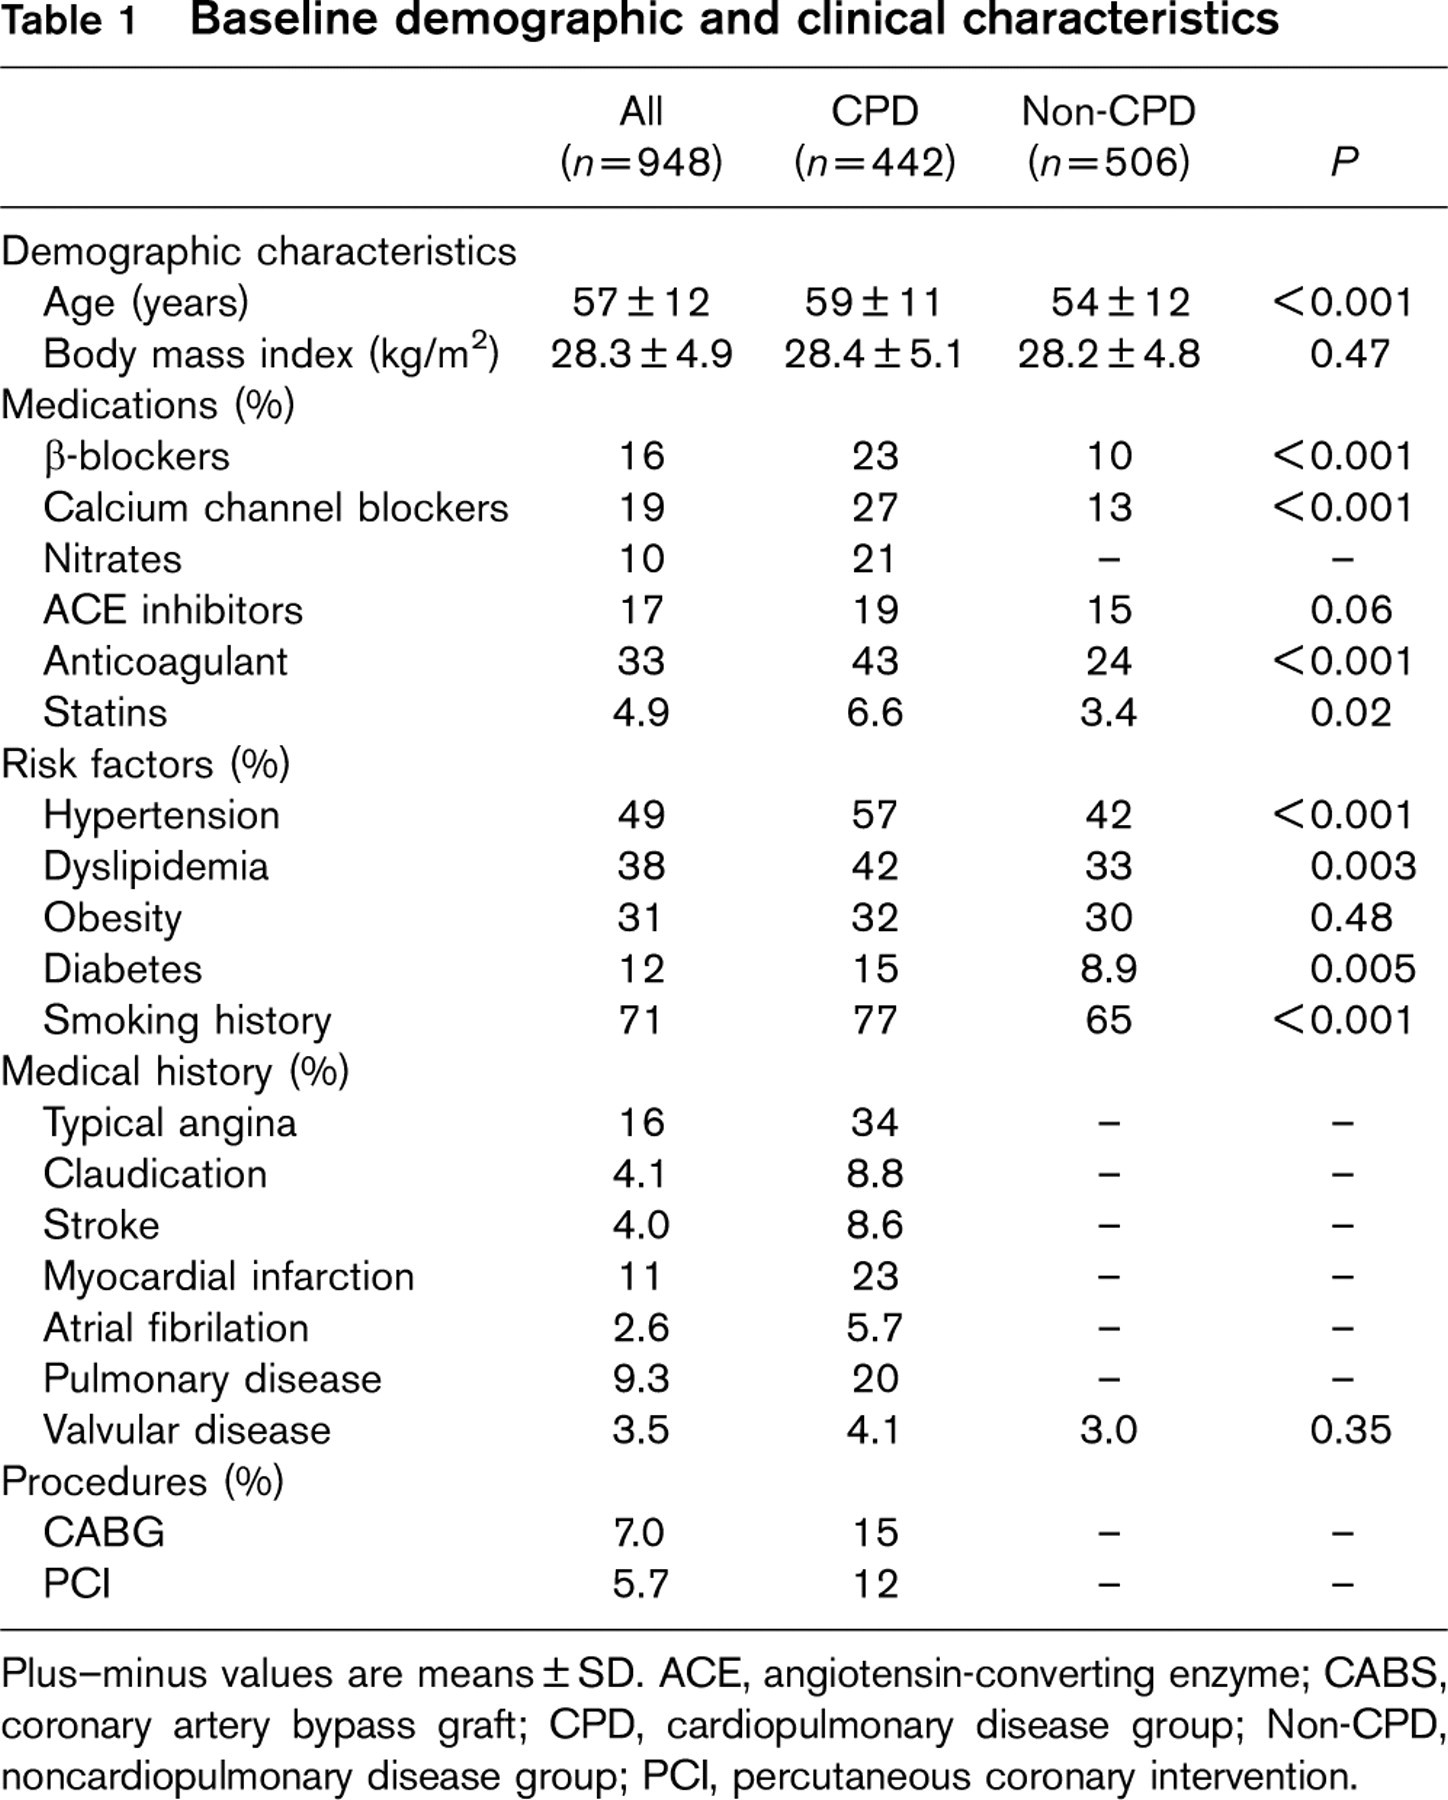
Plus-minus values are means ± SD. ACE, angiotensin-converting enzyme; CABS, coronary artery bypass graft; CPD, cardiopulmonary disease group; Non-CPD, noncardiopulmonary disease group; PCI, percutaneous coronary intervention.
Results
During a mean (± SD) follow-up period of 6.3 ± 3.2 years (median of 6.7 years; range 0.2-12.6), a total of 126 (13%) participants died, yielding an average annual mortality rate of 2.2%.
Demographic characteristics
Compared with the non-CPD group, participants with CPD were older, had a greater prevalence of dyslipidemia, hypertension, diabetes, more extensive use of medicines, more cardiovascular interventions, and were more likely to have smoked (Table 1).
Exercise test responses
Demographic characteristics and exercise test responses for participants who survived and those who died between the CPD and non-CPD groups are presented in Table 2. Maximum heart rate, peak VO2, maximal O2 pulse, and the percentage-predicted O2 pulse were significantly higher in survivors than in nonsurvivors in both the groups.
Maximal oxygen pulse, peak oxygen uptake, and mortality
The optimal cut-points for maximal O2 pulse, percentage-predicted O2 pulse, and peak VO2 were less than 12; ≥ 12 ml/beat, less than 76%; ≥ 76%, and less than 16; ≥ 16 ml/(kg·min), respectively.
After adjusting for potential confounders including age, medications, risk factors, medical history, and chronotropic incompetence, maximal O2 pulse significantly predicted all-cause mortality in both CPD [hazard ratios (HR): 2.91, 95% confidence interval (CI): 1.70-5.01, P = 0.01] and non-CPD (HR: 1.80, 95% CI: 1.01-3.20, P = 0.04) groups when the participants with low O2 pulse (< 12 ml/beat) were compared with participants with high O2 pulse (≥ 12 ml/beat). Results of the Kaplan-Meier analysis are shown in Fig. 1a.
Characteristics and exercise test responses among participants who survived and participants who died

Plus-minus values are means ± SD. CPD, cardiopulmonary disease group; Non-CPD, noncardiopulmonary disease group. P values are for comparison between the participants who survived and those who died in each group.
An age-adjusted multivariate Cox regression analysis, controlled for all potential confounders, revealed that the percentage-predicted O2 pulse achieved was also a significant predictor of all-cause mortality in both CPD (HR: 1.98, 95% CI: 1.16-3.39, P = 0.01) and non-CPD (HR: 2.46, 95% CI: 1.03-4.15, P = 0.008) groups, when the participants with low percentage-predicted O2 pulse (< 76%) were compared with participants with high percentage-predicted O2 pulse (≥ 76%). When both groups were considered together in the Cox model, every 10% increase in the percentage-predicted O2 pulse achieved yielded an improvement of 11% in survival (HR: 0.89, 95% CI: 0.80-0.99, P =0.04).
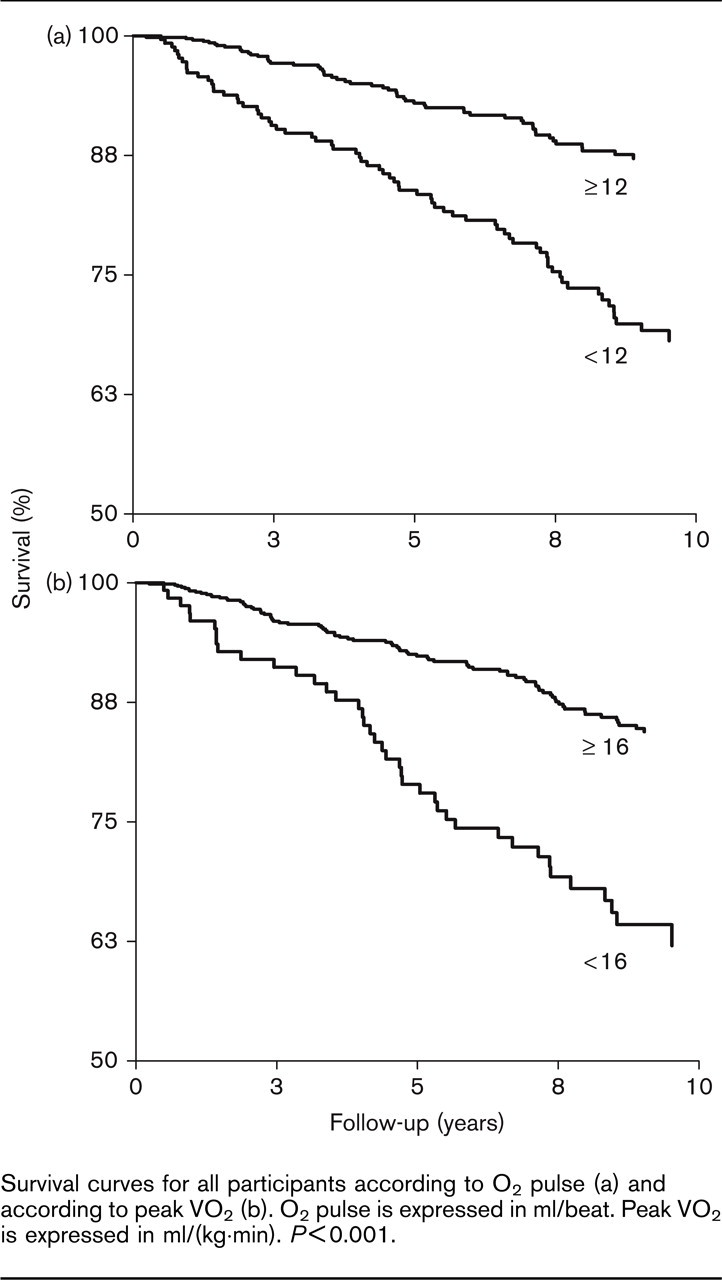
Survival curves for all participants according to O2 pulse (a) and according to peak VO2 (b). O2 pulse is expressed in ml/beat. Peak VO2 is expressed in ml/(kgmin). P < 0.001.
There was no interaction between the use and nonuse of β -blockers and predictive value of maximal O2 pulse. The maximal O2 pulse showed a similar trend for predicting all-cause mortality when the Cox regression model was adjusted for β-blocker use, when those taking β-blockers were assessed separately and when they were excluded from the analysis.
After adjusting for potential confounders, peak VO2 was a significant predictor of all-cause mortality in both CPD (HR: 1.91, 95% CI: 1.12-3.26, P = 0.017) and non-CPD (HR: 2.52, 95% CI: 1.08-5.86, P = 0.03) groups, when the participants with low peak VO2 (< 16ml/(kg-min)) were compared with participants with high peak VO2 (≥ 16ml/(kg-min)). Results of the Kaplan-Meier analysis for peak VO2 are shown in Fig. 1b.
AIC weights showed a higher accuracy for predicting mortality when maximal O2 pulse and peak VO2 were included together in the Cox model (79%), compared with models including peak VO2 (4%) or maximal O2 pulse (17%), separately.
The complementary predictive value of maximal O2 pulse and peak VO2 are shown in Table 3. Participants with both maximal O2 pulse and peak VO2 abnormal responses had 3.4-fold and 2.2-fold higher (CPD and non-CPD, respectively) risk of mortality than those with both normal responses. Results of the Kaplan-Meier analysis for complementary predictive value of O2 pulse and peak VO2 are shown in Fig. 2.
Discussion
The results of this study add to the existing body of research showing the prognostic value of maximal O2 pulse in CPD and non-CPD participants referred for exercise testing for clinical reasons. The results support the concept that maximal O2 pulse provides complementary information to the prognostic value of peak VO2 and also that maximal O2 pulse predicts risk when expressed as a percentage of the age-predicted value achieved.
Maximal oxygen pulse and mortality
According to the modified Fick equation, O2 pulse is numerically equal to the product of stroke volume and C(a-v)O2. Normally, O2 pulse increases with incremental exercise because of increases in both stroke volume and oxygen extraction. At a submaximal level, C(a-v)O2 generally plateaus and remains relatively constant as exercise progresses. Thus, the pattern of further change in O2 pulse will reflect the pattern of change in stroke volume, and will be reduced in any condition that reduces stroke volume [2, 19]. Several studies have evaluated O2 pulse and left ventricular function in patients who have undergone both CPX and nuclear ventriculography, and demonstrated that an impaired O2 pulse response to exercise is associated with abnormalities in left ventricular function because of myocardial ischemia or infarction [20, 21]. Considering the well-established prognostic value of impaired left ventricular function [22–25], O2 pulse should therefore be a strong predictor of mortality.
Age-adjusted Cox regression for the combined maximum oxygen pulse and oxygen uptake exercise test responses

Peak VO2 is expressed in ml/(kgmin). Maximal O2 pulse is expressed in ml/beat. CPD, cardiopulmonary disease group; Non-CPD, noncardiopulmonary disease group; O2 pulse, oxygen pulse; Peak VO2, maximal oxygen uptake; ref, reference group; 95% CI, 95% confidence interval.
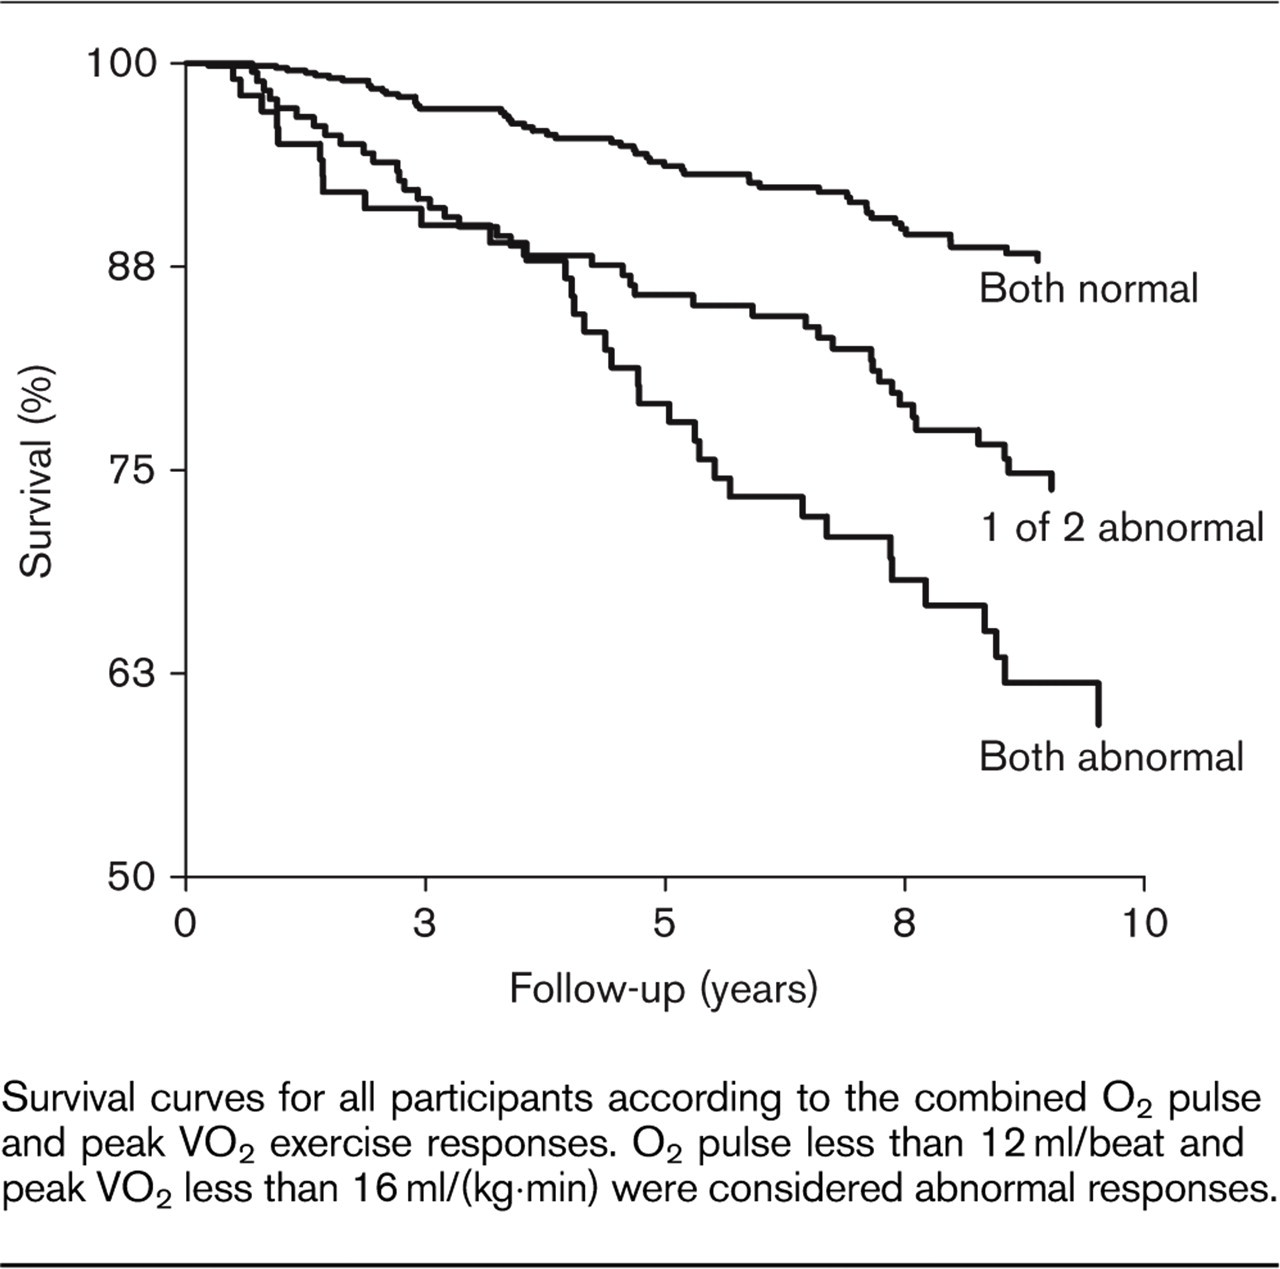
Survival curves for all participants according to the combined O2 pulse and peak VO2 exercise responses. O2 pulse less than 12 ml/beat and peak VO2 less than 16 ml/(kgmin) were considered abnormal responses.
Few studies have evaluated the prognostic value of O2 pulse [9–11]. Laukkanen et al. [10] studied 1596 men who underwent CPX and made a follow-up for a mean of 14 years. After excluding those with cardiovascular disease and those taking β-blockers, the risks for cardiovascular and all-cause mortality were 2.4-fold and 1.8-fold higher, respectively, when participants with a relatively low maximal O2 pulse (< 13.5 ml/beat) were compared with participants with a high O2 pulse (> 17.8 ml/beat). Similarly, in our study, the risk of mortality was 1.8 times higher in the non-CPD group for those with a low maximal O2 pulse. Our results, however, extend earlier findings, in that maximal O2 pulse also predicts all-cause mortality in CPD participants, among whom a nearly three-fold higher risk was observed in those with a low maximal O2 pulse.
Potential confounders of maximal oxygen pulse
Our approach was novel, in that we assessed the influence of potential confounding variables such as chronotropic incompetence, body weight, and β-blockers on the ability of O2 pulse to predict mortality. Chronotropic incompetence has been shown to predict mortality and coronary heart disease risk even after adjusting for age, exercise capacity, and cardiovascular risk factors [26, 27]. Recently, we observed that those who were unable to achieve 80% of predicted heart rate reserve had a nearly three-fold higher risk of cardiovascular mortality [15]. Therefore, considering the influence of heart rate on O2 pulse, adjustments for chronotropic incompetence should be considered in studies assessing the predictive value of maximal O2 pulse. The present results indicate that even after adjusting for chronotropic incompetence, maximal O2 pulse remained a strong multivariate predictor of all-cause mortality.
We also observed that the percentage-predicted O2 pulse was significantly different between survivors and nonsurvivors and also between CPD and non-CPD participants (P < 0.001) (Table 2). Moreover, a novel finding was the observation that participants who achieved less than 76% of predicted maximal O2 pulse had more than two times the risk of all-cause mortality. Out of 126 participants who died, 81 (64%) did not achieve 76% of predicted O2 pulse. These results confirm previous findings showing not only the value of predicted O2 pulse in identifying circulatory impairment but also that it is an important predictor of all-cause mortality in both CPD and non-CPD participants.
An additional observation we made was that the results were not greatly affected by β-blocker therapy. This is important, in that previous studies have excluded patients on β-blockers, assuming that the prognostic applications of maximal O2 pulse would not apply to patients taking these medications. Although our sample of patients taking β-blocking agents was limited (154, of whom 26 died), the trend observed suggests that maximal O2 pulse predicts risk regardless of the β-blocker used.
Combined predictive value of maximal oxygen pulse and peak oxygen uptake
In contrast to the results of Laukkanen et al. [10], our findings support the concept that maximal O2 pulse provides information that complements peak VO2 in predicting mortality. We tested this hypothesis through the use of AIC weight analysis and also by combining exercise responses for both maximal O2 pulse and peak VO2 in an age-adjusted multivariate Cox model (Table 3). AIC weights consider model selection and quantify a model's predictive accuracy, based on the assumption that more variables in a given model would provide better predictive accuracy than fewer variables. Stated differently, the AIC weights attempt to find the model that best explains the relationships of data with minimum parameters [18, 28]. In our study, the AIC weights showed that the model including both maximal O2 pulse and peak VO2 had the highest predictive accuracy for mortality. After adjustments for all potential confounders, the risks for mortality when both maximal O2 pulse and peak VO2 responses were abnormal were 3.4-fold and 2.2-fold higher (CPD and non-CPD, respectively), compared with those whose responses were both normal (Table 3). This might, in part, be explained by the fact that O2 pulse is more dependent on left ventricular function than peak VO2, asit incorporates the heart rate response to exercise.
Limitations
As this was a Veterans Affairs cohort, our findings were limited to men. In addition, we had information only on death from any cause; therefore, further studies are needed to assess the prognostic value of maximal O2 pulse for cardiovascular death.
Conclusion
Our findings have shown that maximal O2 pulse is an independent predictor of all-cause mortality after adjusting for potential confounding factors including medications, risk factors, and clinical history. In addition, we demonstrated that the age-predicted O2 pulse achieved was an independent predictor of mortality. These results support the concept that maximal O2 pulse complements peak VO2 in predicting the risk of mortality. The simple addition of absolute or relative O2 pulse to CPX results provides added information on risk stratification and should be routinely included in the test report.
Footnotes
Acknowledgements
Dr Oliveira was supported by CAPES (Brazil)-BEX-3853-06-3. Potential conflicts of interest or disclaimers: none declared.