
Abstract
Background and purpose
Many patients who attend transient ischemic attack clinics have a noncerebrovascular diagnosis. The long-term outcomes in this group are not well described. We evaluated these in a cohort referred to a transient ischemic attack clinic with a suspected transient ischemic attack.
Methods
Patients were clinically classified as having stroke or a transient ischemic attack or a noncerebrovascular diagnosis (nontransient ischemic attack). Follow-up was via electronic record linkage. The primary endpoint was cardiovascular death or a major cardiovascular event. Secondary outcomes included incident neurological disease (excluding stroke or transient ischemic attack) and the need for permanent pacemaker insertion. Outcomes in the transient ischemic attack and nontransient ischemic attack cohorts were compared using Cox's proportional hazards models. Mortality outcomes were further compared with those in a contemporary control group of individuals with hypertension.
Results
Of the 3533 patients who attended the transient ischemic attack clinic, 53·5% had a transient ischemic attack. Of these, 769 (40·7%) suffered a cardiovascular endpoint, compared with 458 (27·9%) with a nontransient ischemic attack (hazard ratio 1·53, 95% confidence interval 1·36–1·72). The risk remained higher but was attenuated following adjustment (hazard ratio 1·21, 95% confidence interval 1·05–1·41). Cardiovascular mortality in both groups was higher than that in hypertensive controls. The risk of a subsequent nonstroke neurological event was higher in those without a transient ischemic attack.
Conclusions
Patients without a transient ischemic attack referred to a transient ischemic attack clinic have a high risk of future vascular events that exceeds risk in a cohort with hypertension. All patients attending transient ischemic attack clinics should undergo assessment of their cardiovascular risk and the use of methods to reduce this risk should be explored.
Introduction
The risk of suffering stroke early after a transient ischemic attack (TIA) is substantial. Urgent assessment and treatment is the aim for all with suspected TIA (1, 2).
Approximately half of all patients who attend TIA clinics do not have cerebrovascular disease and mimics such as (pre) syncope and migraine are common (3). Such patients have traditionally been thought to have a benign prognosis (4), although cardiovascular (CV) risk was recently shown to be higher in those with transient neurological symptoms but not TIA, than in controls with no neurological symptoms (5). We aimed to further quantify this risk. In the Dutch TIA trial (6), such patients had a lower rate of stroke but a higher rate of cardiac events during follow-up compared with those with a definite TIA, possibly due to the risk of cardiac arrhythmia. It is also possible that those without TIA may have symptoms secondary to an alternative underlying neurological disorder, which will later become manifest. We therefore aimed to explore whether bradydysrhythmia requiring permanent pacemaker (PPM) insertion and the occurrence of nonstroke neurological disorders were common among those without TIA attending our service.
We report an evaluation of long-term CV, dysrhythmic and neurological outcomes in a cohort of patients attending a specialist TIA clinic. A contemporary cohort from a large blood pressure clinic was used to provide comparative CV mortality data.
Methods
TIA clinic population
Data contained in the West Glasgow Stroke Registry were used. This has been described in detail elsewhere (7). A fast-track TIA clinic was held at least twice weekly during the study period. All patients are reviewed or discussed with a Consultant Stroke Physician and undergo a standardized assessment including history, examination and investigation. Data from this assessment are prospectively recorded onto a standard form and entered into an electronic database. Patients are informed that their data are collected for audit, research and clinical management purposes, and are given the opportunity to decline entry of their details into the Registry. The Registry holds data on consecutive patients from August 10, 1992 onwards.
We dichotomized clinical diagnoses at baseline as being either cerebrovascular (TIA), which includes TIA and some with minor stroke, or noncerebrovascular (non-TIA). ABCD2 scores (8) were calculated for all patients according to history and examination findings at the time of clinic assessment. The ABCD2 score uses age, blood pressure, clinical features of TIA, duration of symptoms and the presence of diabetes to assess the risk of early stroke quantitatively.
Subjects were followed up by record linkage (9) to death and hospital discharge data supplied by the Registrar General of Scotland. The causes of death and hospital discharge diagnoses are described according to the ninth and 10th revisions of the World Health Organisation International Classifications of Diseases (ICD-9 and ICD-10) and the fourth revision of The Office of Population, Censuses and Surveys' Classification of Surgical Operations and Procedures (OCPS-4). The date of last record linkage is December 27, 2006.
The local Research Ethics Committee approved this analysis of anonymized clinical data. The Privacy Advisory Committee of the Chief Medical Officer for Scotland approved linkage of the clinical data to death and hospital discharge records.
Outcome measure
The primary outcome measure was the occurrence of a CV event defined as death due to stroke (ICD-10 I61, I63–I66, G45; ICD-9 431, 433–437), myocardial infarction (MI) (ICD-10 I21–I23; ICD-9 410–412), other vascular cause (ICD-10 I10–I20, I24–I25, I44–I45, I47–I51, I62, I70–I79; ICD-9 401–405, 413–414, 426–429, 432, 440–445, 447–448) or hospital discharge following stroke/TIA, MI or major lower limb amputation (OCPS-4 X09–X10). These definitions were not restricted to the primary cause of death or discharge diagnosis but we considered only the first event after clinic attendance.
We defined two secondary endpoints. First, the occurrence of any nonstroke neurological event (ICD-10 G00–G09 (inflammatory diseases of the central nervous system), G10–G13 (systemic atrophies primarily affecting the central nervous system), G20–G26 (extrapyramidal and movement disorders), G30–G32 and F00–F03 (other degenerative diseases of the nervous system/dementia), G35–G37 (demyelinating diseases of the central nervous system), G40–G47, excluding G45 and G46 (episodic and paroxysmal disorders), G50–59 (nerve, nerve root and plexus disorders), G60–64 (polyneuropathies and other disorders of the peripheral nervous system), G70–G73 (disease of myoneural junction and muscles), G80–83 (cerebral palsy and other paralytic syndromes), G90–99 (other disorders of the nervous system), I60 (sub-arachnoid hemorrhage), I62 (nontraumatic sub-dural/extradural hematoma) and equivalent ICD-9 codes where applicable). Second, PPM insertion (OCPS-4 K60–K61) in patients with no prior PPM.
The control population
A cohort from the Glasgow Blood Pressure Clinic database was used to provide comparative CV mortality data. The Glasgow Blood Pressure Clinic is a secondary and tertiary referral center for the west of Scotland. Demographic and clinical data are gathered routinely on all patients and entered into a computer database, which currently holds data on those who have attended since November 1967. Those who first presented to the service on or after 1992 were included in this analysis, thus providing a contemporaneous and geographically equivalent cohort for comparison. Follow-up for survival is also gathered via record linkage to the Scottish deaths register. Mortality outcomes are coded in a manner similar to that outlined above. The date of last record linkage is 10 July 2004.
Statistical analysis
TIA clinic population
We explored univariate differences in the demographics and clinical features between patients with TIA and those with non-TIA (t-test for continuous variables and χ2-testing for dichotomous variables). Variables predictive of the occurrence of a CV event were then explored in a similar manner. The Cox proportional hazard models were generated to compare the CV event rate between those with TIA and those with non-TIA. We first developed a model adjusted for age and gender and then a model including further potential confounding variables. We also explored variables predictive of a vascular event in the sub-group of those without TIA. Secondary analyses of only fatal and nonfatal events were then performed. The proportionality assumption was verified by the generation of log minus log plots and lines on the graphs were confirmed as approximately parallel.
Similarly, a Cox proportional hazard model was generated to compare the occurrence of nonstroke neurological events between those with TIA and those with non-TIA. Binary logistic regression analysis was performed to examine future PPM insertion.
Comparison with the hypertensive control population
Crude CV mortality rates were calculated per 100 patient years of follow-up for the TIA, non-TIA and hypertensive groups. A Cox proportional hazards model was then generated to compare the adjusted CV mortality rate.
Adjusted survival free from nonstroke neurological event in patients with TIA (solid line) compared with non-TIA (hashed line). Adjustment variables were age, gender, history of diabetes mellitus, vascular disease and serum creatinine. HRs shown are relative to the non-TIA group. CI, confidence interval; HR, hazard ratio; TIA, transient ischemic attack.
Statistical analysis was performed using SPSS version 15·0 (SPSS Inc., Chicago, IL, USA). P-values of < 0·05 were considered statistically significant.
Results
Baseline demographics of the TIA clinic cohort
We studied 3533 patients who attended the TIA clinic between August 1992 and January 2005 – 1631 (46·2%) were male; the mean (SD) age was 64·7 (13·6) years and 1890 (53·5%) had TIA. Further details are shown in Table 1. There was a minimum of 24 months of follow-up for each patient and the median (IQR) follow-up was 87 (64–118) months.
Baseline demographic variables
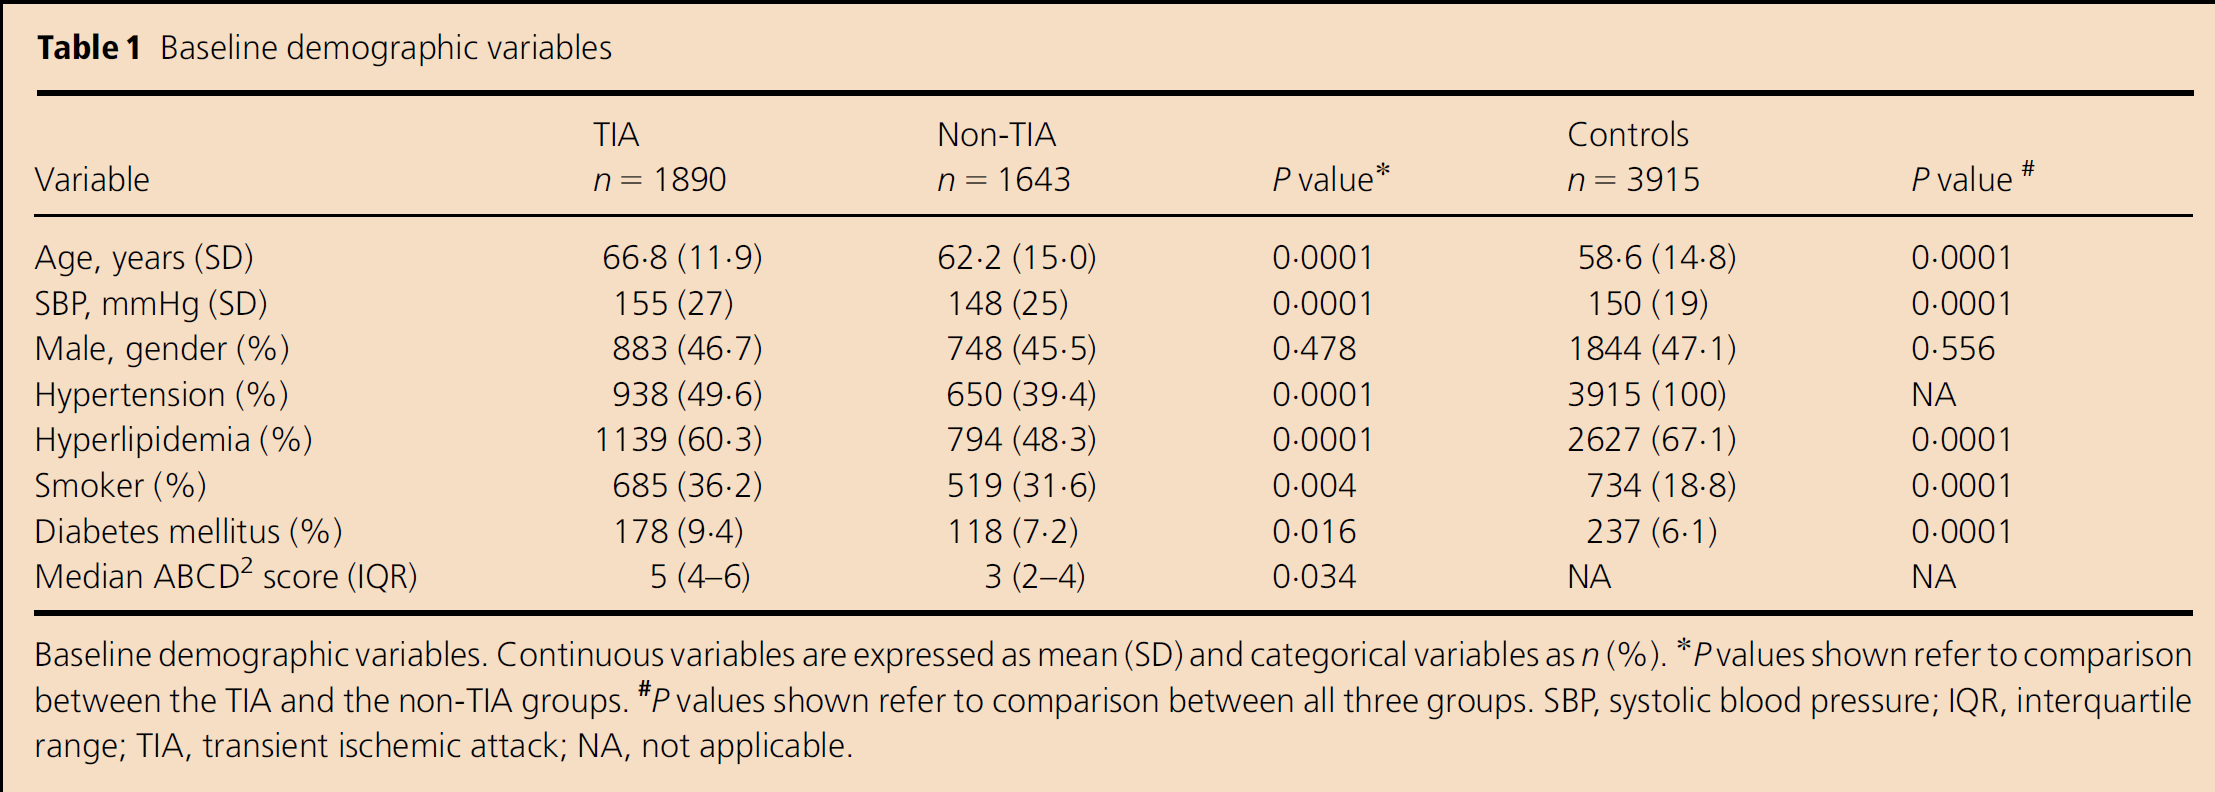
Baseline demographic variables. Continuous variables are expressed as mean (SD) and categorical variables as n (%).
P values shown refer to comparison between the TIA and the non-TIA groups.
P values shown refer to comparison between all three groups. SBP, systolic blood pressure; IQR, interquartile range; TIA, transient ischemic attack; NA, not applicable.
The proportion of patients referred to the clinic with non-TIA increased during the study (P < 0·001 by χ2-test). Between 1992 and 1994, 95 of 258 patients (36·8%) had non-TIA, compared with 241 of 399 patients (60·4%) between 2003 and 2005. The demographic characteristics of patients with TIA differed significantly from those in the non-TIA cohort in several respects (Table 1). They were older, had a higher blood pressure and a higher burden of traditional CV risk factors. In the 1643 patients with non-TIA, the most common specified diagnoses were cardiac disorder (144 patients (8·8%)), headache/migraine (63 patients (3·8%)), nonorganic symptoms (56 patients (3·4%)), seizure (48 patients (2·9%)) and transient global amnesia (35 patients (2·1%)).
CV event rates in the TIA clinic cohort
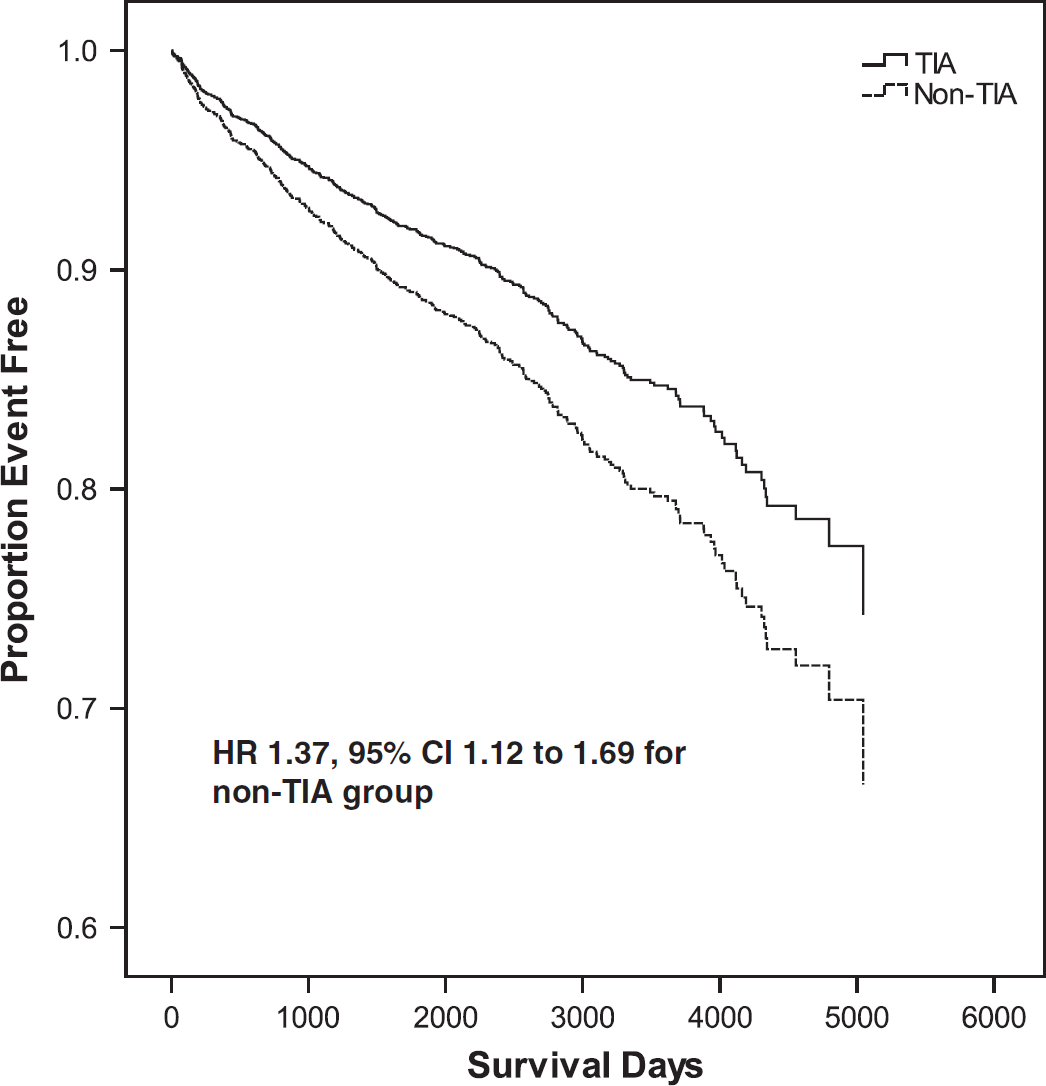
Of those with TIA, 769 patients (40·7%) suffered a CV endpoint, compared with 458 (27·9%) in those with non-TIA (hazard ratio (HR) 1·53, 95% confidence interval (CI) 1·36–1·72; P < 0·001) (Fig. 1). Death was the first recorded event in 154 patients in the TIA group (74 other vascular deaths, 33 stroke deaths and 47 MI deaths) and in 103 of the non-TIA group (61 other vascular deaths, 15 stroke deaths and 27 MI deaths). The risk of a CV event remained higher in those with TIA following adjustment for age and gender and further potential confounders, although the difference was attenuated (HR 1·21, 95% CI 1·05–1·41; P = 0·011 following full adjustment) (Table 2).
Risk of CV event (adjusted) in the TIA clinic population (Panel A) and compared with the hypertensive population (Panel B).
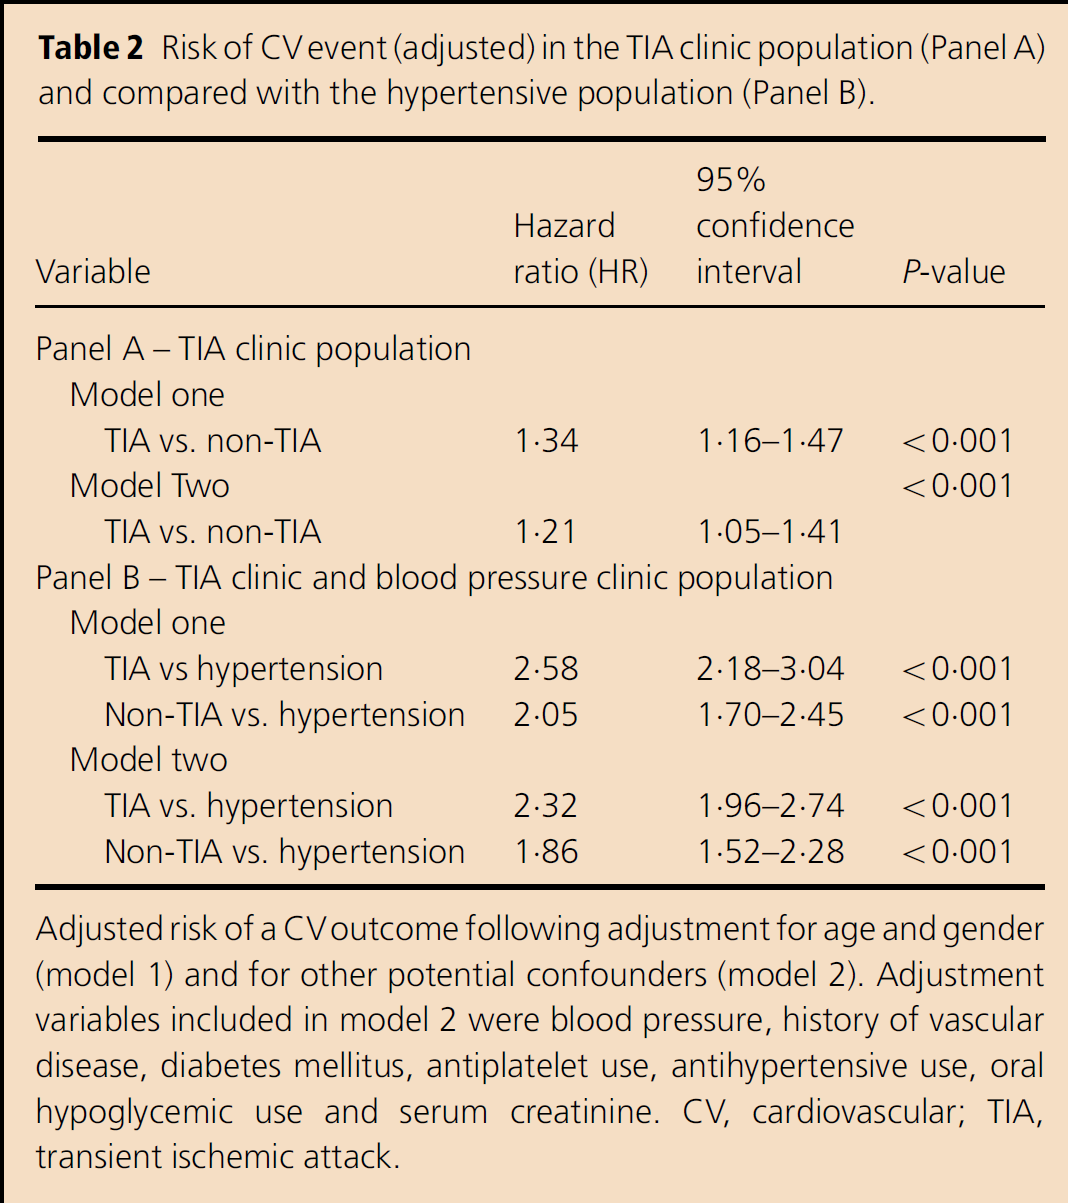
Adjusted risk of a CV outcome following adjustment for age and gender (model 1) and for other potential confounders (model 2). Adjustment variables included in model 2 were blood pressure, history of vascular disease, diabetes mellitus, antiplatelet use, antihypertensive use, oral hypoglycemic use and serum creatinine. CV, cardiovascular; TIA, transient ischemic attack.
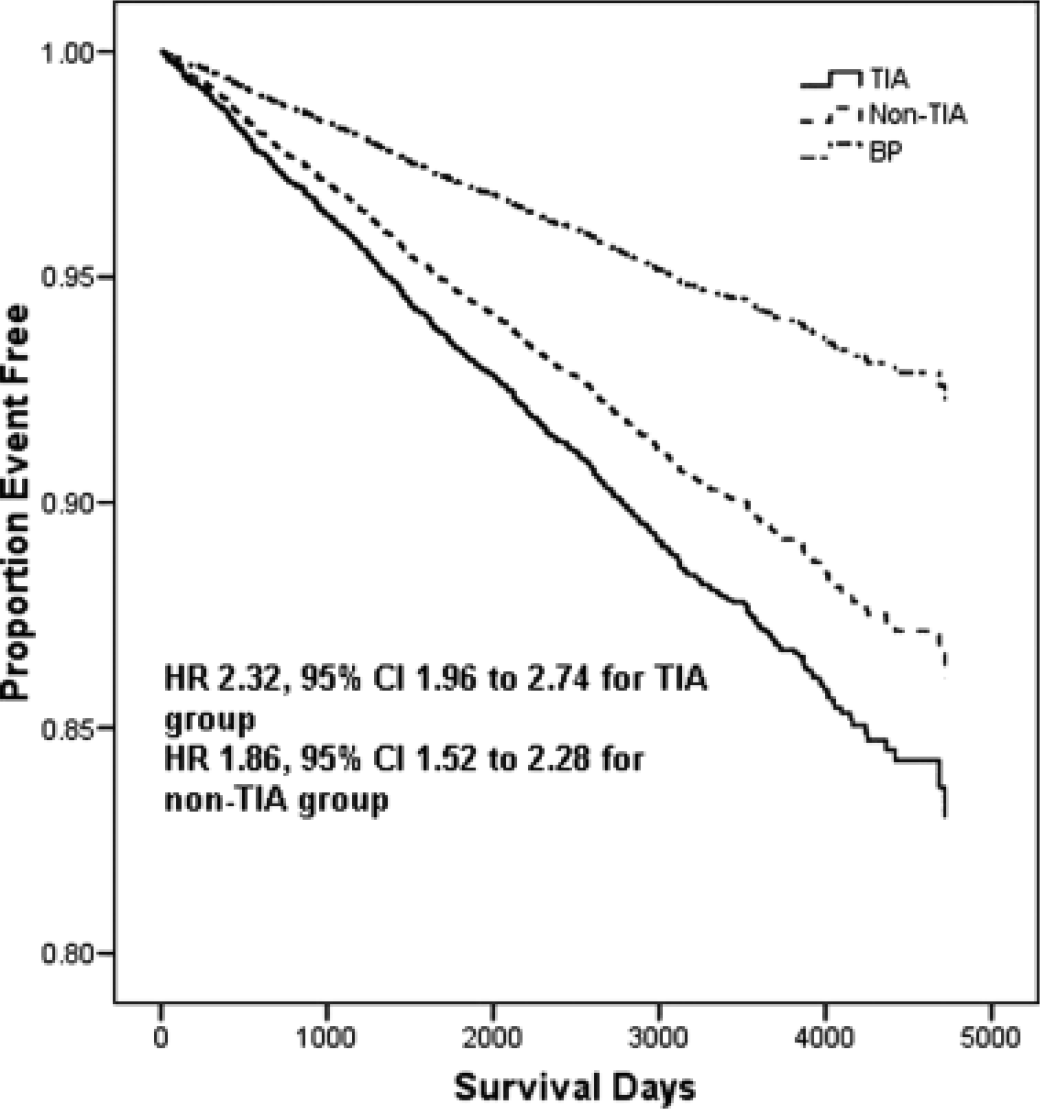
Adjusted survival free from cardiovascular death in patients with TIA (solid line), non-TIA (hashed line) and hypertension (hashed–dotted line). Adjustment variables were age, gender, blood pressure level, history of hyperlipidemia, diabetes mellitus and smoking status. HRs shown are relative to the hypertensive (BP) control group. CI, confidence interval; HR, hazard ratio; TIA, transient ischemic attack.
In patients with non-TIA, the risk of suffering a CV endpoint increased with increasing age, blood pressure, serum creatinine, male gender, presence of preexisting CV disease, hypertension, diabetes mellitus and use of antiplatelet, antihypertensive and oral hypoglycemic treatment. Variables that remained significant on multivariate analysis are shown in Table 3. On exploratory analysis, a higher ABCD2 score was closely linked to an increased risk.
Risk of CV event (adjusted) in patients with a noncerebrovascular diagnosis
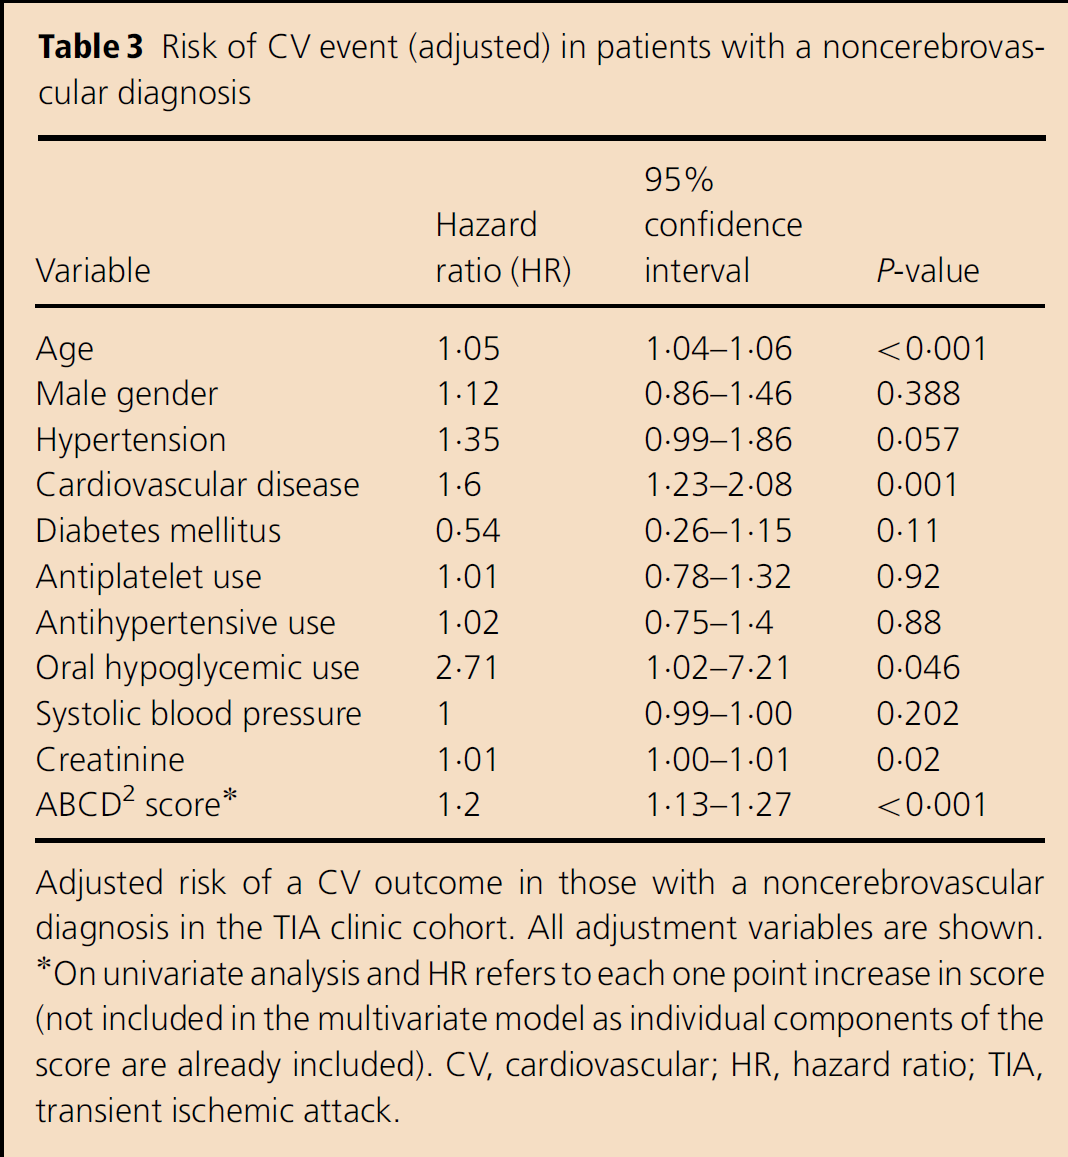
Adjusted risk of a CV outcome in those with a noncerebrovascular diagnosis in the TIA clinic cohort. All adjustment variables are shown.
On univariate analysis and HR refers to each one point increase in score (not included in the multivariate model as individual components of the score are already included). CV, cardiovascular; HR, hazard ratio; TIA, transient ischemic attack.
Comparison with the control population
The control population included 3915 patients with hypertension who attended between January 1, 1992 and April 23, 2003.
There was a minimum of 14 months of follow-up for each patient, and the median (IQR) follow-up was 81 months (IQR 44–118). The mean age was 58·6 (SD 14·8) years and the mean systolic blood pressure was 150 (SD 19) mmHg. Further details and comparison with the TIA and non-TIA groups are shown in Table 1. There were 224 CV deaths in the control group. The crude CV mortality rates were 2·77, 1·9 and 0·8 deaths per 100 patient years in the TIA, non-TIA and control group, respectively. Compared with the hypertension control group, CV mortality was significantly increased in both the TIA (HR 3·61, 95% CI 3·06–4·25) and the non-TIA groups (HR 2·37, 95% CI 1·97–2·86). These differences remained apparent after adjustment (Table 2 and Fig. 1).
Secondary endpoints
Neurological events in the TIA clinic population
In total, 514 patients (14·5% of 3533) suffered a nonstroke neurological event causing death or hospital admission during follow-up. The nature of these events is shown in Table 4. Of those with TIA, 262 (13·9%) suffered a nonstroke neurological event, compared with 252 (15·4%) in those with non-TIA (HR 1·37, 95% CI 1·10–1·69, P = 0·003 following adjustment).
Nonstroke neurological events during follow-up
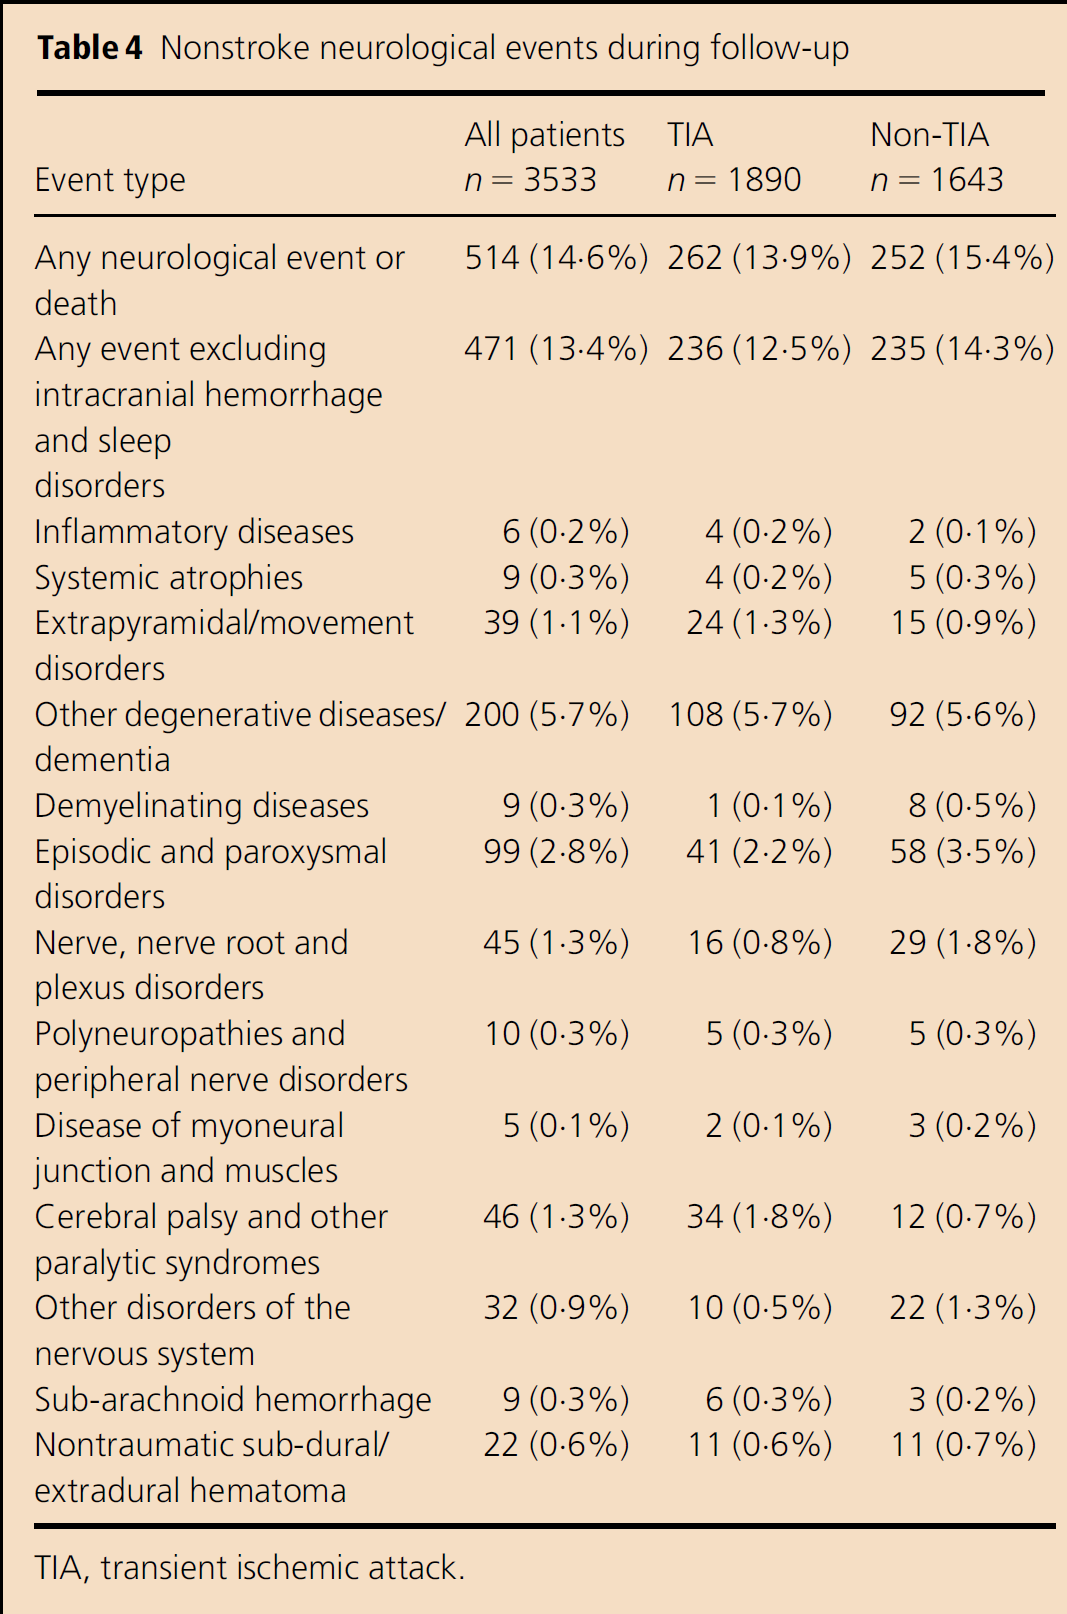
TIA, transient ischemic attack.
PPM insertion in the TIA clinic population
We included 3511 patients in this sub-analysis (22 patients were excluded due to prior PPM) and 49 (1·3%) required PPM insertion. Six of 143 patients with syncope (4·2%) required PPM insertion.
Patients requiring PPM insertion were more likely to be older (odds ratio for PPM insertion (OR) 1·05, 95% CI 1·03–1·08 per year; P < 0·001); have a longer follow-up duration (OR 1·28, 95% CI 1·05–1·56 for each two-years' follow-up; P = 0·01); have existing CV disease (OR 2·04, 95% CI 1·15–3·60; P = 0·01); and to be receiving antihypertensive (OR 2·25, 95% CI 1·24–4·11; P < 0·01) or antiplatelet (OR 2·28, 95% CI 1·16–4·48; P = 0·02) medication.
There was no significant difference in the rate of PPM insertion between those with TIA and those with non-TIA (OR 0·66, 95% CI 0·37–1·19; P = 0·17 for TIA). On multivariate analysis, increasing age (OR 1·04, 95% CI 1·01–1·07 per year; P < 0·01) and a longer follow-up duration (OR 1·28, 95% CI 1·04–1·59 for each two-years' follow-up; P = 0·02) were independently predictive of PPM insertion.
Discussion
Our study confirms reports from other centers that approximately half of all patients who attend TIA clinics have not suffered TIA or stroke (3, 10). As expected, future vascular risk is very high in patients with TIA, but is also high in those with non-TIA, at approximately 3·3% per annum. The vascular risk in patients without TIA who attend a TIA clinic is higher than that in those who attend a blood pressure service for difficult hypertension. Thus, non-TIA patients who attend TIA services are likely to benefit from active CV risk factor management.
Our findings are compatible with, and add to, those from a recent evaluation of a Dutch cohort where subjects with transient neurological symptoms not suggestive of TIA were at a significantly higher risk of major vascular disease than subjects with no neurological symptoms, but at less risk than those with TIA (5). There are important differences between our population and that of the Rotterdam study. Our control subjects had a baseline risk higher than the control group in the Dutch study: all had hypertension, and blood pressure was higher while the rates of other risk factors were similar. We also included all patients felt not to have TIA in our non-TIA group and did not exclude those with migraine or cardiac syncope, meaning our sample is truly representative of the patients who routinely attend TIA services. The reason why TIA clinic attendees who do not have TIA have such a high vascular risk is unexplained and does not appear to be solely due to the traditional risk factor burden.
There are possible explanations. Erroneous classification of patients with TIA into the non-TIA group is a possible source of bias. We tried to limit this with the use of a standardized assessment and a senior stroke physician reviews all patients before a final diagnosis is assigned. Brain imaging is available on request for all patients but, despite advances in imaging, TIA remains a clinical diagnosis (11) and we thus used a clinical definition.
In our study, 28% of such patients suffered a CV endpoint. Guidelines from the Joint British Societies and the Scottish Intercollegiate Guidelines Network (SIGN) (12) classify individuals as high risk if they have a 10-year risk of CV disease ⩾ 20% and recommend active CV risk factor management for such people. However, at the time of clinic presentation, only 52% of patients in the non-TIA group were receiving antiplatelet or anticoagulant therapy, 42% were receiving antihypertensive therapy and only 11% were receiving a statin, suggesting an unmet need with regard to preventative therapies. Throughout the early years of the study, approaches to CV risk reduction were less comprehensive than today and it may be that more aggressive risk factor management would have reduced this risk. The difference in the uptake of preventative therapies could explain some of the vascular risk seen in those without TIA. Others have suggested that the diagnosis of non-TIA serves as a marker for those at high cardiac and other vascular risks (6).
A higher ABCD2 score, which is link to a diagnosis of TIA (13), was associated with an increased risk of a CV endpoint in patients with non-TIA alone. While ABCD2 was originally validated in patients with TIA, our data suggest that this score may also have utility in those with non-TIA as the score includes data on CV risk factors such as age, hypertension and diabetes. Diabetes was not predictive of increased risk in those with non-TIA when adjustment for other risk factors and use of oral hypoglycemic agents was performed. This may reflect the high uptake of such treatments or, as many suggest, that diabetes is of less importance where other risk factors are prevalent.
Patients with transient neurological symptoms but not TIA might be expected to have a higher risk of future neurological events as this group includes a high proportion of neurological stroke mimics (14). We did find an increased risk, although in absolute terms, this was small (≈ 1%). The numbers with subsequent admissions for demyelinating disease were small but did appear to be higher in the non-TIA group. We do not know whether any of these participants were known to have a demyelinating disorder when they first attended the clinic. Otherwise, it is notable that where differences appeared to be apparent, they were for less severe illnesses such as episodic and paroxysmal disorders and nerve, nerve root or plexus disorders.
Many of those who required PPM insertion had TIA, presumably because they also had manifest or occult ischemic heart disease. Few patients with syncope required PPM insertion. Investigations such as 24 h electrocardiography are often used in an attempt to identify cardiac dysrhythmias in patients with syncope (15, 16); however, this appears to be a low-yield strategy in such patients. The numbers of individuals with syncope were small and this study did not have adequate statistical power to address this issue definitively.
The findings from this study have limitations. Management of TIA has evolved and this analysis of data collected over more than a decade might potentially limit the relevance of the findings. However, the results did not materially differ following adjustment for date of clinic attendance. While the waiting time for assessment throughout the study period (approximately nine-days) is longer than that currently recommended, it seems unlikely that the diagnostic accuracy of referrals has improved. In fact, the opposite may be the case (17). Thus, we do not think the evolving changes in the management of suspected TIA impact on the relevance of our data.
Record linkage has been well validated and is reliable, with a high probability of event ascertainment in Scotland (18, 19). However, record linkage does not include admissions to private hospitals or institutions outside Scotland and morbidity data often rely on diagnoses recorded by junior physicians. This could lead to variation in event coding and misclassification of the primary diagnoses. We included all recorded diagnoses in our analyses to minimize possible confounding.
The strengths of this study include the large study population, the long duration of follow-up, the consistency of staff and procedures during the study period and a contemporaneous high-risk control population. Our TIA service is typical of that available in the United Kingdom and our results should be generalizable to other populations. We only considered the first event after clinic attendance to ensure that multiple events in a small number of patients did not introduce bias.
In summary, many patients attending TIA clinics have non-TIA and such individuals have a high vascular risk that exceeds that of those with treated hypertension. This suggests that all patients attending TIA clinics should have assessment of their CV risk and the use of methods to reduce this risk should be explored. Subsequent nonstroke neurological events are slightly more common in those without TIA and further work should explore whether such individuals can be better recognized at the first TIA clinic attendance.
Footnotes
Acknowledgement
The local Research Ethics Committee approved analysis of the anonymous clinical data. The Privacy Advisory Committee of the Chief Medical Officer for Scotland approved linkage of the clinical data to death and hospital discharge records.