
Abstract
We study a multi‐product firm with limited capacity where the products are vertically (quality) differentiated and the customer base is heterogeneous in their valuation of quality. While the demand structure creates opportunities through proliferation, the firm should avoid cannibalization between its own products. Moreover, the oligopolistic market structure puts competitive pressure and limits the firm's market share. On the other hand, the firm has limited resources that cause a supply‐side fight for adequate and profitable production. We explicitly characterize the conditions where each force dominates. Our focus is on understanding how capacity constraints and competition affect a firm's product‐mix decisions. We find that considering capacity constraints could significantly change traditional insights (that ignore capacity) related to product‐line design and the role of competition therein. In particular, we show that when the resources are limited, the firm should offer only the product that has the highest margin per unit capacity. We find that this product could be the diametrically opposite product suggested by the existing literature. In addition, we show that for intermediate capacity levels, whereas the margin per unit capacity effect dominates in a less competitive market, proliferation and cannibalization effects dominate in a more competitive market.
Introduction
Multi‐product firms account for 91% of the output in US manufacturing and they often make short‐ to medium‐term adjustments in their product‐lines (Bernard et al. 2006). It is reported that 68% of the multi‐product US manufacturing firms alter their product mix, 12% by dropping at least one product, 11% by adding at least one product, and 45% by both adding and dropping at least one product in the medium term. However, success of these product‐line decisions depends largely on the firm's existing production capacity. Many furniture manufacturers (e.g., Rieke Office Interiors, Elgin, IL) produce custom and standard furniture using the same fixed capacity. In another example, the available capacity of a flexible machine (machining time) is allocated between high‐and low‐quality products where a higher quality product requires slower machining speeds (smooth finish) thereby taking a longer time to produce. Similarly, Turo Tailor produces both its mass‐produced and custom‐tailored suits in its factory in Kuopio, Finland (Sievänen and Peltonen 2006), in which a custom‐tailored suit uses more of the available factory time compared with a mass‐produced suit.
The majority of the firms in services are also multi‐product. For example, public or private, many universities are constrained by space for student housing, while they offer a range of dorm room types with different sizes and amenities at various prices (Pryor 2006). The cruise line industry is another example where differentiated product‐lines are the norm. They offer a wide range of staterooms from small rooms (119 sq. ft.) to luxurious suites with private jacuzzis and grand pianos (> 2000 sq. ft.). In this industry, supply capacity is notoriously limited (Cruise Travel Specialist 2010). There is a backlog for new builds around the world's shipyards, and refurbishing the existing ships is the rule of the game. Upgrading to premium services is also an option in many information technology products where users can have access to larger storage space, bandwidth usage, or data‐transfer capabilities. In another example, airlines offer differentiated products such as economy, business, and first‐class seats. They offer a subset of these products in their aircrafts, and passengers self‐select from this subset on a specific origin–destination pair. The subset often changes in the short to medium term. For example, while Cathay Pacific Airways offered no first‐class seats on route San Francisco to Hong Kong in March of 2008 (in addition to 2520 business and 21,504 economy‐class seats), they chose to offer 632 first‐class seats in December of the same year (in addition to 2370 business and 16,274 economy‐class seats). We also note the increased competition during the same time period on that route.
For airlines, changing the seating configuration in an aircraft is a common short‐ to medium‐term solution, and it is a minor operation that is accomplished fairly easily. Even a complete refurbishing and refitting (that is, above and beyond a minor seat rearrangement) may take as little as 21 days. Hence, the specific type and volume of offerings can be adjusted with short‐ to medium‐term commitments without making investments for new aircrafts.
In all of the above‐mentioned examples, the supply capacity constraint becomes extremely important and often characterizes firms' operations. Under those conditions, ignoring supply capacity while deciding the product‐line could be sub‐optimal. However, due to traditional organizational structure, firms often do not determine product‐line decisions taking supply capacity into account, even though the ability to produce depends on it critically. For example, the airline industry is a well‐known example where capacity constraints are a part of the product‐mix decisions “as an error term at best.” Our aim is to understand the inefficiencies caused as a result of this omission.
In this article, we explicitly model such situations in practice where capacity constraints need to be taken into consideration ahead of time. We analyze the optimal short‐ to medium‐term product‐line decisions when the resources may be limited. In particular, we consider multiple quality‐differentiated products that differ not only in their unit operating costs and prices (based on quality), but also in the resources they consume per unit. In such a situation, there are three interactions at play: (i) there is an intra‐firm competition among the products for the demand; (ii) there is an intra‐firm competition among the products for the resource capacity; and (iii) there is an inter‐firm competition for the market share. In this setting, we explore a number of important research questions such as: What is the impact of supply capacity limitations on optimal product‐line choice? How does the optimal product line change with intensity of competition?
Compared to a traditional firm that makes marketing and operations decisions sequentially, we show that a firm that integrates marketing and operations decisions can have better profits. Moreover, the product‐mix decisions might be different. Among other results, we have the following key findings. We find that the optimal product‐line choice should depend not only on price discrimination and cannibalization but also on efficient resource utilization. We show that, in designing their product‐lines, firms need to consider the margin per unit capacity in addition to the trade‐off between price, quality, and demand. For example, it is well known that when supply constraints are disregarded and the cost structure favors the high‐quality product, a firm should offer only the high quality product. However, we prove that the firm may benefit from including a lower quality product in its product‐line when capacity is scarce. Interestingly, in this case, firms offer more product variants because of the supply constraint. As opposed to the findings in the literature (that ignore capacity constraints), we find that more intense competition may result in a product‐line policy change for the firm when the supply capacity is limited. We show that for intermediate capacity levels, whereas the margin per unit capacity effect dominates in a less competitive market, proliferation and cannibalization effects dominate in a more competitive market. In particular, when there is an increasing cost‐to‐quality ratio, increasing competition forces the firm to drop the product with better margin per unit capacity, and when there is a decreasing cost‐to‐quality ratio, increasing competition forces the firm to add the product with lower margin per unit capacity to its product‐line.
The rest of the article is organized as follows. The next section provides the literature review. Our model and the resulting equilibrium are presented in section . Section discusses the effects of competitive intensity on the product‐line choices of the firms. Our concluding remarks are presented in section .
Related Literature
Optimal product‐line design is an important and well‐studied problem in economics and marketing literatures. The stream of research on quality (vertical) differentiation was pioneered by Mussa and Rosen (1978). Moorthy (1984) was the first to introduce this framework into the marketing literature, and finds that a monopolist chooses inefficient quality levels due to cannibalization concerns. Bhargava and Choudhary (2001) discuss when it is optimal for a monopolist to offer vertically differentiated products (as opposed to selling a single product) depending on the cost‐to‐quality ratio of the products. Desai (2001) characterizes how differences in taste affect the impact of cannibalization on product‐line choice. We contribute to the above stream of articles by jointly considering both the supply and the demand side of product‐line management. None of these articles takes into account resource capacity constraints, which is the key driver of our results.
The oligopolistic Cournot (quantity) competition where firms offer vertically differentiated products is also a well‐studied problem. Gal‐Or (1983) finds that average quality decreases as the competition intensity increases, and Banker et al. (1998) finds the same result when firms are symmetric and quality improvement costs do not depend on the number of firms in the market. In contrast, we find that increasing competition intensity can result in a higher average quality due to the capacity constraint. De Fraja (1996) shows that an incumbent responds to market entry by reducing its product variety, while Johonson and Myatt (2003) find that, unless the demand model is such that marginal revenue is increasing in some regions, market entry never induces an incumbent to expand its product‐line. In our model, marginal revenue is decreasing everywhere, but we show that market entry can still lead to an incumbent to expand its product‐line because of the resource constraints. Different from these articles, we explicitly model the supply constraint, which leads to opposite results in some cases regarding the impact of competition on the product‐lines. Drivers of these results are discussed in detail in the article, but essentially this is because of how competition affects firms' capacity allocation.
We also contribute to the literature that consider coordination between marketing and operations decisions (Eliashberg and Steinberg 1993). Crittenden (1992) discusses the coordination between marketing and manufacturing and points that capacity allocation is the most critical issue the two functions need to address (p. 41). On the basis of her simulation studies, she suggests 18 rules for making capacity‐allocation decisions (e.g., prioritize the most profitable customers). Shapiro (1977) states that capacity planning is one of eight major issues that requires close cooperation between marketing and manufacturing. Finally, Lovelock (1984) provides qualitative capacity‐allocation prescriptions for a capacity‐constrained service organization that serves multiple customer segments. The closest example to our work is Monroe and Zoltners (1979), who study the pricing of a product‐line taking into account scarcity of resources. They argue that resource scarcity can be due to shortages in some raw materials. Similar to our article, the firm decides how to allocate the common resource among its products. However, unlike our article the demands of products are independent of each other, and, in addition, their discussion is restricted to a monopoly. Krajewski et al. (2010) explain how a firm's final production mix critically depends on its capacity through the measure of the unit margin per unit resource required to produce one unit of that product. However, unlike our article, they study a traditional firm where the market‐related parameters such as pricing and projected demand are determined by the marketing department and used as fixed inputs in the production‐related problems. Our aim is to understand the inefficiencies caused as a result of this sequential decision making and emphasize the importance of coordination at the product‐line design stage.
Our work is also related to the articles that study the effects of operational elements on a firm's product‐line (Ramdas 2003). Dobson and Yano (2002) consider a shared resource used for offering a product‐line similar to our setup, but their model is different from ours in that products have independent demands, so cannibalization is not a factor. Netessine and Taylor (2007) study the interplay between a firm's production technology (production to order vs. production to stock) and its vertically differentiated product‐line. Dobson and Kalish (1988), Chayet et al. (2009), and Yayla‐Kullu et al. (2011) consider a shared resource used for offering a product‐line similar to our setup. However, none of these articles investigates the simultaneous effects of multi‐product competition and operational capacity. With this article, we aim to contribute to the above literature by incorporating such a capacity constraint as well as the competitive influence.
In summary, in this article, we simultaneously study economic forces including product proliferation, cannibalization, resource utilization, and competition. These forces are all identified as “critically important” by their respective academic fields, that is, marketing, economics, and operations management. However, the existing literature lacks a study that investigates these forces in an integrated framework. In this article, we acknowledge the fact that each and every one of these forces is very important, and we identify conditions on costs, qualities, and resource limitations that favor each force. We further show that these conditions are affected by the level of competition in the marketplace.
Multi‐product Oligopoly with Capacity Constraints
In this section, we present the model and then discuss the resulting equilibrium. When presenting our model, first we describe the supply side, then we go over our demand model, and finally we discuss how we model the competition.
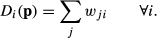
We consider n ≥ 1 (competing when n > 1) firms with limited capacities in the short to medium term. Index j:1..n indicates the firms. Each firm has the technological capability to offer multiple products. It can serve a subset of m products that have differing levels of quality. Index i:1..m indicates the products. Note that m could be an arbitrarily large number, which allows the firms to offer a large menu of offerings drawn from an arbitrarily fine grid of qualities as in Johnson and Myatt (2003, 2006). Different from the literature, each firm has a capacity of

Each unit of product i has quality


We adopt the classical vertical differentiation demand model (cf., Moorthy 1984, Mussa and Rosen 1978, Tirole 1988). The customers vary in their willingness to pay for quality. Specifically, the customer types θ are uniformly distributed in the unit interval [0,1] with unit total mass. Because the market size is normalized to 1 with this assumption, capacity parameter (


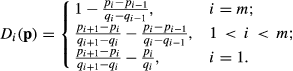
If the customer does not buy a product, her utility is zero. Thus, each customer has multiple options, buying a product from the menu of offerings or not buying a product at all, and she chooses the one that maximizes her utility as in Bhargava and Choudhary 2001) and Johnson and Myatt ( 2003,2006). This yields


Note that price discrimination, product proliferation, and cannibalization are well‐known conflicting forces for a firm in such a vertically differentiated demand model (cf. Moorthy 1984, Mussa and Rosen 1978, Tirole 1988). Ignoring the capacity constraint and competitive interactions, if a firm offers a single product of high quality (product h), the sales would be equal to (


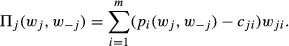
In this article, firms participate in a multi‐product quantity (Cournot) competition as in Johnson and Myatt (2003, 2006). Each firm j simultaneously decides how to allocate its capacity among the m product types. In particular, the firm decides how many units of each product to offer, that is,

Note that


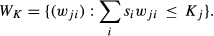
Let us also define the feasible product offerings for capacity

We look for a Nash equilibrium 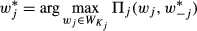

As


All proofs appear in the Appendix. This lemma shows that the most general form of the problem with asymmetric costs and asymmetric capacities is easily solvable. Following the literature, we will characterize our results using symmetric firms. However, we will complement these results with corollaries and numerical examples to show how they generalize to a wider range of parameters.
In the following, we characterize the Nash equilibrium in closed form when there are symmetric firms in the market, that is, all firms have the same capacity K, and they have access to the same production technology resulting in the same production costs

We also present our results for two product types, that is, m = 2. Index i:h,l indicates the high‐ and the low‐quality products, respectively. Keeping the product set with two variants makes our analysis tractable, allowing us to focus on our key research question and characterize the impact of capacity constraints on firms' product‐line choices under competition. Note again that following each result, we will present numerical examples to show how our results continue to hold with a greater number of product variants, and how these are contradicting to the existing literature. We define threshold capacity levels

Propositions and describe the oligopolist firm's equilibrium product offerings when there is an increasing cost‐to‐quality ratio (i.e.,


Suppose If If if if If if if


With a single‐product setup, Jing (2006) defines a relative cost efficiency and show that the low‐quality firm may be the most profitable one due to costly production of higher quality products. In Proposition Part (1), we extend his result to a multi‐product competition case in the existence of capacity constraints. When there is enough relative cost efficiencies inherent in the low‐quality product (i.e.,
Parts (2) and (3) describe what happens when the maximum profit margin for the high‐quality product (i.e.,


When capacity constraint is disregarded, a firm would offer both product types in Proposition Parts (2) and (3) to benefit from price discrimination in both monopoly and oligopoly. In the presence of capacity constraints, there are two forces in play. The firm considers margin per unit capacity to maximize the profit it can generate with its limited capacity K, at the same time it aims to benefit from proliferation to maximize the surplus it can extract from the market. When the capacity is plenty compared with the market size (large K), proliferation effect dominates and the firm offers both product types, and this is consistent with the findings of studies that ignore the capacity constraints. In contrast, when the capacity is scarce (small K), margin per unit capacity effect dominates and the firm offers only the product type with the higher margin per unit capacity. In Part (2), this is product L and in Part (3), this is product H. We characterize the critical capacity thresholds


Moreover, both


Optimal Product Line Strategy
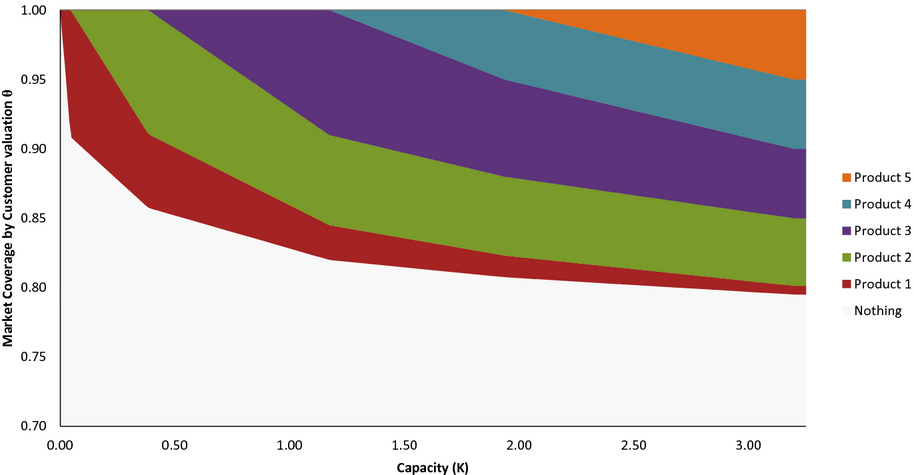
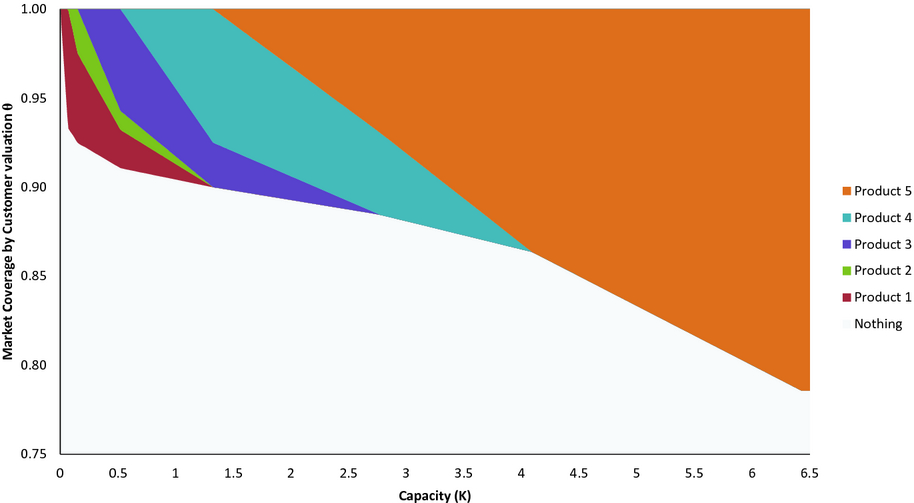
Next, we will present a multi‐product example for Proposition in Figure . We would like to show that the analytical results shown in the proposition continue to hold when there are more than two products. This example fits into Proposition Part (2) where the firm with very limited resources only offers a single product of lowest quality. Then, as the firm meets the capacity thresholds, it introduces the products one by one (based on their margin per unit capacity). Finally, only the firm with lots of resources could offer all of the products. Note that this example also satisfies Johnson and Myatt's (2003) “decreasing returns to quality” conditions. However, the example presents a situation under resource constraints. Then, it becomes a counterexample and shows that offering all products may not be the optimal strategy when supply limitations are taken into consideration. For example, when capacity‐to‐market size ratio (K) is 0.5, only the top 14.8% of the market (that is ordered by the customers' valuations for quality) choose to make purchases. Among these, the top 1.32% buy product 3, 8.58% in the middle buy product 2, and the lower 4.90% buy product 1.
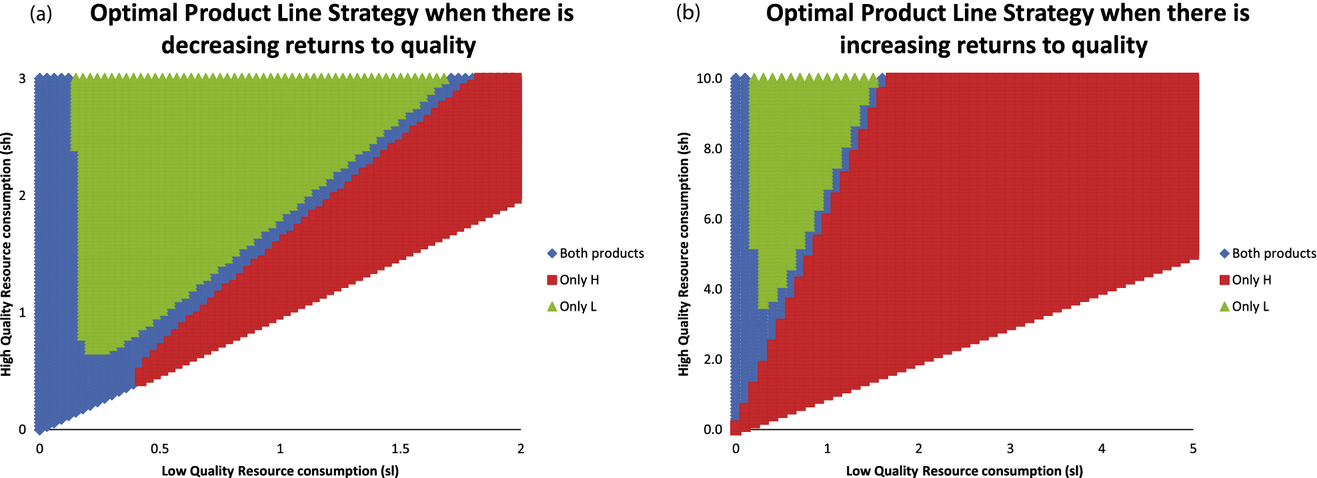
Optimal Product Mix When There Are Decreasing Returns to Quality
Next, we will discuss how the traditional practice would be outperformed in profits by the propositions presented in this article. Imagine a traditional firm where the marketing and operations departments make sequential decisions. In this example, the marketing department will determine the product line and prices following Johnson and Myatt (2003). Sequentially, the operations department will determine the final product mix following the bottleneck‐based production scheduling, as that takes margin per unit capacity into account (Krajewski et al. 2010). The first row of Table shows the prices (


Comparison of the Optimal Solution Discussed in This Paper with the Traditional Practice When There Are Decreasing Returns to Quality


So far we have described the equilibrium when there is an increasing cost‐to‐quality ratio (i.e., 

Suppose If if if if If 


In this case, when the capacity constraint is disregarded, a firm would offer only product H to avoid cannibalization within its products both in monopoly and oligopoly. With capacity constraints, the firm also considers margin per unit capacity 

In contrast, in Part (1), these two forces work in opposite directions, as margin per unit capacity favors product L, whereas the cannibalization effect favors product H. The equilibrium can result in all three possible options (sell only low‐quality, only high‐quality, or both products). When the capacity is large, the cannibalization effect dominates, and the firms sell only product H, which is in line with the studies in the literature that ignore capacity constraints. At the other extreme, when the capacity is low compared to the market size, the margin per unit capacity effect dominates and the firms sell only product L. Finally, for intermediate capacities the firms sell both product types.
The implications of margin per unit capacity (represented by the changes in the resource consumption parameters) for Proposition can be visualized in Figure b. The parametric set also fits Johnson and Myatt's (2003) “increasing returns to quality” conditions (i.e., 
Similar to Figure , Figure presents a multi‐product example for Proposition . This example fits into Proposition Part (1) where the firm with very limited resources only offers a single product of lowest quality. As the resources increase, the firm introduces additional products one by one (based on their margin per unit capacity). When the firm reaches intermediate levels of capacity, it does not have to bear the burden of low‐price–low‐quality products and starts to drop them from its product line. Finally, only the firm with lots of resources have the luxury to focus on the highest quality product. Note that this example satisfies Johnson and Myatt's (2003) “increasing returns to quality” conditions. Then, the example becomes a counterexample and shows that focusing only on the high quality may not be the optimal strategy when resources are limited.
Optimal Product Mix When There Are Increasing Returns to Quality
The comparison to the existing literature is even more significant in this case. Like the previous proposition, imagine a traditional firm where the marketing and operations departments make sequential decisions. Following Johnson and Myatt (2003), the marketing department decides to focus on the highest quality product, and the final production is decided by the operations department, based on the capacity constraint. When the parameters are the same as in Figure and the capacity to market size ratio (K) is 0.4, the result of the sequential approach is presented in the first row of Table . The second row shows the result when the firm chooses to follow the integrated optimization method presented here. A simple comparison of the profits show that our integrated approach outperforms the existing literature by 293%.
Comparison of the Optimal Solution Discussed in This Article with the Traditional Practice When There Are Increasing Returns to Quality


In the following corollaries, we will present results of more general formulations considering asymmetric industries.
Proposition shows that capacity constraints can induce firms to sell more product variants. In the same spirit, the following corollary considers competition between firms with asymmetric capacities, and it shows that the firm with the smaller capacity can offer more product variants than the firm with the higher capacity. We define another constant 


Suppose 


Contrary to basic intuition, the corollary shows that the smaller firm offers more product variants than the larger firm. In the setting of the corollary, product L has a better margin per unit capacity, but it is not profitable to sell due to its cannibalization of product H when the capacity constraint is ignored. Thus, the larger firm sells exclusively product H to avoid cannibalization, whereas the smaller firm includes product L in its product line to benefit from its better margin per unit capacity.
In the following corollary, we show that similar counterintuitive results continue to hold when firms have more generalized cost structures. We define two cost thresholds (


Suppose 


Contrary to basic intuition, the corollary shows that the firm with higher costs offers more product variants than the other one. Note that, in this setting resource efficiency, as measured by the resource consumption‐to‐quality ratio (
Overall, in this section, we show that the oligopolist firm's product line depends critically on its capacity. The firm should carefully weigh the profit margins of the products with their corresponding resource consumptions. The margin per unit capacity is a key measure of production effectiveness, especially when the resources are scarce. For limited resource levels, the product that has the highest margin per unit capacity should be selected and offered in the market. This can either be a high‐ or low‐quality product. When the firm has sufficient resources, we confirm that the price discrimination and cannibalization forces continue to dominate the optimal short‐ to medium‐term product‐line decisions.
In this section, we study how capacity constraints together with the competitive forces affect the product mix offered in the market. We will compare the firm's product‐line in two market scenarios. The firm competes with (n − 1) firms in the first scenario (i.e, there are (n) symmetric firms in total), and it competes with (n) firms in the second scenario (i.e, there are (n + 1) symmetric firms in total). Note that in the second scenario, not only the total number of firms, but also the total supply capacity is greater than the first scenario, while the market size is the same (i.e., unit size).
The impact of increasing competition on the firm's product‐line has been studied extensively in the literature. However, we note that these studies have not considered capacity constraints. Johnson and Myatt (2003) studied a model where an incumbent faces entry and provided many examples from various industries including computers, airlines, and watches illustrating how incumbents react to market entry. They note that in some of these examples the incumbent expanded its product‐line, for example, adding a lower quality alternative. In some other examples, the incumbent pruned its product‐line and stopped selling some of its product variants. Johnson and Myatt (2003) explained these outcomes through differences in the marginal revenue functions. They concluded that when the marginal revenue is decreasing the incumbent never responds by expanding its product‐line. In our model, the marginal revenue is everywhere decreasing, but an incumbent can respond to entry by expanding its product‐line due to capacity constraints. Thus, we show that differences in capacity levels and the relations between the costs, qualities, and resource consumptions can also explain when an incumbent will expand or prune its product‐line upon a competitor's market entry.
Similar to Propositions and in , we describe the results for increasing and decreasing cost‐to‐quality cases (i.e., 

When When When (


Following our discussion of Proposition , recall that there are two forces at play in this case: margin per unit capacity (
How does a more intense competition alter this picture? Existence of more firms in the market decreases the benefit of proliferation, because of reduced market share due to competition. But, it also weakens the margin per unit capacity effect, as the total supply capacity also increases in the market. More firms contribute to increasing supply in the market, allowing the proliferation effect to dominate, which leads to the firm selling both product types (not only the product with better margin per unit capacity). Hence, the firm sells only the product with better margin per unit capacity in a less competitive market, and it sells both products in a more competitive market for intermediate capacities in Proposition . Note that for very large (small) capacity levels, the proliferation (margin per unit capacity) effect dominates in all cases, and they result in the same product mix.
The product with higher margin per unit capacity can be identified as the “upgrade” product using the terminology in the Johnson and Myatt (2003, 2006) studies. The “baseline” product in our case would be the other one. In a tight capacity environment, the firm would choose to focus only on the upgrade markets. However, with greater competition, a firm's individual output reduces. This relaxes the pressure of the capacity constraint. In that more competitive situation, the firm introduces the baseline product to the market as it relaxes the capacity constraints for the upgrade markets. Hence, the market observes a greater product variety due to increased competition.
We would also like to point out that the result presented in .2 holds true even when 
When 


Recall that the firms balance the margin per unit capacity and cannibalization effects in the decreasing cost‐to‐quality case (see the discussion of Proposition ). When the capacity constraint is not binding, the cannibalization effect dominates, and the firms offer only product H. Note that margin per unit capacity condition in Proposition favors product L as 
In Proposition , the average quality of a product sold is non‐decreasing in the number of competing firms, as a higher number of competing firms sell only product H and a fewer number of competing firms sell both products L and H. In other words, the competition intensity increases the average quality sold in this case. This is in contrast to Gal‐Or (1983) and Banker et al. (1998), who show that the average quality sold decreases with the intensity of competition. In this case, the firms seeking efficient resource utilization sell product L in addition to product H, which reduces the average quality. However, increasing competitive intensity increases the demand‐side concerns, allowing the cannibalization effect to dominate, which favors product H. Thus, increasing competition induces firms to sell only product H, resulting in a higher average quality.
Overall, Propositions and characterize when increasing competition induces a firm to expand or prune its product‐line, and the factors that characterize the outcome are the relationships between the costs, qualities, and resource consumptions of the products. Note also that the capacity constraint is the key driver of these results: When capacity constraint is disregarded (i.e., unlimited capacity), the optimal product‐line is independent of the degree of competition.
In this article, we study short‐ to medium‐term product‐line decisions in a competitive context jointly considering the trade‐offs in both the supply and the demand side. On the demand side, firms want to benefit from product proliferation and avoid cannibalization, while on the supply side, firms want to allocate their limited resources to products that generate the best bang for the buck, where selling one additional unit of a product leaves less resource capacity for other products.
Our results show that explicitly accounting for supply constraints leads to insights that differ significantly from the common intuition and assertions elsewhere in the literature, which disregards resource capacity constraints. Therefore, we conclude that failing to consider supply and demand dynamics simultaneously can lead to critically wrong product‐line decisions.
We note that there could be alternative ways of modeling the capacity constraints. Including a fixed cost of new product introduction could potentially affect our results. In that case, proliferation forces would be less powerful compared with cannibalization and margin per unit capacity effects. We have also extended the model to include the optimization of capacity choices. We found that all the results remain intact when the capacity investment costs are linear. We leave the investigation of polynomial capacity investment costs as a future research direction. For that case, we expect that the margin per unit capacity effects would be more powerful and dominate in a wider range of parameters.
Footnotes
1
Source: Bureau of Transportation Statistics.
2
HHI decreased from 52% to 36%.
3
Source: Aviation Explorer. 2011. “Aircraft seat maps and airline seating charts”.
4
While retrofitting an airplane model by modifying seat configurations may be easy, it is seldom possible to add more physical capacity to an existing airplane model.
5
Etihad Airways Airbus 340–600, the longest commercial aircraft in use, was done in 21 days by Lufthansa Technik (Source: Times of Malta. 2010. “Airbus first‐class cabin refurbished before schedule”.
6
Based on our interactions with Dr. John D. Kasarda, who is a guru in the aviation industry. He is considered the leading developer of the aerotropolis concept, which positions airports as 21st century drivers of business location and urban economic growth. (Source: Bloomberg Businessweek. August 20, 2007. “Home Is Where the Airport Is”.)
7
Note that Johnson and Myatt (2003) model the problem with only symmetric costs. Although in the follow‐up article, Johnson and Myatt (![]() ) generalize the model with firm‐specific costs (like we do here), the majority of their results are still presented with the symmetric costs assumption. Johnson and Myatt (2006) also mention that when firms have arbitrary costs, the implications on the product types are not clear (page 589, line 27).
) generalize the model with firm‐specific costs (like we do here), the majority of their results are still presented with the symmetric costs assumption. Johnson and Myatt (2006) also mention that when firms have arbitrary costs, the implications on the product types are not clear (page 589, line 27).
8
Uniform demand distribution assumption makes the analysis tractable, enabling us to keep our focus on the effects of capacity limitation on the product‐line choice and to derive our insights. Note that this is a common assumption in the literature when the analyses with more general distributions are intractable (cf. Johnson and Myatt ![]() , p. 594).
, p. 594).
9
There are a number of ways to measure customers' willingness to pay for quality. “Choice Modeling” is commonly used for such estimations. (Source: Daniel McFadden. “Economic Choices”. American Economic Review, Vol. 91, No. 3, 351–378, June 2001.)
10
11
Although operational definition of productivity requires outputs/inputs, we will follow the notation in the literature and keep it as cost/quality.
12
Note that Johnson and Myatt's (2003) “decreasing returns to quality” conditions (i.e., both ![]() ), although the formulation is more general with two stages to allow for strategic choices on page 594, with very similar assumptions to our study (when there are two products, two firms, with uniformly distributed customer valuations) the authors stated that in the equilibrium, the first stage is ignored by the firms, and in the second stage each firm produces both products. We show that these results are reversed when the capacity constraint is specifically modeled into the problem.
), although the formulation is more general with two stages to allow for strategic choices on page 594, with very similar assumptions to our study (when there are two products, two firms, with uniformly distributed customer valuations) the authors stated that in the equilibrium, the first stage is ignored by the firms, and in the second stage each firm produces both products. We show that these results are reversed when the capacity constraint is specifically modeled into the problem.
13
In these examples, there is a single firm in the market (n = 1), there are two products with high (type h) and low (type l) quality. In part a,
14
In this example, there is a single firm in the market (n = 1), there are five products (m = 5) and
15
Remember that the problem is normalized to unit market size. Hence, the demand is presented in percentages, and the profits should also be interpreted relatively.
16
Bhargava and Choudhary (2001) show on page 96 (Theorem 1) that the product proliferation would not be optimal when ![]() ) on page 761 (Proposition 5).
) on page 761 (Proposition 5).
17
In this example, there is a single firm in the market (n = 1), there are 5 products (m = 5) and