
Abstract
This study examines the strategic choices of two rival manufacturers between competition and coopetition. A complex relationship exists between these two firms, who manufacture substitutive products. In addition, each of these firms has an option to purchase (or sell) a key component from (or to) the other. We develop a benchmark competition model and two coopetition models in which the manufacturers compete for end‐customer demand while simultaneously collaborating on component production through wholesaling (wholesaling coopetition) or licensing (license coopetition). By comparing the equilibria of the competition model and two coopetition models, we find that the optimal strategy for coopetition is determined by not only the degree of product substitution but also the inter–firm power relationship in the negotiation of a cooperation contract (i.e., wholesale price and license fees) and the difference in production efficiency between the two manufacturers. Our research comprehensively examines how the external, relationship‐specific, and internal factors affect firms’ optimal strategy selection and suggests a broad set of decision outcomes. Our study provides important managerial implications that can be utilized as strategic guidance for firms to pursue coopetition in various business environments.
Introduction
In numerous industries, firms purchase components or raw materials from upstream suppliers while competing with these same suppliers in the downstream market. For example, in the smartphone market, Google supplies the Android system to other smartphone vendors such as Samsung and Huawei. In addition, Google launched Pixel to compete in the smartphone market (Gibbs 2016). Furthermore, despite being sworn rivals in the hybrid and electric vehicle (HEV) market, Ford has offered to license its electric vehicle technology to other automakers (Atiyeh 2015). In the pharmaceutical sector, Dr. Reddy's Laboratories, an Indian multinational pharmaceutical company, licensed and supplied its products to GlaxoSmithKline in various emerging markets to expand their market (Pitelis et al. 2015). This shift in the competitive paradigm has not exclusively occurred in the smartphone, automobile, and pharmaceutical industries. These types of relationships have become common in high‐tech industries such as PC, TV, and medical devices, which are characterized by short product life cycles, rapid technical advancement, high research and development (R&D) expenses, and fierce competition. These pressures often drive numerous firms to collaborate with their fiercest competitors on upstream activities such as R&D and production resources (Gnyawali and Park 2011, Mantovani and Ruiz‐Aliseda 2016).
With the rapid technological advancement and the development of emerging economies, firms have realized the importance of cooperation because of increasing pressure to integrate the global value chain that stems from a need for improved efficiency and productivity. In certain cases, legislative bodies have “forced” competitors to collaborate to achieve an efficient use of resources when doing so leads to improved economic welfare (Mariani 2007). Thus, the notion of competition has evolved to coopetition, which is a concept that refers to interdependence in which competition and cooperation simultaneously occur between two or more firms; however, each firm focuses on increasing the size of the total pie for division (Brandenburger and Nalebuff 1996, Mantovani and Ruiz‐Aliseda 2016).
A natural question that arises in these settings is whether the cooperation between rival firms is desirable from the perspectives of firms and consumers. Intuitively, the supplier benefits from a new revenue stream and the buyer will take advantage of reduced component costs and concentrate on its core operations. However, decisions concerning such a strategic engagement are more involved when it is embedded within a competitive relationship between market rivals. Supply chain cooperation enhances each firm's competitiveness through increased efficiency or an additional revenue stream; however, this strategy could have a negative implication when each firm competes for customer demand. In this case, cooperation might have adverse effects on the firms. To help firms make the optimal strategic decision, it is essential to have a comprehensive understanding of the fundamental economics that govern coopetitive relationships between competing firms. Should firms purchase from or supply key components to their primary market rivals? What is the optimal unit component price when supplying to or purchasing from a firm's rival? Should firms license their key technologies to fierce market rivals? How do these coopetitive relationships affect the firms and consumers?
To investigate these issues, we consider a complex relationship between two manufacturing firms who produce partially substitutable products and compete for end‐customer demand. The substitutable products (e.g., smartphones or tablet computers) require a key component (e.g., chips or displays) that can be manufactured by either of the two firms with different manufacturing costs. The manufacturers can produce the component in house, or they can purchase it from a market rival at a lower cost. Alternatively, a manufacturer can pay a fixed license fee plus a royalty based on a rate to its market rival to adopt the rival's technology for manufacturing the component at a lower cost. The scenario in which both manufacturers make the component in‐house is referred to as the competition model, and the cases in which one manufacturer opts to procure the component from or pay licensing fees to the rival manufacturer are referred to as the coopetition models. We seek to understand the dynamic relationship between the embedded competition and cooperation elements and how the strategic movement of coopetition affects individual firms’ operational decision and financial performance by analyzing the equilibriums of the competition and coopetition models and examining manufacturers’ pricing strategies and consequences of total sales and profitability.
This study makes several contributions. First, our research contributes to the coopetition literature by investigating production coopetition between two rival firms and filling a significant gap in the literature. This problem differs from conventional supply chain cooperation and/or outsourcing problems in which the cooperation and competition elements primarily concentrate on a vertical supplier–buyer relationship in the supply chain. In contrast, our study explores how interaction of horizontal market competition and vertical supply chain cooperation affects firms’ performance individually and collectively. This exploration enables us to derive the structured optimal solutions for the firms and enhances our understanding of the nature of coopetitive behavior by analyzing the dynamic relationship between the competing and cooperating forces. This study contributes to the continuing debates concerning the efficacy of coopetition (Brandenburger and Nalebuff 1996, Gnyawali and Madhavan 2001) and the role of an agentic or structural perspective in understanding the dynamics of simultaneous competition and cooperation for an inter–firm relationship (Dorn et al. 2016, Peng and Bourne 2009). Second, our analysis provides notable results that are new. For example, the optimal strategy for coopetition is determined by not only the intensity of market competition (Peng and Bourne 2009, Ritala 2012, Tsay and Agrawal 2000) but also the joint effect of external market characteristics, the power relationship between manufacturers in the negotiation of the cooperation contract (i.e., wholesale price and license fees) and the difference in production efficiency between them. By examining the coopetition effect on firms’ retail prices and individual and collective profits, we identify the decision region for stable and unstable coopetition.
The remainder of this study is organized as follows: after reviewing relevant studies in section 2, the Cournot competition, wholesaling coopetition (WC), and license coopetition (LC) models are presented in section 3. Section 4 examines the effect of coopetition on the retail prices and maximum profits of two manufacturing firms by comparing the equilibrium results of the three different models. Section 5 discusses the selection of a coopetition strategy. Section 6 extends the analysis to the asymmetric‐manufacturer case and the case of both partial and perfect substitutes, and examines their effect on the selection decision. Section 7 discusses the managerial relevance and insights of our research findings. Finally, we draw conclusions and provide suggestions for future studies in section 8.
Literature Review
Our study is related to several streams of research: competition, cooperation and coopetition. Numerous prior studies have been conducted concerning competition and cooperation. However, few studies have been conducted regarding coopetition, which is defined as a dyadic relationship involving firms’ simultaneous engagement in competition and cooperation (Bengtsson and Kock 2000, Brandenburger and Nalebuff 1996).
Why do firms cooperate with their rivals? Using game theory, Brandenburger and Nalebuff (1996) explain that coopetition embraces the logic that firms cooperate to increase their size of the business pie and then compete with each other to divide it. From resource dependence theory and the resource‐based view, firms can seek to improve the efficiency of their use of existing resources when serving their current market share or capturing a larger share (Dorn et al. 2016, Ritala 2012). Typical examples of this motive include the airline industry, in which alliances are often developed between rival airlines to gain efficiency benefits by sharing resources (Garrette et al. 2009, Oum et al. 2004). Bengtsson and Raza‐Ullah (2016) classify the drivers of coopetition into three categories: external, relationship‐specific, and internal. External drivers include environmental conditions and industrial characteristics that force firms to engage in coopetition (Bengtsson and Johansson 2014, Ritala 2012). Relationship‐specific drivers include partner and relationship characteristics that facilitate coopetition (Gnyawali and Park 2011, Peng and Bourne 2009). Internal drivers include specific motives, resources and capabilities that motivate firms to be proactive or reactive in pursuing coopetitive strategies (Ritala et al. 2014).
Since the seminal study conducted by D'Aspremont and Jacquemin (1988) concerning cooperative and non‐cooperative R&D, studies concerning coopetition have explored various management fields including innovation (e.g., Gnyawali and Park 2011, Ritala and Hurmelinna‐Laukkanen 2013), strategic alliances (e.g., Dussauge et al. 2000, Rai 2016), international business (e.g., Kim and Parkhe 2009), marketing (e.g., Bello et al. 2010, Luo et al. 2006) and supply chain management (e.g., Bakshi and Kleindorfer 2009, Wilhelm 2011). In addition, prior studies incorporated various levels of analysis including cross‐functional units at the intra‐firm level (e.g., Luo et al. 2006, Tsai 2002) or rival firms at the inter‐firm level (e.g., Garrette et al. 2009, Luo et al. 2016). This concept has been extended to networks at the intra‐network (e.g., Gnyawali et al. 2006, Schiavone and Simoni 2011) and inter‐network levels (e.g., Peng and Bourne 2009, Schiavone and Simoni 2011). Interestingly, few studies have analyzed coopetition at the production stage of the value chain.
Most of these studies adopt conceptual or empirical approaches such as case studies or surveys. Despite the call for game theory approaches by Brandenburger and Nalebuff (1996) in their study concerning coopetition, very few studies (Bakshi and Kleindorfer 2009; Carfì and Schiliro, 2012; Luo et al. 2016) have applied game theory to coopetitive decision problems. Bakshi and Kleindorfer (2009) analyze the choice of risk mitigation strategies by supply chain participants using the Harsanyi–Selten–Nash bargaining framework and determine that coopetition is superior to competition in the context of managing supply chain security. At the macroeconomic level, Carfì and Schiliro (2012) apply the complex construct of coopetition to address climate change challenges and demonstrate that a coopetitive strategy can deliver win–win solutions for participating countries that seek to implement green economies. At the microeconomic level, Luo et al. (2016) employ a game theory model to examine the role of coopetition in low‐carbon manufacturing and determine that coopetition is a viable strategy that can increase profits and reduce the firms’ total carbon emissions. Mantovani and Ruiz‐Aliseda (2016) develop a game theory model in which firms cooperate to enhance the quality of innovation ecosystems. They examine the advantages and disadvantages of coopetition strategies for participating firms and society. In contrast to these studies, we examine coopetition for production, which is an upstream supply chain activity, in the context of two manufacturers who produce substitutive products and can simultaneously engage in supplier–buyer cooperation and a licensing arrangement for one key component of their finished products.
More relevant to the setting of this work, Venkatesh et al. (2006) examine the optimal choice among three distribution strategies: sole entrant, co‐optor, or component supplier for proprietary component manufacturers (PCMs). The authors show that although each strategy has its unique domain of optimality, the co‐optor strategy, in which a PCM opts to sell to customers directly and to sell supplies to its competitor, is the most widely optimal for PCMs. Xu et al. (2010) extend the work of Venkatesh et al. (2006) by examining the effect of horizontal differentiation and capability advantage on the optimal choice of distribution strategy. The above two studies only adopt a PCM's perspective on whether to supply a proprietary component to be assembled in the competitor's end product. From the perspective of original equipment manufacturers (OEMs), Pun (2015) examines outsourcing decisions of two competing OEMs in which firms can outsource either to each other or to third‐party suppliers and finds that more cooperation between competitors can be harmful. Using a similar setting, Pun and Ghamat (2016) examine how competition affects component commonality and R&D joint‐venture decisions when outsourcing to competitors. Different from the above research, we use the concept of coopetition to examine how cooperation decisions between competitors affect firms and consumers. In addition, in contrast to the works of Venkatesh et al. (2006) and Xu et al. (2010), who model competition between PCM and OEM based on location, and the works of Pun (2015) and Pun and Ghamat (2016), who model competition based on price, we model the end market competition as quantity based.
The studies closest to ours are those of Wang et al. (2013) and Yang et al. (2017). Wang et al. (2013) adopt the Cournot competition model and use a similar setting. Different from their focus on a production outsourcing relationship between an OEM and a contract manufacturer, our research concentrates on the evaluation of the buyer–supplier coopetition strategy along with purely competition and licensing agreement strategies. Yang et al. (2017) also employ the concept of coopetition and the Cournot competition model to analyze the optimal distribution strategies for a supplier with limited supply capacity when selling to a competing buyer. Different from Yang et al. (2017) that consider an established supplier–buyer relationship and examine how the competition brought by supplier's direct‐selling channel affects their relationship and performances, we consider the case of an established market rivalry between two manufacturers and examine how cooperation in the form of wholesaling or licensing agreement affects market competition and consequential firm decisions and performance. In addition, different from both Wang et al. (2013) and Yang et al. (2017), who assume end‐market demand to be symmetric, we consider both symmetric and asymmetric cases in our analysis.
The Models and Equilibrium Analysis
The Model
We consider two competitive manufacturers who produce partially substitutable products and compete in the market. When making the products, the manufacturers incur two types of costs: a component cost and a product production cost. Prior to presenting the models, we introduce our notations in Table 1 as follows.
Notations
In alignment with prior studies (e.g., Shang et al. 2016, Wang et al. 2013, Yang et al. 2017), we use the following demand function:
This type of linear inverse demand function is commonly used in the economics, marketing, and operations fields to investigate product competition (Farahat and Perakis 2011, Wang et al. 2013, Yang et al. 2017). Each manufacturer's retail price decreases its production quantity and the competitor's production quantity. For this study, α represents the manufacturer's maximum retail price. β (β ≥ 0) is a parameter that is interpreted as the degree of product substitution of manufacturer j's product over that of manufacturer i. It measures the cross‐effect of the change in manufacturer i's product demand caused by a change in that of manufacturer j. A low value of β indicates a low degree of product substitution. If β = 0, it corresponds to the case of independent products and products are not substitutable. In contrast, a high value of β corresponds to the case of high degree of substitution. A high degree of product substitution often leads to more intense market competition (Qing et al. 2017, Wang et al. 2013).
We consider three models for the relationship between the two manufacturers (as illustrated in Figure 1): Cournot competition, wholesaling coopetition (WC), and license coopetition (LC). For the Cournot competition model, manufacturers produce their own component, and the two firms have a competitive relationship in which they compete in quantities by simultaneously choosing production quantities. Both firms are economically rational and act strategically to maximize profits based on their competitors’ decisions. For the WC model, manufacturer 2 purchases components from manufacturer 1; the two manufacturers compete in the downstream retail market but have a supplier–buyer cooperative relationship in the upstream component production. For the LC model, manufacturer 2 obtains a license from manufacturer 1 by paying a fixed licensing fee and royalty rate; the two manufacturers compete in the downstream retail market and have a cooperative relationship in the form of a license agreement for producing upstream components.
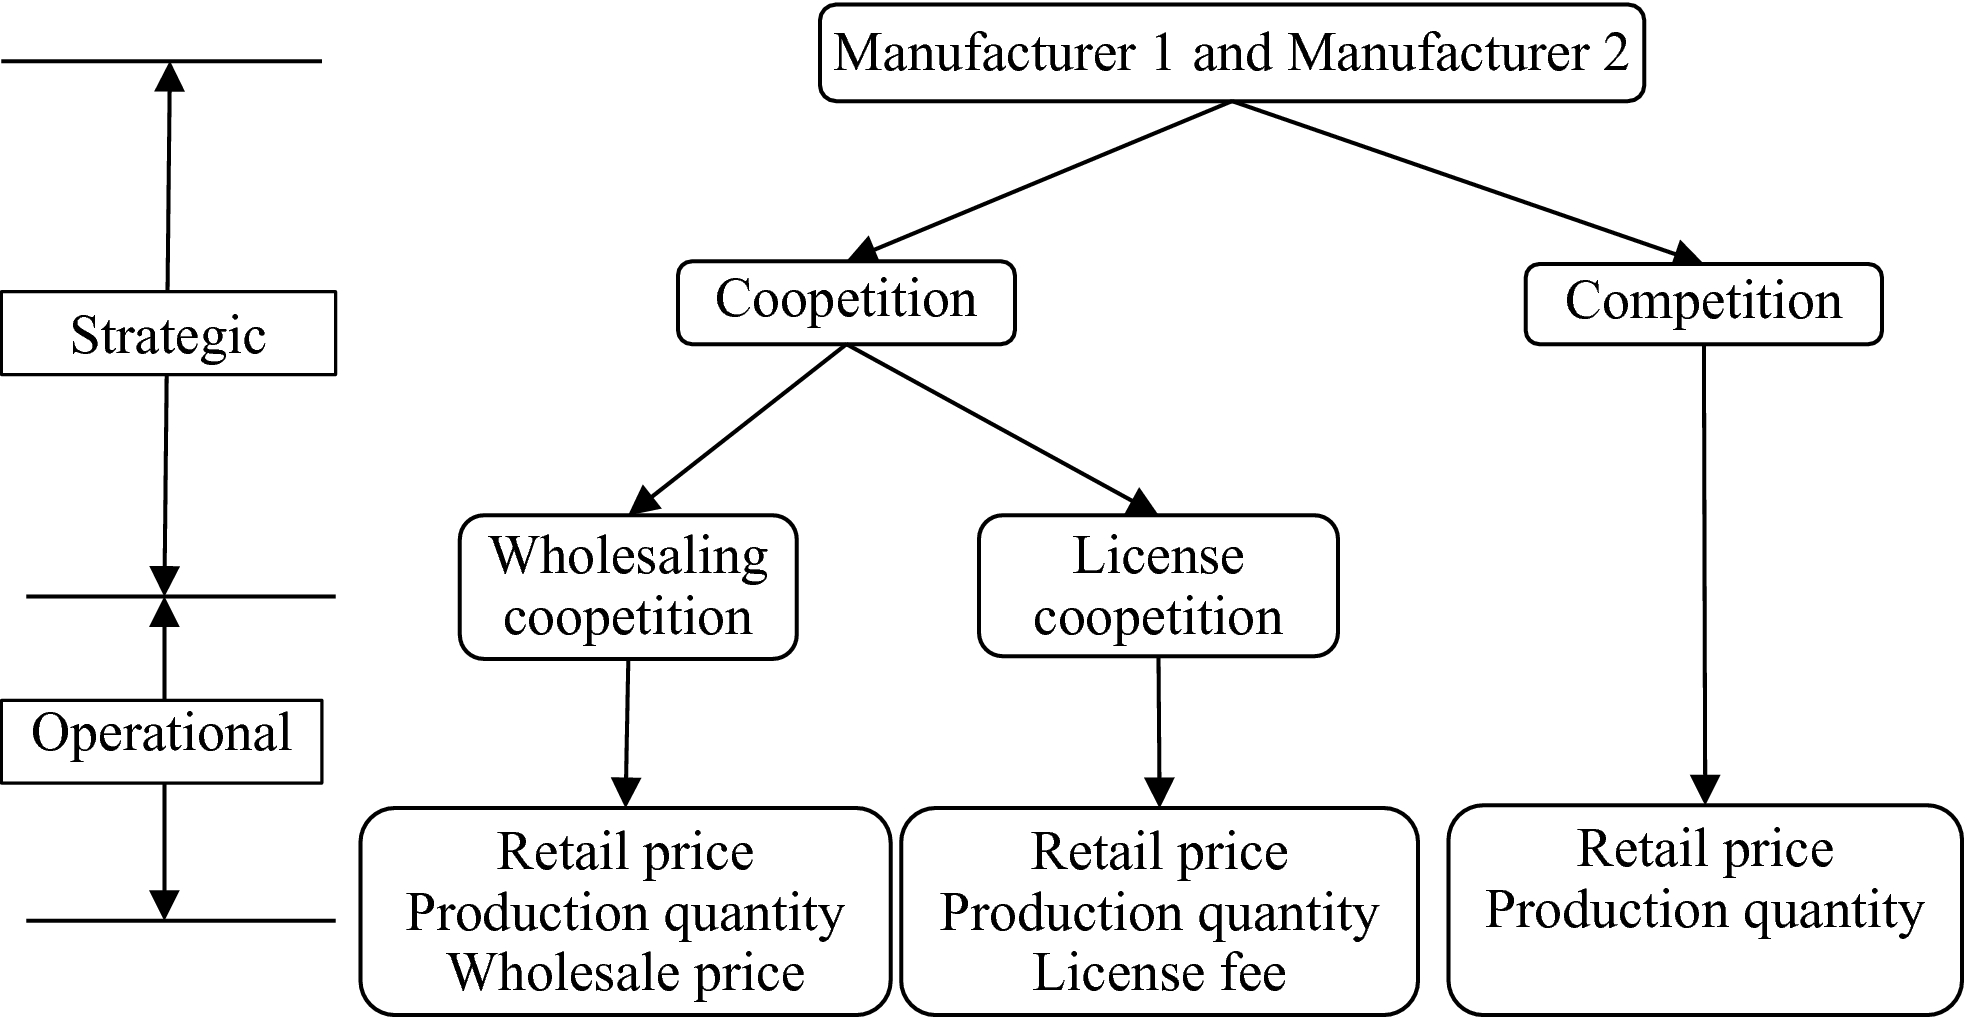
Framework
Competition Model
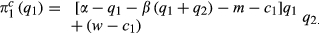
First, we explore the Cournot competition model as a benchmark so that we can compare the equilibria of the WC and LC models with the equilibria of the benchmark model to examine the effect of coopetition on manufacturers’ performance. In the competition model, the two manufacturers independently and simultaneously determine their production quantities to maximize their profits, and manufacturer 1's profit 

Similarly, for the competition model, manufacturer 2's profit 


where 
Optimal Solutions for the Three Models
By examining Table 2, we can derive the effect of the market competition on the manufacturers’ optimal retail prices and maximum profits. Here, we mainly focus on the effect of the degree of product substitution, β, a parameter that is associated to market competition (Qing et al. 2017, Wang et al. 2013).
(1), 


Lemma 1 indicates that for the competition model, a higher degree of production substitution (β) negatively affects manufacturers’ profitability, which is consistent with the classic economic theory that intense matket competition harms firms’ financial performance because such competition can lead to a price war between rival competitors. Surprisingly, whereas high degree of product substitution certainly drives down the retail price of manufacturer 2, the effect of β on manufacturer 1's optimal retail price is more complicated. This effect depends upon the relationship of β with a critical threshold β
N
, and the difference in the unit component cost between the two manufacturers (Δc) and its relationship with manufacturer 1's maximum unit profit 
Wholesaling Coopetition Model
For the WC model, a supplier–buyer cooperative relationship exists between the two rival manufacturers. Manufacturer 2 purchases components from manufacturer 1 while competing for the same market. It is common to have this type of relationship in the PC and electronics industries, in which manufacturers engage supplier–buyer cooperation and market competition simultaneously (Wang et al. 2013, Yang et al. 2017). Therefore, the two manufacturers’ decision sequence is described as follows. First, manufacturers negotiate the wholesale price (w) for the component. Second, manufacturer 2 decides its order quantity (q 2) for the component from manufacturer 1. Third, manufacturer 1 decides the production quantity q 1 + q 2, where q 1 represents manufacturer 1's demand. Finally, when the end‐consumers’ demand is realized, the two manufacturers obtain their revenue/profits accordingly.
For the WC model, manufacturer 1's profit 
Similarly, for the WC model, manufacturer 2's profit 

Following the literature (e.g., Chen et al. 2016, Nagarajan and Bassok 2008), we introduce parameter θ to measure the negotiation power of manufacturer 1. Correspondingly, the negotiation power of manufacturer 2 will be 1 − θ. With extreme negotiation powers, the bargaining over the wholesaling model is equivalent to the standard Stackelberg or Vertical Nash games. The wholesale price negotiation process for the WC model is as follows:
Manufacturer 1's optimal production quantity (


For the WC model, (1), 


This lemma indicates that the two manufacturers’ profits and manufacturer 2's retail price are decreasing functions of the degree of product substitution (β) for the WC model. This finding is similar to the competition model, which means that the buyer–supplier cooperation between the two competing manufacturers does not affect how the market competition factor impacts their financial performance. Different from the classic economic theory, the effect of the degree of product substitution on manufacturer 1's optimal retail price and component wholesale price is more complex for the WC model. Depending upon the relationship between β and β A and the relationships between θ and the corresponding critical thresholds (θ c and θ y ), manufacturer 1's optimal retail price can be an increasing or decreasing function of β. Similarly, depending upon the relationship between β and β C and the relationships between θ and the corresponding critical thresholds (θ c , θ s , and θ t ), manufacturer 1's optimal wholesale price can be a decreasing or increasing function of β because high degree of product substitution will drive both manufacturers’ retail prices down. At the same time, manufacturer 1 is able to set a higher wholesale price due to its possessing a greater negotiation power than that of manufacturer 2, and the revenue generated from component sales must be incorporated by manufacturer 1 in setting its optimal retail price. It implies that manufacturers must consider the inter–firm power relationship and market competition factor when deciding the wholesale prices for key components and setting retail prices for their products when engaging wholesale coopetition.
License Coopetition Model
For the LC model, a cooperative relationship exists in the form of a licensing arrangement between the two rival manufacturers. This type of relationship is common in the pharmaceutical and technological industries, in which a firm licenses its innovation to a potential competitor (Simonet 2002, Ziedonis 2007). In the context of this study, manufacturer 1 licenses manufacturer 2 to use its technology to produce the component while competing for the same market. Therefore, the two manufacturers’ decision sequence is described as follows. First, the manufacturers negotiate the fixed license fee (M) and the royalty rate (r) for the component. Second, the two manufacturers independently and simultaneously determine their production quantities to maximize their profits. Finally, when the end‐consumers’ demand is realized, the two manufacturers obtain their revenues and profits accordingly.
For the LC model, manufacturer 1's profit 

For the LC model, manufacturer 2's profit 

Assuming that manufacturer 1's negotiation power is θ, we can model the negotiation process of the licensing fees for the LC model as follows:


Similar to Lemma 2, we can derive Lemma 3 concerning the effect of β on the manufacturers’ optimal retail prices and maximum profits.
For the LC mode, (1) 


Similar to the WL model, the licensing cooperation does not change the effect of the degree of product substitution on the two manufacturers’ financial performance. Interestingly, Lemma 3 indicates that in the LC model, the optimal fixed license fee is a decreasing function of β, whereas the optimal royalty rate is an increasing function of β. A low fixed‐license fee helps break the ice of intense competition and engages the rival firms in the license cooperation. The royalty rate often constitutes the main part of the licensing agreement cost, and firms tend to charge a higher royalty rate when agreeing on licensing with their fiercest market rivals. Revenue (or cost) from the licensing agreement has a knock‐on effect on the optimal retail price of manufacturer 1 (or manufacturer 2). For manufacturer 1, the revenue from a licensing agreement mitigates the pressure of a decreasing retail price from the intense market competition. For manufacturer 2, the cost of the licensing agreement must be a factor of setting the optimal retail price. For example, the incremental licensing revenue has helped technology giant Nokia, which has licensing agreements with all major smartphone manufacturers to compensate for the declines from tough competition in the telecom market (Rogers 2018). The trade‐off between the cooperation and competition forces will determine how the two manufacturers’ optimal retail prices are influenced by the market competition factor. More specifically, the competition force overtakes the cooperation force in influencing two manufacturers’ pricing decisions when β is less than the threshold β X . In contrast, the cooperation force overtakes the competition force in influencing the pricing decisions when β is greater than the threshold β Y . When β is between the two thresholds (β X < β < β Y ), it affects the two manufacturers’ optimal retail prices differently, as illustrated in Lemma 3.
Effects of Coopetition
Effects of Wholesaling Coopetition
In this section, we examine the effect of the WC strategy on optimal retail prices and maximum profits for both manufacturers by comparing the derived equilibrium solutions for the Cournot competition model and the WC model.
Effect of Wholesaling Coopetition on Optimal Retail Prices
First, we present the effect of WC on manufacturers’ optimal retail prices.
If 0 < Δc < Δc
B
and θ
e
< θ < 1, then 


Lemma 4 implies that the wholesaling coopetition can drive up or down the prices of both manufacturers depending upon the differences in the unit component cost between manufacturers (Δc), manufacturer 1's negotiation power (θ) and their corresponding critical thresholds. More specifically, with a large value of Δc, wholesaling coopetition leads to a decrease of the optimal retail prices and therefore benefits the customers. With a small value of Δc, the effect of wholesaling coopetition on optimal retail prices is determined by other external market characteristics (i.e., β) and internal operational capability (i.e., δ 1).
Effect of Wholesaling Coopetition on Maximum Profits
Next, we explore the effect of WC on the manufacturers’ maximum profits.
If 0 < Δc < Δc
H
and When WC is a better strategy than competition is, if Δc
A
< Δc < Δc
H
and For the Pareto improvement WC strategy,


This proposition implies that whether the wholesaling coopetition increases or decreases the manufacturers’ maximum profits compared with the competition model is decided by the degree of product substitution (β), manufacturers’ negotiation power relationship (θ), and internal operational capabilities (Δc and δ 1). This relationship is illustrated in Figure 2, which is divided into three decision regions. The characteristics of each region are discussed next.
Effect of the WC Strategy on Manufacturers’ Profits [Color figure can be viewed at
Effects of License Coopetition
In this section, we examine the effect of the LC strategy on the optimal retail prices and maximum profits for both manufacturers by comparing the derived equilibrium solutions for the Cournot competition model and the LC model.
Effect of License Coopetition on Optimal Retail Prices
In the following, Lemma 5 presents the effect of LC on manufacturers’ optimal retail prices.
If 0 < Δc < Δc
Y
, then 


Lemma 5 implies that, similar to wholesale coopetition, license coopetition can drive up or down the optimal retail prices of both manufacturers compared with the competition model. Again, this finding shows the difference between coopetition and collusion from consumers’ point of view. Different from wholesale coopetition, the effect of license coopetition on the manufacturers’ optimal retail prices is predominantly determined by Δc, δ 1 and β; manufacturer 1's negotiation/bargaining power (θ) has no effect.
Effect of License Coopetition on Maximum Profits
To determine the effect of license coopetition on manufacturers’ maximum profits, we derive the total profit of both manufacturers in the LC model and compare it with that in the competition model. Therefore, we propose the following:
If 0 < Δc < Δc
H
and θ
j
< θ < 1, then LC is the better strategy; otherwise, competition is the better strategy. When LC is the better strategy, if Δc
P
< Δc < Δc
H
and For the Pareto improvement LC strategy,
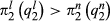


This proposition implies that whether the license coopetition is beneficial to the manufacturers is determined by the degree of product substitution (β), manufacturers’ negotiation power relationship (θ), and internal operational capabilities (Δc and δ 1). This relationship is further illustrated in Figure 3, which is divided into three decision regions. Similar to the WC model, each decision region is discussed individually.
Effect of the LC Strategy on Manufacturers’ Profits [Color figure can be viewed at
Selection of a Coopetition Strategy
In this section, we explore the optimal coopetition strategy considering different internal operational factors and external market circumstances. Proposition 3 summarizes the optimal strategy among competition, wholesaling coopetition and license coopetition.
If 0 < Δc < Δc
H
and θ
j
< θ < 1, then LC is the optimal strategy. If 0 < Δc < Δc
H
and Otherwise, competition is the optimal strategy.
7
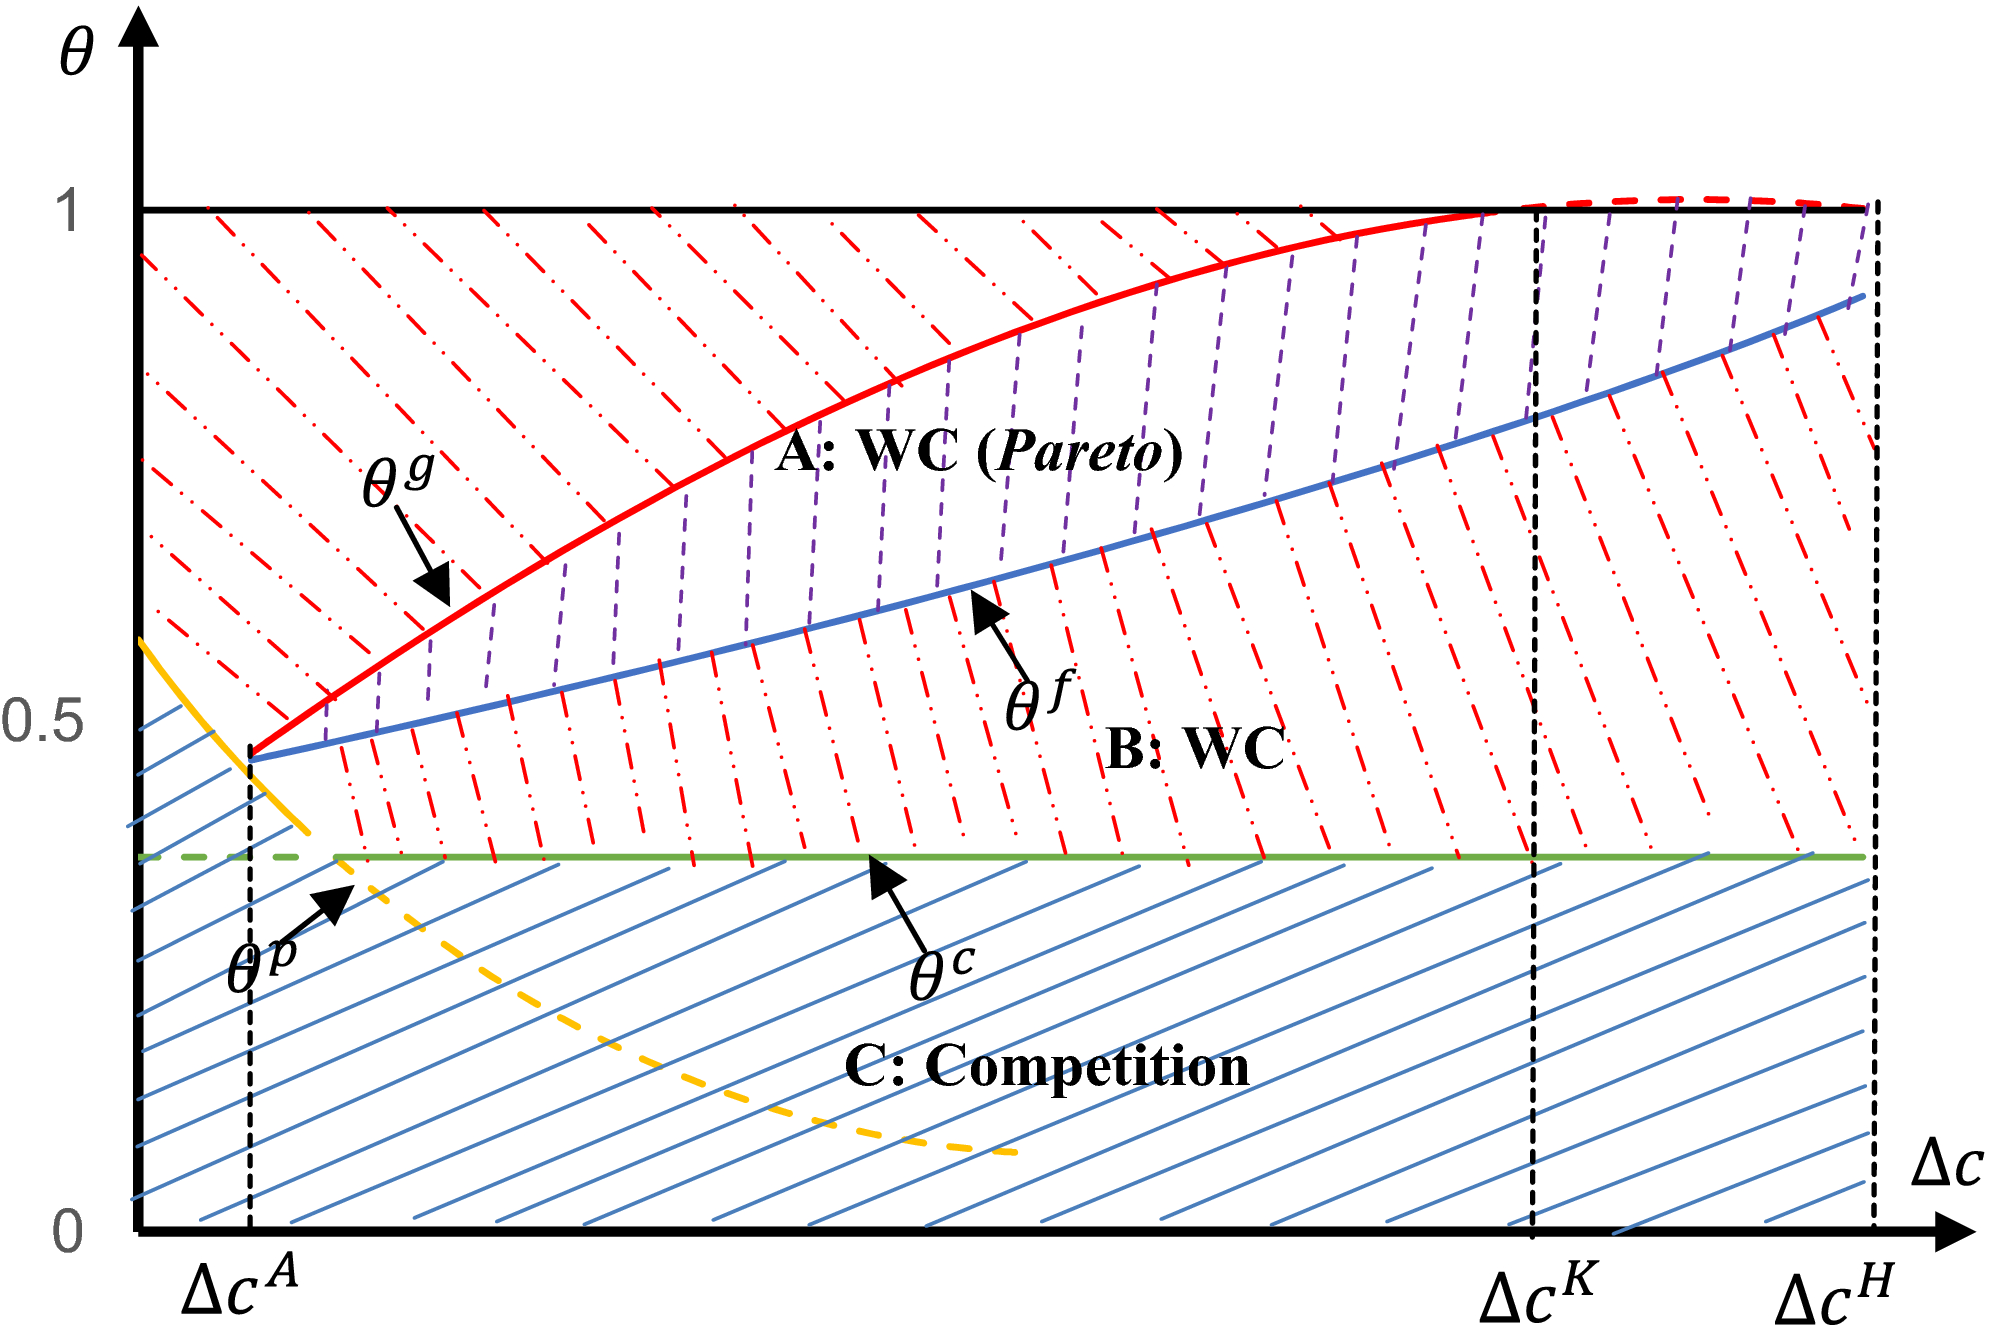
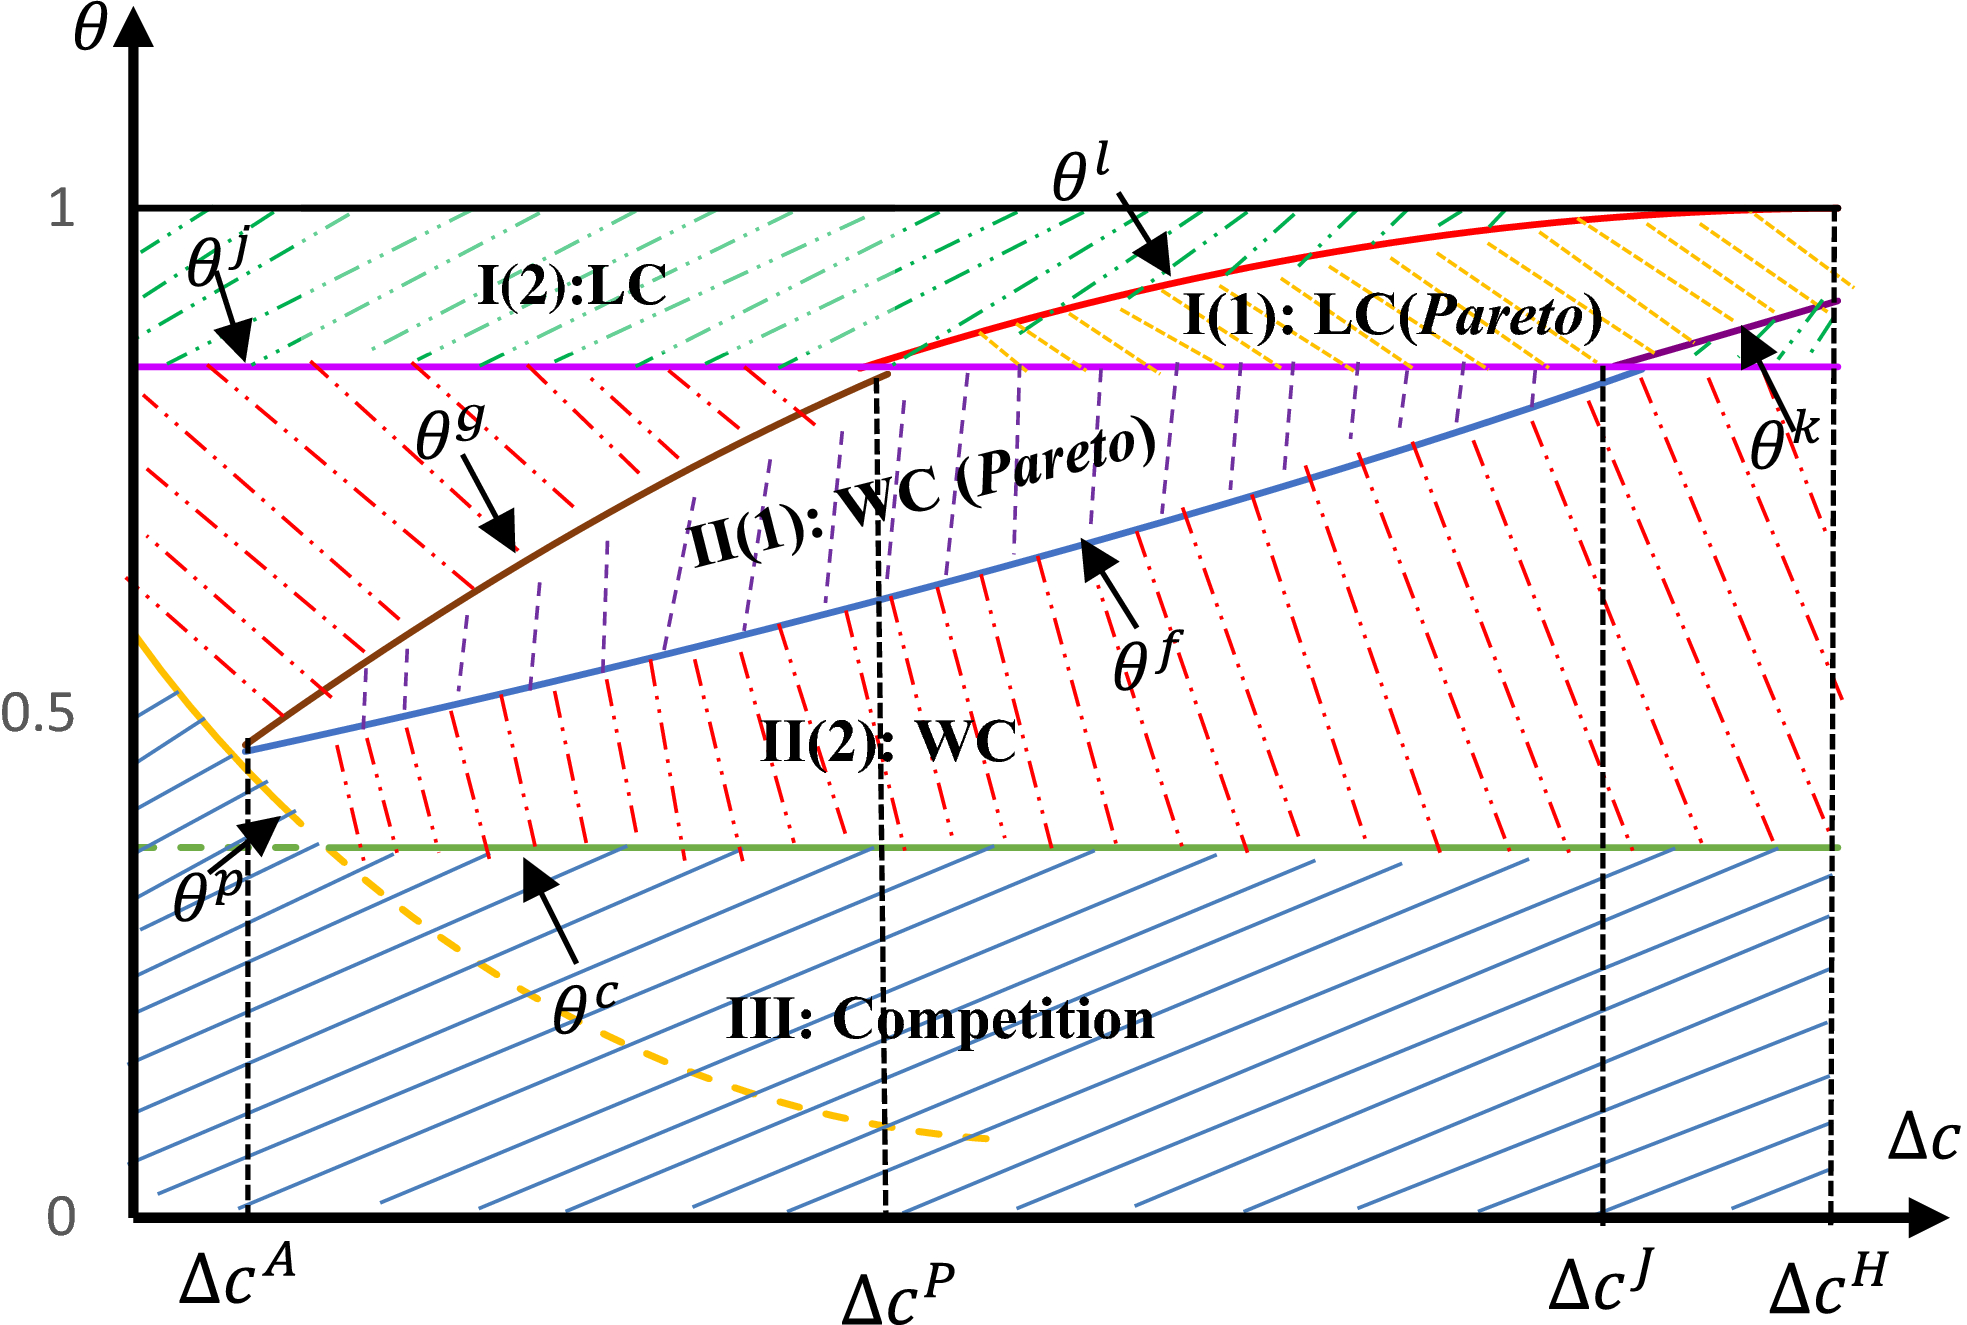
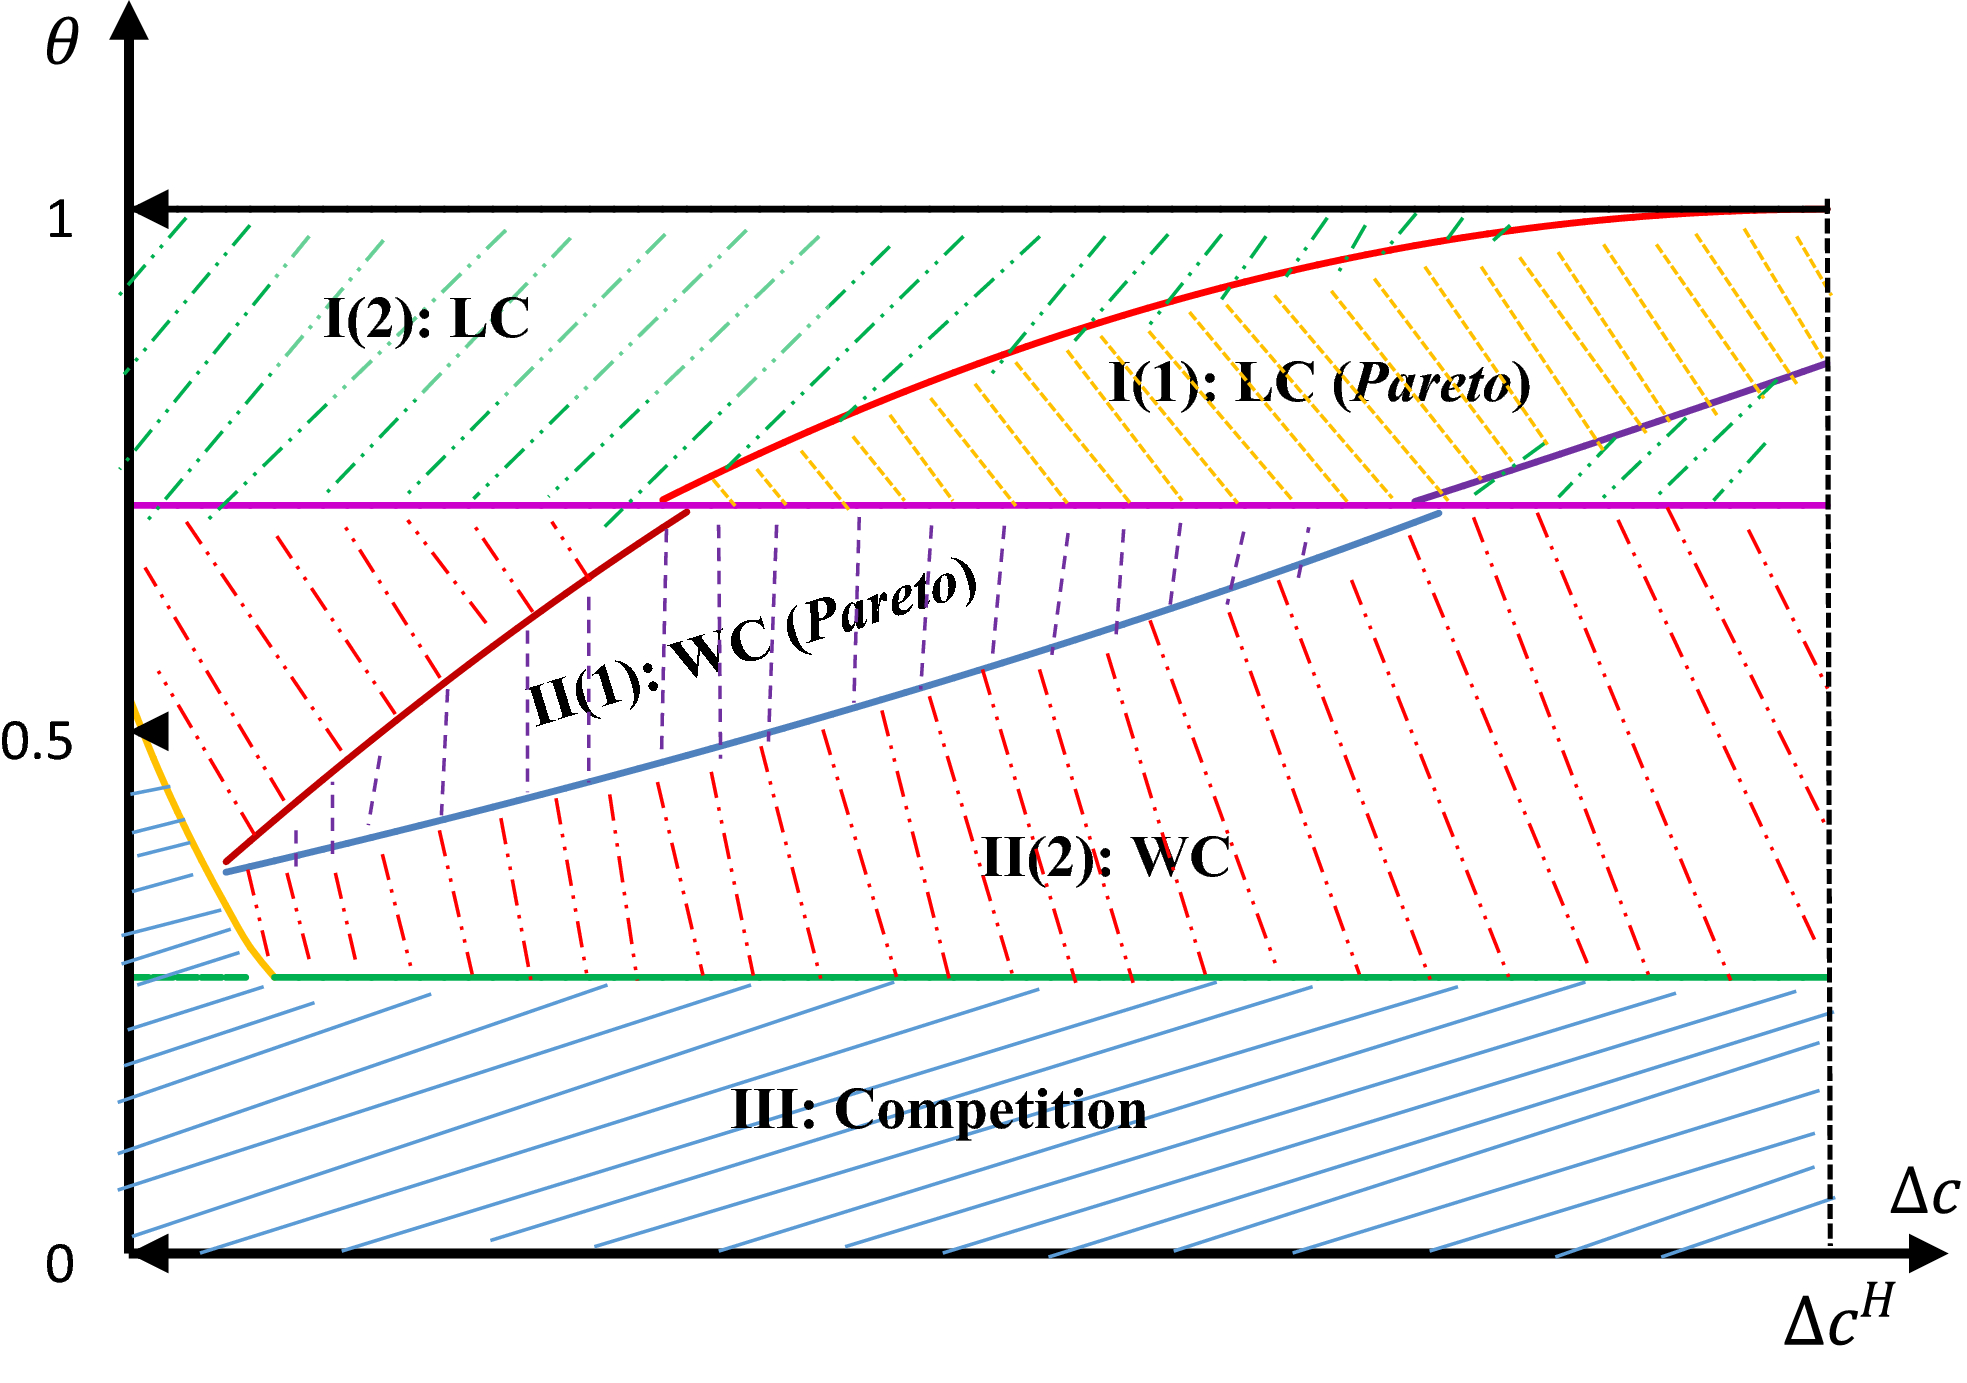
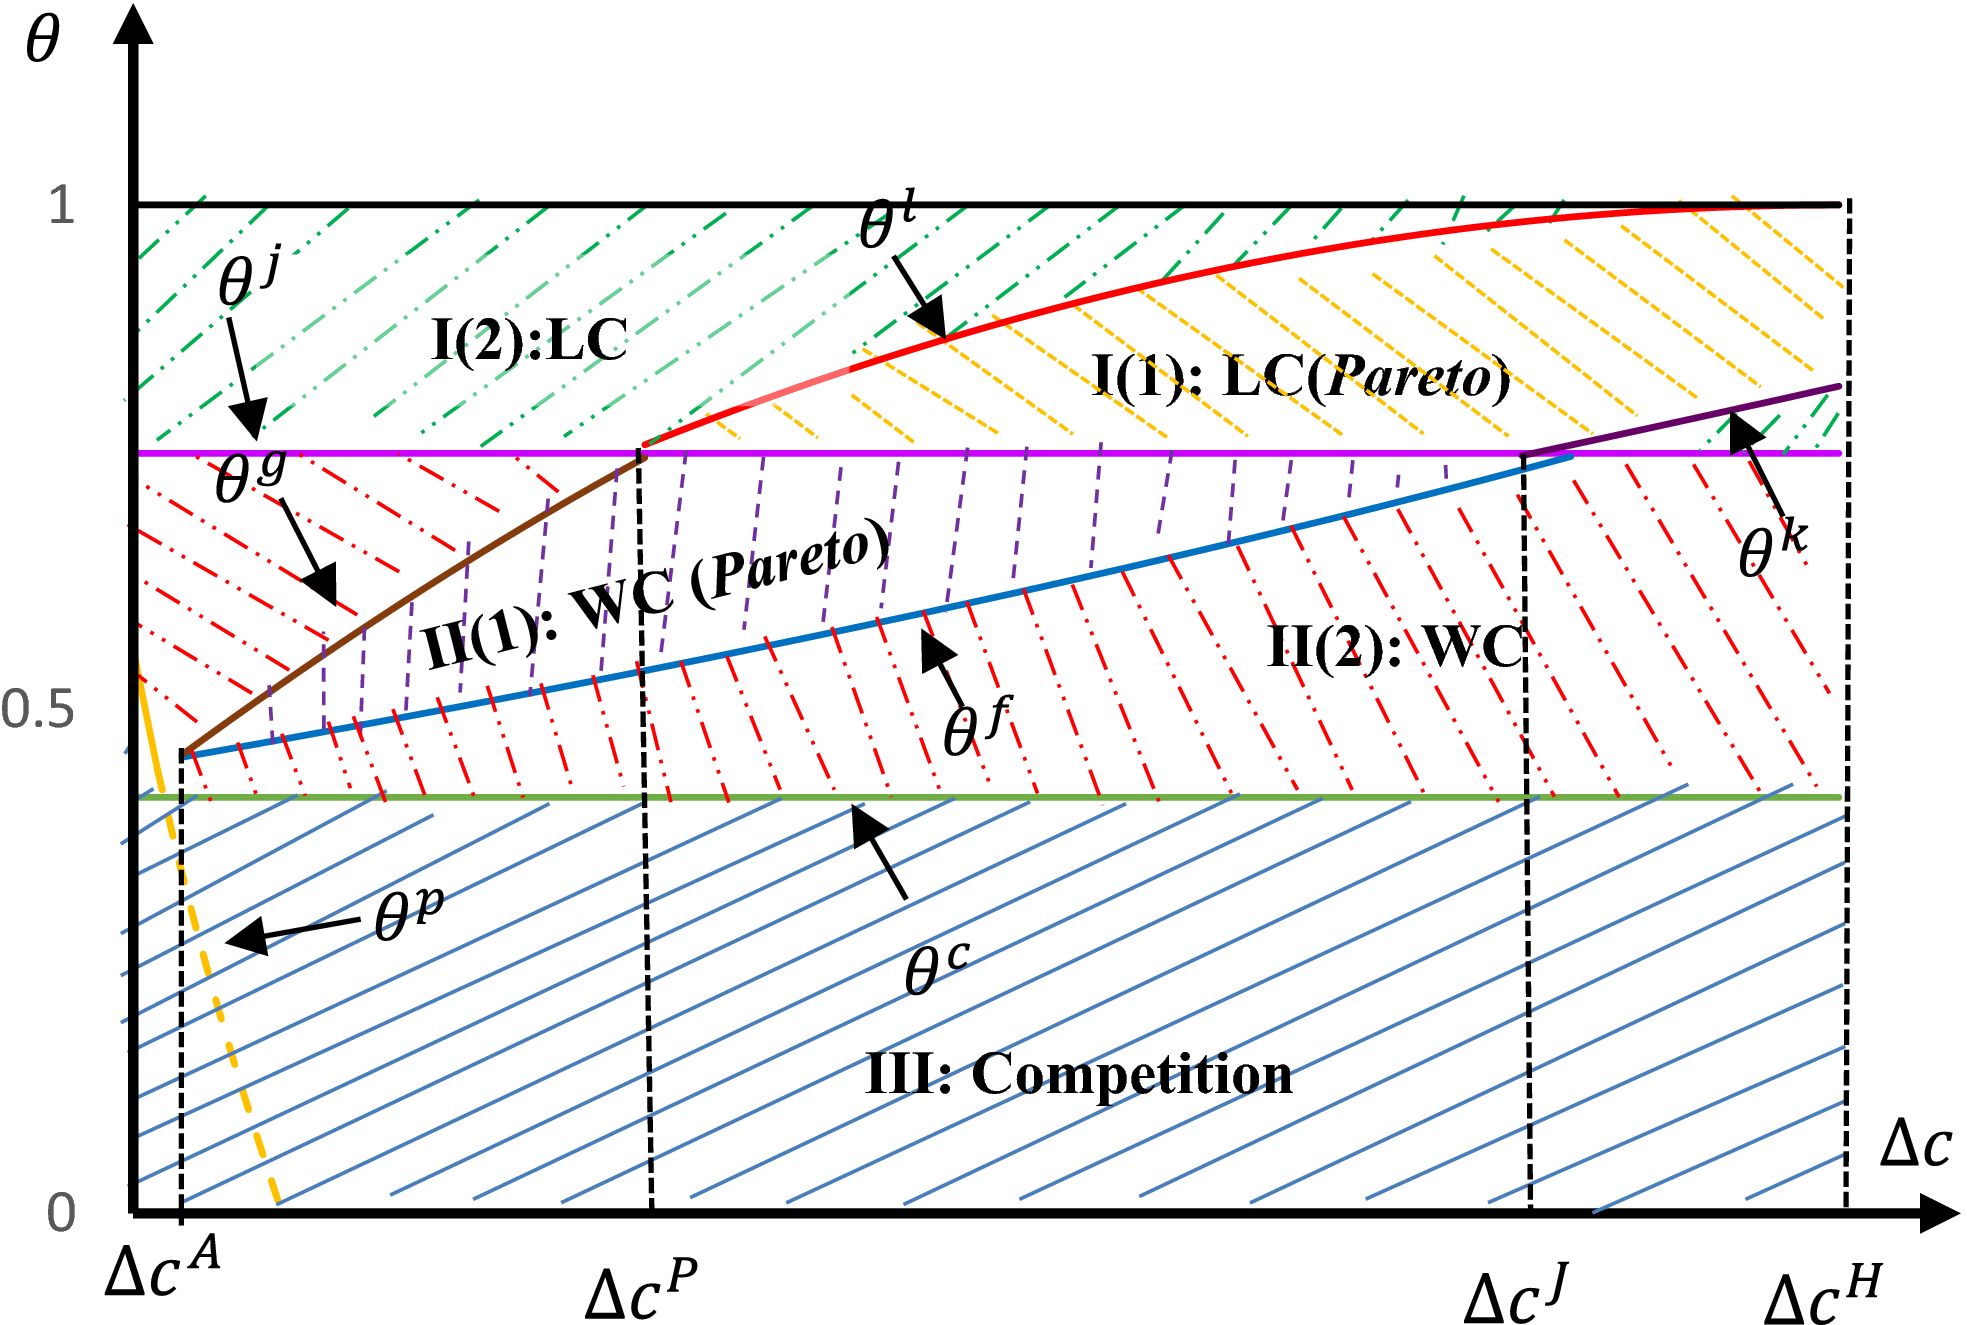
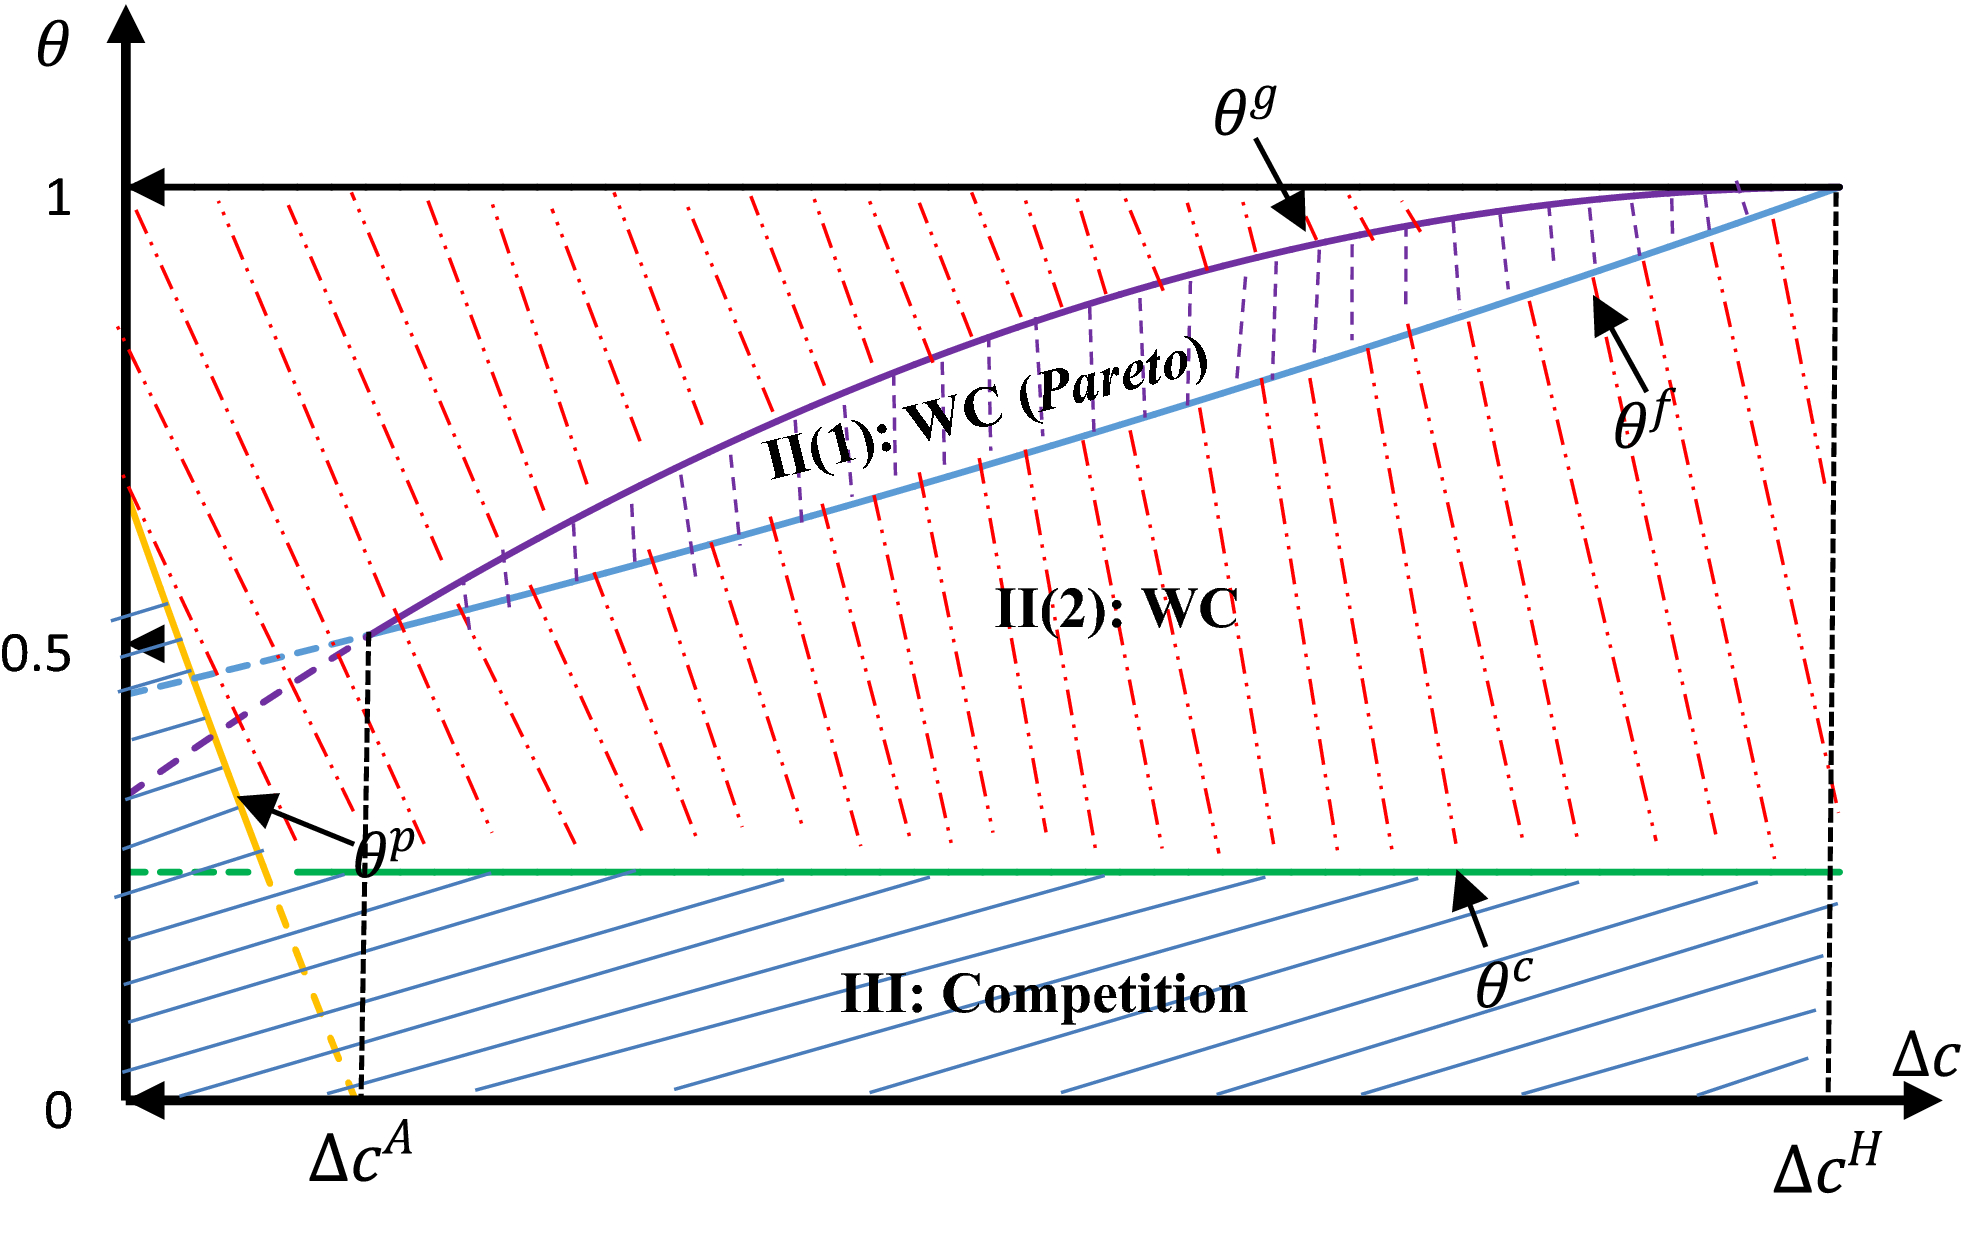
This proposition indicates that the optimal strategic decision on coopetition depends upon manufacturer 1's negotiation power (θ), the difference in the two manufacturers’ unit component cost (Δc), and their relationships with the corresponding thresholds (θ j , θ p , θ c and Δc H ). Note that these thresholds are determined by the maximum unit profit for manufacturer 1 (δ 1) and the degree of product substitution (β). This finding supports the view of Bengtsson and Raza‐Ullah (2016) that external, relationship‐specific, and internal drivers motivate firms to engage in coopetition. In the context of this research, the combination of the external market characteristic (β), inter–firm power relationship (θ), and internal operational resources and capabilities (Δc and δ 1) governs firms’ strategic decisions on coopetition. The relationship between these external, relationship‐specific, and internal factors and the manufacturers’ optimal strategy is further illustrated in Figure 4, which highlights three decision regions. Each region is discussed as follows:
Selection of Coopetition Strategies (θ, Δc) [Color figure can be viewed at
In
Effect of Product Substitution on Strategy Selection
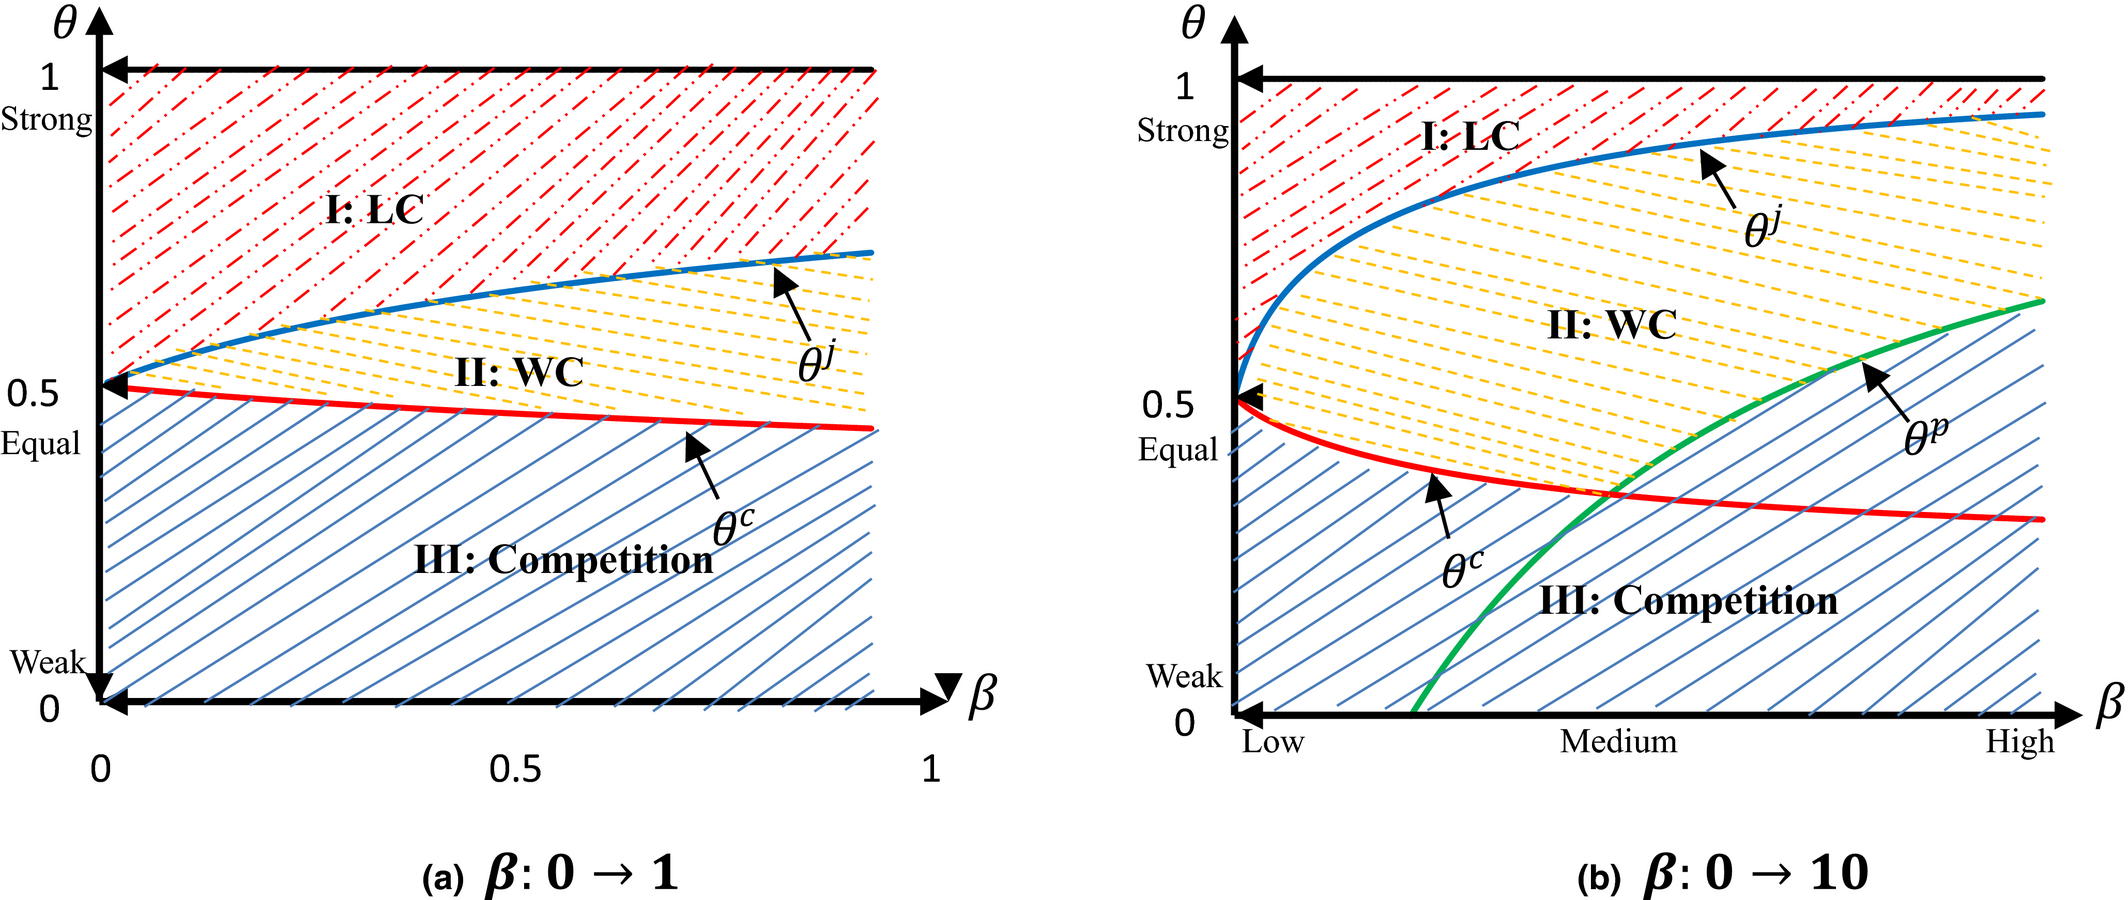
The results in Figure 4 show that although Δc has less influence on the selection of a coopetition strategy, Δc significantly affects whether the strategy can achieve Pareto improvement without further cooperation in both licensing and wholesaling coopetition. It is more likely to achieve a win–win outcome from coopetition if there is a large difference between the two manufacturers’ unit component costs. More importantly, the optimal strategic choice is primarily determined by the negotiation power of manufacturer 1 (θ). Furthermore, the degree of product substitution (β) affects those critical thresholds θ j and θ c upon which the decision regions of optimal coopetition strategy depend. Therefore, further analysis is performed to analyze how the external market competition (β) and relationship‐specific negotiation power (θ) affect the selection of the optimal coopetition strategy. Here, β depends upon the nature of the product/service and the characteristics of the industry, and θ is subject to the technical difficulty of component production and the availability of an alternative component supply in the market. We fix the value of Δc (i.e., Δc = 0.5) and plot the optimal strategic choice corresponding to different values of β and θ. We start the analysis with comparable values of β and θ {β, θ ∈ (0, 1)}, and the result is illustrated in Figure 5a. If there is a low level of market competition, firms will benefit more by engaging in license coopetition when manufacturer 1 has more negotiation power than does manufacturer 2; conversely, competition is the optimal strategy when manufacturer 1 has less negotiation power. If the market competition intensifies further, wholesale competition will be more beneficial when manufacturer 1 has more or similar power compared with manufacturer 2; otherwise, competition is the optimal strategy when manufacturer 1 has less power. From Figure 5a, it is also clear that only the two critical thresholds θ j and θ c , whose values depend upon β and θ, have influenced the decision on strategy selection. To further scrutinize the effect of the key parameters on coopetition strategy selection, we extend the value range of the degree of product substitution to β ∈ (0, 10); the analysis result is illustrated in Figure 5b.
Effect of β on Selection of Coopetition Strategies (Δc = 0.5) [Color figure can be viewed at
Figure 5b shows clearly that the external market attributes (i.e., β and θ) profoundly influence the strategic choice of coopetition. Although the result in Figure 5b mirrors that in Figure 5a when the degree of product substitution is low, it also shows that when the degree of product substitution increases further to higher levels, it is more beneficial to manufacturers to choose competition only unless manufacturer 1 has negotiation power superior to that of manufacturer 2. The licensing or wholesale coopetition strategy has often been adopted in the smartphone and electronic vehicle, in which there is often high degree of product substitution among rival firms. Our analysis result also shows that coopetition particularly licensing agreement can be beneficial to firms when the degree of product substitution is low. This finding partially explains that there are more licensing agreements between firms with low degree of product substitution and more wholesale cooperation between firms with high degree of product substitution (BBC 2014; Kang 2016, Nokia Corporation 2016). This result supports the views in the existing literature that, in highly competitive market environments where there are numerous rival firms offering substitutive products (Dussauge et al. 2000), or in a less competitive environment where there are only a limited number of competitors offering similar products (Peng and Bourne 2009), coopetition can be an effective strategy. However, the selection of optimal coopetition strategy (e.g., wholesale or license) is not only determined by the degree of product substitution and inter–firm power relationship but also influenced by the production capability difference, which will be further discussed in the following section.
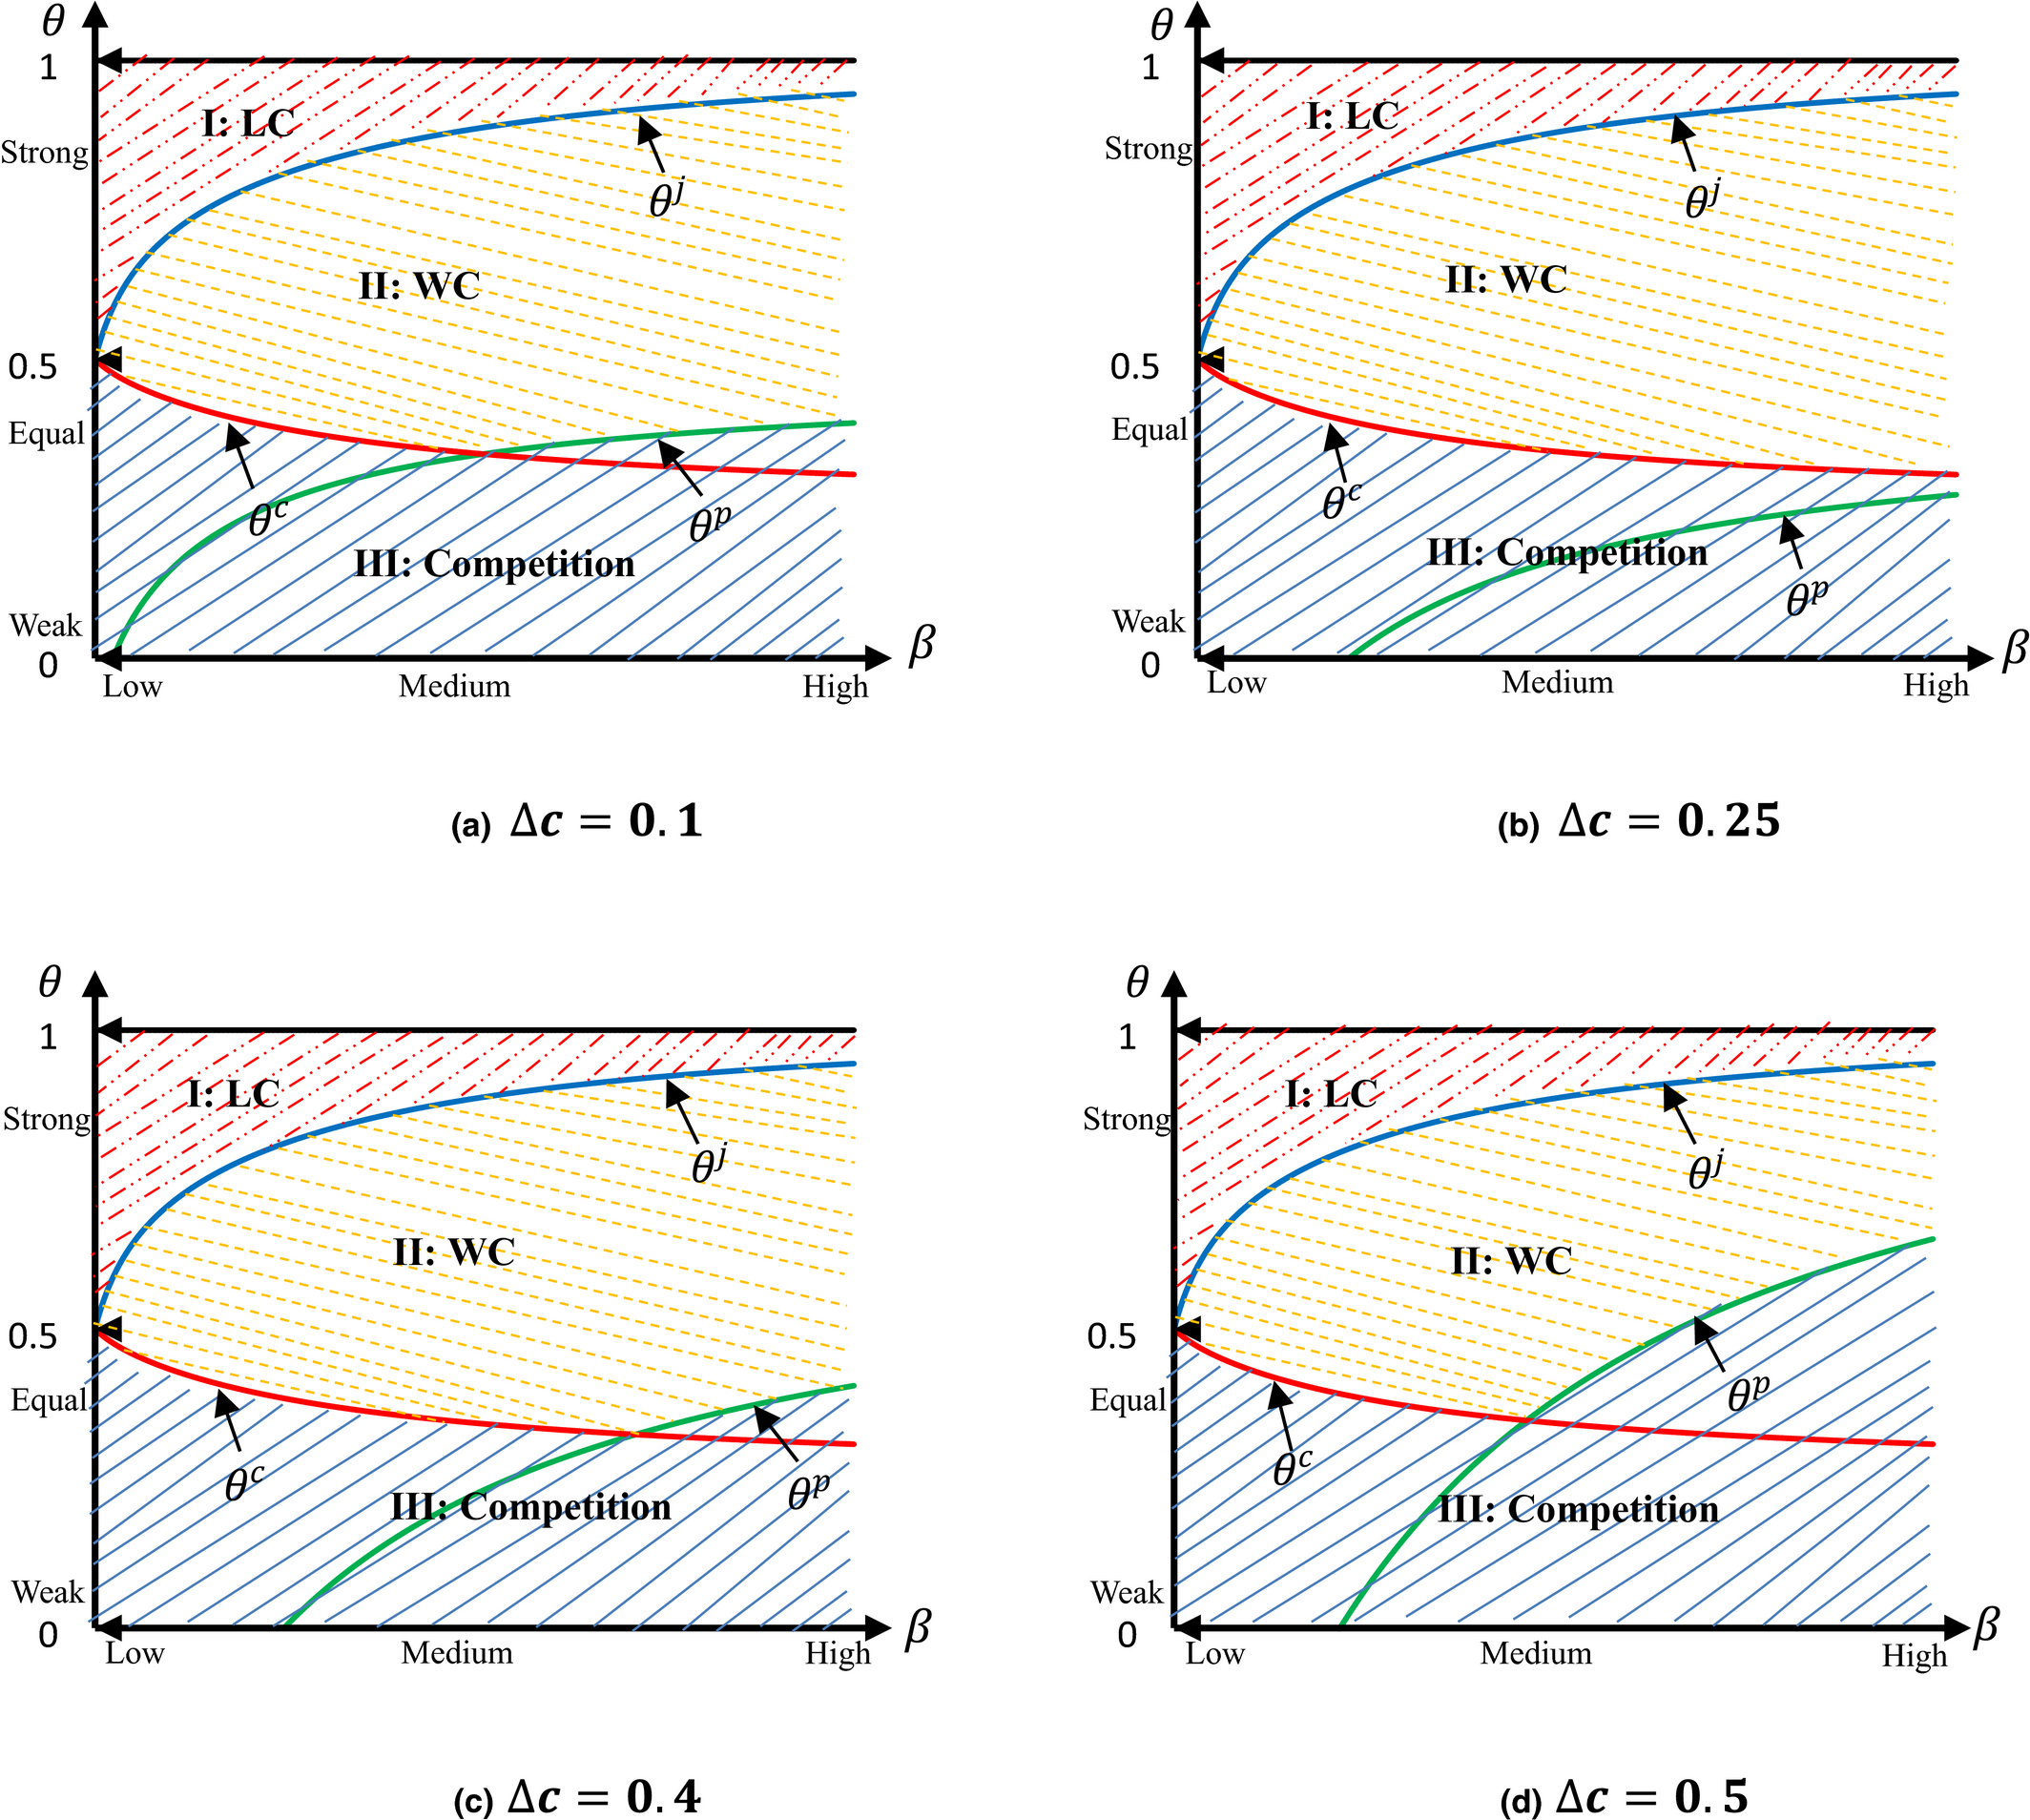
Effect of Component Cost Difference on Strategy Selection
The above results are based on the assumption of fixing the value of ∆c (i.e., ∆c = 0.5). However, as discussed previously, internal operational capability is one of the main drivers for firms to pursue a coopetition strategy. To examine the robustness of our results, further analysis is performed with a range of different values for ∆c (i.e., ∆c = 0.1, ∆c = 0.25, ∆c = 0.4, and ∆c = 0.5 8 ); the results are displayed in Figure 6. It is clear that ∆c only affects the strategic choice between competition and wholesaling coopetition; it does not affect the decision on license coopetition. Whether to pursue license coopetition is decided by the relationship between θ and the threshold θ j , which is dependent upon β. For instance, automakers, PC manufacturers, and pharmaceutical firms license technologies and patents to many other firms, but often not to their fiercest market rival, because of the market competition factor and their inter–firm relationship as discussed previously. The effect of Δc on strategy selection is primarily expressed through its influence on another critical threshold, θ p . Interestingly, we find that when the value of ∆c is small (i.e., ∆c = 0.1), a further increase of ∆c will move the intersection between the thresholds θ c and θ p rightwards, which means that wholesaling coopetition is more likely to be the preferred optimal strategy over competition. When the value of ∆c increases to a certain extent (i.e., ∆c = 0.25), θ c > θ p ; therefore, there is no intersection between the two thresholds. When the value of ∆c increases further (i.e., ∆c = 0.4 and ∆c = 0.5), the intersection between the two thresholds reappears and moves leftwards, which means competition is more likely to be the preferred optimal strategy over wholesale coopetition. These results reinforce the findings of Proposition 3 that the relationship between θ and θ p determines the strategic choice between wholesaling coopetition and competition when the value of ∆c is either small or large. In contrast, when the value of ∆c is in the middle, the same strategic choice is determined by the relationship between θ and θ c . Therefore, we can conclude that firms must incorporate the external market competition, inter–firm relationship characteristics and internal operational resources and capabilities to make an optimal strategic decision on coopetition.
Effect of Δc on Selection of Coopetition Strategies (β: 0 → 10) [Color figure can be viewed at
The Extended Models
The Asymmetric Case
In the previous sections, we assume a symmetric case in which α
1 = α
2 = α. Here, α
1 and α
2 represent the maximum retail prices of manufacturers 1 and 2, respectively. In this section, we consider the scenario in which α
1 ≠ α
2. Then, the demand function 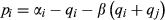
Optimal Solutions for the Three Models (α 1 ≠ α 2)
where 
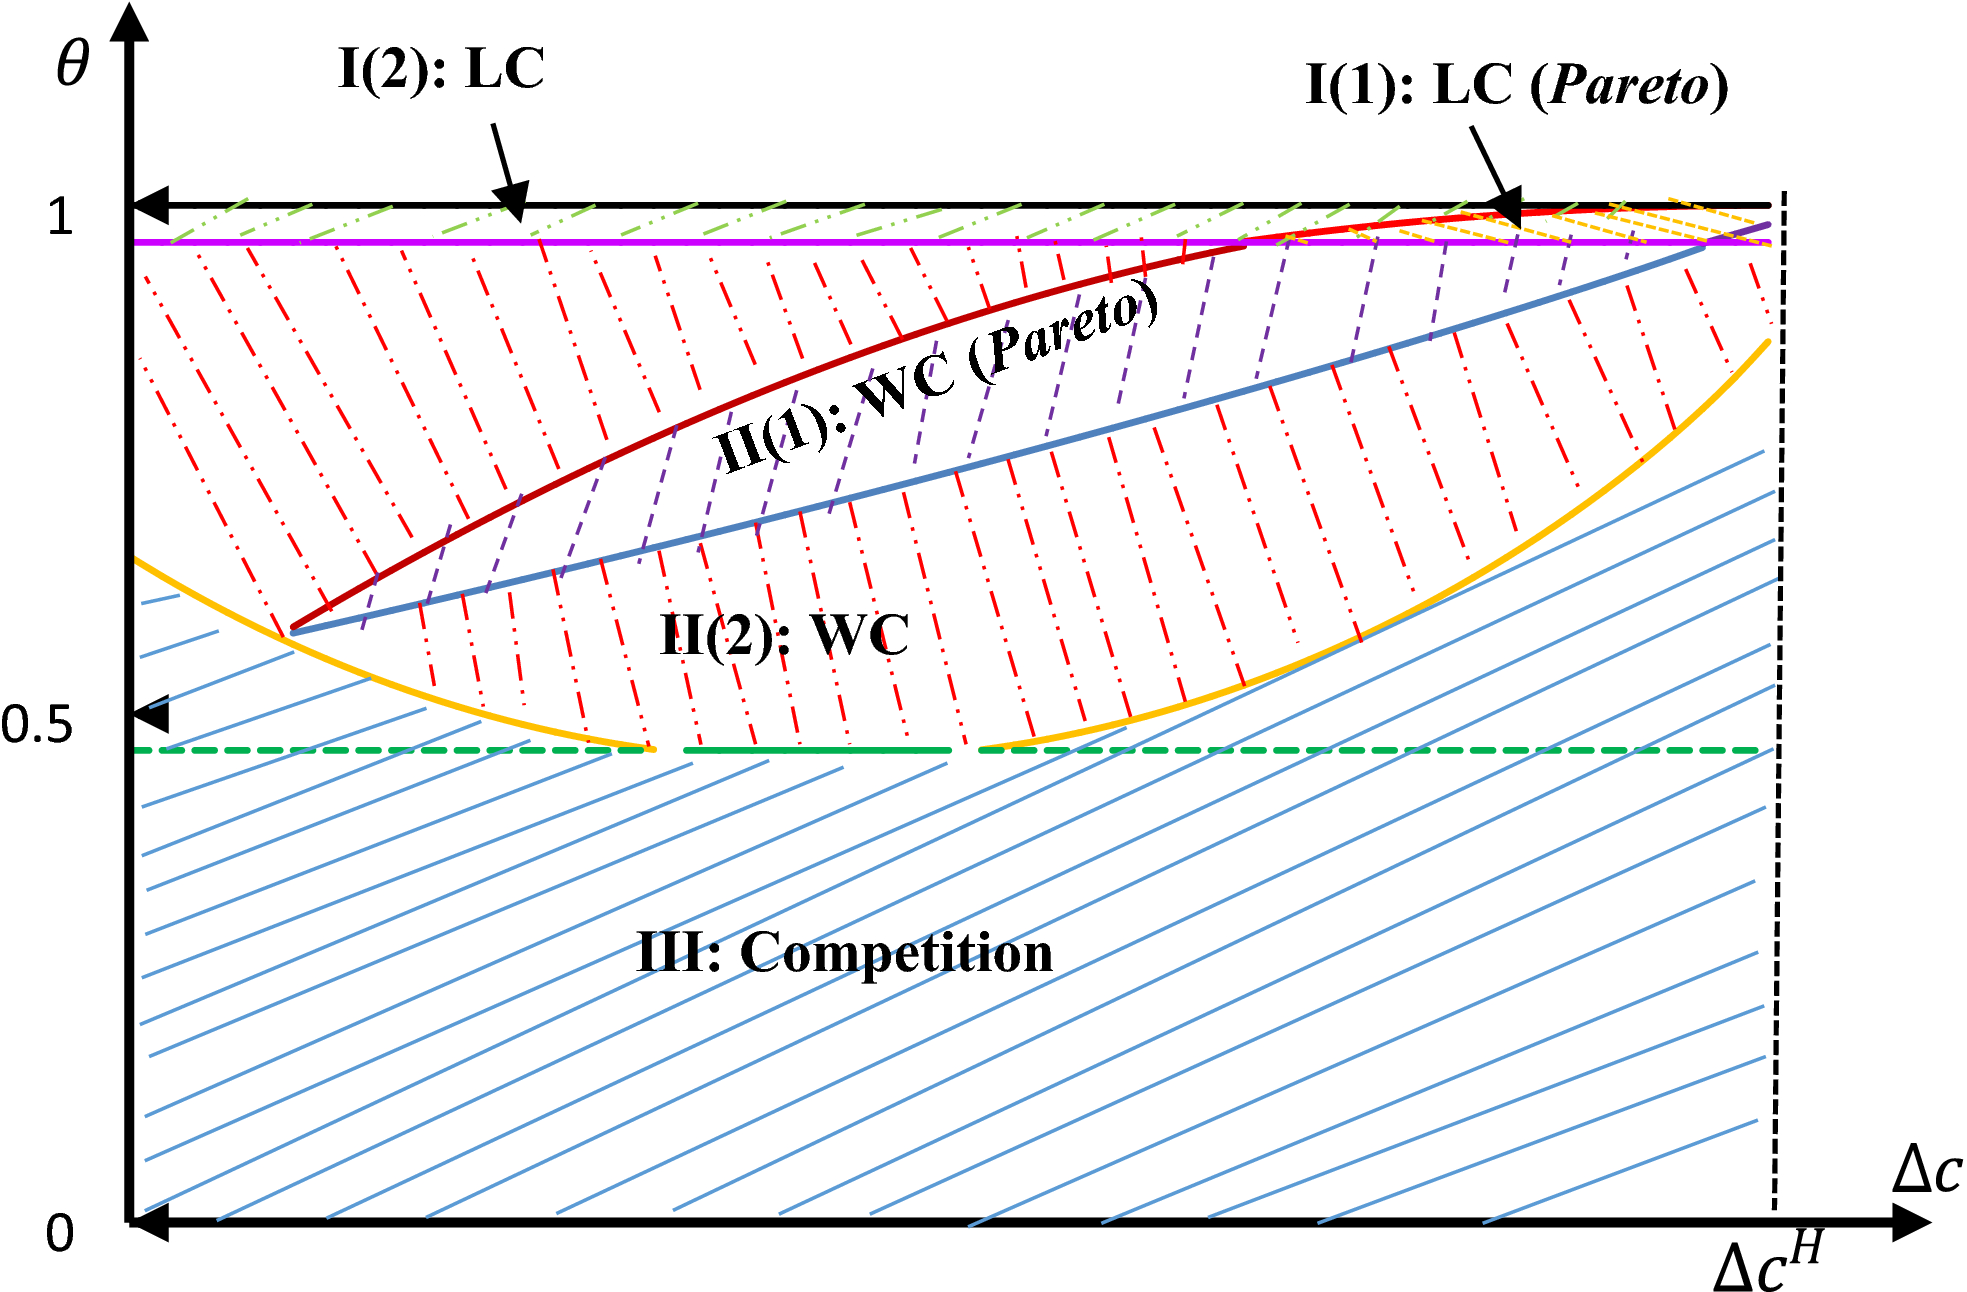
Comparing the optimal solutions in Table 3 to those in Table 2, it is clear that α 1, α 2 significantly affect manufacturers’ optimal operational decisions. Consequently, they will affect manufacturers’ profits in the competition, WC and LC models and the values of important critical thresholds that determine manufacturers’ optimal decision regions on coopetition strategy selection. Therefore, to verify whether the structural results presented in the symmetric case still hold in the asymmetric‐manufacturer case, a numerical example is provided here to demonstrate the effect of the asymmetric‐manufacturer case (i.e., α 1 ≠ α 2) on the selection of coopetition strategies. We assume that δ 1 = 1 and β = 4. In Figure 7, we specify that α 2 − α 1 = 0.1, which means that α 2 > α 1. In Figure 8, we specify that α 2 − α 1 = −0.1, which means that α 2 < α 1.
Selection of Coopetition Strategies (α
2 > α
1) [Color figure can be viewed at
Selection of Coopetition Strategies (α
2 < α
1) [Color figure can be viewed at
From Figures 7 and 8, we obtain that the structure of an optimal strategic decision on coopetition is similar to the scenario with the same maximum retail price for the two manufacturers. At the same time, the critical points are affected by the difference between the maximum retail prices of manufacturers (Δα). That is, a positive Δα results in a larger decision region for LC strategy and a smaller region for competition strategy; conversely, a negative Δα leads to a smaller decision region for LC strategy and a larger region for competition strategy. In other words, if manufacturer 1 has a higher maximum retailer price than manufacturer 2 does, it is less likely that license coopetition is the optimal strategic decision. Clearly, α 1, α 2 affect manufacturers’ optimal operational decisions (e.g., retail prices, wholesale price, fixed license fee, and royalty rate) and the values of important critical thresholds that influence manufacturers’ optimal decisions on coopetition strategy. Nevertheless, the structural results presented in the previous sections still hold when two manufacturers are asymmetric.
The Case of Both Partial and Perfect Substitutes
In this section, we extend the analysis of the partially substitutable products case to the case that includes the scenarios of partial and perfect substitutes. We adopt the demand function, p i = α − q i − βq j , i, j = 1, 2 and i ≠ j, 0 < β ≤ 1, that is used in Wang et al. (2013). Here, 0 < β < 1 corresponds to the scenario of partial substitutes, and the limiting value, β = 1, corresponds to the case of perfect substitutes. Based on the new demand function, the optimal solutions for the competition, WC and LC models are presented in Table 4.
Optimal Solutions for the Three Models for the General Substitutable Product Case
where 
Comparing the optimal solutions in Table 4 to those in Table 2, it is clear that the optimal solutions are presented in different mathematical formations due to a different expression of β in the new demand function. We then repeat the same analysis of sections 3, 4 and 5 to examine how different internal operational factors and external market circumstances affect the selectin of coopetition strategies with the new demand function. The results are illustrated in Figures 9 and 10, which correspond to the scenarios of partial and perfect substitutes, respectively.
Selection of Coopetition Strategies (θ, Δc, β = 0.5) [Color figure can be viewed at
Selection of Coopetition Strategies (θ, Δc, β = 1) [Color figure can be viewed at
From Figure 9, it is clear that the selection of coopetition strategies maintains the same structural result for the scenario of partial substitutes (0 < β < 1) regardless of the new demand function. From Figure 10, interestingly, although the selection decision between competition and WC is similar to the scenario of partial substitutes, license coopetition is no longer an option for optimal selection of coopetition strategies for the scenario of perfect substitutes (β = 1). It means that firms should not consider license coopetition if their products are perfectly substitutable. This is due to that θ j , whose relationship with θ determines the optimal choice between LC and WC, depends upon β. The value of θ j equals 1 when β = 1. Perfect substitutes often indicate an intense market competition. This finding is also consistent to the industrial practice that firms do not license key technology to rival firms when there is an intense market competition.
Managerial Relevance and Insights
Our research findings are beneficial to firms in industries such as high tech (e.g., smartphone, automobile, PC, and medical devices) that are characterized by rapid technological development and short product life cycles, particularly for those firms currently engaging in some form of cooperation (i.e., buyer–supplier relationships and license agreements) with their competitors or have an intention to do so. In this dynamic and competitive market environment, firms must compete with more sophisticated strategies rather than simply focusing on product or price. Coopetition has become a viable strategic option as shown in the smartphone, automobile, and pharmaceutical industries. However, firms face a dilemma when cooperating with their competitors. As illustrated in this study, production coopetition either through wholesaling or license agreements, on the one hand, provides an extra revenue stream or reduces production cost for the two manufacturers; on the other hand, it incurs a loss in the competition with an enhanced rival for customer demand. Whether firms should opt for coopetition depends upon the tradeoff between the conflicting cooperating and competing forces, which is determined by a combination of external, relationship‐specific, and internal factors. Our research comprehensively examines how these factors affect firms’ optimal strategy selection decisions and suggests a broad set of decision outcomes that have not been captured in previous studies (Luo et al. 2016, Yang et al. 2017). Based on the findings, we propose a decision framework as illustrated in Table 5 to provide some strategic guidance for firms’ optimal decisions concerning coopetition strategies.
Strategic Guidance on Coopetition
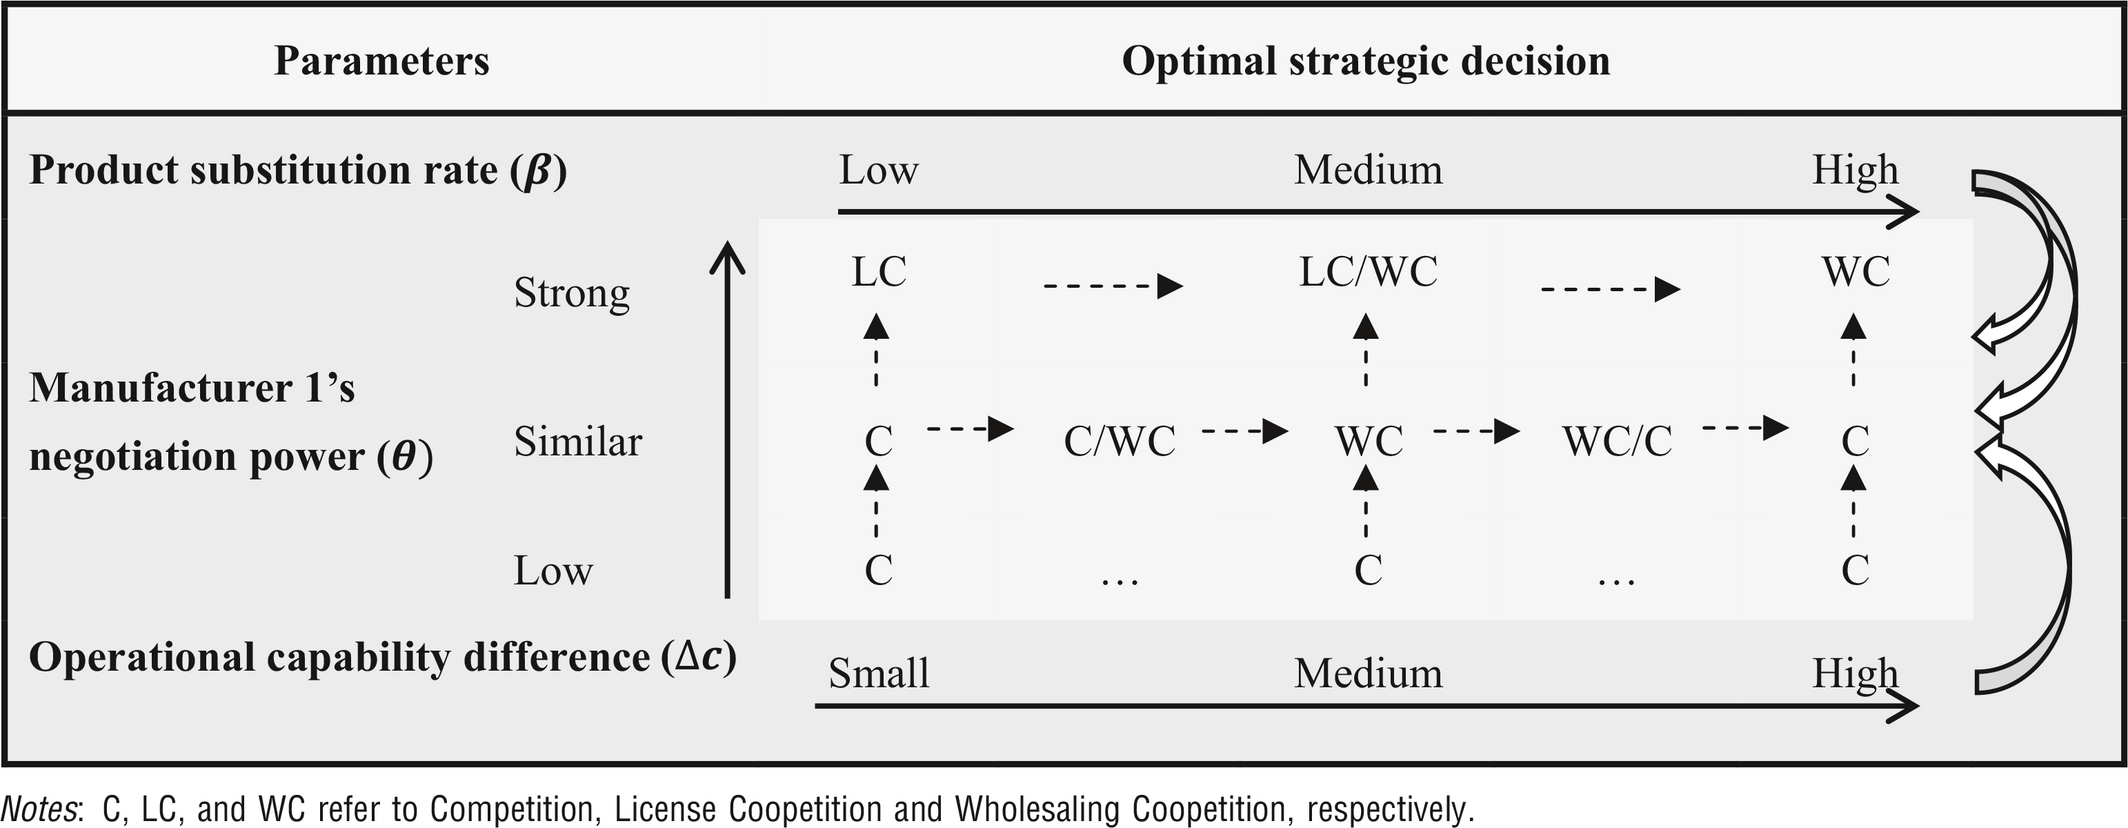
The decision framework systematically outlines how the external, relationship‐specific and internal factors (i.e., β, θ, and Δc) affect the strategy selection, which will be useful for firms in a similar business environment to make important strategic decisions. Here, β measures the cross‐effect of the change in one manufacturer's product demand caused by a change in that of the other manufacturer. A high degree of product substitution tends to intensify the market competition between two manufacturers. Here, θ characterizes the inter–firm power relationship between manufacturers in the negotiation of the wholesaling or licensing agreement. For instance, firms with superior component production capability should not supply key components or license relevant technology to rival firms when they hold less negotiation/bargaining power, despite the conditions of degree of product substitution and difference in their operational capabilities. When there is more balanced negotiation power between the rival firms, they should consider wholesaling coopetition if there is a medium level of product substitution between rival firms and opt for competition only if the product substitution level is low or high. Note that this situation is the only one in which the operational capability difference (Δc) will also play a role in influencing the optimal strategic choice between wholesaling coopetition and competition, as discussed in section 5.2. When they have a more dominant negotiation power, license coopetition should be selected if the degree to which their products are substitutable is low and, conversely, wholesaling coopetition should be chosen.
Considering the dynamic nature of competition and cooperation dualism (Dorn et al. 2016), coopetition itself will affect the nature of market competition and interfirm relationships. With changing market dynamics, power relationships, and internal operational capacities, firms should regularly examine their optimal coopetition strategy because any change in these factors could alter the outcome of their original strategy selection. With a better understanding of the underlying economic principle that governs the coopetition decision, our research findings could support firms in making correct strategic and operational decisions and improve their business competitiveness.
Conclusions
This study systematically examines the effect of two coopetition strategies on the performance of two rival manufacturers. By comparing the two manufacturers’ prices and profits for competition, wholesaling coopetition, and license coopetition models, we derive notable results that provide a richer representation of firms’ strategic behavior concerning coopetition. Our study provides a broader set of decision outcomes that have not been reported by other studies concerning coopetition. Coopetition in the context of wholesaling or license cooperation and pure competition does not necessarily increase profits. Whether the economic effect from the coopetition strategy is positive or negative is determined by the external market characteristics, inter–firm power relationship, and the difference between the rival firms’ capabilities and efficiencies of their internal operations. Specifically, we demonstrate the following: The optimal decision for the coopetition strategies (e.g., competition vs. coopetition or wholesaling vs. licensing) is determined by the trade‐off between the benefit that is gained from the production cooperation and the losses that are caused by market competition when faced with a strengthened competitor. The benefits of cooperation and the losses incurred from competition are determined by a combination of important external and internal factors including the degree to which their products are substitutable (β), manufacturers’ negotiation power (θ), maximum retail prices (α
1, α
2) and cost difference in component production (Δc). These factors depend upon the internal operational and technological capabilities of the involved firms, relationship‐specific characteristics, and the external market environment. Essentially, the optimal choice of the coopetition strategy is governed by the dynamic relationship between the cooperating and competing forces, which is also subject to changes in internal operational capabilities and/or the external market environment over time. An enduring coopetitive relationship requires that the firms achieve a win–win outcome. When either wholesaling coopetition or license coopetition is the optimal strategy, situations exist in which one of the manufacturers is worse off despite an increase in the total profit between the two manufacturers. In those situations, a further operational mechanism (i.e., profit‐sharing contracts) could be designed to achieve a win–win outcome. Furthermore, the difference between the two manufacturers’ unit component costs (Δc) profoundly affects whether wholesaling and license coopetition deliver a Pareto improvement. A Pareto improvement will more likely be achieved if the two competing firms cooperate on an operation function in which there is a substantial difference in efficiency/capability between the two firms. We identify that Pareto improvement in both wholesaling and license coopetition leads to increased profits for both manufacturers and decreased retail prices as shown in Propositions 1 and 2. Therefore, coopetition can positively affect individual firms and consumers. This situation is different from collusion, in which firms increase producers’ surplus by raising prices and consumers are penalized by the decreasing consumer surplus, which leads to a decrease in social welfare (Rusko 2011). In this case, coopetition is an economically sustainable strategy that benefits both firms and consumers.
Similar to many other studies using modeling approaches, we made several assumptions. Relaxing these assumptions can imply directions for future research. For instance, a linear, additive deterministic demand function is adopted in this research. This form of demand function is widely adopted in similar studies (Qing et al. 2017, Wang et al. 2013, Yang et al. 2017) and has the advantage of being analytically more tractable. Nevertheless, market uncertainty is one of the critical factors that determine the success of coopetition strategies (Ritala 2012). One future avenue is to apply stochastic models to explore how the results might be influenced by demand uncertainty. Furthermore, we assume that manufacturer 2 is able to produce the common component to the same quality level as can manufacturer 1 but at a higher production cost. Nevertheless, without the common component, the quality of manufacturer 2's product might be negatively affected and consequently decrease customer demand. One valuable future extension is to consider such a case and incorporate the quality aspect into the modeling. In addition, to focus on the component production cooperation, we use an assumption that the two manufacturers’ unit production costs are identical. In practice, manufacturers could have different unit product costs. Thus, one future extension is to consider this additional internal operational factor and examine how different costs would materially affect the findings.
Second, this study only considers manufacturers that engage in a dyadic coopetitive relationship. In practice, market competition often involves more than two firms. Incorporating more firms in a network setting would certainly change the dynamics of market competition and interfirm relationships and could thus affect firms’ optimal strategies concerning coopetition. It would be interesting to study a network setting more complex than the dyadic setting adopted in this research.
Finally, coopetition could be employed as a new strategy for other value chain activities (e.g., R&D and logistics services). For example, to achieve carbon emission–reduction targets, one strategic response from the automotive industry is to cooperate with rival firms on green technologies and innovations. Similarly, in the online retailing sector, many online retailers have the dilemma of whether to invest in their own distribution and logistics operation or use the delivery service provided by marketplace firms such as Amazon or Alibaba. Although different model settings are required to evaluate the effectiveness of coopetition strategies, it would be interesting to evaluate the effect of coopetition on other supply chain operations.
Footnotes
Acknowledgments
We thank Professor Chelliah Sriskandarajah (the department editor), the senior editor, and two referees for their valuable suggestions, which have improved the study significantly. This study was partially supported by the National Natural Science Foundation of China (Grants 71432003 and 91646109).
1
The form of β N is listed in the proof of the lemma in Appendix S1. Its value depends upon the maximum unit profit for manufacturer 1 and 2 (δ 1, δ 2) and the difference between the unit component cost for the two manufacturers (Δc).
2
The forms of θ y , θ s , θ t and θ c are listed in the proof of the lemma in Appendix S1. Their values depend upon the degree of product substitution (β).
3
The forms of θ
e
, θ
c
, Δc
H
and Δc
B
are listed in the proof of Lemma ![]() in Appendix S1. The value of θ
e
depends upon the maximum unit profit for manufacturer 1 (δ
1), the difference in the unit component cost between manufacturers (Δc), and the degree of product substitution (β). The value of θ
c
depends upon β. The values of both Δc
H
and Δc
B
depend upon δ
1 and β.
in Appendix S1. The value of θ
e
depends upon the maximum unit profit for manufacturer 1 (δ
1), the difference in the unit component cost between manufacturers (Δc), and the degree of product substitution (β). The value of θ
c
depends upon β. The values of both Δc
H
and Δc
B
depend upon δ
1 and β.
4
The values of Δc H , Δc A and Δc K depend upon the maximum unit profit for manufacturer 1 (δ 1) and the degree of product substitution (β). The value of θ c depends upon β. The values of θ p , θ q and θ g depend upon δ 1, β and the difference between the unit component costs of the two manufacturers (Δc).
5
6
The mathematical forms of Δc
H
, Δc
P
, Δc
J
, θ
j
, θ
k
and θ
l
are listed in the proof of Proposition ![]() in Appendix S1. The values of Δc
H
, Δc
P
and Δc
J
depend upon the maximum unit profit for manufacturer 1 (δ
1) and the degree of product substitution (β). The value of θ
j
depends upon β. The values of θ
k
and θ
l
depend upon δ
1, β and Δc.
in Appendix S1. The values of Δc
H
, Δc
P
and Δc
J
depend upon the maximum unit profit for manufacturer 1 (δ
1) and the degree of product substitution (β). The value of θ
j
depends upon β. The values of θ
k
and θ
l
depend upon δ
1, β and Δc.
7
The forms of Δc
H
, θ
j
, θ
p
and θ
c
are listed in the proof of Proposition ![]() in Appendix S1. Δc
H
depends upon the maximum unit profit for manufacturer 1 (δ
1) and the degree of product substitution (β). θ
j
and θ
c
depend upon β. θ
p
depends upon the difference between the two manufacturers’ unit component costs (Δc).
in Appendix S1. Δc
H
depends upon the maximum unit profit for manufacturer 1 (δ
1) and the degree of product substitution (β). θ
j
and θ
c
depend upon β. θ
p
depends upon the difference between the two manufacturers’ unit component costs (Δc).
8
The critical threshold Δc
H
, which defines the feasible region of maximum ∆c value, is determined by δ
1 and β. Because β ∈ (0, 10) is specified in the analysis of section ![]() , we derive the maximum feasible value of ∆c as 0.54 through inputting β = 10 in the mathematical expression of Δc
H
. Therefore, the values of ∆c considered in the analysis cover a reasonable range.
, we derive the maximum feasible value of ∆c as 0.54 through inputting β = 10 in the mathematical expression of Δc
H
. Therefore, the values of ∆c considered in the analysis cover a reasonable range.