
Abstract
Objectives
The purpose of the study is to develop a comprehensive risk score of mortality in trauma victims that can predict the in-hospital mortality better than trauma injury severity score (TRISS) and A Severity Characterization of Trauma (ASCOT) score.
Methods
All hospitalized trauma patients, between the ages of 16 and 89 years old were included in the study. The National Trauma Quality Improvement Program (TQIP) database of the calendar year 2011-2016 was accessed for the development of a traum mortality scoring system (TMS). The prediction of mortality was tested by creating a receiver operating characteristics (ROC) curve and an area under the curve (AUC). ROCs and AUCs of TMS were compared with TRISS and ASCOT score.
Results
The AUC of TMS (0.892, 95% CI: 0.888-0.896) was better than TRISS (0.864, 95% CI: 0.859-0.869, P <0.0001) and ASCOT (0.841, 95% CI: 0.835-0.846, P <0.0001), respectively, in blunt injury. Similarly, TMS prediction (AUC: 0.949, 95% CI: 0.940-0.958) was better in penetrating injury when compared with TRISS (0.942, 95% CI: 0.934-0.951, P = 0.030) and ASCOT (0.924, 95% CI: 0.912-0.936, P <0.0001), respectively.
Conclusion
TMS can predict the in-hospital mortality better than TRISS and ASCOT.
Introduction
Trauma is the leading cause of death and disability among young adults. 1 Globally 5.8 million people die due to injury each year representing about 10% of all deaths. 2 In the year 2013, the cost associated with the care of injured patients was $671 billion in the United States alone. 3 Almost one third of that cost was associated with caring of fatal injuries. 3 The development of trauma system and specialized care at trauma centers has reduced the incidence of mortality.4,5 Early identification of high-risk patients, proper resource allocations, and close monitoring can reduce the overall mortality and morbidity. 6 Based on the mortality risk of the patient, early palliative care consult can be initiated in some cases. 7
Different scoring system and predictor models for mortality/survivability of trauma patients have been reported in the literature. The two most widely cited trauma scores, revised trauma score (RTS) and trauma injury severity score (TRISS), were developed a few decades ago.8,9 About 10 years later after developing RTS, the same group came up with another score, A Severity Characterization of Trauma (ASCOT) score that showed a better prediction of mortality when compared to TRISS score in blunt injury. 10 These scores include some physiological parameters, anatomical site injury, and age factors and are mostly used for triaging the patients at the scene and transferring to trauma center vs non-trauma center. Sartorius et al 11 in 2010 developed another scoring system, known as MGAP score, to predict the in-hospital mortality by adding mechanism of injury to the previously reported scoring system component, age, Glasgow coma scale [GCS], and blood pressure. 11 A modified version of the MGAP score, known as GAP, was created that accounts for GCS, age, blood pressure, and has shown better accuracy of predicting in-hospital mortality. 12 All previously reported trauma mortality score systems lack the comorbidities in their predictor models,8-13 although comorbidities are one of the factors affecting trauma mortality. 14 Excluding the pre-existing condition from the model may have underestimated the in-hospital mortality.
To address this issue, we designed the study to identify the risk factors of in-hospital mortality using National Trauma Quality Improvement Program (TQIP) database, including patient’s demography, mechanism of injury, injury severity, systolic blood pressure (SBP), and comorbidities. For ease of calculating the predictability of mortality in trauma patients for point of care physician, we have created a Trauma Mortality Score (TMS) calculator that will be available to all providers through a web-based link. Our hypothesis is TMS will predict the in-hospital mortality better than TRISS and ASCOT.
Methods
Data Source
The TQIP database of the calendar years 2011-2016 was accessed for the study. The database is one of the largest trauma quality program database in the United States. The database is maintained by the American College of Surgeon (ACS). Individual trauma centers’ performance, mortality and morbidity, is compared by the rest of the trauma centers in the country. The results of the performance are shared with the individual center twice a year.
Patient’s Characteristics
All trauma patients, between the ages of 16 and 89 years old, who sustained injury with an injury severity score (ISS) ≥1 and admitted to the hospital, were included in the study. Other characteristics included in the study are sex, race, mechanism of injury, initial SBP mmHg, hypotension, defined as (SBP<90 mmHg), injury severity score (ISS) and Glasgow coma scale (GCS) and patients’ comorbidities, chronic alcoholism, ascites, coagulopathy, use of chemotherapy, congestive heart failure (CHF), chronic renal failure (CRF), on dialysis, stroke, diabetes mellitus (DM), disseminated cancer, functional dependency (from completely dependency to complete independency), myocardial infarction (MI) within last month, peripheral vascular disease (PVD), hypertension (HTN) on medication, obesity, chronic pulmonary obstructive disease (COPD), use of steroid, cirrhosis, and dementia.
Outcomes
The primary endpoint of the study was to identify the risk of in-hospital mortality, validate the results, and develop a simple scoring system for the point of care physicians for better resource utilization.
Statistics
Patient demographic information was summarized using summary statistics (median with interquartile range (IQR) [first quartile – third quartile] for continuous variables, and frequency and percentage for categorical variables). To compare the groups, the Wilcoxon rank-sum test was used for continuous variables, and the chi-square test was used for the categorical variables. The normality of data was tested using the Anderson-Darling test. Initially, all patients’ characteristics mentioned above were used for performing the risk assessment. A multiple logistic regression model was used to assess the chance of having mortality with those specified variables. The backward elimination approach was used for the final selection of the model at significance level of .05. The receiver operating characteristics (ROC) curve was constructed, and the corresponding area-under-the curve (AUC) was calculated. The parameter estimates from the fitted model were summarized using β coefficient estimates and 95% confidence intervals (CIs), and 95% CIs for the odds ratio (OR) as measures of precisions. For the purpose of developing and validating the risk assessment model, we divided the data into two data sets: the training data set, which contains 80% of the randomly selected data, and the testing data set, which contains the other 20% of the data. The 2-sided P-value was reported for each test. A trauma mortality scoring system (TMS) has been created from the β coefficient of the selected variables for the point of care physicians. The ROC and AUC of TMS were compared with TRISS and ASCOT scores for blunt and penetrating injury using the DeLong’s test.15-18 The TMS calculator has been developed from the beta regression coefficients. The sum of the coefficients was inputted into a formula, which was then converted into a percentage to output the risk of mortality following a traumatic injury. A P-value of <.05 is considered an indication of statistical significance. Statistical analysis was performed using the R language. 19
Results
Univariate Analysis
Univariate Analysis of Trauma Patients Who Died and Who Survived.
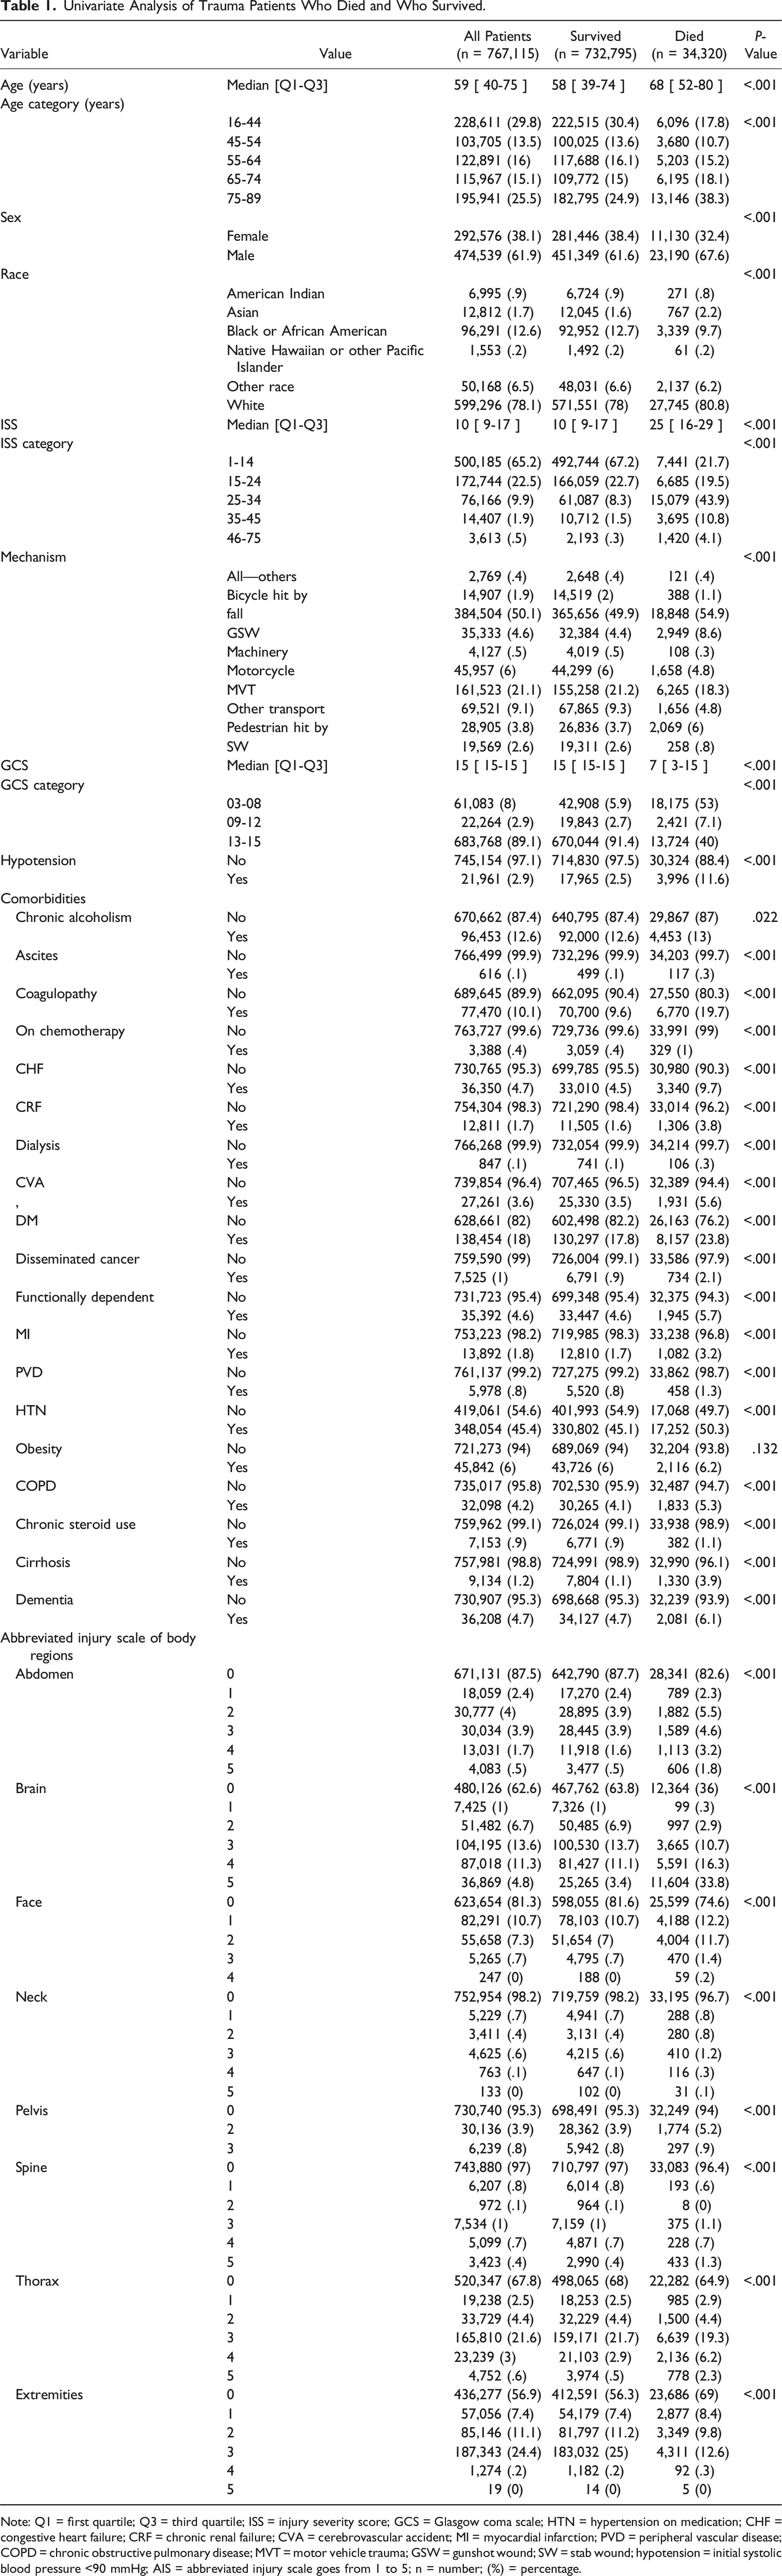
Note: Q1 = first quartile; Q3 = third quartile; ISS = injury severity score; GCS = Glasgow coma scale; HTN = hypertension on medication; CHF = congestive heart failure; CRF = chronic renal failure; CVA = cerebrovascular accident; MI = myocardial infarction; PVD = peripheral vascular disease; COPD = chronic obstructive pulmonary disease; MVT = motor vehicle trauma; GSW = gunshot wound; SW = stab wound; hypotension = initial systolic blood pressure <90 mmHg; AIS = abbreviated injury scale goes from 1 to 5; n = number; (%) = percentage.
Multiple Logistic Regression Analysis
Multivariable Analysis of the Risk of Mortality.
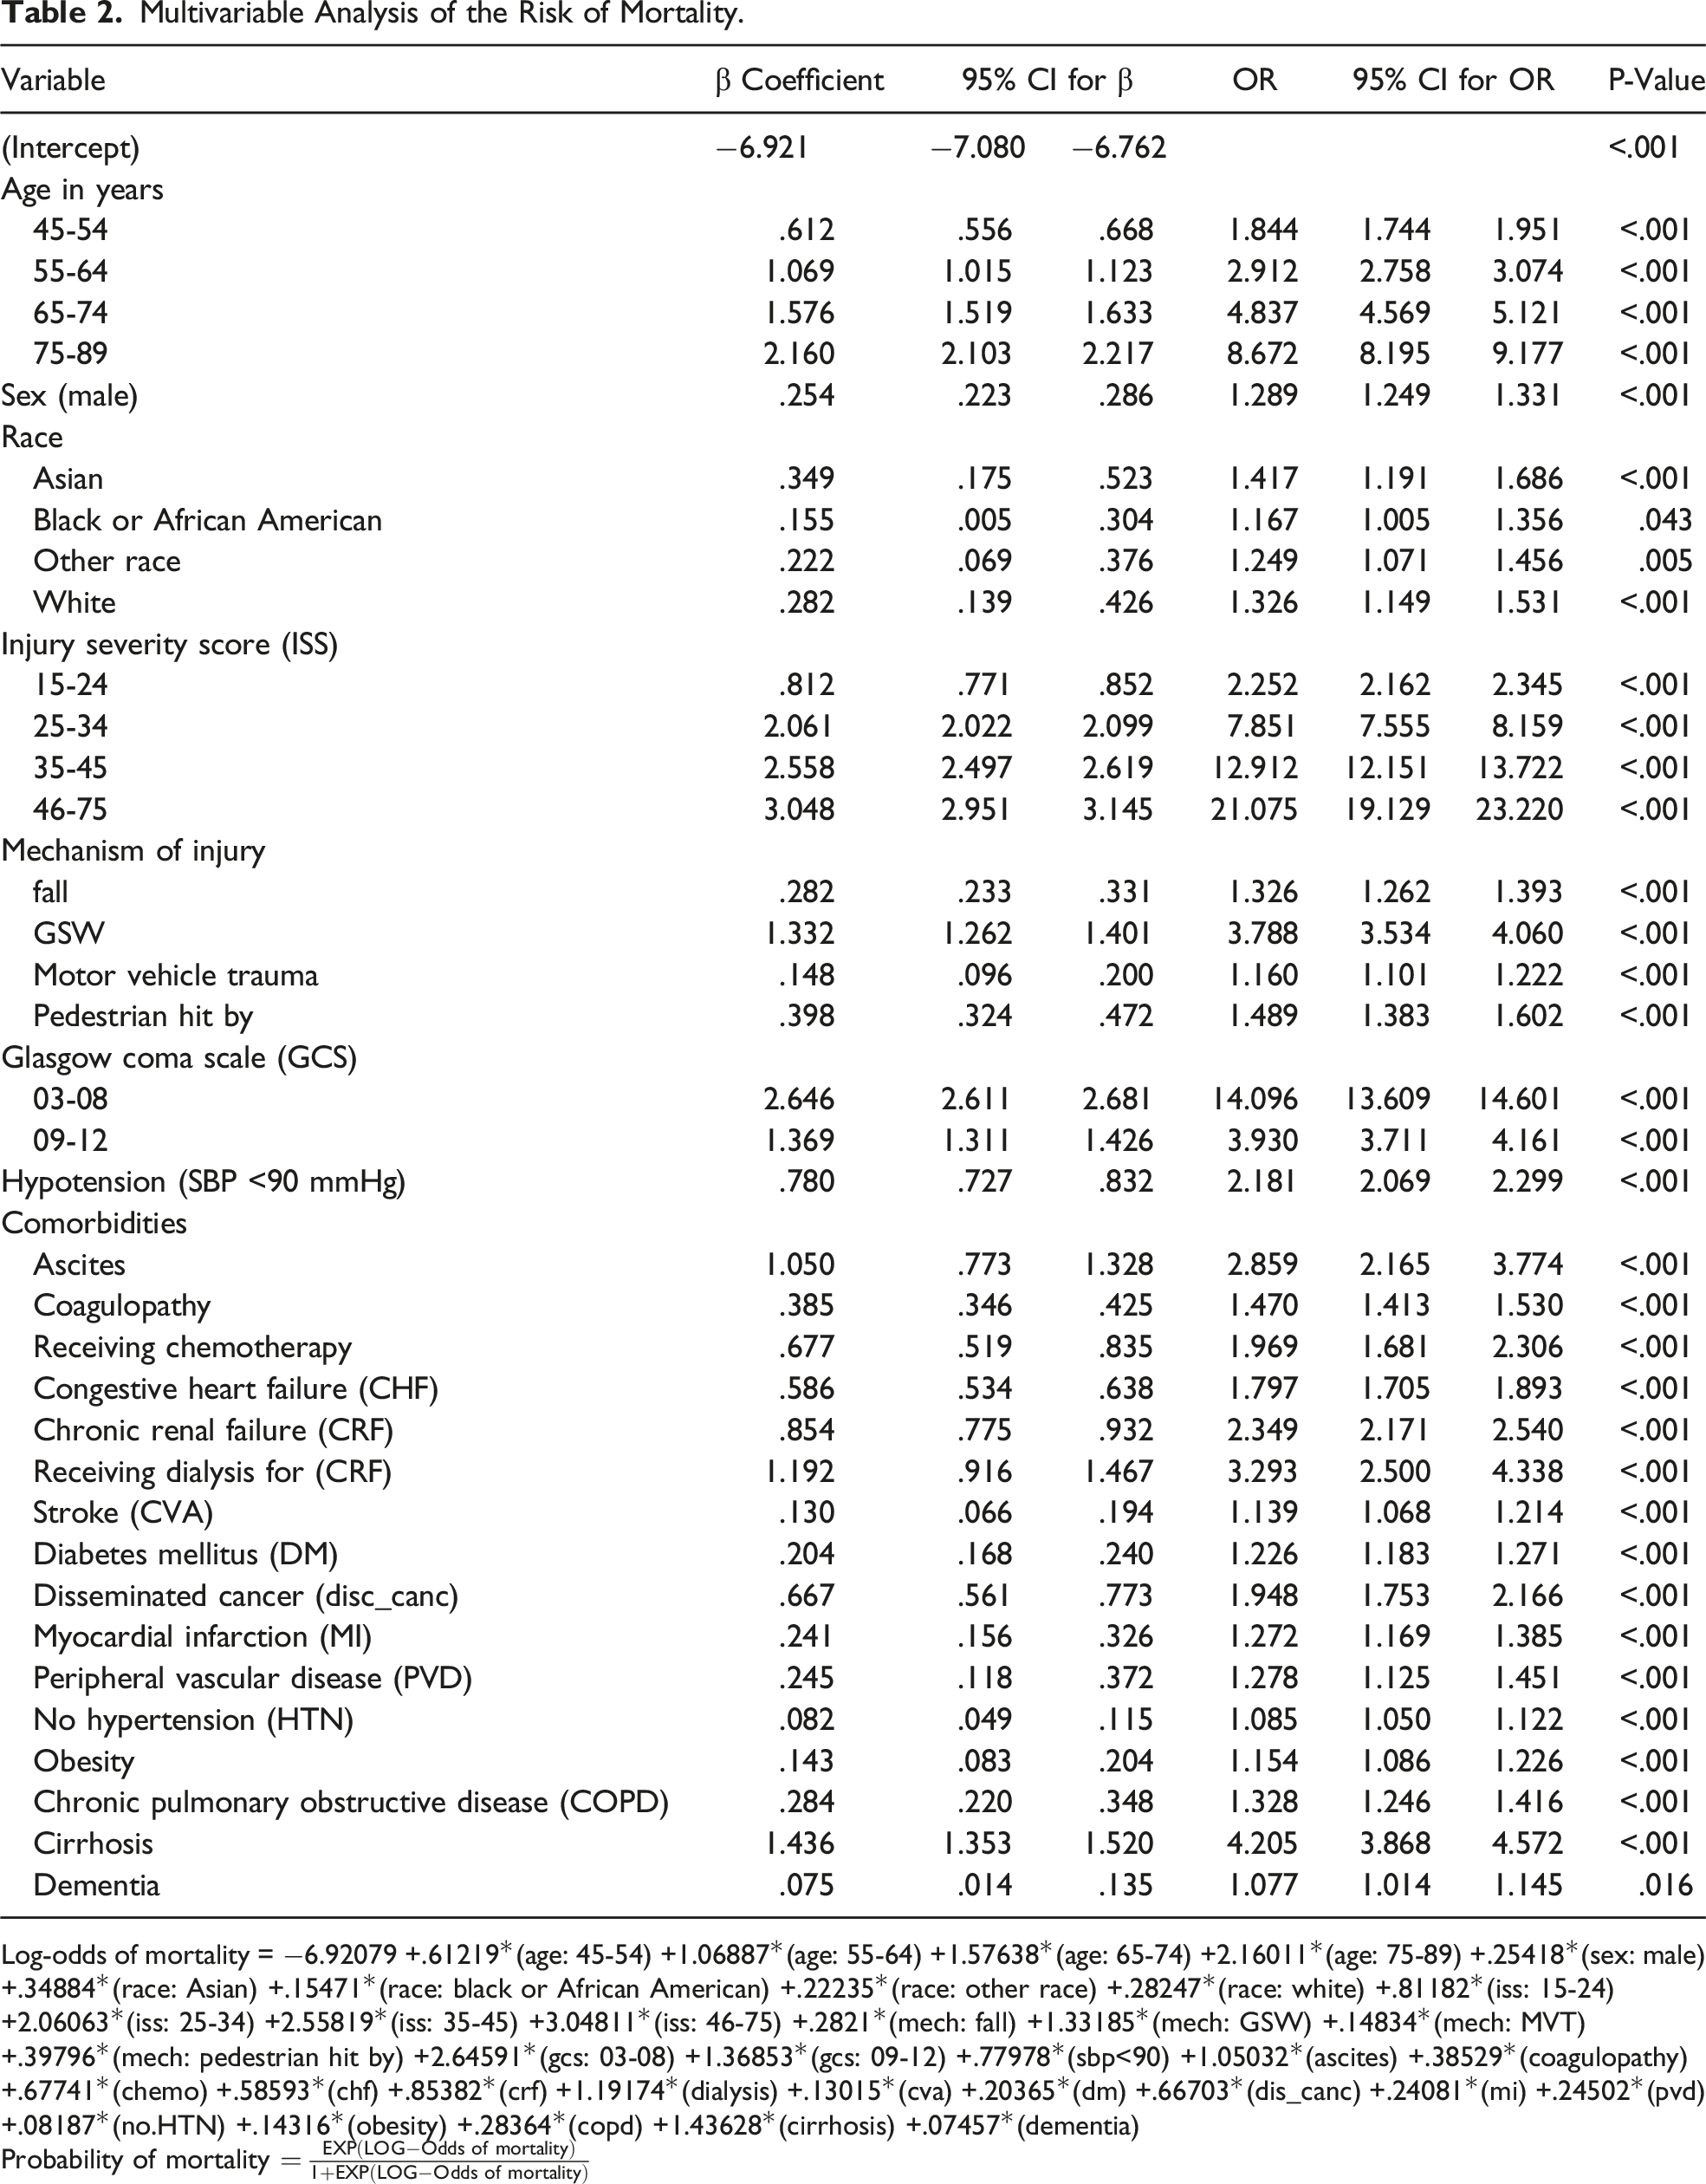
Log-odds of mortality = −6.92079 +.61219*(age: 45-54) +1.06887*(age: 55-64) +1.57638*(age: 65-74) +2.16011*(age: 75-89) +.25418*(sex: male) +.34884*(race: Asian) +.15471*(race: black or African American) +.22235*(race: other race) +.28247*(race: white) +.81182*(iss: 15-24) +2.06063*(iss: 25-34) +2.55819*(iss: 35-45) +3.04811*(iss: 46-75) +.2821*(mech: fall) +1.33185*(mech: GSW) +.14834*(mech: MVT) +.39796*(mech: pedestrian hit by) +2.64591*(gcs: 03-08) +1.36853*(gcs: 09-12) +.77978*(sbp<90) +1.05032*(ascites) +.38529*(coagulopathy) +.67741*(chemo) +.58593*(chf) +.85382*(crf) +1.19174*(dialysis) +.13015*(cva) +.20365*(dm) +.66703*(dis_canc) +.24081*(mi) +.24502*(pvd) +.08187*(no.HTN) +.14316*(obesity) +.28364*(copd) +1.43628*(cirrhosis) +.07457*(dementia)
Probability of mortality
The final model can predict the mortality from .59% to 99.99%. Our model showed patients’ age more than 75 years old has an approximately 9-fold increase chance of mortality compared to age less than 45 years old. Gunshot wound, Asian race, male gender, higher severity of injuries, and some comorbidities including chronic renal failure on dialysis and cirrhosis have the highest chances of mortality. Our model was further tested for the appropriate fit to predict mortality by creating a receiver operating characteristics (ROC) curve, and an area under the curve (AUC) was generated. The AUC of TMS (0.892, 95% CI: 0.888-0.896) was better than TRISS (0.864, 95% CI: 0.859-0.869, P<0.0001) and ASCOT (0.841, 95% CI: 0.835-0.846, P<0.0001), respectively, in blunt injury (Figure 1). Receiver operating characteristics (ROC) curve of TMS, TRISS, and ASCOT for prognostic model performance in predicting the mortality in blunt injury from the testing data set.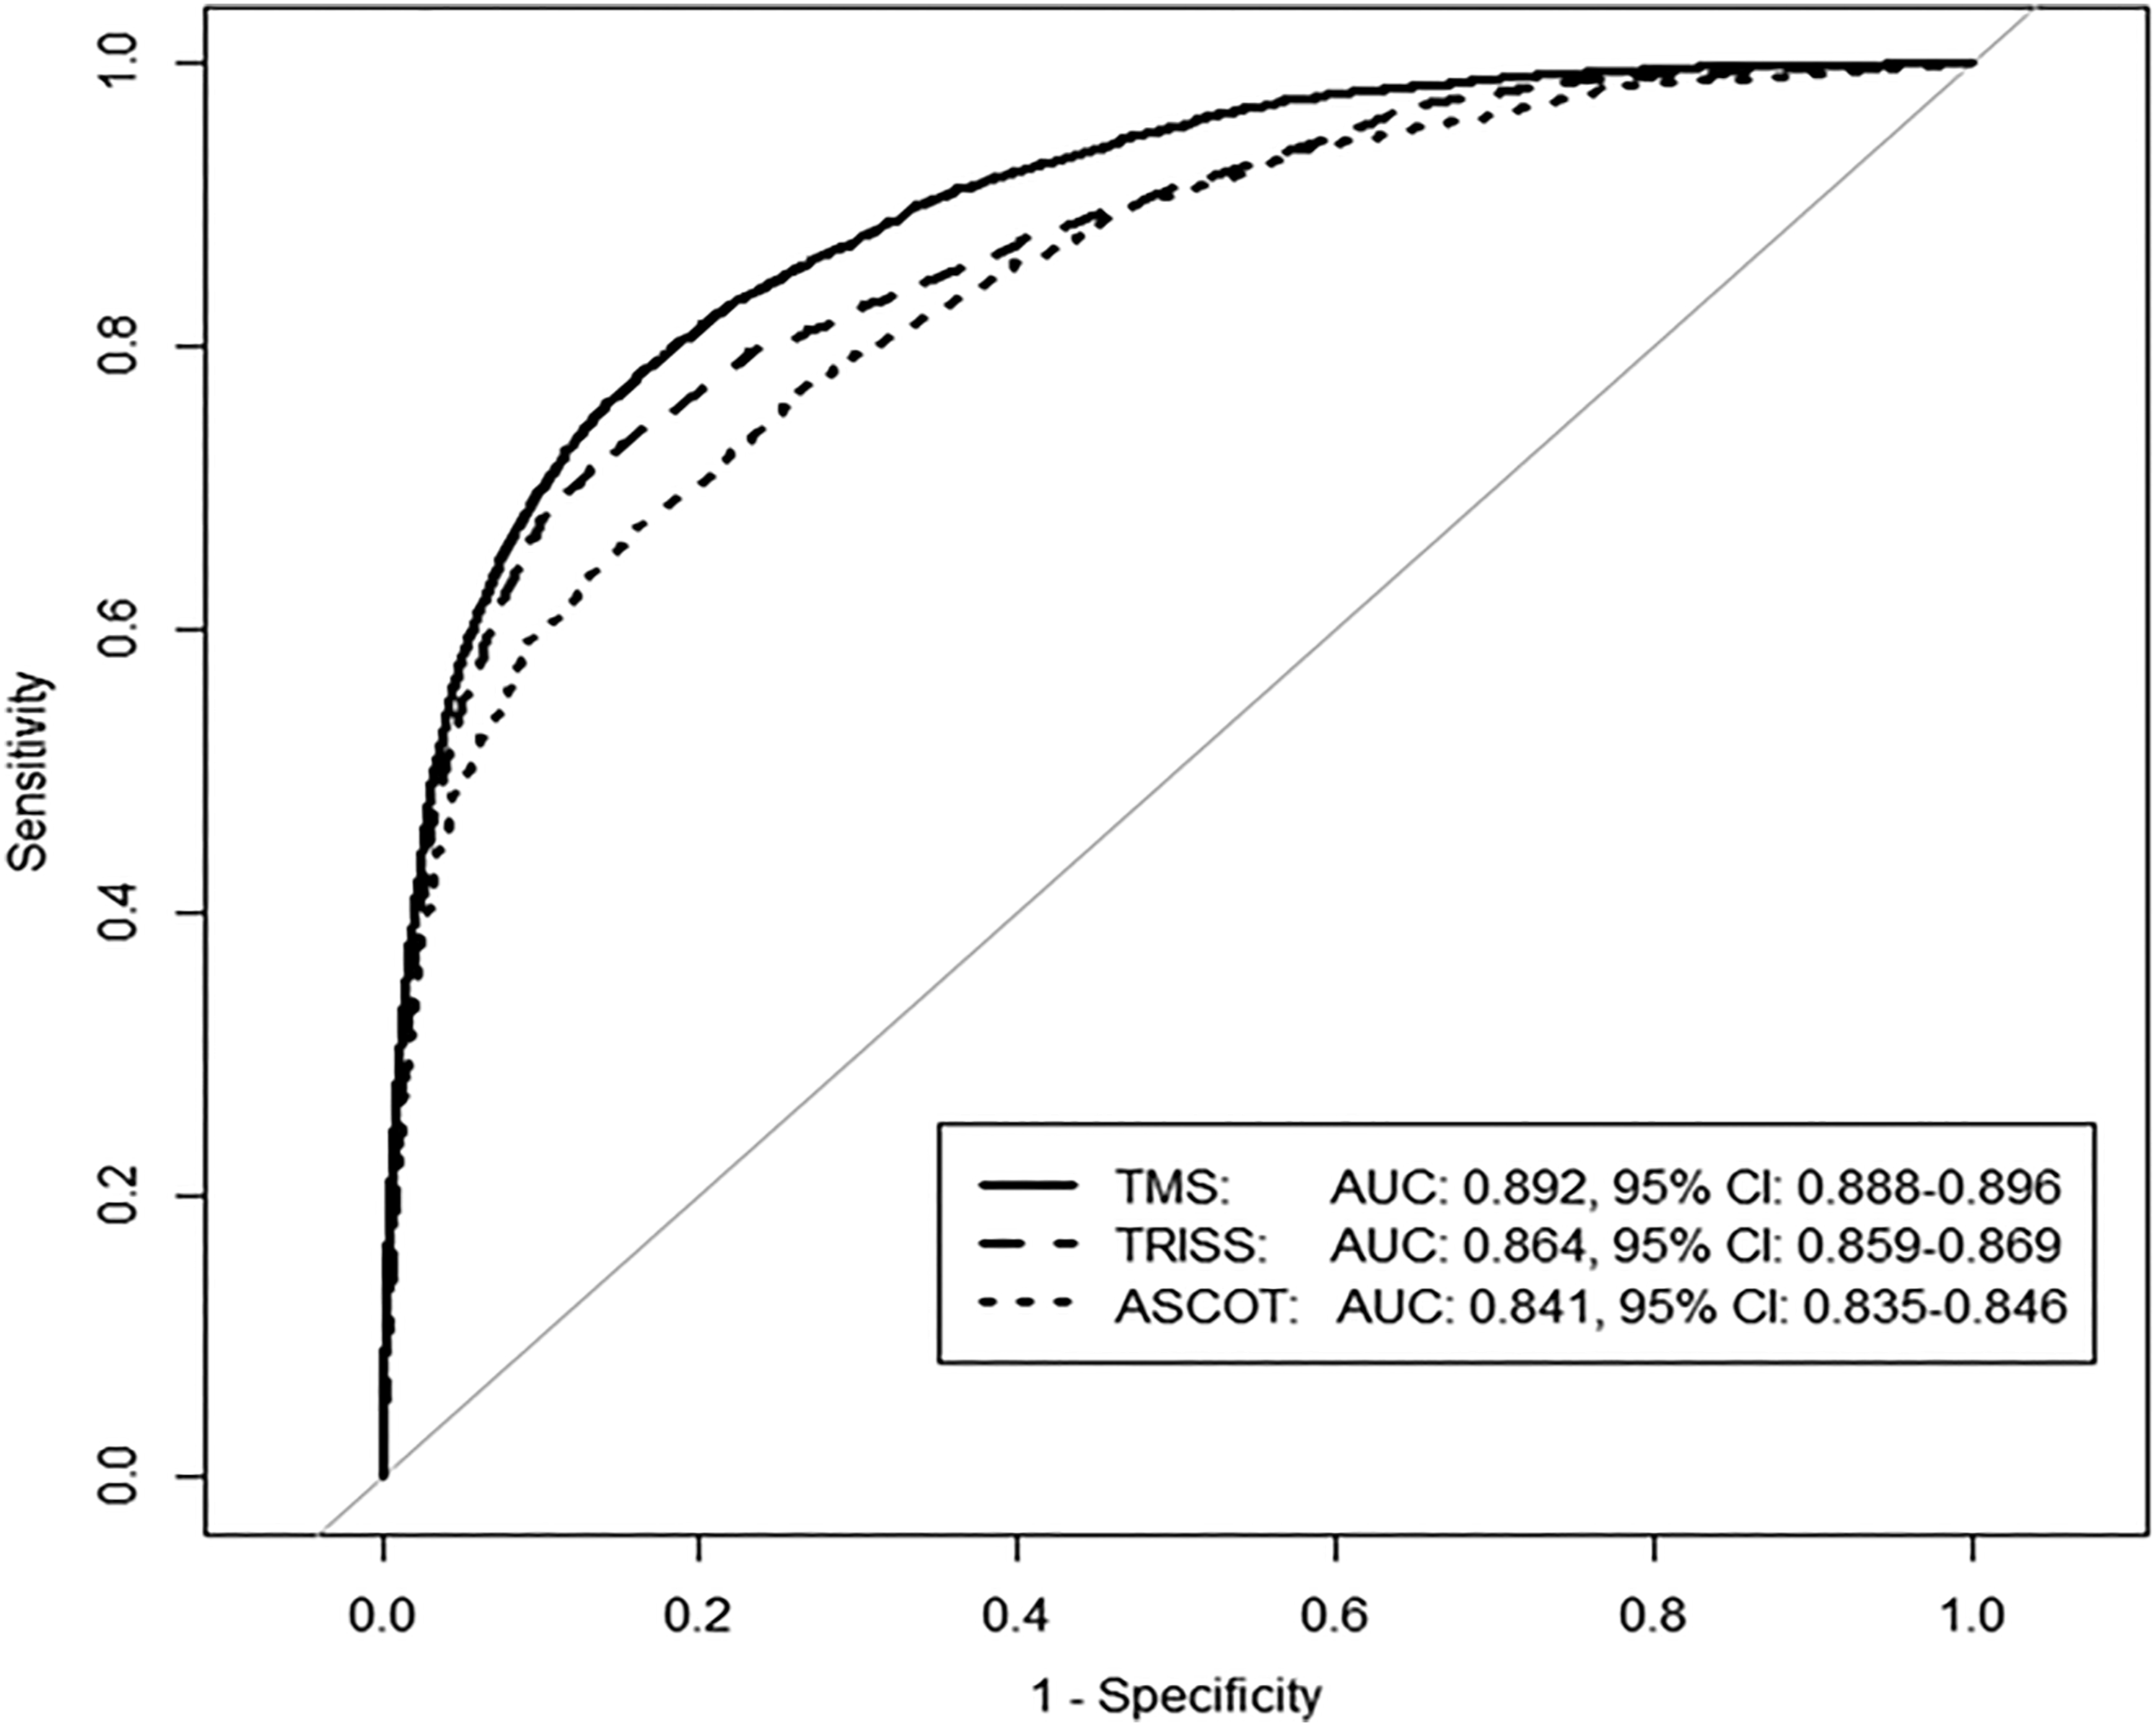
When ROC and AUC of TMS was compared with TRISS and ASCOT score in penetrating injury, TMS prediction (AUC: 0.949, 95% CI: 0.940-0.958) was better in penetrating injury when compared with TRISS (0.942, 95% CI: 0.934-0.951, P=0.030) and ASCOT (0.924, 95% CI: 0.912-0.936, P<0.0001), respectively (Figure 2). Receiver operating characteristics (ROC) curve of TMS, TRISS, and ASCOT for prognostic model performance in predicting the mortality in penetrating injury from the testing data set.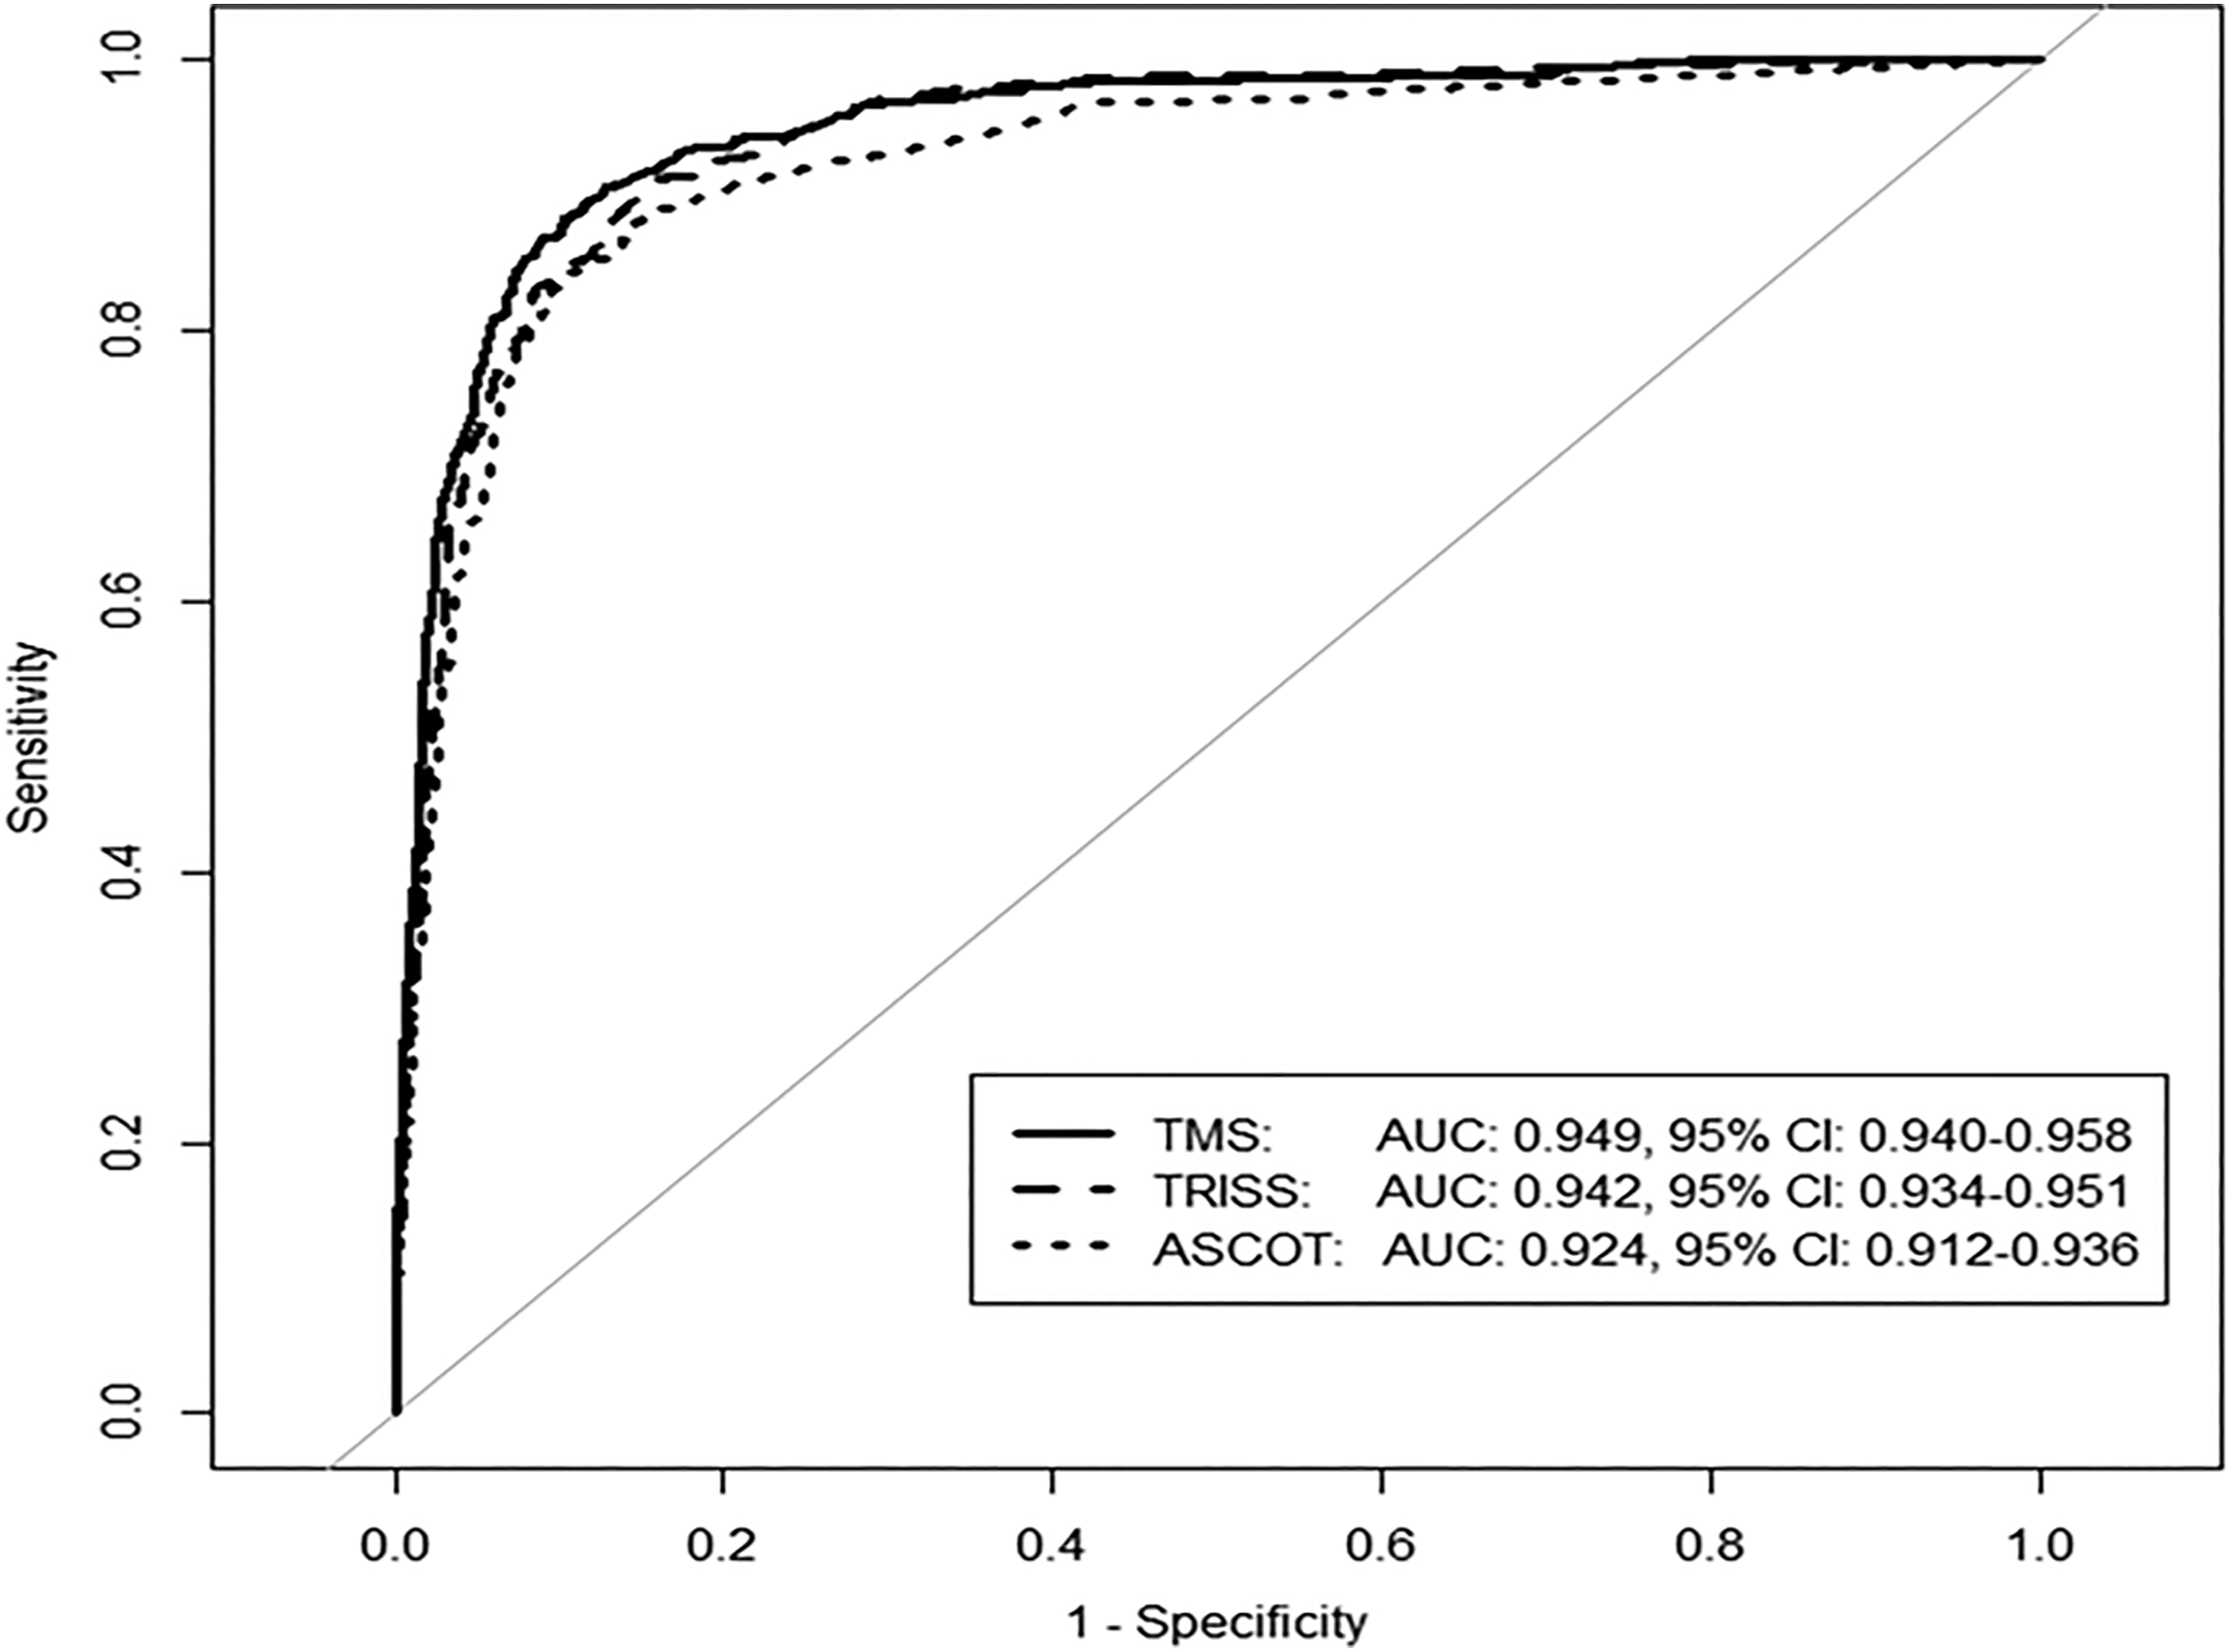
Comparison between Training Data and Testing Data.
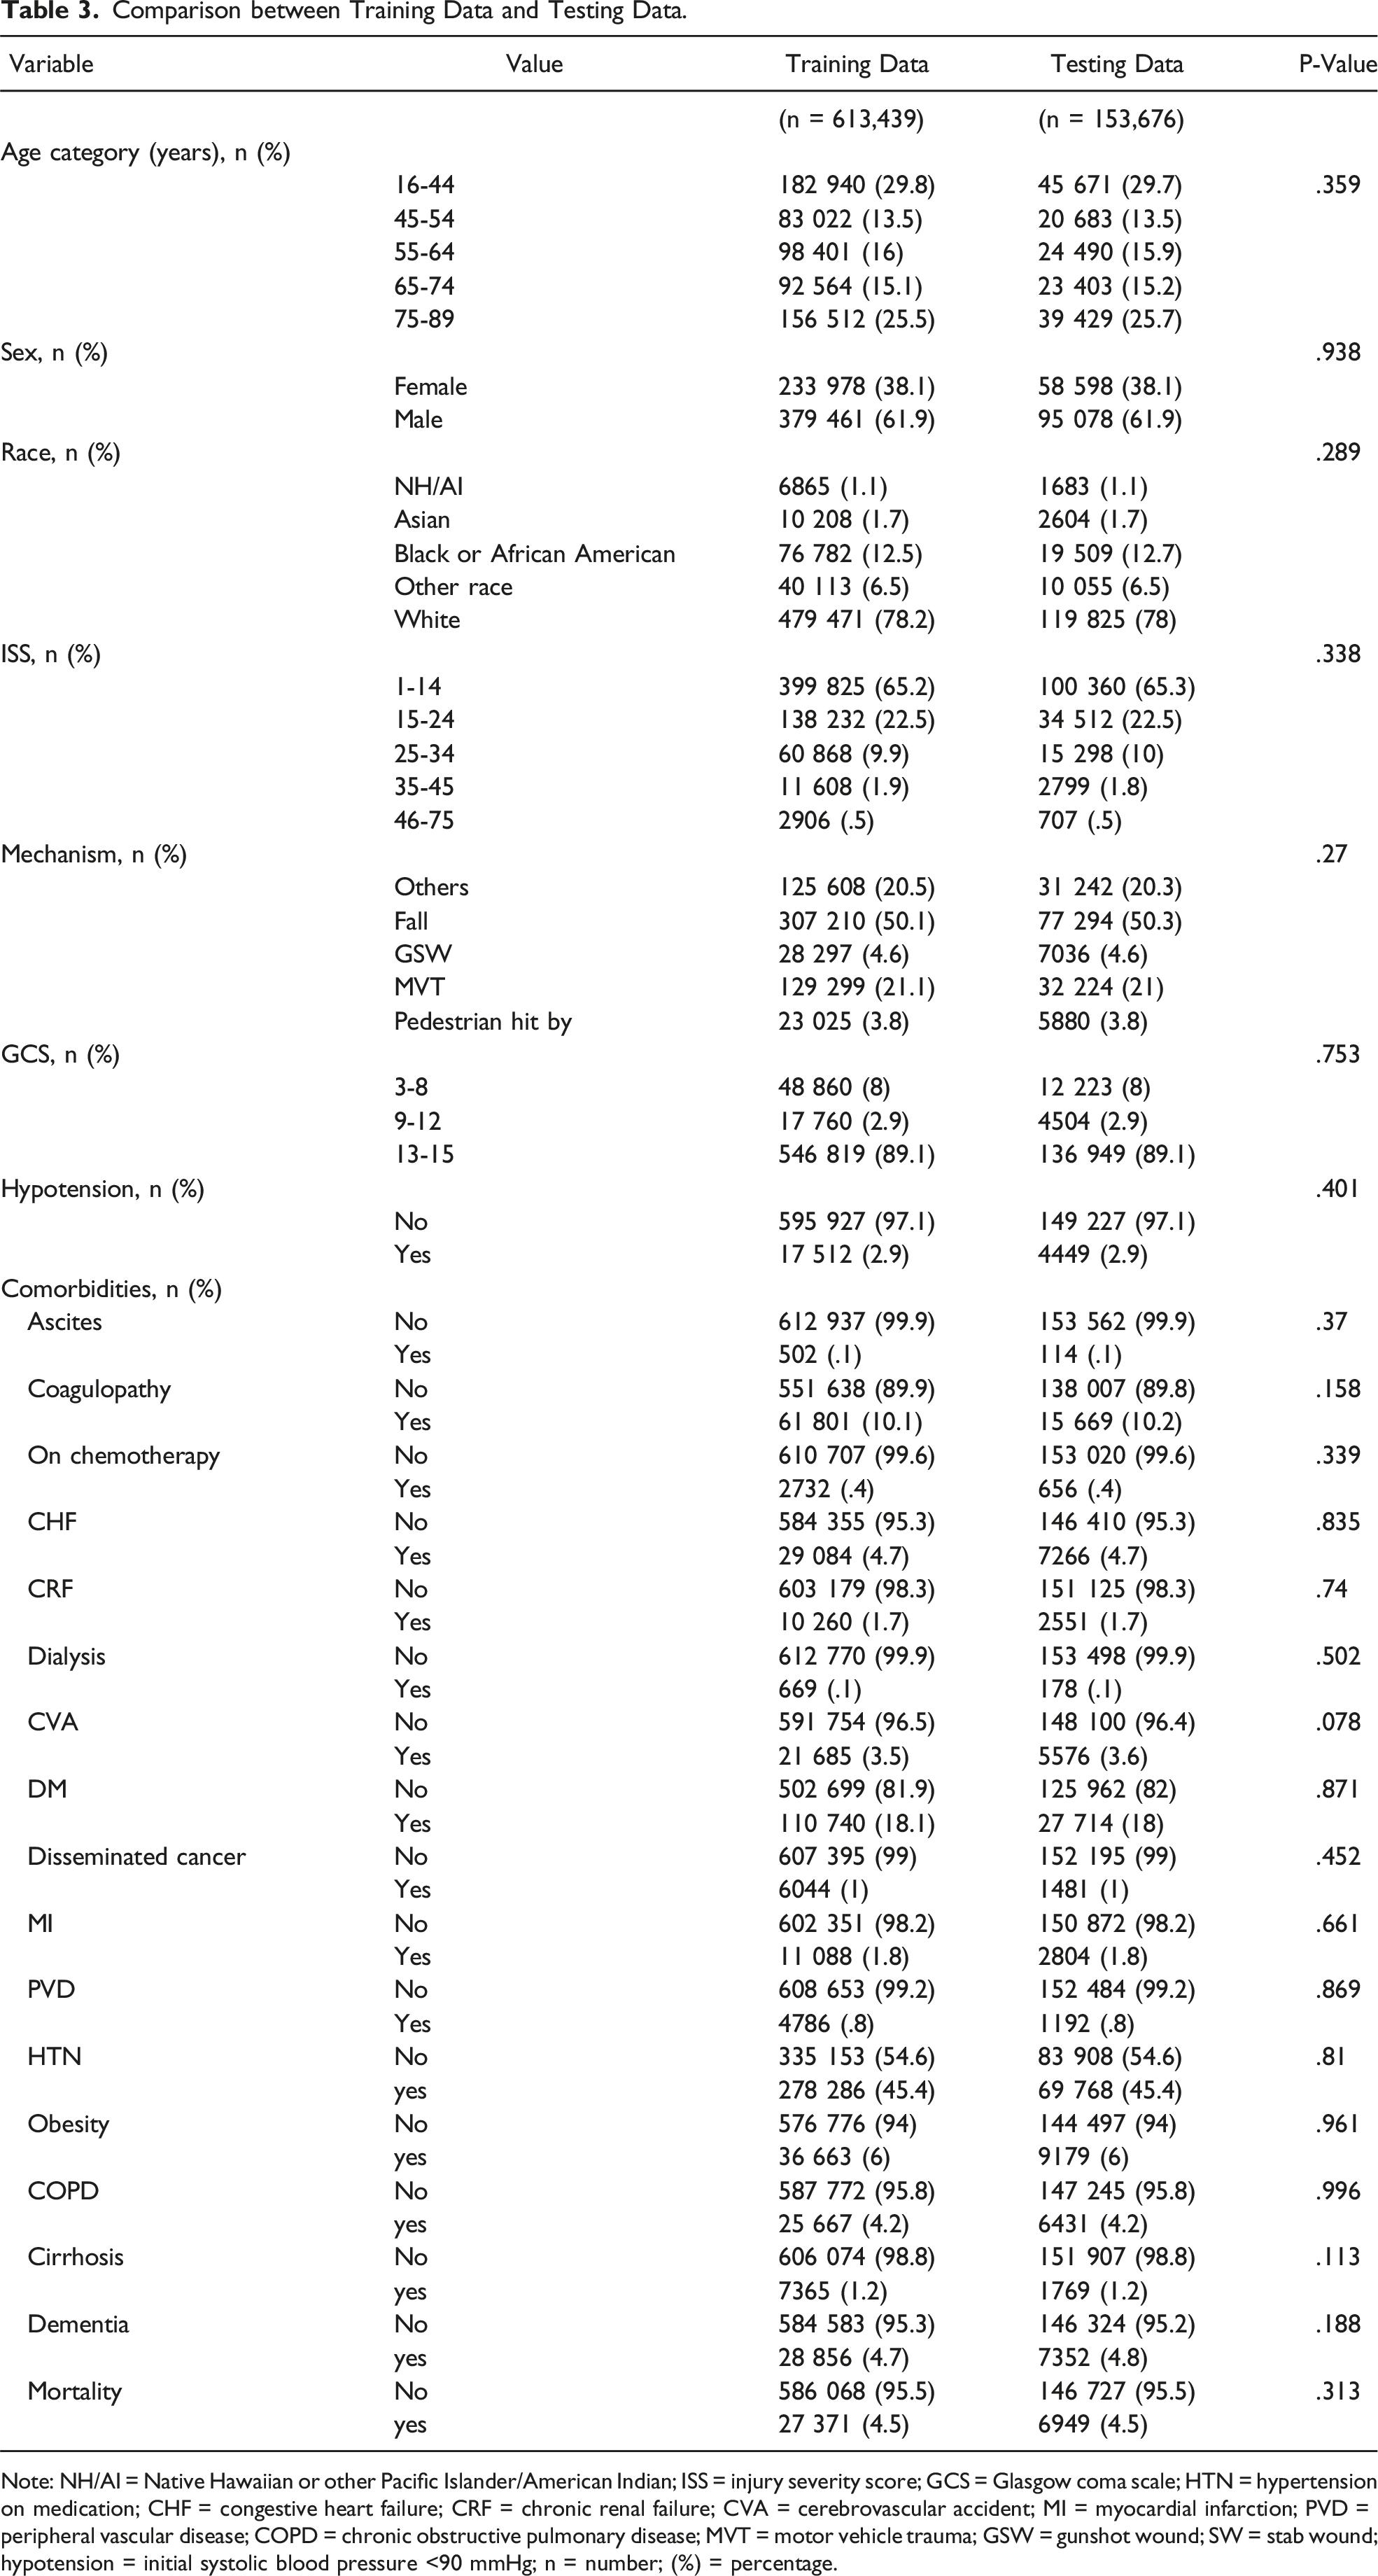
Note: NH/AI = Native Hawaiian or other Pacific Islander/American Indian; ISS = injury severity score; GCS = Glasgow coma scale; HTN = hypertension on medication; CHF = congestive heart failure; CRF = chronic renal failure; CVA = cerebrovascular accident; MI = myocardial infarction; PVD = peripheral vascular disease; COPD = chronic obstructive pulmonary disease; MVT = motor vehicle trauma; GSW = gunshot wound; SW = stab wound; hypotension = initial systolic blood pressure <90 mmHg; n = number; (%) = percentage.
Score Assignment.
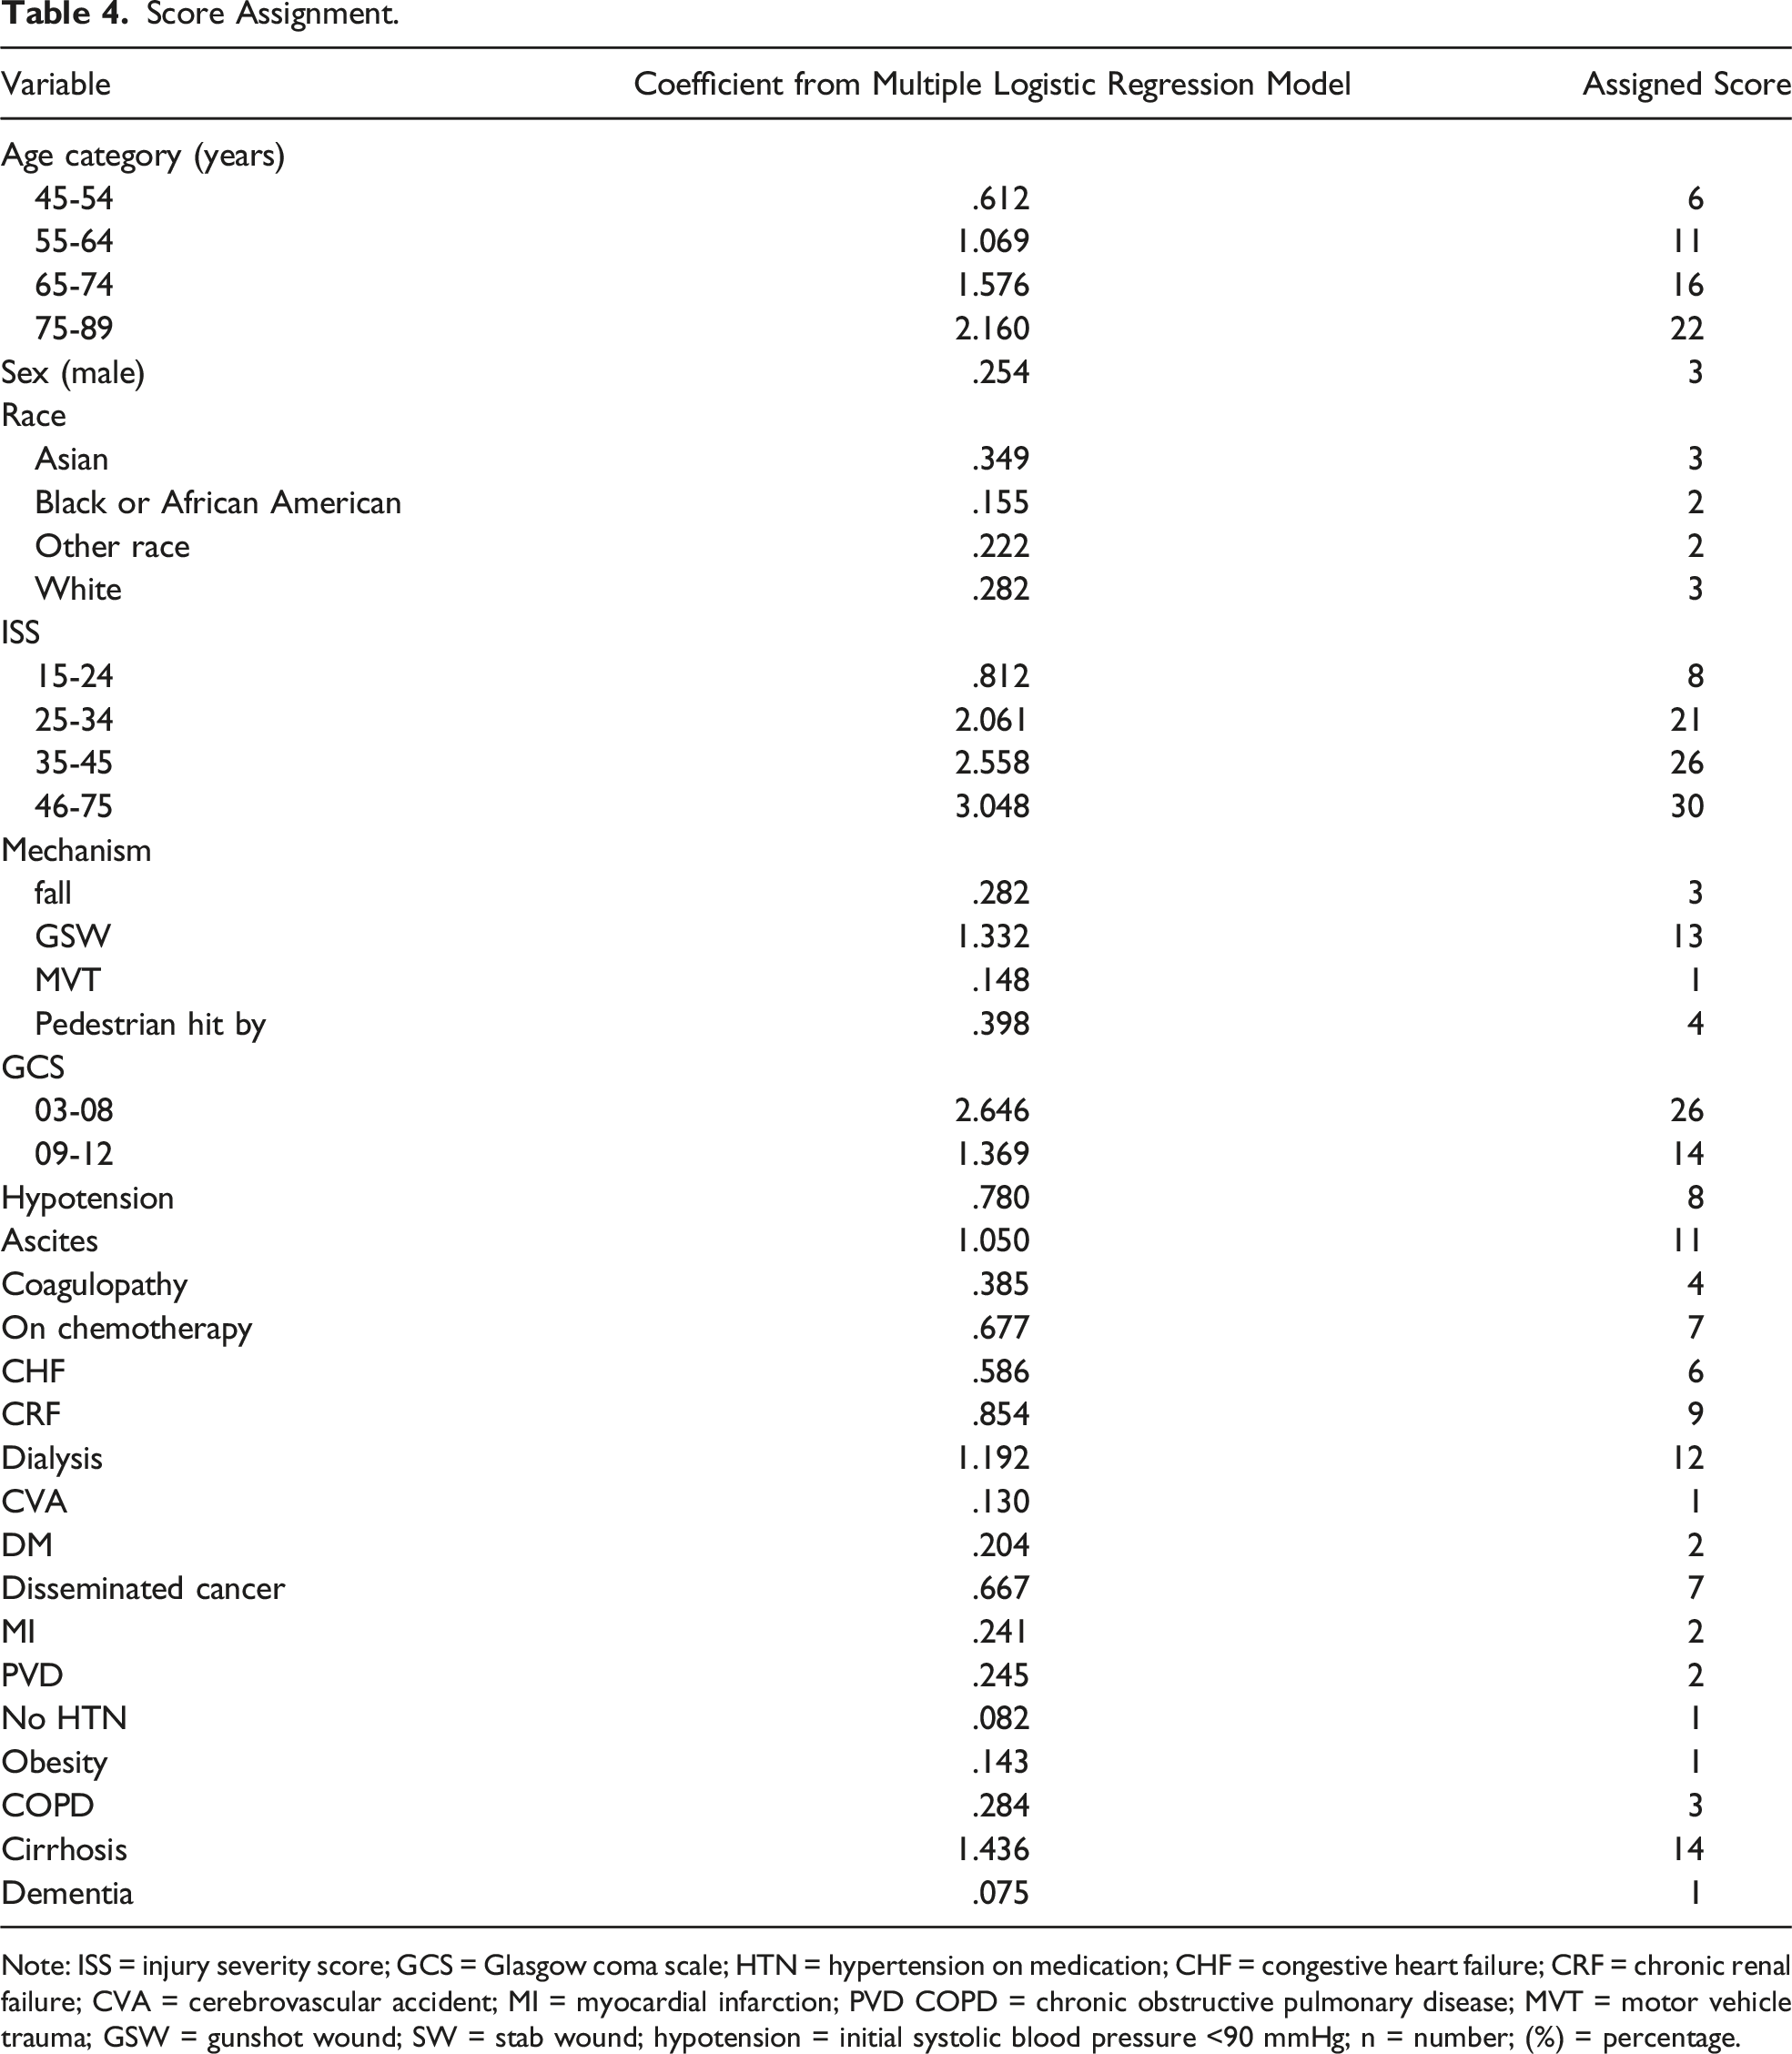
Note: ISS = injury severity score; GCS = Glasgow coma scale; HTN = hypertension on medication; CHF = congestive heart failure; CRF = chronic renal failure; CVA = cerebrovascular accident; MI = myocardial infarction; PVD COPD = chronic obstructive pulmonary disease; MVT = motor vehicle trauma; GSW = gunshot wound; SW = stab wound; hypotension = initial systolic blood pressure <90 mmHg; n = number; (%) = percentage.
Figure 3 shows the observed and predicted percentages of mortality based on the training data set. The observed percentages were calculated based on the number of patients within each value of score. The predicted percentages were based on the estimated logistic regression model. It shows that the scores predictability of mortality with actual mortality was similar. Relationship of score with predicted vs observed mortality in the training data set.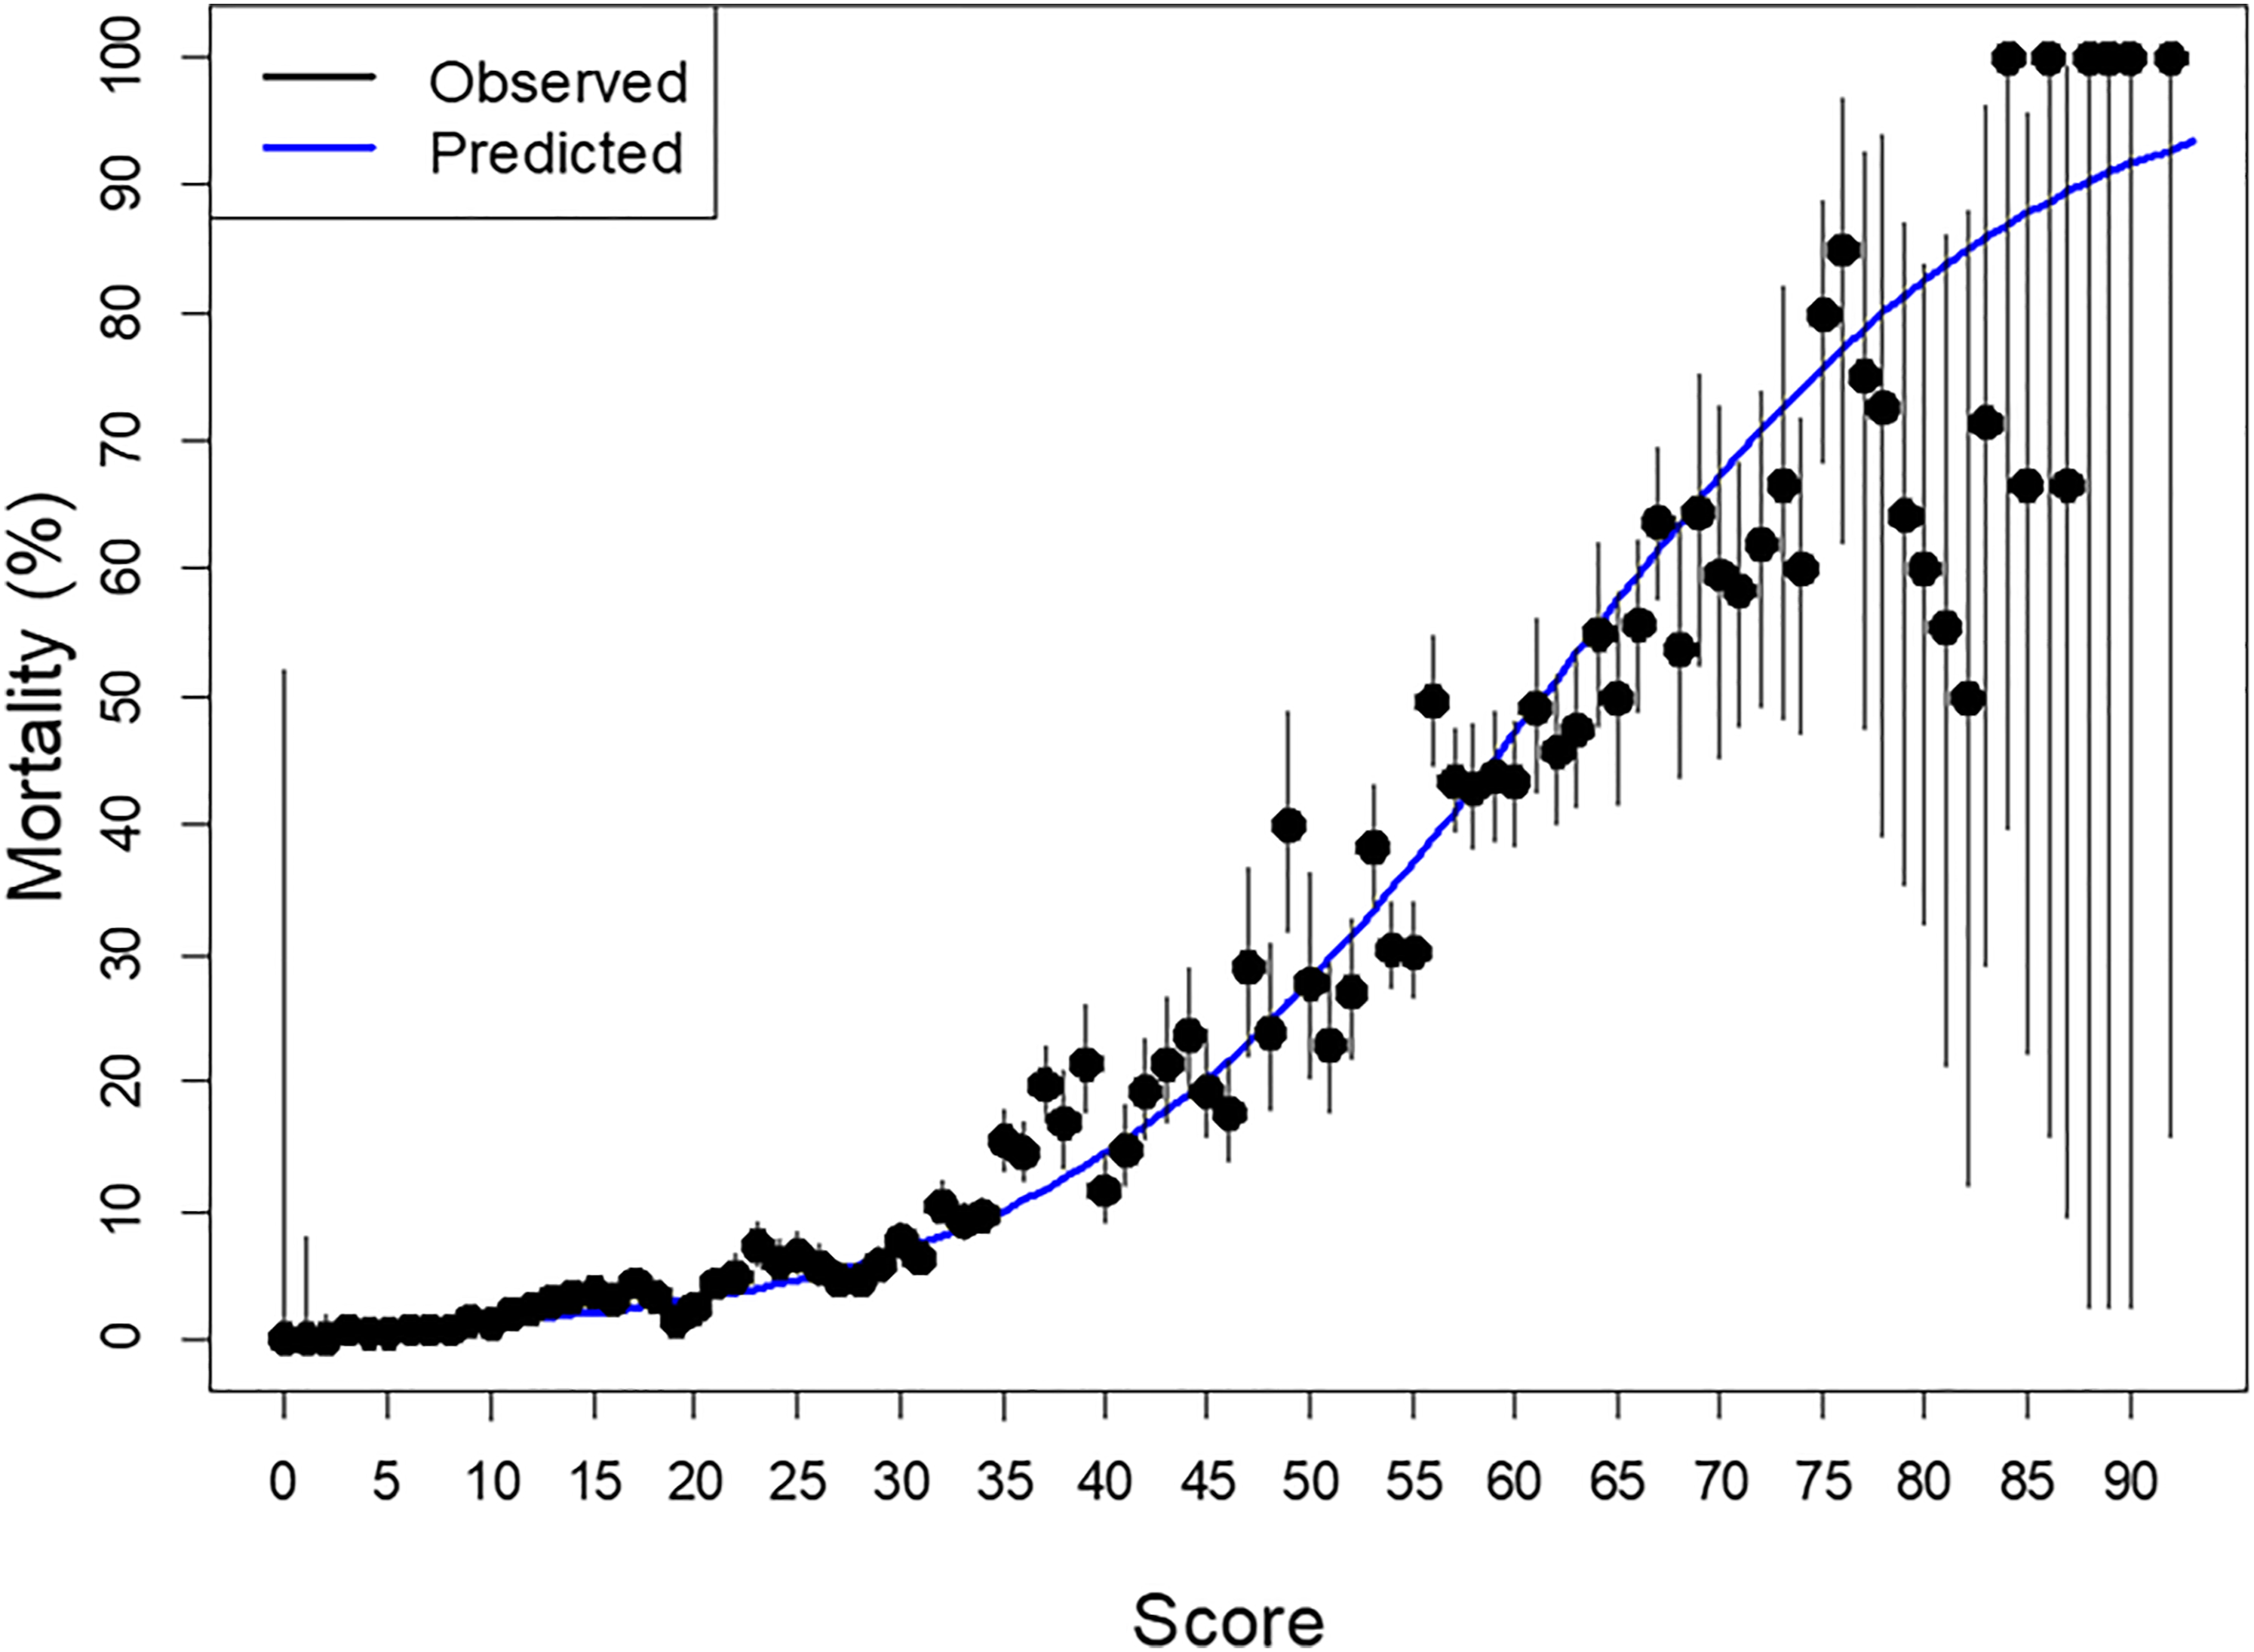
Figure 4 shows the predicted percentages of mortality based on the training data set (labeled with “Training Data Set” in blue line, 80% of the data). The predicted percentages were based on the estimated logistic regression model. The observed percentages were calculated based on the number of patients within each value of score in the testing data set (labeled with “Testing Data Set” with black line, 20% of the data). The figure shows that the training data set mortality falls within the confidence interval of the testing data set in relation to scores. Observed probability of mortality in testing data set and predicted mortality in training data set by the risk score.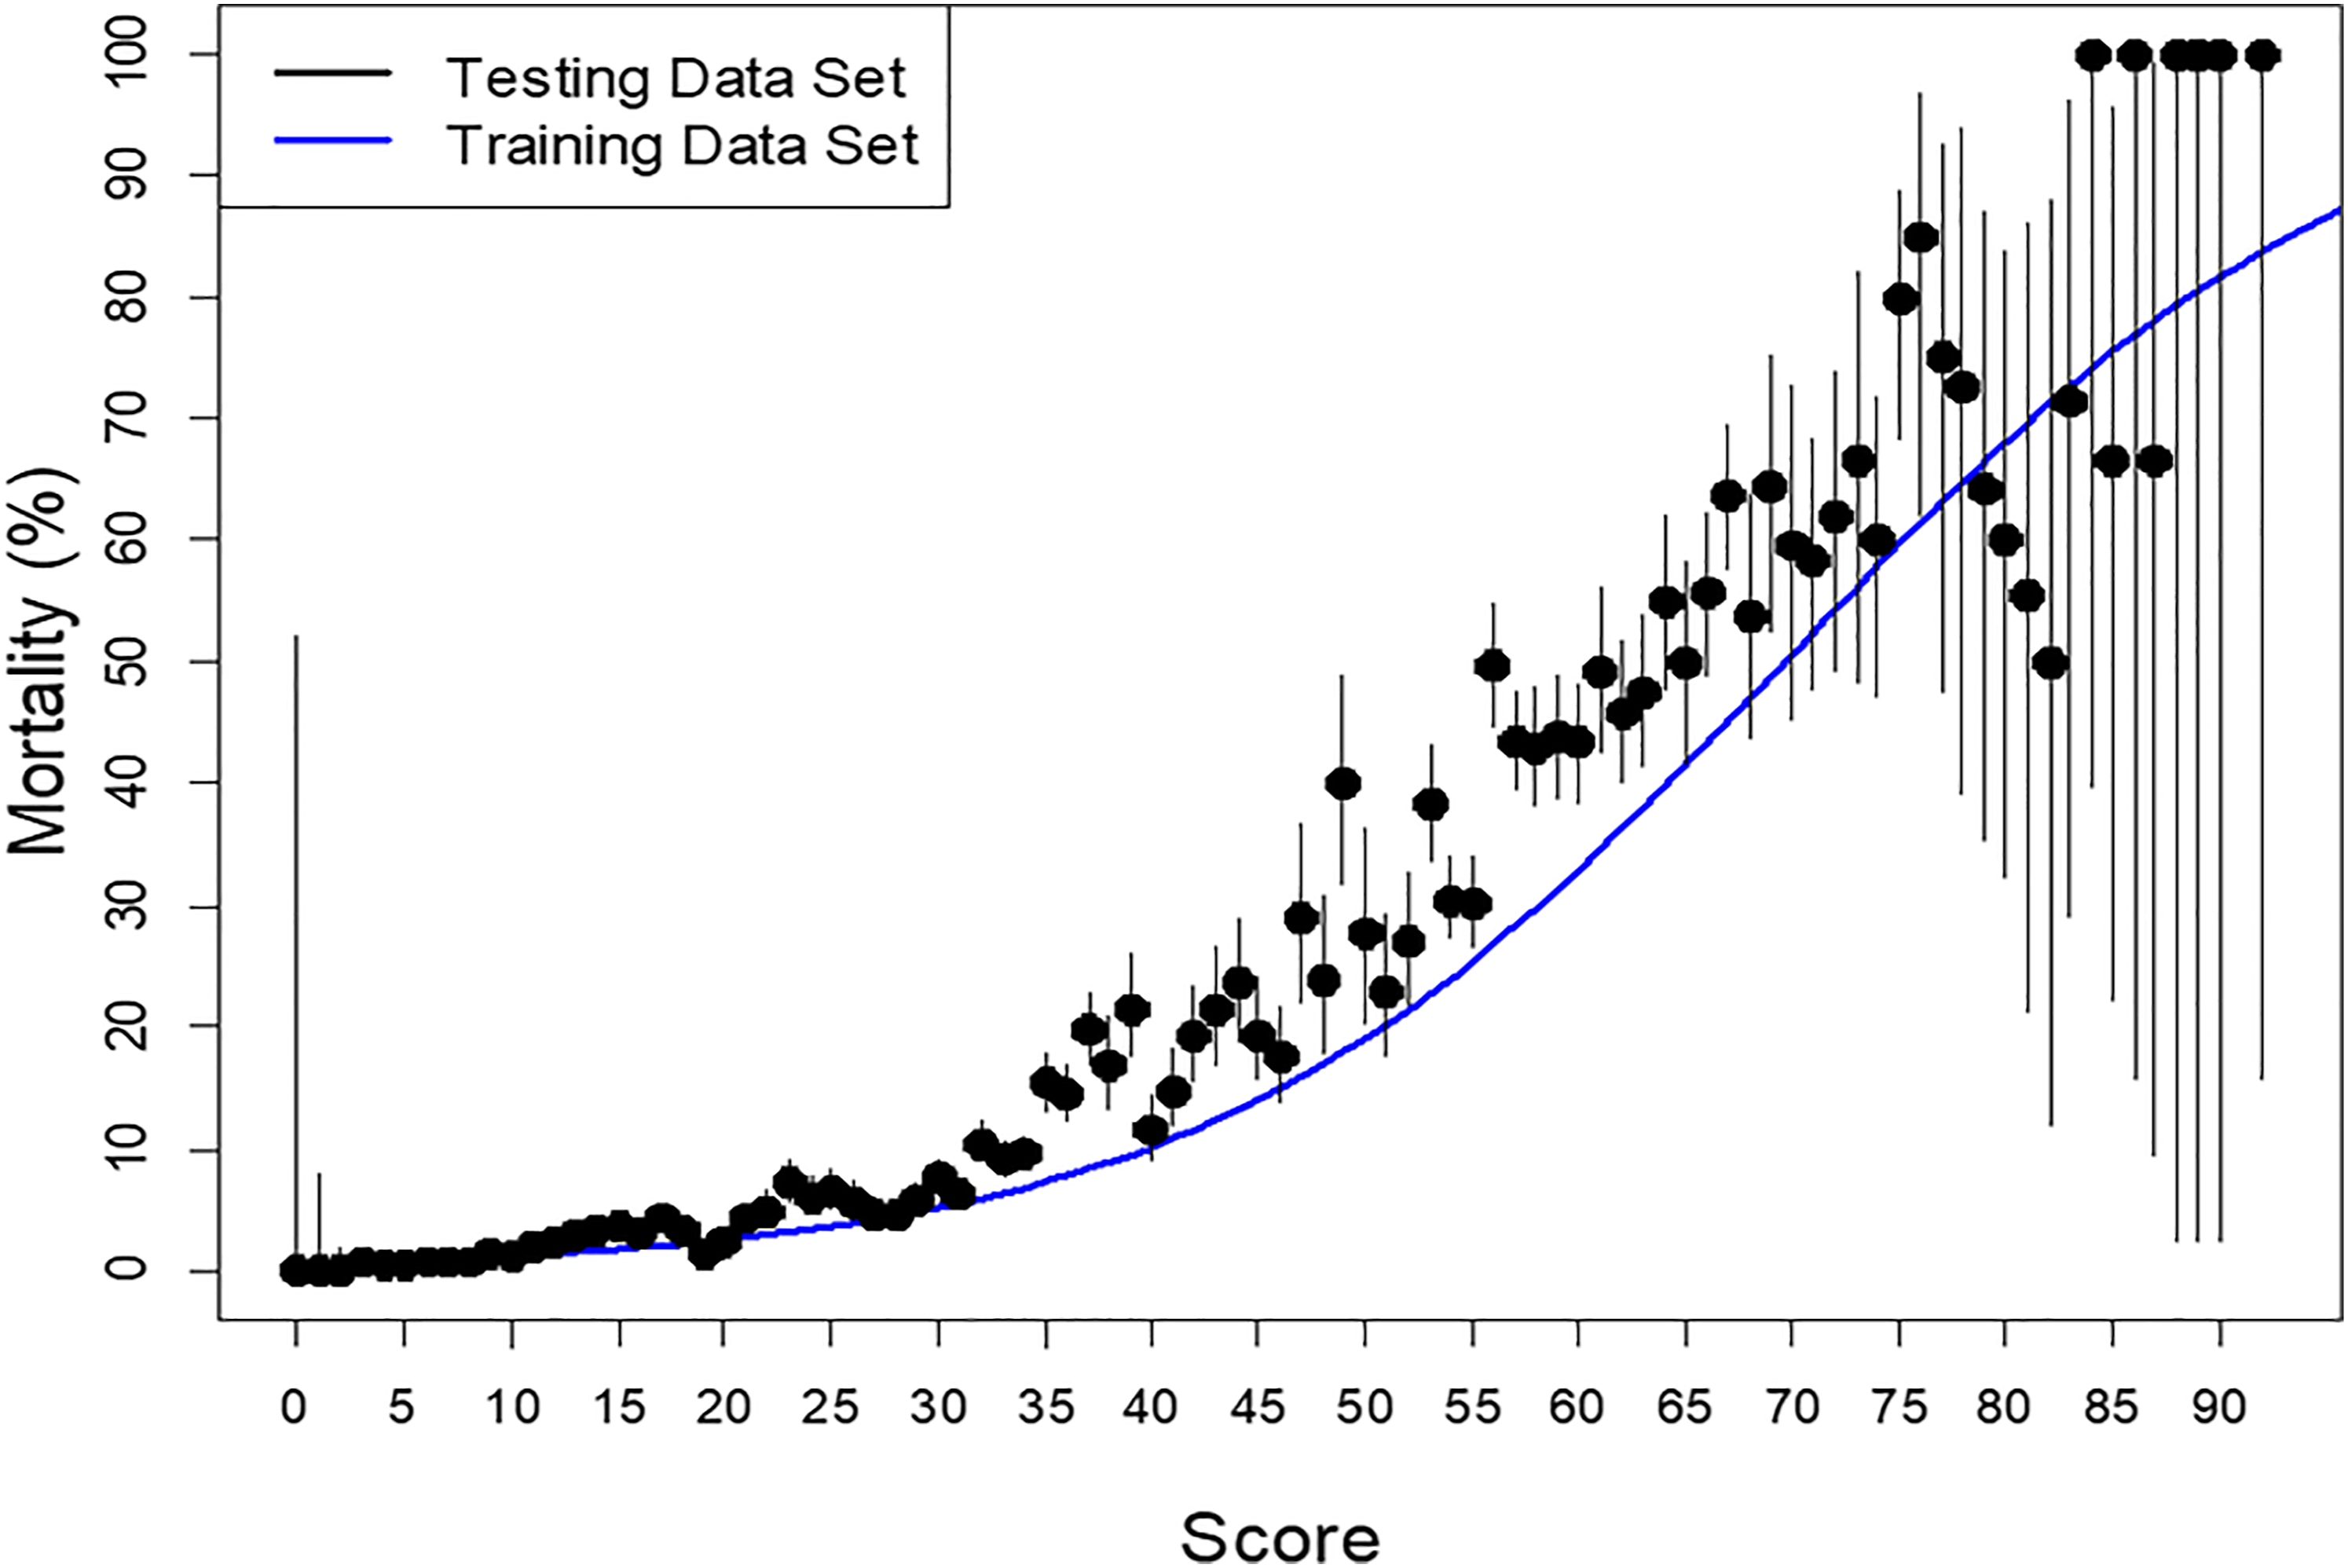
Discussion
The study showed 4.5% of trauma victims died and 95.5% survived. Advanced age, male sex, Asian race, lower GCS, higher ISS, and certain comorbidities have highly correlated with mortality.
The development of risk score from the training data set and further validating with 153,676 (20%) randomly selected data set showed that the model predicts mortality from .59% to 99.99%. When the comparison of variables was performed between the training data set and testing data set, we found no difference between the two data sets on patients’ characteristics, injury type, severity, comorbidities, and overall mortality (Table 3). We tested the TMS in the training and testing data set and found no obvious difference in predicting mortality.
Our risk model takes into account all the previously known factors of mortality11,20-24 and added new variables (race and comorbidities) that increase the predictability of mortality. Some of the previously reported factors that have been directly related to mortality, for example, ISS score alone may not necessarily predict the mortality accurately.25,26
The previously developed RTS takes into account only GCS, systolic blood pressure, and respiratory rate. 8 RTS was developed more than 30 years ago mainly for triaging injured patients to transport to either specialized trauma center vs non-trauma center. Later, another score was developed around the same time adding age into the other factors making it more robust. 9 About 10 years later after developing RTS, the same group came up with another score, A Severity Characterization of Trauma (ASCOT) score. The authors claimed a better scoring system in blunt mechanism. 10 However, ASCOT was not good for predicting mortality in penetrating injuries. Our TMS system showed improvement in predictability of mortality in blunt and in penetrating injuries as well when compared with TRISS and ASCOT scoring. The AUCs of TMS, TRISS and ASCOT were 0.892 (95% CI: 0.888-0.896), 0.864 (95% CI: 0.859-0.869) and 0.841 (95% CI: 0.835-0.846), respectively, in blunt injury. Similarly, TMS prediction was better in penetrating injury when compared with TRISS and ASCOT. The AUCs were 0.949 (95% CI: 0.940-0.958), 0.942 (95% CI: 0.934-0.951) and 0.924 (95% CI: 0.912-0.936), respectively. Although the TMS has better predictability, the differences in AUC are not huge. The counterargument is that adding comorbidities which is one of the contributing factors in patient mortality helps identify those patients who are likely to die or survive based on the patient’s prior history. For example, if a 50-year-old Caucasian patient is presented with GCS score of 15 and ISS of 14 would have a 3.43% mortality risk without any comorbidities, whereas the same patient with an only history of cirrhosis would increase the probability of death to a 12.98%. Therefore, it is important to realize that certain comorbid conditions can lead to an increase the mortality many folds as evident by the above example.
All above studies included some variables of the anatomical distribution of injury, physiological characteristics, age of the patient, and mechanism of injury. However, none of them considers the pre-existing condition of the patient that can impact the outcome of the patients.27,28 Our novel scoring system, TMS, is one of the most comprehensive scoring systems to date that includes patients’ demography, mechanism of injury, severity of injury, some physiological parameters, and comorbidities to identify the risk of in-hospital mortality. Our study added age into a different category instead of dichotomized the age at 60 as other had used it. 11 We analyzed the TMS to find the predictability of mortality in observed vs expected mortality and the scores were most part falling in the midline. When TMS was compared with actual mortality in testing and training data set, the predictability of the testing data set was close to training data set findings. Availability of TMS calculator to the point of care physician helps the physician to determine the prognosis of the trauma patient early and in certain circumstances, early involvement of palliative care consultation (Supplement Figure 1).
The first trauma scoring system was introduced almost 40 years ago. To this date, our community is still searching for a better scoring system to determine the mortality of trauma victims which is a testament that a comprehensive scoring system is needed that can not only accurately predict mortality early but is also easy to use by point of care providers. We believe, our scoring system could offer the most up to date comprehensive scoring system to our providers.
Limitations
Our study was performed from the TQIP database but suffered from some limitations. We performed internal validation by randomly selecting the 20% of the data set that showed the same predictability as the training data set. Our data set tried to include every region in the United States and included all races and gender for the generalizability of the predictor model. Our study, however, is lacking external validation.
Conclusion
Our novel TMS accurately predicts mortality in the majority of the trauma victims. TMS predictability is better than TRISS and ASCOT. TMS should be used in place of TRISS in blunt and in penetrating injury as well. Using this scoring system, one can calculate the high-risk patient in all types of trauma patients. This tool will help point of care physicians to allocate appropriate resources for the care of the patient. This scoring system can also help guide the shared decision-making process in certain circumstances.
Supplemental Material
sj-tif-1-asu-10.1177_00031348221078980 – Supplement Material for Prediction of Trauma Mortality Incorporating Pre-injury Comorbidities into Existing Mortality Scoring Indices
Supplemental Material, sj-tif-1-asu-10.1177_00031348221078980 for Prediction of Trauma Mortality Incorporating Pre-injury Comorbidities into Existing Mortality Scoring Indices by Nasim Ahmed and Yen-Hong Kuo in The American Surgeon
Footnotes
Acknowledgments
Elli Gourna Paleoudis, MS, PhD has proofread the article and performed the final editing.
Author’s Contribution
Nasim Ahmed (NA) conceived and designed the study.
NA was responsible for retrieving the study data, while Yen-Hong Kuo (YHK) performed the data analysis.
NA and YHK both contributed to manuscript writing and both were responsible for all follow-up manuscript revisions.
Declaration of Conflicting Interests
The author(s) declared no potential conflicts of interest with respect to the research, authorship, and/or publication of this article.
Funding
The author(s) received no financial support for the research, authorship, and/or publication of this article.
Ethical Approval
All procedures followed were accordance with the ethical standards of the Institutional Review Board of Hackensack Meridian Health and with the Helsinki Declaration of 1975, as revised in 2008. Since the data of NTDB/TQIP are de-identified patient’s information available to the researchers, the study was exempted from Meridian Health IRB review.
Informed Consent
Given this retrospective study was performed from the de-identified National database from the American College of Surgeons that is available to all researchers, this study was exempt from the IRB review as per policy and no informed consent was required.
Supplementary Material
Supplementary Material for this article is available online.
References
Supplementary Material
Please find the following supplemental material available below.
For Open Access articles published under a Creative Commons License, all supplemental material carries the same license as the article it is associated with.
For non-Open Access articles published, all supplemental material carries a non-exclusive license, and permission requests for re-use of supplemental material or any part of supplemental material shall be sent directly to the copyright owner as specified in the copyright notice associated with the article.