
Abstract
We describe the development of a novel versatile optical platform for active and passive remote sensing of environmental parameters. Applications include assessment of vegetation status and water quality. The system is also adapted for ecological studies, such as identification of flying insects including agricultural pests. The system is based on two mid-size amateur astronomy telescopes, continuous-wave diode lasers at different wavelengths ranging from violet to the near infrared, and detector facilities including quadrant photodiodes, two-dimensional and line scan charge-coupled device cameras, and a compact digital spectrometer. Application examples include remote Ramanlaser-induced fluorescence monitoring of water quality at 120 m distance, and insect identification at kilometer ranges using the recorded wing beat frequency and its spectrum of overtones. Because of the low cost this developmental platform is very suitable for advanced research projects in developing countries and has, in fact, been multiplied during hands-on workshops and is now being used by a number of groups at African universities.
Keywords
Introduction
Optical remote sensing and stand-off detection are powerful tools for environmental monitoring and are often claimed as crucial for national management in the developing world as well. Earth observation from satellites produces tremendous amounts of high-quality data which in many cases can be obtained free of charge when good purposes of usage are outlined. Yet it remains a fact that only a fraction of the data is ever evaluated and major space agencies continue to underline the unexploited potential of remote sensing data for local management. The mere understanding and proper use of satellite data requires deep insight into optics, physics, and spectroscopy on the university level, and in many cases on the postgraduate level. Hands-on experience on instrumentation, basic and advanced concepts of optical remote sensing is, for example, from an African perspective, reserved for the scientists in the large space organizations or laboratories with entirely different funding than that available to African academic institutions. As an example, the entire African continent until now, as far as we know, only had one operational atmospheric lidar (light detection and ranging; in Pretoria, South Africa) with basic configuration. 1
Our group has actively worked in collaboration with African physicists over the last two decades in projects involving, for example, fluorescence monitoring for medical and environmental diagnostics, and optical microscopy techniques for malaria diagnostics,2–7 realizing the demands for hands-on experience and capacity building. To enhance capability in the topic of remote sensing within the African Spectroscopy and Imaging Network (AFSIN), 8 we recently organized a workshop in Nairobi, Kenya, with participants from African academic laboratories. During the two weeks, we assembled seven instrumentation platforms which could serve both as front-edge research instruments as well as training in elementary calibration procedures and aspects of remote sensing equipment and methods.
In this paper we describe the new instrumentation and demonstrate the capability of cost-effective modern electro-optics in the context of remote sensing and stand-off detection. To our knowledge, we report the first African remote fluorescence spectroscopy, with examples of vegetation and powder marked atmospheric insects, first African remote fluorescence imaging on a test target and vegetation, the first African remote Raman spectroscopy for water purity assessment, and also first African kHz lidar for atmospheric profiling, for example, of the atmospheric fauna.
Instrument and System Configuration
We describe in this section the novel optical remote sensing platform which we have developed. A general layout of the system is shown in Fig. 1, and different operational modes possible with the system are possible as will be discussed. We will start by describing the optical telescope arrangements including mechanical components, discuss the different laser sources employed, describe the detector arrangements, and finally present the electronic components and the software for system steering and data evaluation. Our description is kept reasonably brief; detailed information for reproducing the setups is available from the authors.
Left: Several mounted systems during training workshop in Nairobi, Kenya by African Spectral Imaging Network.
8
Right: Setup drawing. The reconfigurable setup is constructed on a dual telescope cross bar mount, carried by an equatorial telescope mount. A large aperture Newtonian reflector and a smaller aperture refractor are attached. While the setup can be directed at different target using the equatorial mount, the co-alignment of the tubes can be achieved by a tangential mount, an XY translator or by primary mirror adjustment. Focus stages on each telescope control the divergence of the field of view and laser beams. An assembly of detectors and diode laser can be inserted in either focal plane.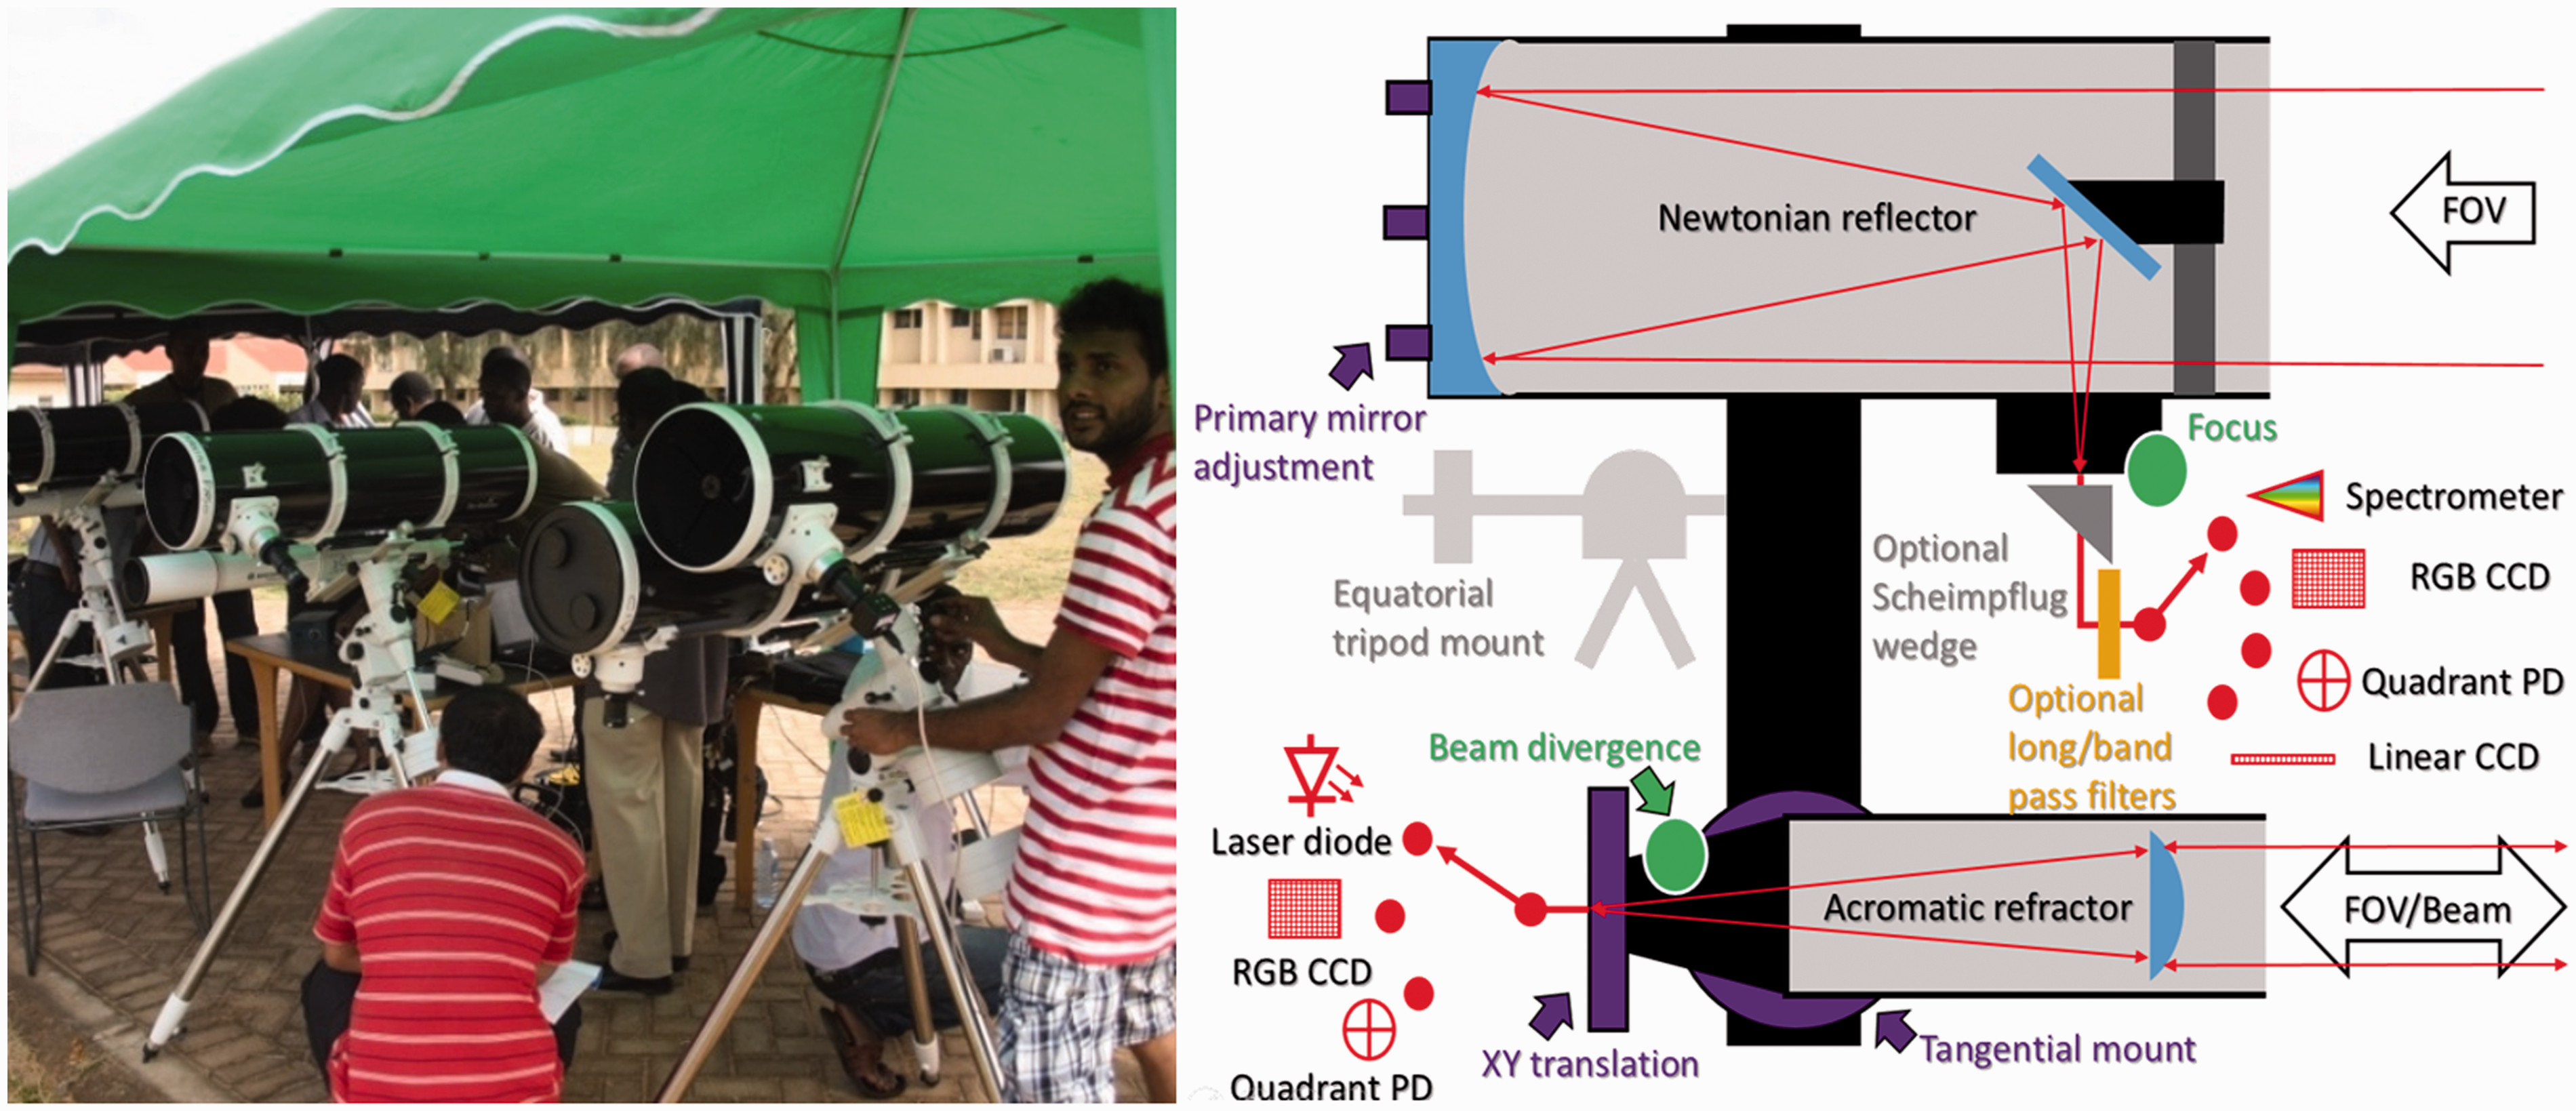
Optics and Mounts
Key components in the system are two amateur astronomy telescopes employed for transmission of laser radiation and for back-scattered light collection. The use of this type of readily available equipment is a key aspect in keeping the total system cost down. The main telescope is a 200 mm diameter, f = 800 mm Newtonian reflector unit (SkyWatcher Quattro 200/800). The smaller unit is a 102 mm diameter, f = 500 mm apochromatic refractor (StarTravel AC 102/500). The telescope assemblies are carried by a SkyWatcher equatorial mount; model EQ6 suitable for up to 20 kg of payload, readily upgradable to EQ8, with 50 kg payload. The tubes are mounted side by side using a Teleskop-Service 40 cm dual mount cross bar. Co-alignment is provided by a Baader, Stronghold tangential mount (later upgraded to a Geoptik, GK2 unit), as well as an Orion XY guide star translator in the image plane. The receiving telescope can be supplied with colored glass long-pass filters (Schott GG435, GG475, RG780 ø50 mm), and a ø 50 mm 808 nm, 10 full width at half-maximum (FWHM) bandpass filter (Knight Optical/Edmund Optics). A custom-made 45° wedge was machined in metal for using the line-scan cameras in Scheimpflug condition in respect to the transmitting telescope. For Scheimpflug applications we also refer to Brydegaard et al. 9
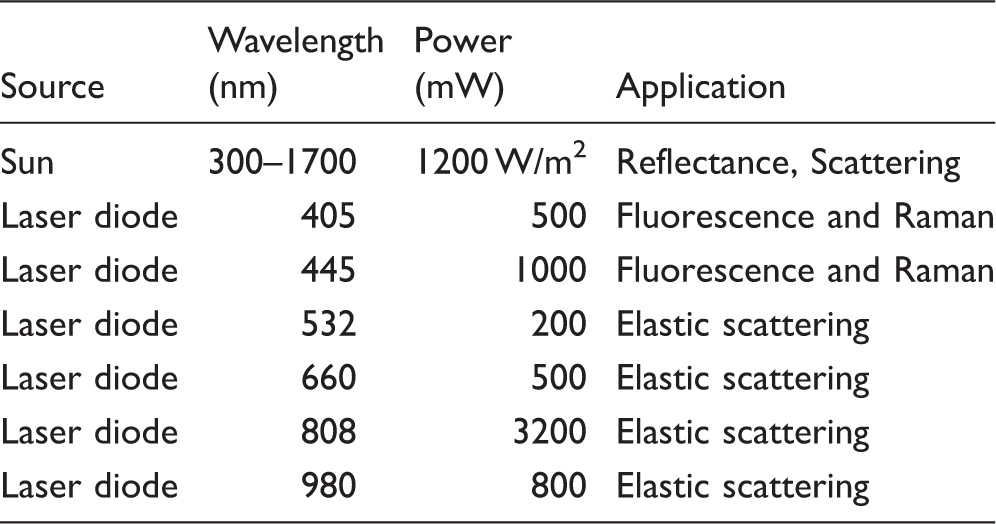
Illumination Sources
Light sources employed for passive and active optical remote sensing.
Detectors
As for the amateur astronomy telescopes and the diode lasers discussed above, powerful but low-cost point-monitoring, spectral, ranging, or imaging detectors could be employed in the project. Scattering of sunlight or from a continuous wave (CW) laser due to an insect flying into the field of view (FOV) of the receiving telescope can be adequately detected with an a F/4 telescope and a Si–InGaAs photodiode as previously reported, 10 e.g., K1713-09, Hamamatsu. By employing a quadrant detector, the flight direction of an insect can be assessed as discussed below and this is also discussed by Gebru et al. 10 We used Si S4349 and InGaAs G6849, Hamamatsu quadrant detectors in the present work. Imaging along the transmitted laser beam can be achieved using the Scheimpflug concept discussed in Brydegaard et al. 9 and below. We used a GigE Spyder3 line scan camera from DALSA Teledyne (2 × 2048 pixels). Later, similar USB sensors from Mightex and Alphalas were used. Finally, two-dimensional (2D) imaging through the telescopes could be accomplished by using a USB VGA RGB CCD from Orion and later a USB3 2 MP camera from Lumenera (Lt225).
Full spectral detection could be achieved by using a fiber-coupled compact spectrometer (OceanOptics: USB4000) yielding spectra in the range of 300–1100 nm, with low but sufficient spectral resolution, while collecting much light through its 200 µm wide slit. The spectrometer, which is the single most expensive piece of equipment in our setup, could be replaced by similar less expensive devices from a number of producers. We note that the spectrometer now employed is very similar to the one used for in situ fluorescence monitoring with fiber-coupled units employed widely in developing country contexts,2,3,11–13 but now provides remote data acquisition by using the telescope arrangement.
Electronics
Signals were originally collected by a USB data acquisition board (DAQ, National Instruments, NI USB-6009, 48 kHz and later by a USB6211, 250 kHz). A front end quad transimpedance amplifier (TIA) is constructed in a die-cast aluminum box adjacent to the photodiode by using LM324 or OPA404 operational amplifiers. With feedback resistors in the range of 56–82 MOhm we typically achieve 3–5 kHz detector bandwidth; 14 however, atmospheric frequencies can be observed beyond that, for example, from insect wing-beat, since the detector response only implies a weak attenuation slope towards higher frequencies. 15 This configuration allows remote retrieval of wing-beat modulation spectra of atmospheric insects.
Software
The equipment is controlled by either Ocean Optics’ SpectraSuite, National Instrument’s LabView, MathWorks’ Matlab, or GNU Octave commands. LuCam and DALSA’s QuickCam software were supplied with the camera units. Most cameras and sampling boards can be interfaced using more low level C-coding. Data analysis and visualization were performed in Matlab but could equivalently be performed in the open access alternative; GNU Octave. Large data sets can be recorded, which is necessary when studying range resolved flying insects where a high sampling rate is needed to follow the wing-beats. The raw data from a kHz lidar is on the order of 100 Gb/day, but become significantly smaller once relevant insect observations have been cropped out. Data are typically stored on a 2 TB USB3 hard drive (Samsung, MyPassport).
System Characteristics
Operation modes possible with the equipment described.
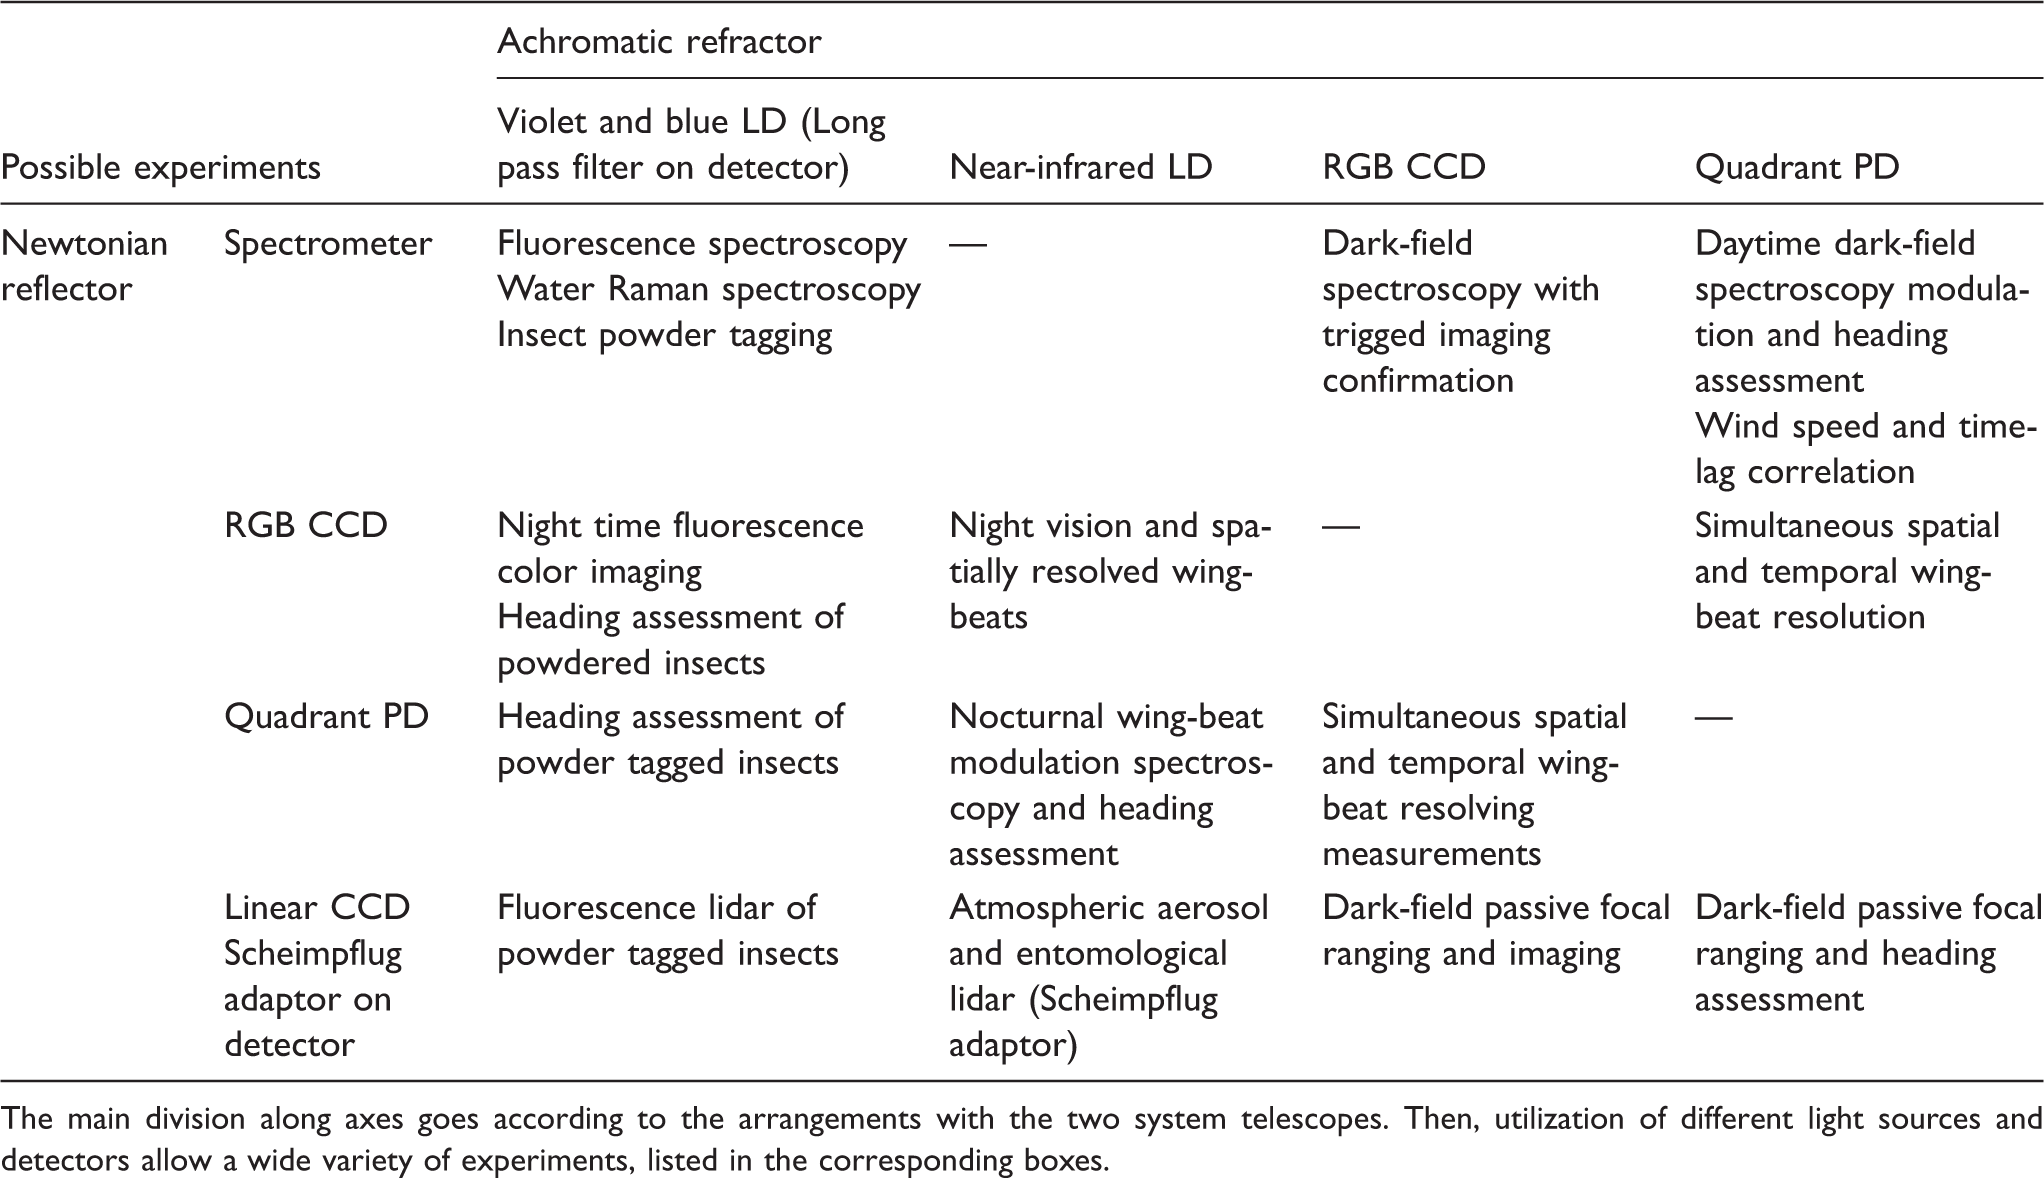
The main division along axes goes according to the arrangements with the two system telescopes. Then, utilization of different light sources and detectors allow a wide variety of experiments, listed in the corresponding boxes.
Examples of Areas of Application
In this section, we will briefly describe nine types of remote sensing applications of the new low-cost developmental platform. The first cases use ambient light for monitoring flying insects, 17 followed by descriptions of different experiments ranging from insect wing-beat studies to fluorescence characterization of vegetation, 22 and assessment of water quality by Raman spectroscopy. Background material to this work is given in insects,16–20 vegetation,12,13,21 and water.22–25
Dark-Field Passive Monitoring of Scattering Objects Entering the Telescope Field of View Using a Photo Diode
One very straightforward and simple application is to use the reflector telescope only in a dark-field geometry, as previously described in Runemark et al.
26
and Gebru et al.
10
The telescope is arranged to look into a remote body, made as dark as possible. For this operation, an opened barrel-shaped structure was constructed from black cardboard. When the telescope looks into the black cavity, which is shaded from daylight, the detector ideally does not record any signal. Any object passing the FOV would then produce a clear scatter signal rising from the zero background. For insect observations, this produces small oscillatory burst in the optical cross-section similar to those recorded in the laboratory in transmittance mode.27,28 Clearly, direct sun illumination impinging on the FOV is preferable, but diffuse sky radiation may sometimes be enough. To convert the detected light levels into optical backscatter cross-sections, we first dropped cellulose spheres of 24, 16, and 10 mm diameter as well as Teflon spheres of 25, 12, and 6 mm diameter through the FOV. The spheres are assumed to be white, Lambertian reflectors. Recordings are shown in Fig. 2 after calibration. The FOV is not necessarily at focus at the calibration distance. Therefore the events observed when the spheres fall through the probe volume is approximately Gaussian rather than top-hat in time. The calibration is based on replacement of the temporal Guassian impulse with a temporal square impulse (infinitely focused point scatter) having identical area and FWHM. The intensity (in volts) of the pulse height in conjunction with the known projected area of the different spheres is used as a calibration factor to convert from volts to cm2. The calibration is valid in the vicinity of the calibration range (in our case 70 m), which is also the distance to the subsequently controlled released insects.
Illustration of dark-field recordings for the case of absolute optical cross-section determination using white spheres of different size passing the telescope FOV.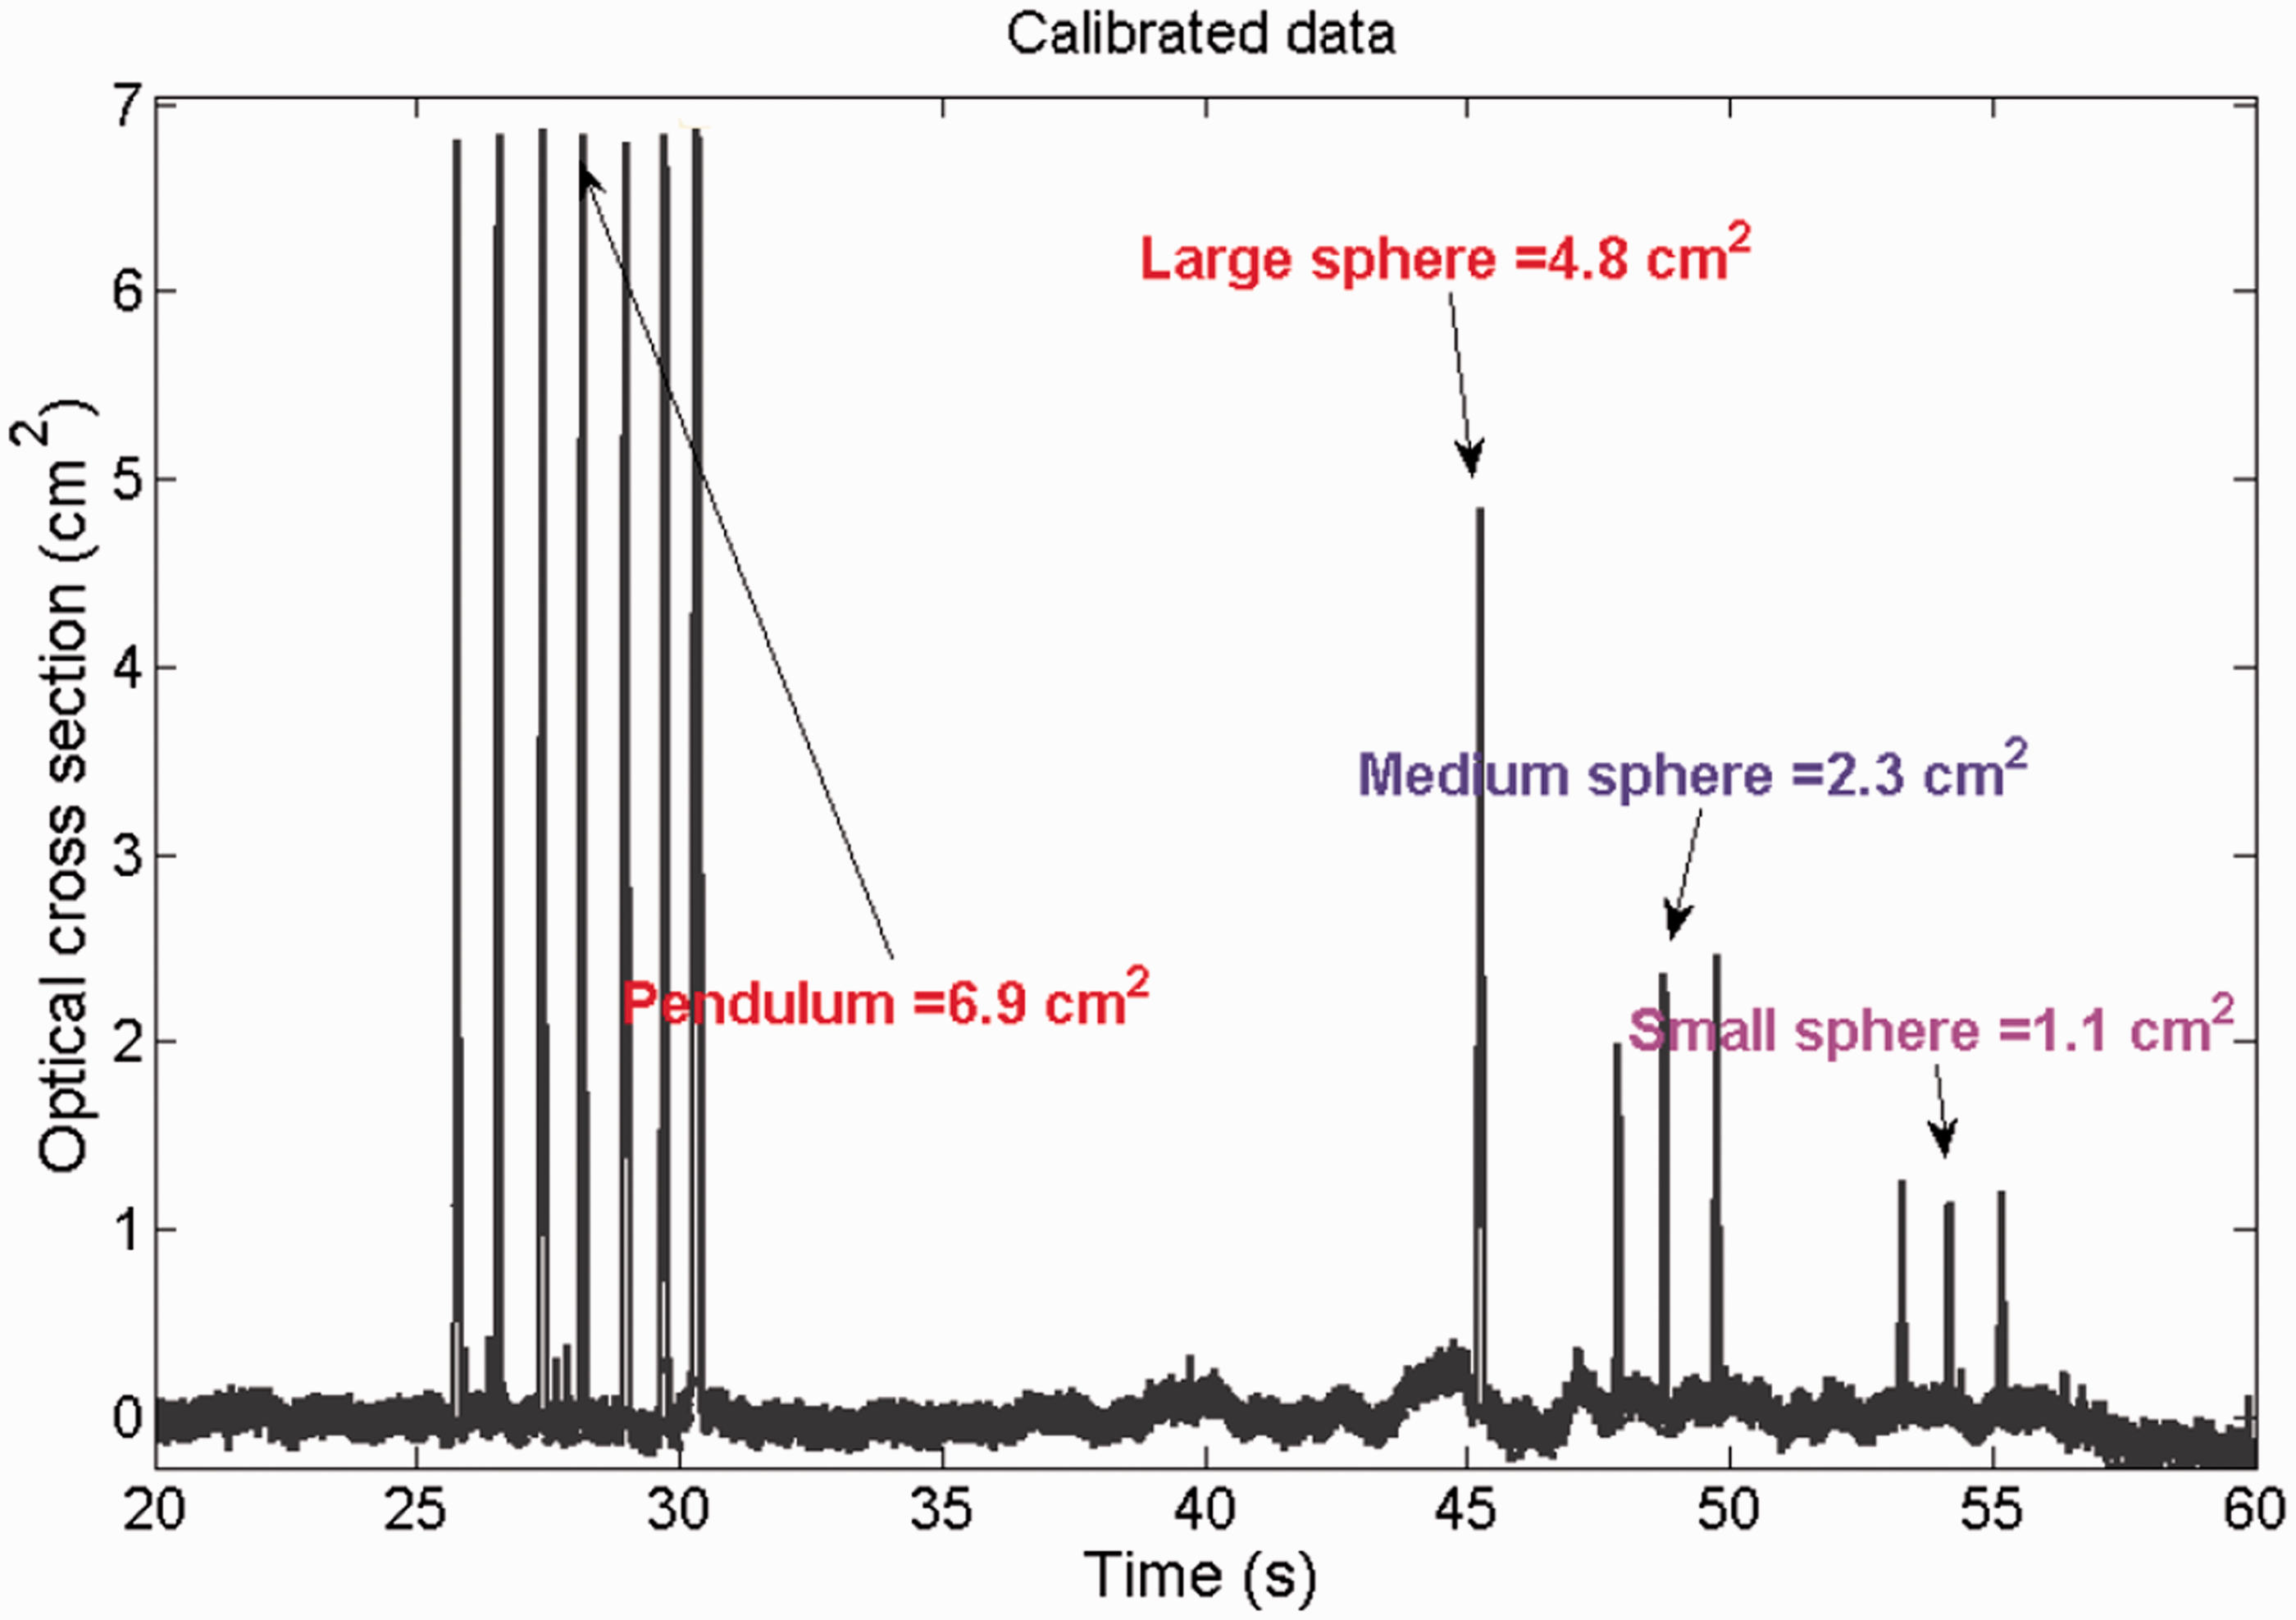
A long stick mounted on an inverted pendulum is used to determine the orientation of quadrant detector segments. This arrangement sweeps the stick through the entire FOV in a reproducible way. This allows adjustment of slightly different gains of the different quadrant segments (flat field calibration) and provides a mean of quantifying the varying sunlight power impinging on the FOV during the day in long-term recordings. The observation is in our case made over a 120 m distance into the black termination for sunny weather conditions, and the calibration and release site is half way at 70 m (at the ICIPE campus, Kenya). An unknown object, like an insect flying into the FOV could then be characterized by its cross-section size, which is determined by its projected geometrical size times its reflection/color for the effective band. The simple photodiode used in these demonstration experiments can be replaced by an optical fiber connected to the system compact spectrometer. Then, the spectral reflective contents (the color) of the object can be assessed, as illustrated in Runemark et al. 26 Absolute spectral reflectance is obtained by subtracting the static signal and dividing recorded spectra by the scattered spectrum from a white sphere with known size. Powder dyes for insect tagging are frequently used in entomology 29 as also illustrated below in Section IV D. For validation of dye signatures in the now illustrated dark-field reflectance mode, spheres can be dusted with the dye powder used for tagging insects, as illustrated later.
Dark-Field Passive Recording of Flying Insects Using Quadrant Detector for Flight Heading Assessment
Our second application example uses the same general setup as discussed in the preceding section, with the difference that a quadrant InGaAs photodiode is used as a detector in the focal plane of the reflecting telescope. In general, the SWIR (900–1700 nm) band covered by InGaAs photodiodes gives one order of magnitude higher signals from insects than Si photodiodes covering the visible and NIR (300–900 nm) region.9,30
This case also illustrates very high temporal resolution recordings, allowing the resolution of fast time structures. An example of an insect predating event is shown in Fig. 3, which was recorded in an experiment in Stellenbosch, South Africa. The recordings were made over a path length of 101 m to the black termination point. Data in Fig. 3 show first the passage of a small insect with a high wing-beat frequency (about 125 Hz) through the FOV at time 0.30 s, pursued by a larger insect, with lower wing-beat frequency (about 85 Hz), passing at time 0.85 s. This supports our understanding that insect observation in a confined air volume are not random in time, but the presence of one insect, for example, a mate, predator, prey, or a rival, alters the likelihood of observing another insect in the time shortly before and after. Although conclusions from a single predation event might be difficult to draw, recording massive amounts of observations on the order of 104 per hour and cubic meter
9
can form the basis for large scale statistics and time lag correlations
26
for accessing interaction strengths and interactions between species and genders in situ.
Dark-field recording of two insects passing the telescope FOV with 0.65 s separation. The size of signals, the time duration, and the frequency of wing-beat frequencies indicate a first smaller individual pursued by a faster, larger insect. The same flight direction is ascertained by studying the temporal sequence of structures as read out by the four different segments of the quadrant detector employed.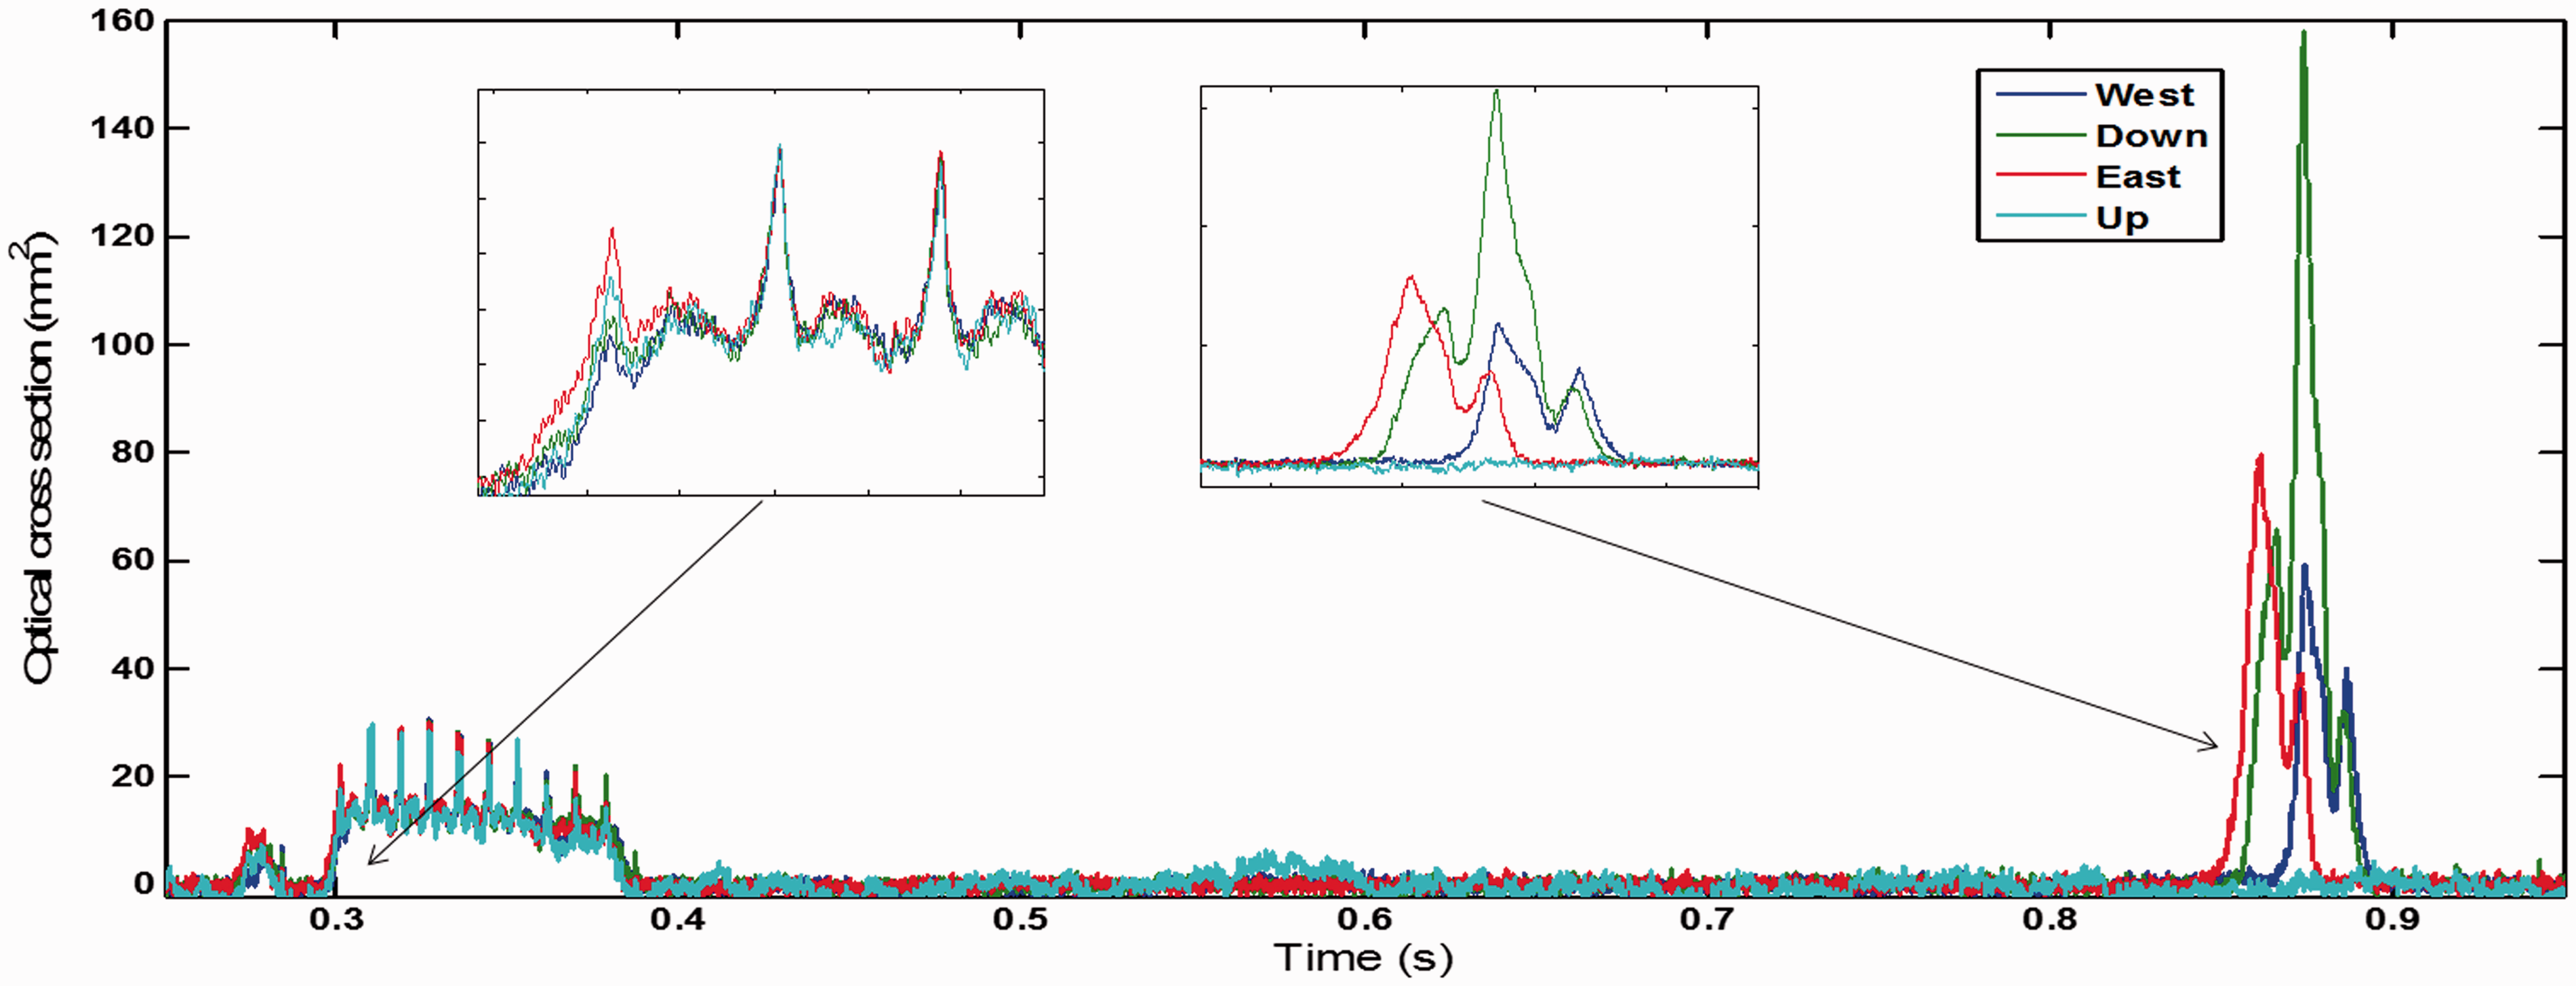
Data from the four individual sectors of the quadrant detector are given with color coding, and are shown in expanded insets for clarity. From the rising and falling flanks of the insect events, the directionality of flight can be inferred, further confirming the chasing patterns for the individuals. Both enter the FOV from east and leave towards west.
Effective use of a quadrant detector clearly requires calibration. A swinging pendulum, such as used in the previous section, can then be utilized to assess the quadrant orientation and for performing segment equalization. As discussed, variations of dark current and gains between quadrant segments are normalized by sweeping the pendulum equivalently through the FOV of each quadrant. The pendulum can then be released, for example, from west to east, whereby the detector orientation can be determined from the time lags. For long-term dark-field monitoring, the pendulum can persistently be released every 30 min for also quantifying the radiance impinging on the field of view, as the sun moves over the sky. The fixed position and dynamics or the pendulum ensures a consistent and repeatable sweep through the FOV for each release.
Detailed Study of Insect Wing-Beat Harmonic Structure in Passive, Dark-Field Recordings
We discussed in connection with Fig. 3 how wing-beats can be observed as a modulation in the signal observed with a silicon quadrant detector, and how even heading can be inferred from observed time-lags between quadrant segments. We will now more in detail study wing-beat modulations by recording the signal with a sensitive segment-binned quadrant detector and very fast signal digitization. The full modulation spectrum including wing-beat harmonics have previously been demonstrated as a mean of species classification.27,28 Figure 4 again illustrates a predating event observed with passive dark-field detection over a path length of 120 m, at the site of one of our hands-on training schools: ICIPE, Nairobi, Kenya. Rather than displaying the raw data, we give, in the lower panel, a sliding Fourier transform (spectrogram) of the detector signal for a 5 s temporal interval, containing two insect events, one at about 3 s, the other one about 0.5 s later. We note that the first event corresponds to a small insect with a high wing-beat frequency, whereas the second one is larger. The frequency information of the two events is given more in detail in the upper panel, in blue for the early event, in red for the later event. We note that a large number of frequency overtones is clearly discernable in the light scattering signal, corresponding to complex wing movements including specular reflection conditions.
Chasing insects as observed by recorded wing-beat frequencies and the overtone spectra.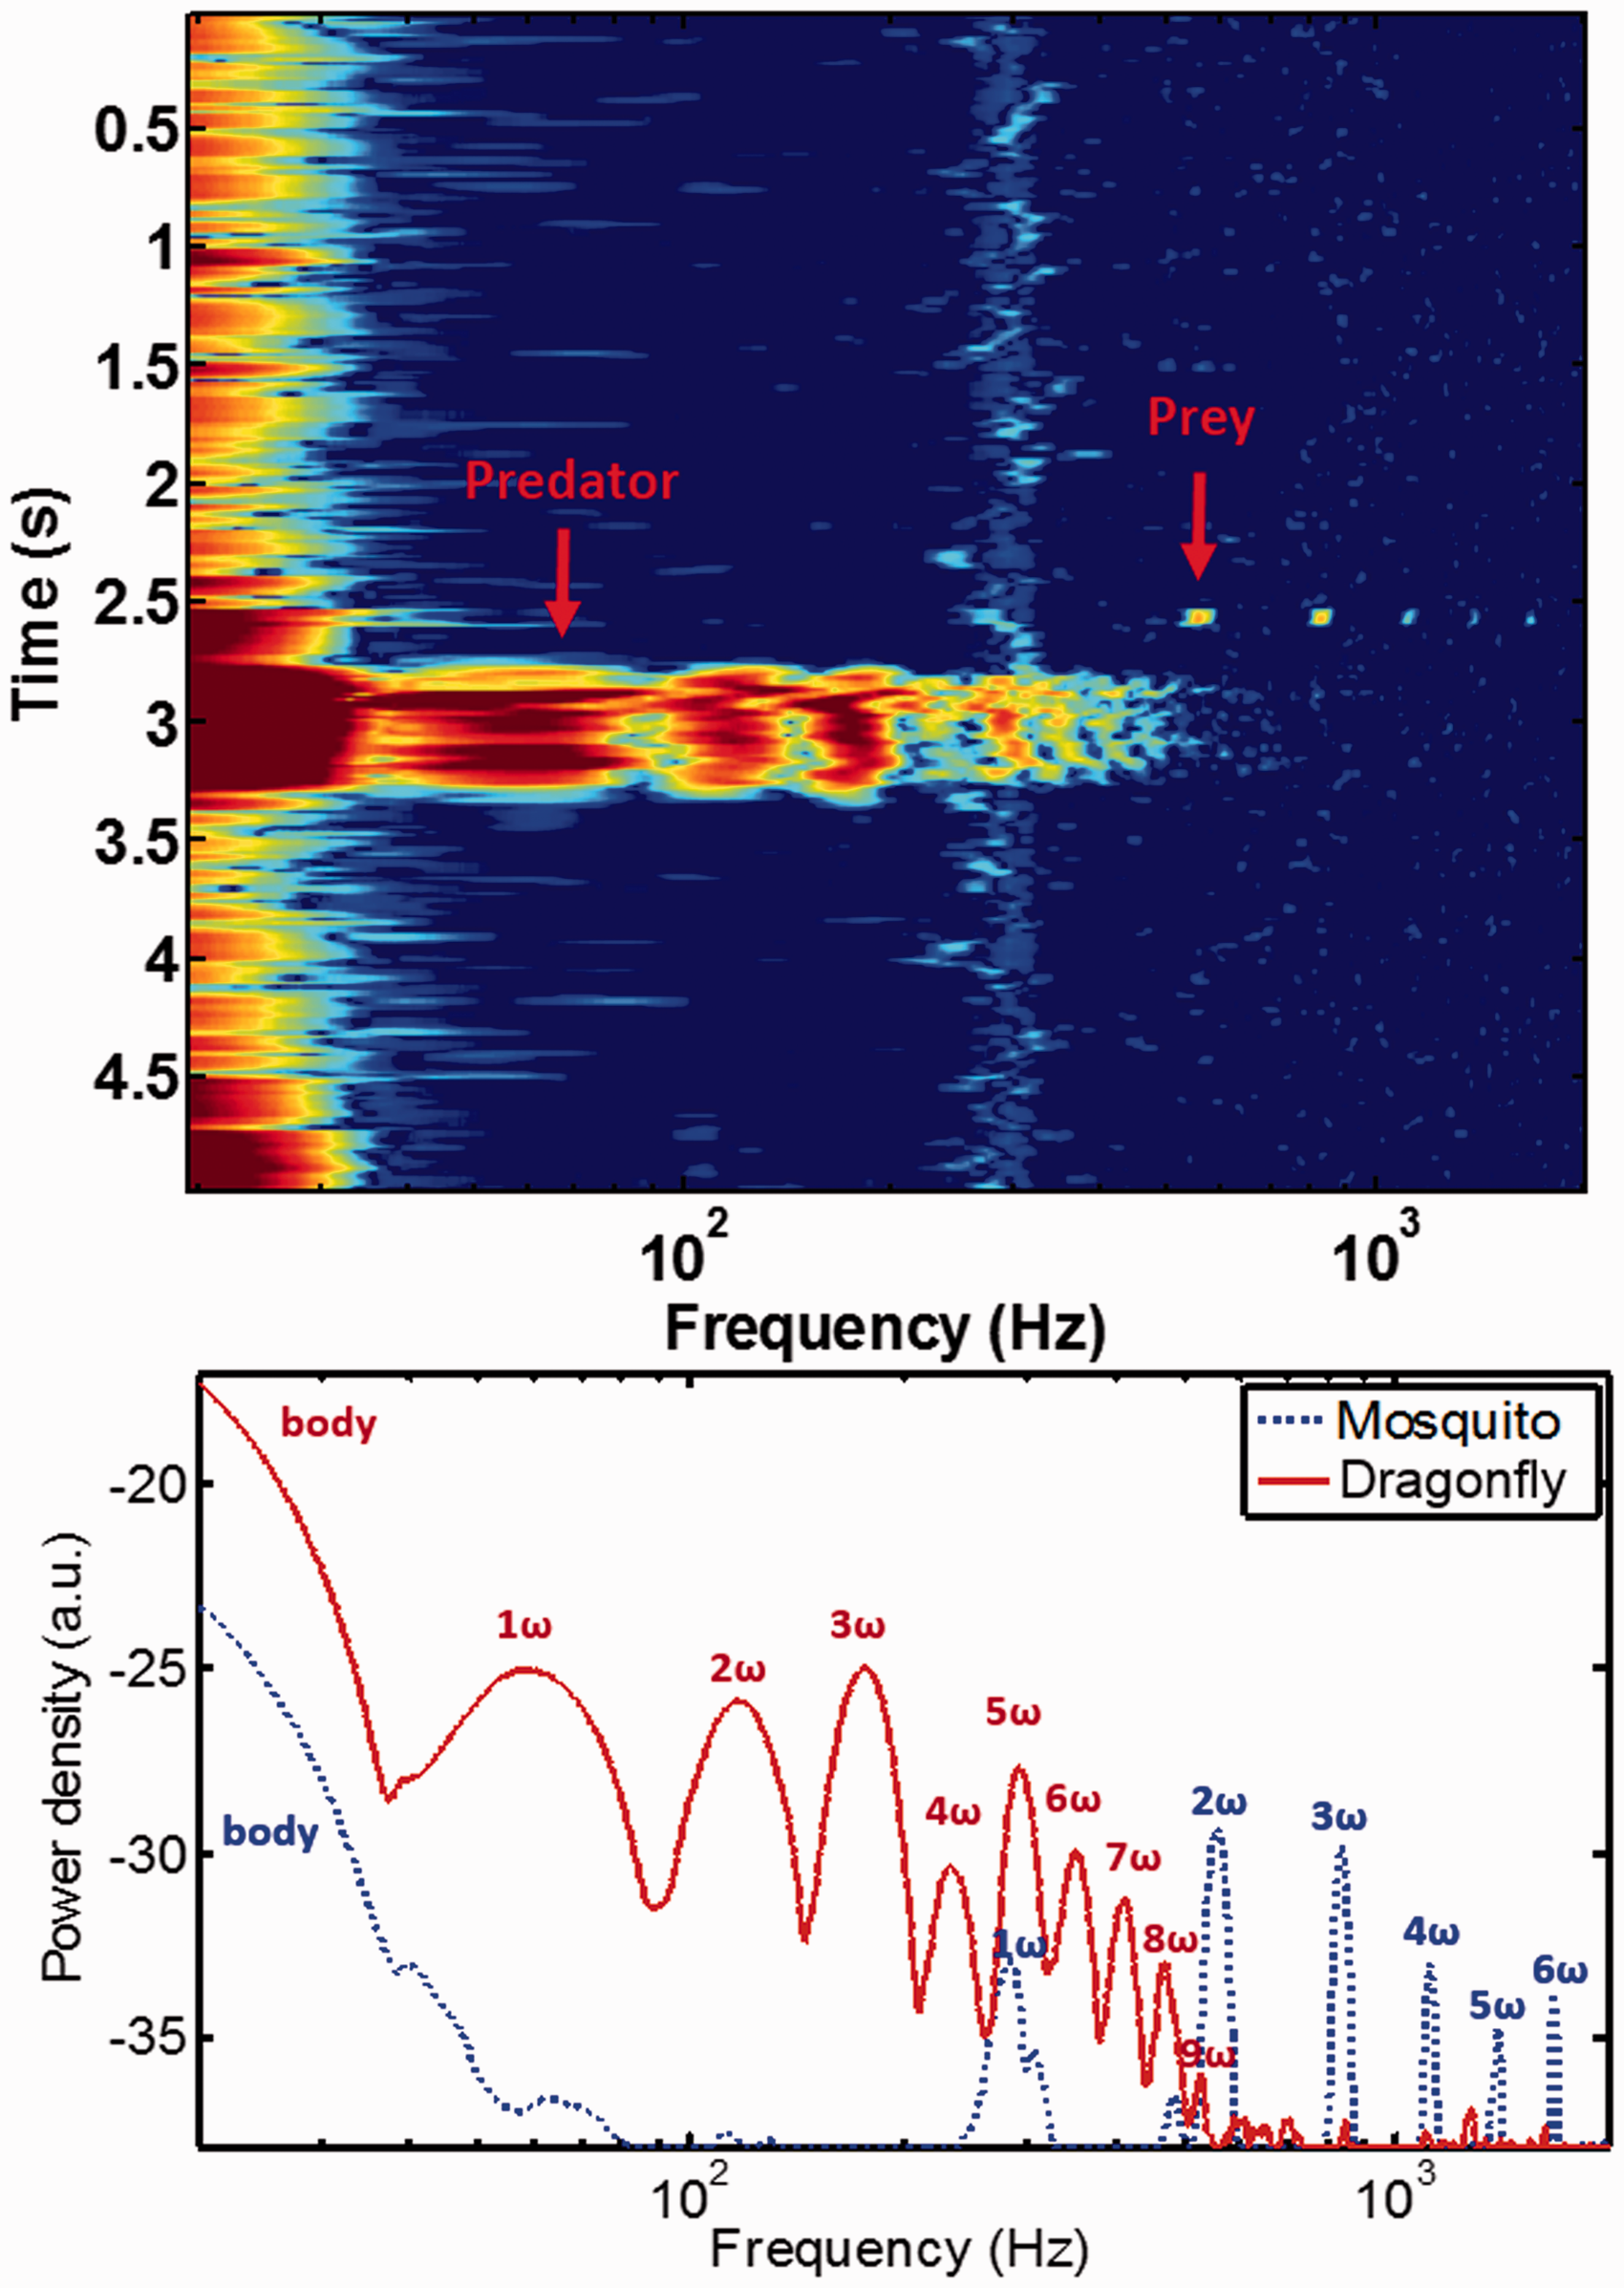
The occurrence of an insect acting as prey in a confined air space greatly increases the likelihood of the occurrence of a predator in the following close time span. A qualified guess from the present fundamental frequencies (first 280 Hz, then 60 Hz) correspond to a fruit fly being chased by a dragonfly. Note, that the second harmonic of the prey is stronger than the fundamental tone, which could indicate perpendicular interception with the FOV. 31 This is in accordance with current understanding of aerial interactions. 32
Fully interpreting the recorded frequency spectra requires a characterization of the detector and detection system frequency response. For this purpose, a NIR 850 nm light-emitting diode (LED) was connected in series with a 330 Ohm resistor to a function generator or analog output of the NI-DAQ device. A sinusoidal modulation is applied. Bias and amplitude are adjusted so that the voltage is well above the emission threshold for the entire waveform; this is confirmed by measuring the LED voltage and current with the NI-DAQ device. The response of the quadrant segments is monitored while increasing the modulation frequency. When the signal decreases by 3 dB, the bandwidth is found. We typically achieve 2–5 kHz bandwidth; however, attenuation hereafter is weak and attenuated signals can be found up to 20 kHz for this type of detector. 14
Dark-Field Recordings of Reflective Signatures from Dye-Dusted Insects
As a final example on passive optical remote sensing we show in Fig. 5 reflectance spectra from insects tagged with powder dyes, flying into the FOV of a dark-field setup, with the dark termination target at a distance of 120 m.
Reflectance spectra from spheres prepared with green, red, and blue powders, as routinely employed to mark insects (see left part of the figure). In addition, the reflectance spectra from two dye-dusted insects are shown, where the natural color of the insects also makes its spectral imprint.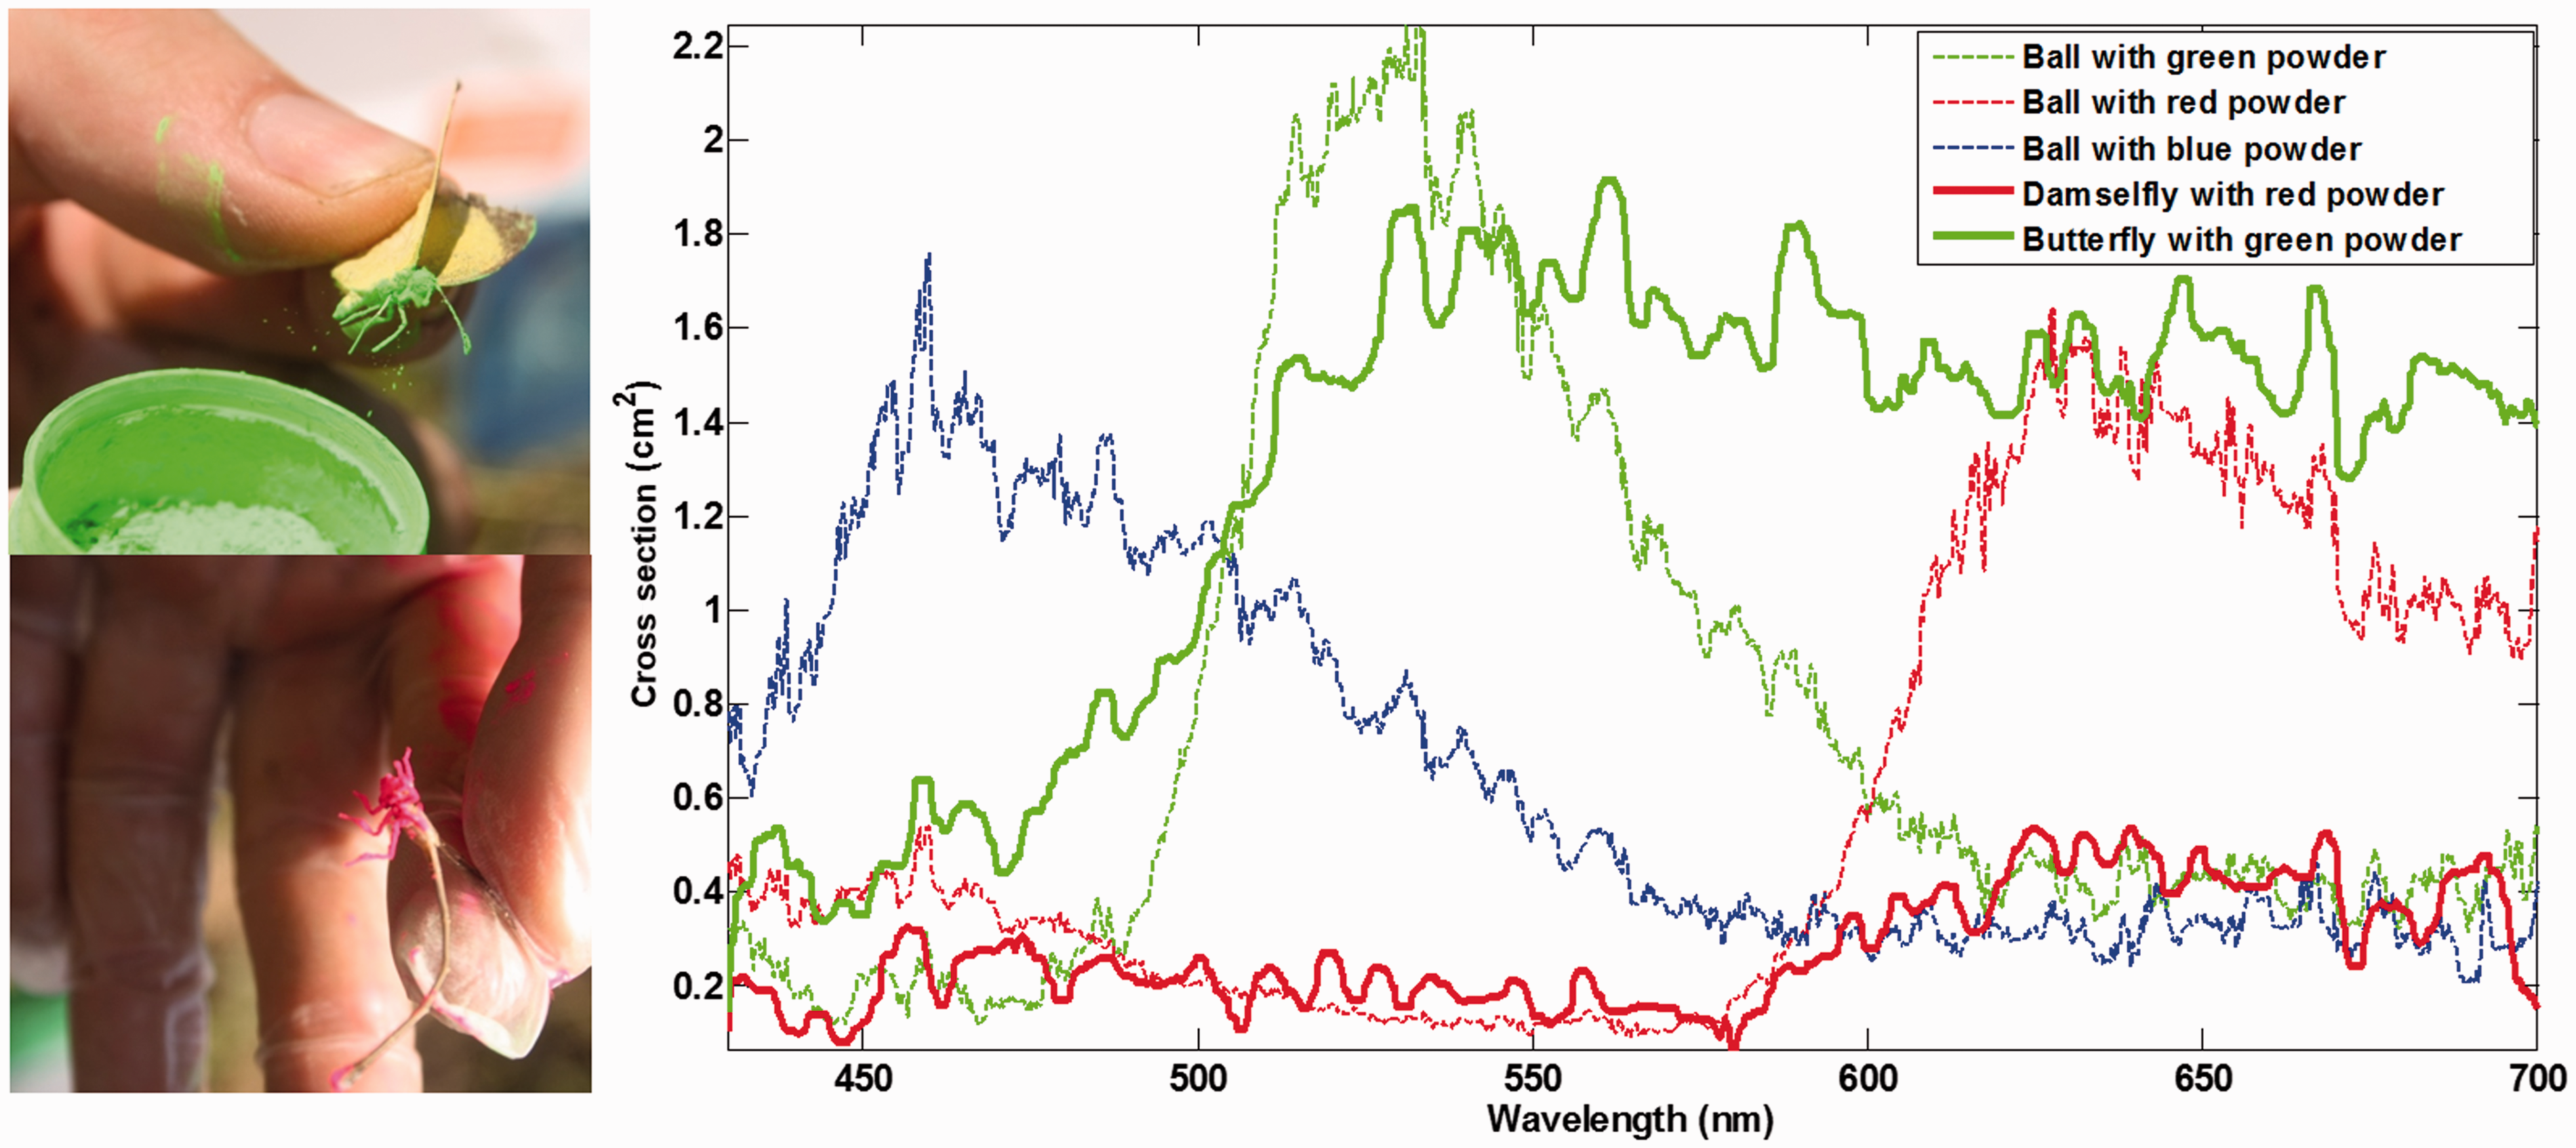
To the left in the Fig. 5, two examples are shown of insects carrying standard insect marking dyes. 33 Spectra from white calibration spheres, covered with selected dyes are included and provide calibration. For obtaining the absolute reflectance spectra, recorded spectra are divided with those obtained for the appropriate white calibration spheres. Clearly, the use of dyes for marking captured individuals provides sharper identification means than just using the natural reflectance spectra, in particular, contrast between identical species, for instance, residents and emigrants. However, if the number of species expected in a particular habitat is limited, even the natural reflectance spectra (the insect color detected remotely) can be sufficient for identification. 26
Active Imaging of Flying Insects with Spatially Resolved Wing-Beat Structures Using CCD Detection
In the previous Figs. 2–4, we have illustrated how insect wing-beats can be resolved by high temporal sampling in the range of kHz. The same wing-beats can, however, also be acquired spatially by long exposures with a CCD camera. A beam of 2 W, 808 nm laser radiation was transmitted and the atmospheric backscatter was imaged onto a CMOS camera (Lt225) with exposure times of 1 s. A static signal corresponding to the beam width is obtained. In analogy with classical fog chamber experiments, insects passing through the probe volume leave a trace of backscattered light along their trajectory. However, since the cross section modulates in time, the spatial trajectory is also modulated; see Fig. 6.
Spatially resolved wing-beats. (a) An intensity map of long exposure image of back scattered laser light. (b) The cross-section along the trajectory trace as well as static atmospheric backscatter.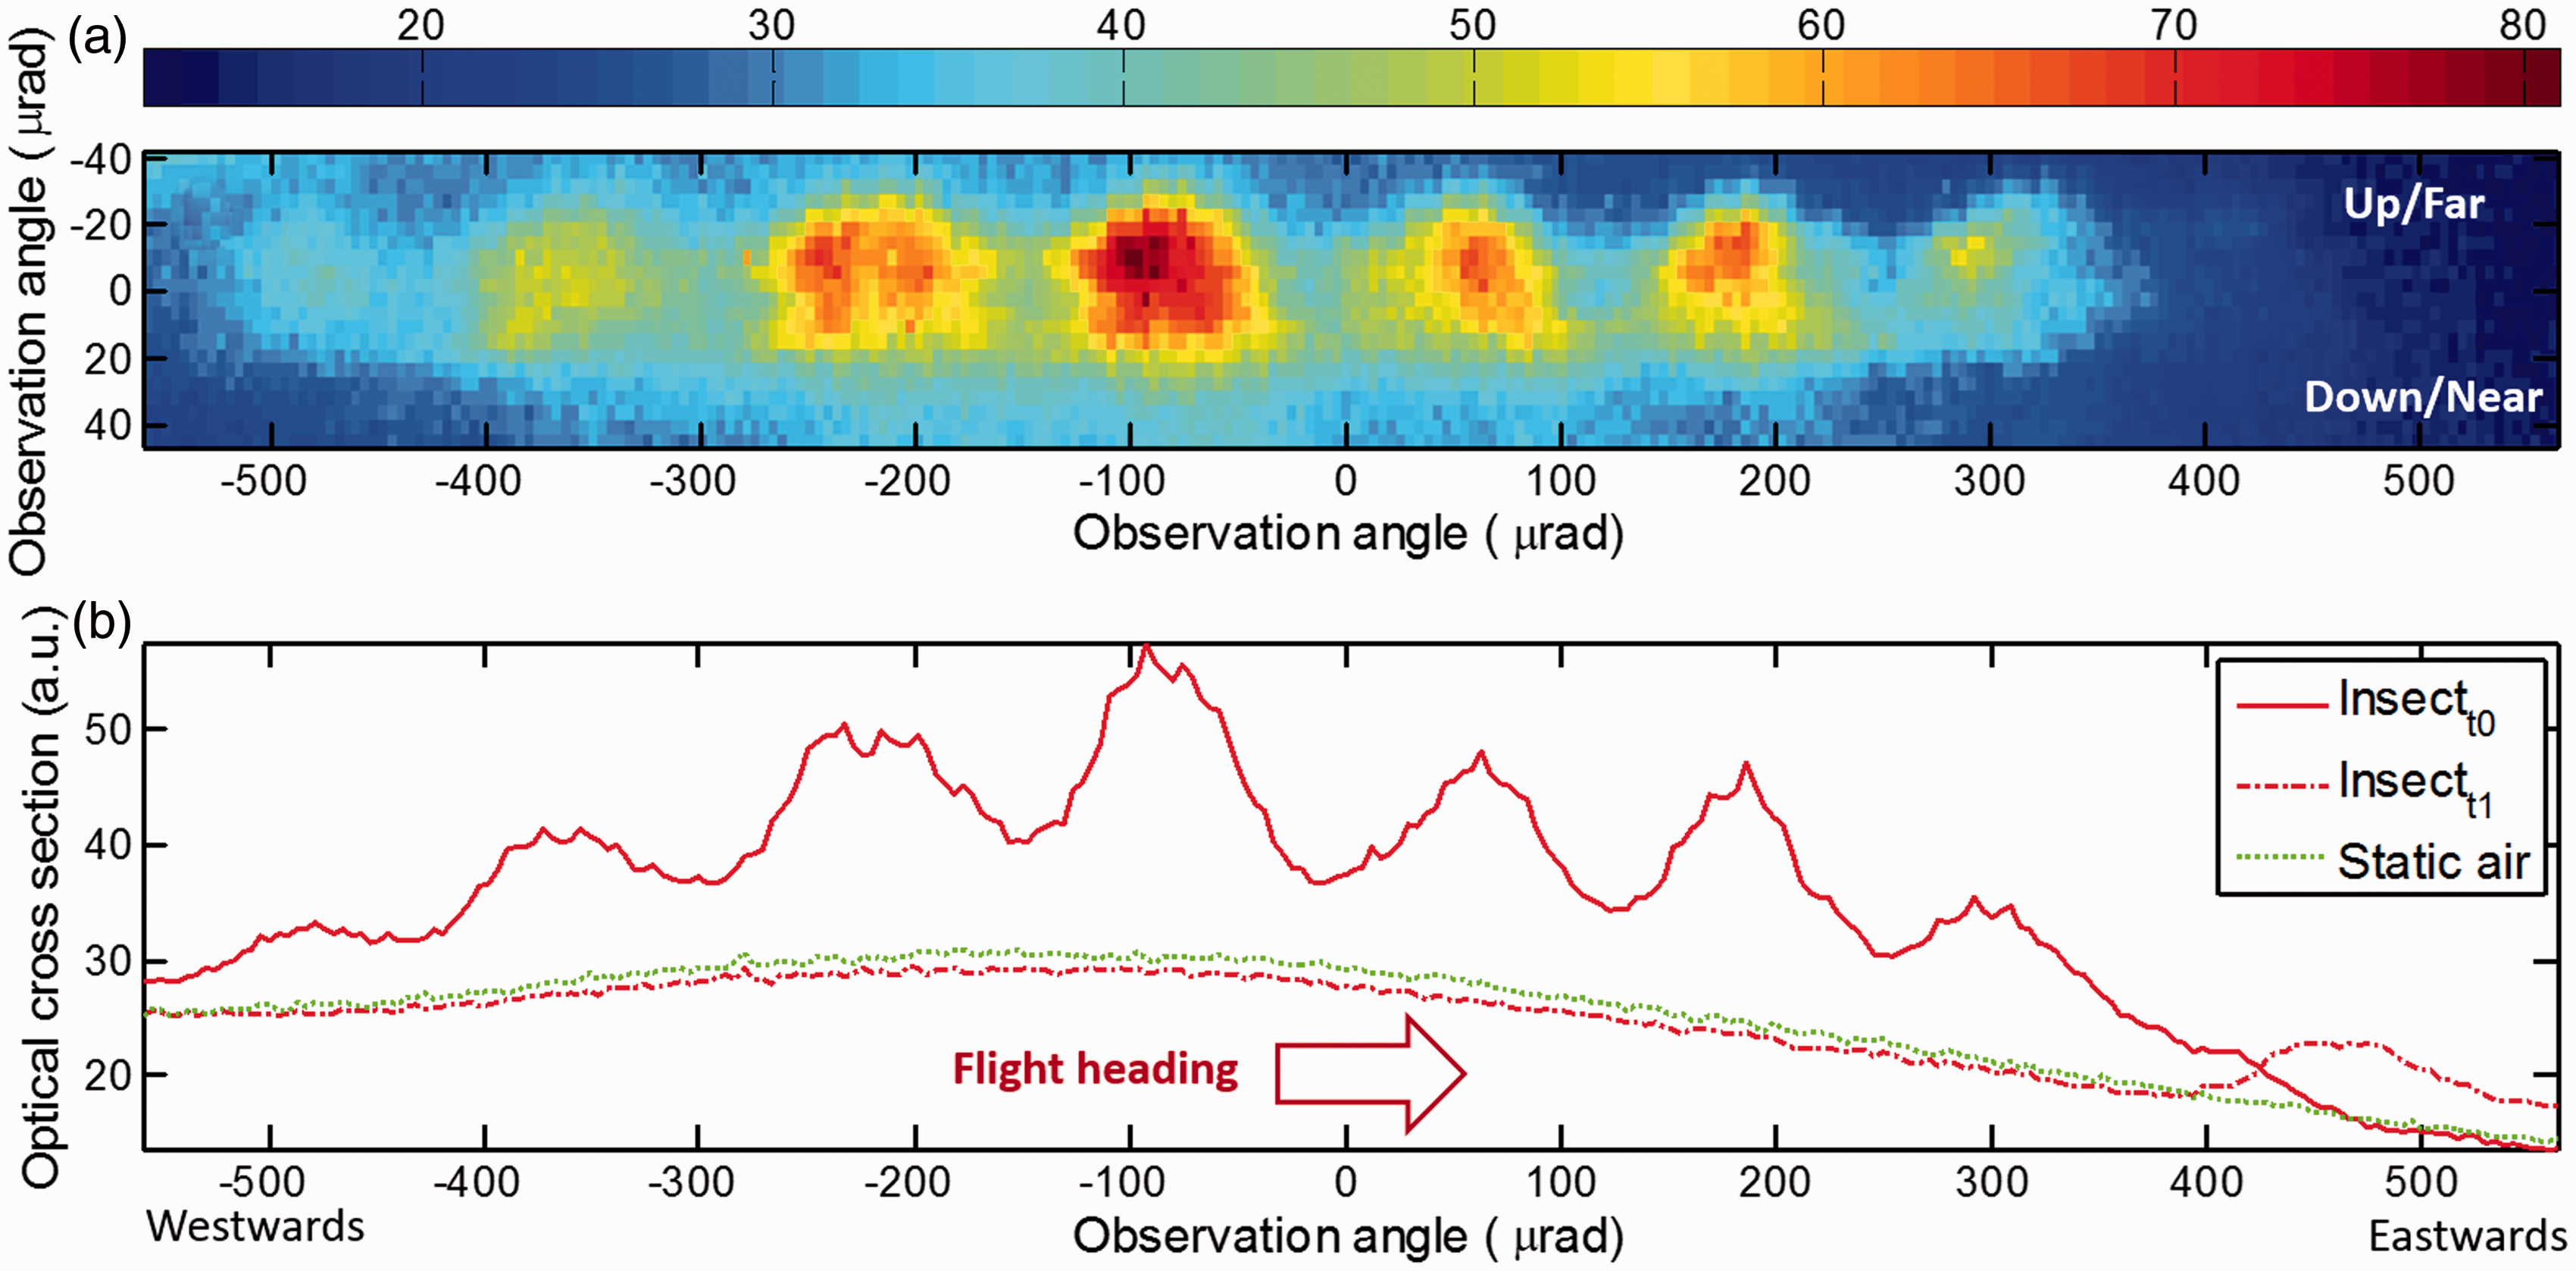
Spatially resolved wing-beats are somewhat complimentary to temporally resolved wing-beats. By simultaneously recording both spatial and temporal wing-beats, accurate flight speed and direction may be derived. In the case where the insect events are present in two consecutive exposures as in Fig. 6 (note the detail in the lover right corner), flight direction may be inferred, in this case west to east. In a horizontal monitoring configuration, upstrokes and down strokes may be observed as undulation of the trace perpendicular to the beam, in this case it is shown on the y-axis of Fig. 6a. Whereas temporally resolved wing-beats are insensitive to defocusing, the waveform of spatially resolved wing-beats is highly sensitive to focusing on the intercepted insects. In the following section we will demonstrate how persistent focus can be achieved along an illuminated atmospheric path, a method which is also compatible with 2D imaging.
Range-Resolved Insect Monitoring Using a Scheimpflug LiDAR Arrangement
Since continuous illumination from the sun or from an inexpensive diode laser is employed, the range resolution typical for a pulsed laser radar (LiDAR, light detection and ranging) system34,35 is normally lacking in arrangements of the type discussed above. In fact, we have performed range-resolved measurements of insects, both employing elastic back-scattering lidar and laser-induced fluorescence (LIF) lidar utilizing large, pulsed lasers.33,36,37 However, by using a bi-static lidar arrangement with a quite small separation between the transmitting and receiving optical telescopes, it is possible, by using a so-called Scheimpflug arrangement to achieve range resolution even with a CW laser. This is demonstrated in Brydegaard et al. 9 Basically, the scattering from a CW laser beam is observed with a telescope arrangement at an oblique angle, and a linear array detector is arranged at the proper angle, characteristic for the Scheimpflug configuration, 38 to allow all illuminated air volumes to be imaged sharply onto the detector without diminishing the aperture. Clearly, the range resolution is much better at close range, while finally, at ranges approaching infinity, all points are imaged onto the same detector element. In these first recordings considerable ranging uncertainty is caused by the beam width and profile, we have later experienced that this can be improved by using large aperture and high quality imaging optics on the laser expander as well as letting the beam converge toward the termination.9,39 This limitation can be partly bypassed for the case of insects with an oscillating cross-section due to the wing-beating. Actually, it is possible to achieve a range resolution overcoming the diffraction limit in optical instruments, as demonstrated in Brydegaard et al. 9
In the present work we demonstrate insect monitoring with a CW Scheimpflug lidar, obtained in an experiment in Stellenbosch, South Africa, where 150 mW of radiation at 808 nm was transmitted (130 m ASL at 33°55′55.53 S 18°51′54.61 E) and terminated at a cliff wall 11.4 km away (770 m ASL at 34°02.07.32, S 18°52′13.06 E). The transmitter/receiver separation was in this case 140 cm. The laser beam propagated up to several hundred meters above ground. Two out of a very large number of insect events are shown in Fig. 7, at ranges of about 120 and 1000 m, respectively; distances where green areas and water streams were located some 15 m and 75 m beneath the beam. The insects cross the beam in about 100 ms, and in the expanded views to the right in the figure, wing-beats can clearly be resolved, as sampled at 2 kHz. We note the strong echo from beam termination at about 11 km, but also the background signal level from the “clean air”, over which the insect events rise with high contrast. In fact, the atmospheric background signal can be used for assessment of aerosol particle distributions, and even for CW differential absorption lidar (DIAL) monitoring of atmospheric species, as recently demonstrated.38,39 Instrumentation for analyzing integrated atmospheric paths can be achieved inexpensively with LED sun photometers.40,41
Scheimpflug lidar recordings of two insect events at different distance. Left: Time-range maps. Middle: Range curves for the events rising over the static clear air background scattering. The termination is seen at about 11 km. Right: Time-resolved signals sampled at 2 kHz, showing wing-beats of insects, presumable nocturnal moth or similar.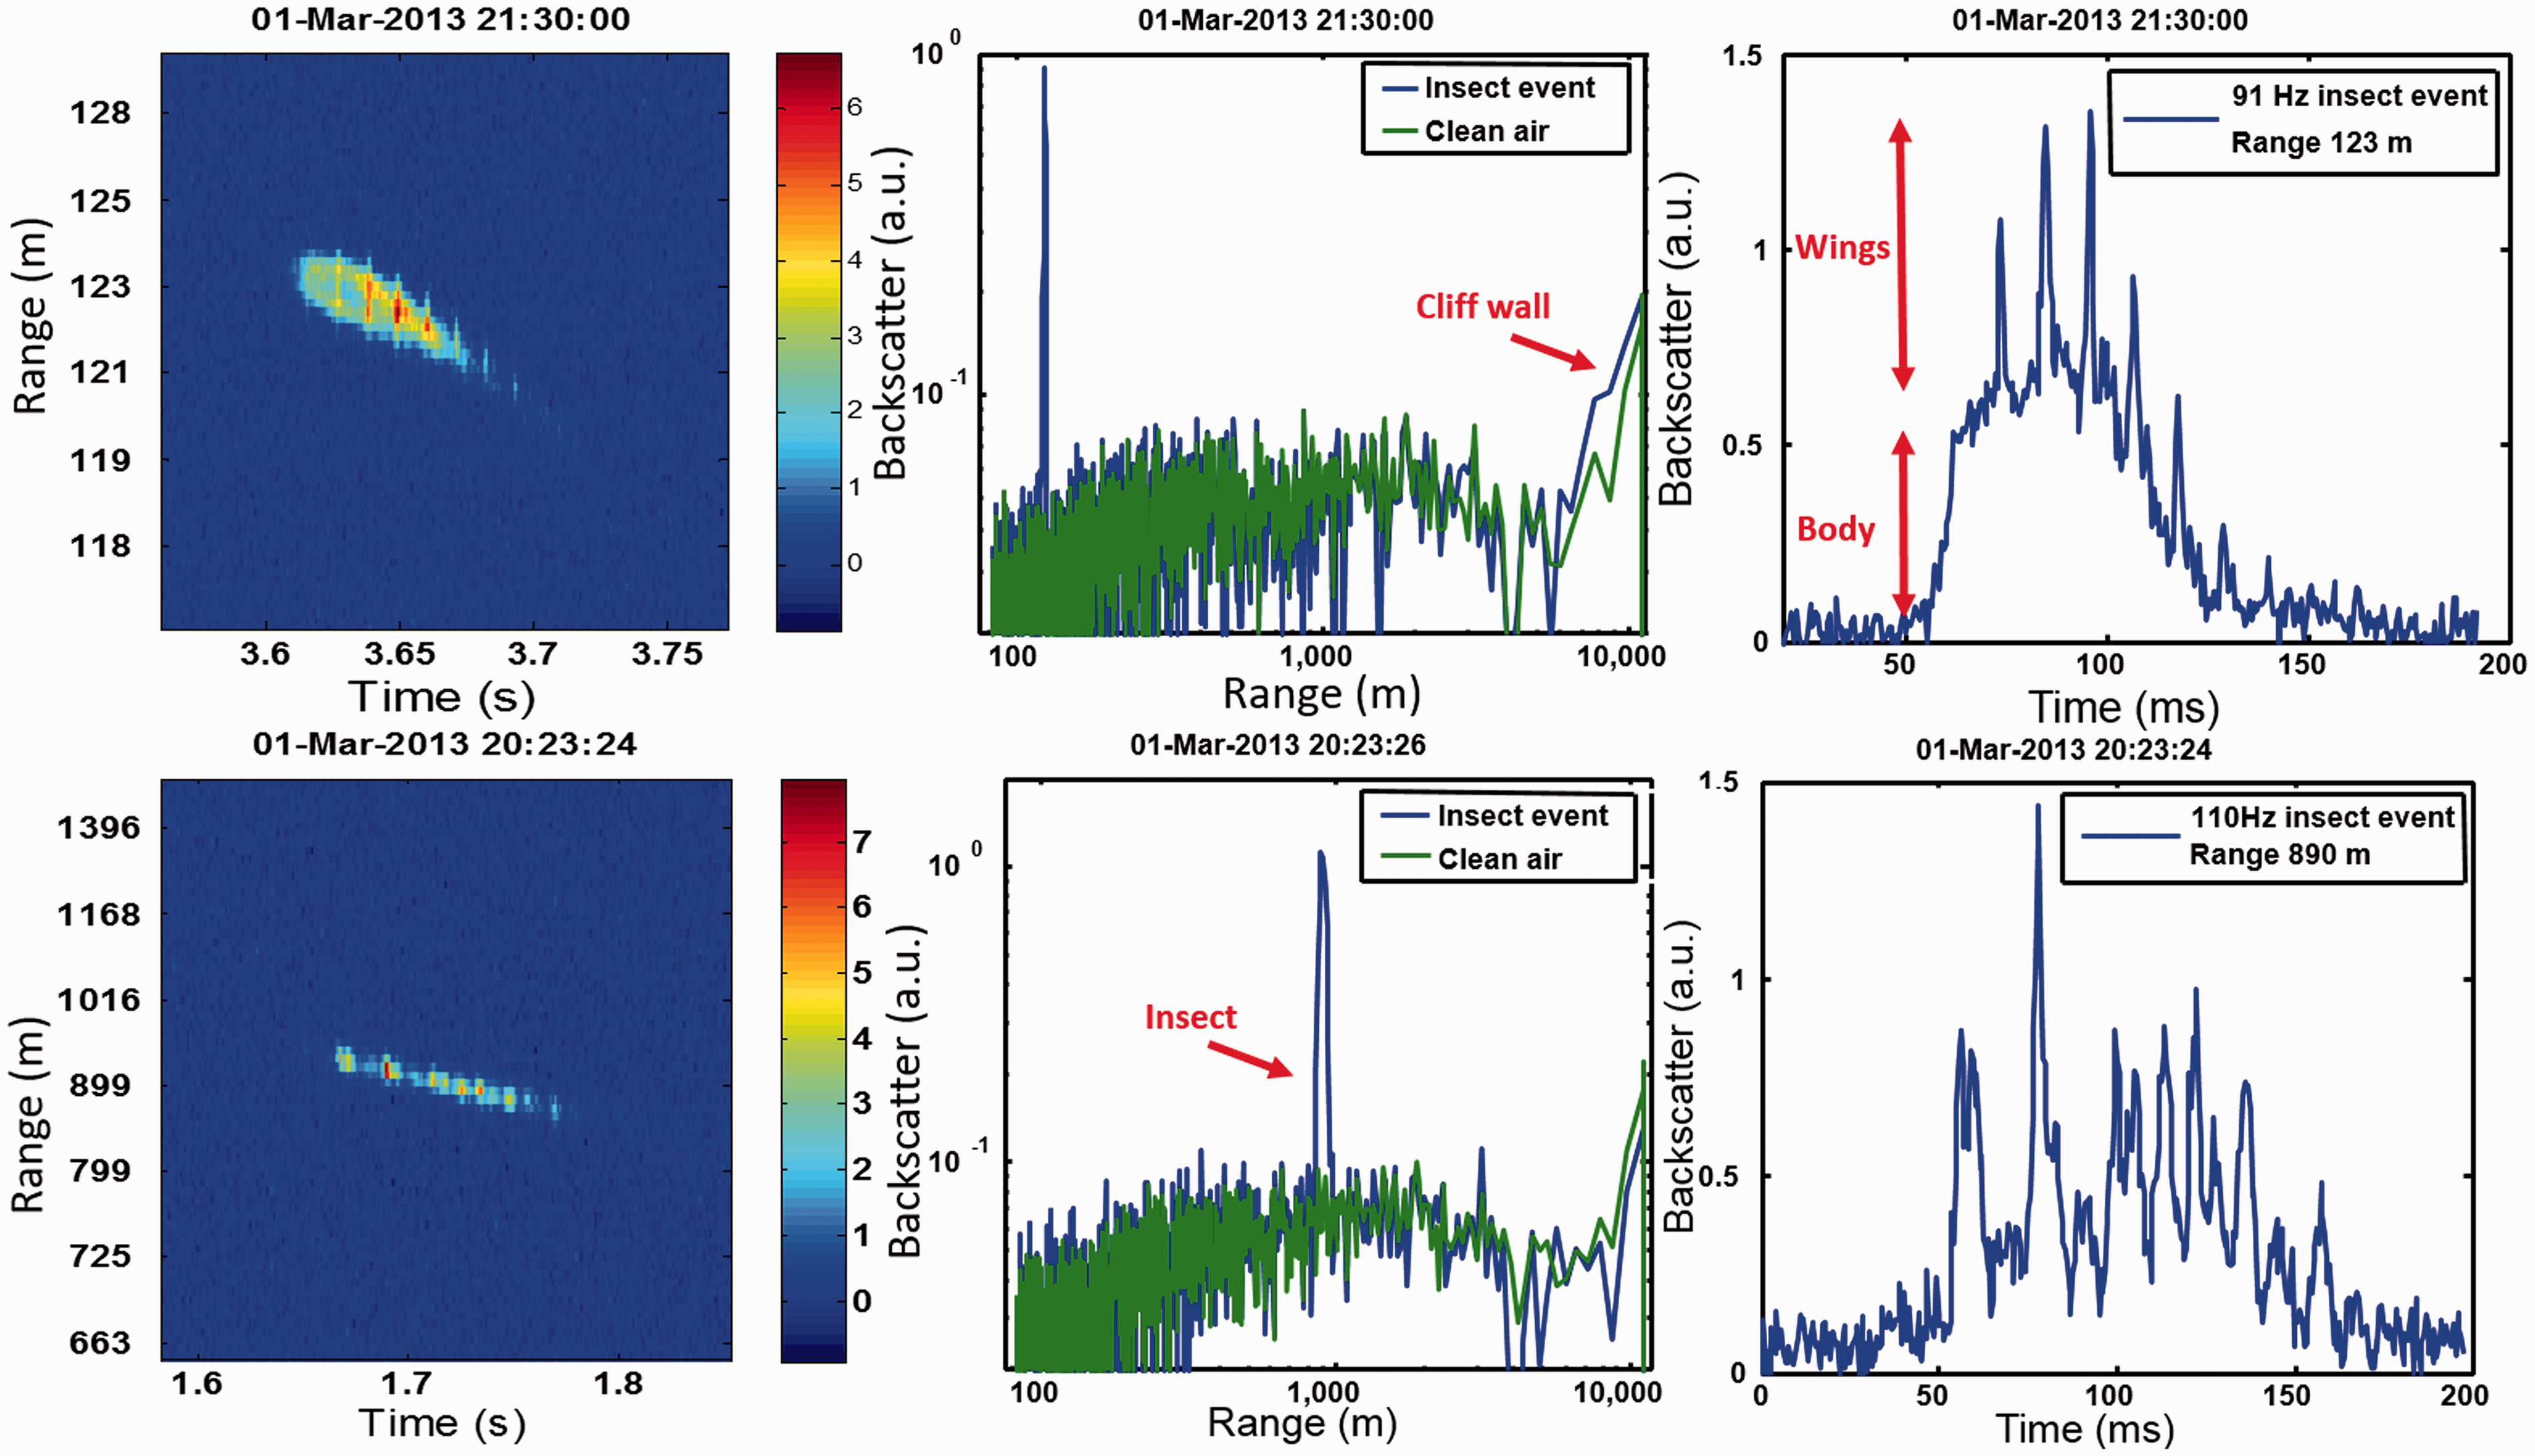
As a final aspect in this section on CW lidar applications of our remote sensing platform we discuss how to achieve the range calibration. The distance to the beam termination can be known from maps or Google Earth software and the geometrical arrangements at the transmitter/receiver are known. Then range calibration can be achieved by trigonometry. By knowing pixel pitch, the transmitter/receiver separation, receiver focal length, sensor tilt angle, and termination distance, a range vector of each pixel footprint can be derived. The details of the range calibration can be found in Blais 38 and Mei and Brydegaard 39 where the correct range calibration is additionally verified through Beer Lambert’s law. By knowing the termination pixel footprint size and the reflectance of the termination the absolute optical cross-section can be derived. This can be validated with white Teflon or cellulose spheres, as discussed in connection with Fig. 2.
Vegetation Monitoring Using Spectrally Resolved Recording of Laser-Induced Fluorescence
Laser-induced fluorescence, in addition to reflectance spectroscopy, can yield valuable information in vegetation status, as discussed in the literature,21,34,42–44 where different aspects of fluorescence lidar techniques are highlighted. We illustrate, in Fig. 8, remote fluorescence spectroscopy over a distance of 120 m in experiments at ICIPE, Nairobi. A 500 mW CW laser at 405 nm with a transmitted optical power of 85 mW was launched towards the target area 120 m away, also depicted in Fig. 8. Connecting the compact fiber optic spectrometer to the focal plane of the receiving telescope and ascertaining that the image of the illuminating laser spot is falling on the fiber facet, high quality recordings of vegetation fluorescence could be obtained, displaying the two characteristic chlorophyll peaks around 690 nm and 740 nm. Red insect-marking dye of the kind discussed before also gives rise to very strong fluorescence, making marked insects easily detectable in fluorescence over considerable distances. Whereas NIR probing can be considered non-perturbing, near ultraviolet probing would be perturbing for most insects.
45
Laser-induced fluorescence (LIF) recordings of vegetation and a red insect with dusting powder at a range of 120 m. Excitation occurred at 405 nm.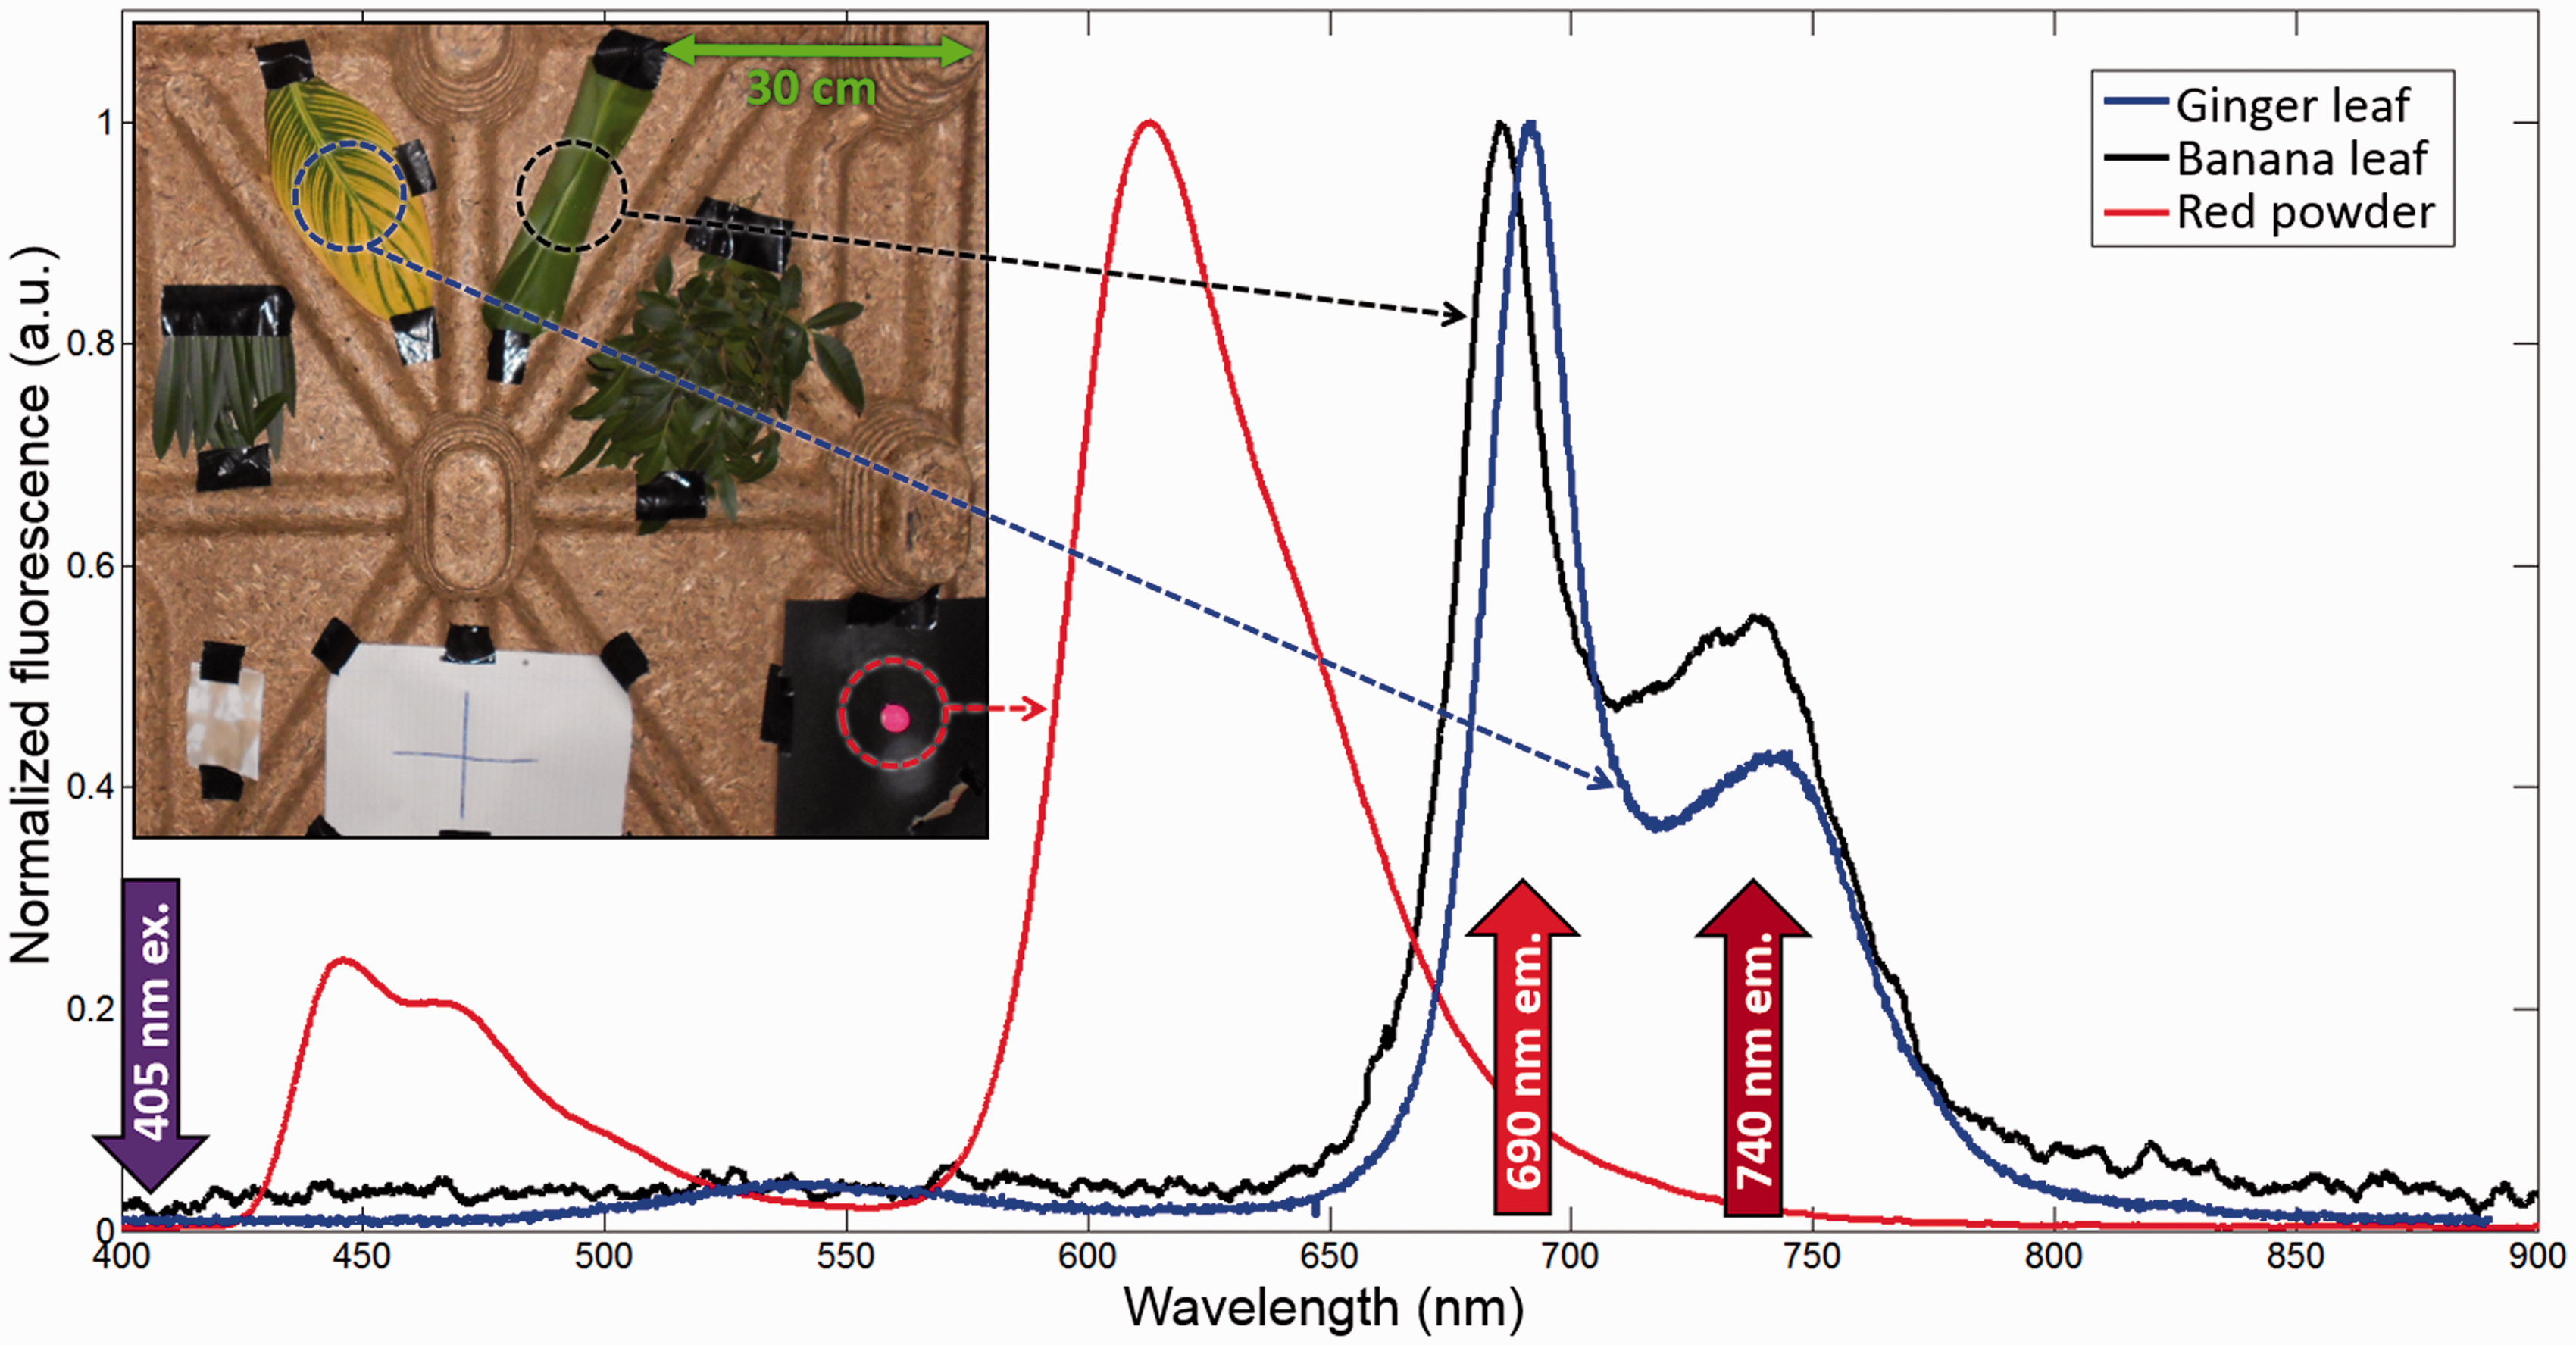
Spectral calibration for recordings of LIF, and also Raman signals, as discussed in the next section, must be performed to achieve objective data. The spectral throughput of the entire optical system can be assessed by placing a tungsten halogen filament lamp at the remote target site. A certified spectrally calibrated lamp can be used; then the factual emission distribution is known, and the distribution recorded by the instrumentation can be related to the transmitted one to calculate a multiplicative spectral correction function. Since certified lamps are quite costly, a different approach can be taken, as described in Brydegaard and Svanberg. 46 Here a normal incandescent lamp is used and the driving voltage is varied in several steps and current and spectra are recorded. The absolute filament temperature and the corresponding theoretical Planck emission is found according to the procedure outlined in Brydegaard and Svanberg. 46
Imaging Recording of Laser-Induced Fluorescence Using an RGB CCD–CMOS Detector
Imaging multi-color registration of objects in fluorescence is also demonstrated with the remote sensing platform described. Our night-time experiments, performed in Nairobi, are illustrated in Fig. 9. The same 405 nm diode laser as described in the previous section was used to transmit 85 mW in an expanded light distribution with a diameter of about 30 cm at the 120 m distant target. Violet GaN lasers have recently experienced great development, due to their application for the Blue Ray storage disc technology. The emitting chip size is typically only 1 × 8 µm, which is essentially a point source. Therefore a close to a top-hat beam profile can be obtained with any radius, simply by adjusting the focal stage of the expanding telescope. This is ideal for imaging applications, e.g., for spatial chromatic variance
47
of vegetation. A test target made with light marker pens on white paper demonstrates the principle with images recorded remotely and directly at the target as shown in Fig. 9. The texture of a leaf fluorescing predominantly in the red channel is illustrated. A powder marked test ball (left) and insect (right) are clearly detectable.
Remote (120 m) night time color fluorescence imaging using a 85 mW, 405 nm diode laser beam expanded to about 10–30 cm diameter, and an RGB imager preceded by a 435 nm long pass filter, to suppress the elastic back scattering. The AFSIN logo is displayed as recorded at target and remotely. Also, the red fluorescence from a leaf and bright spots form fluorescent dyes are included.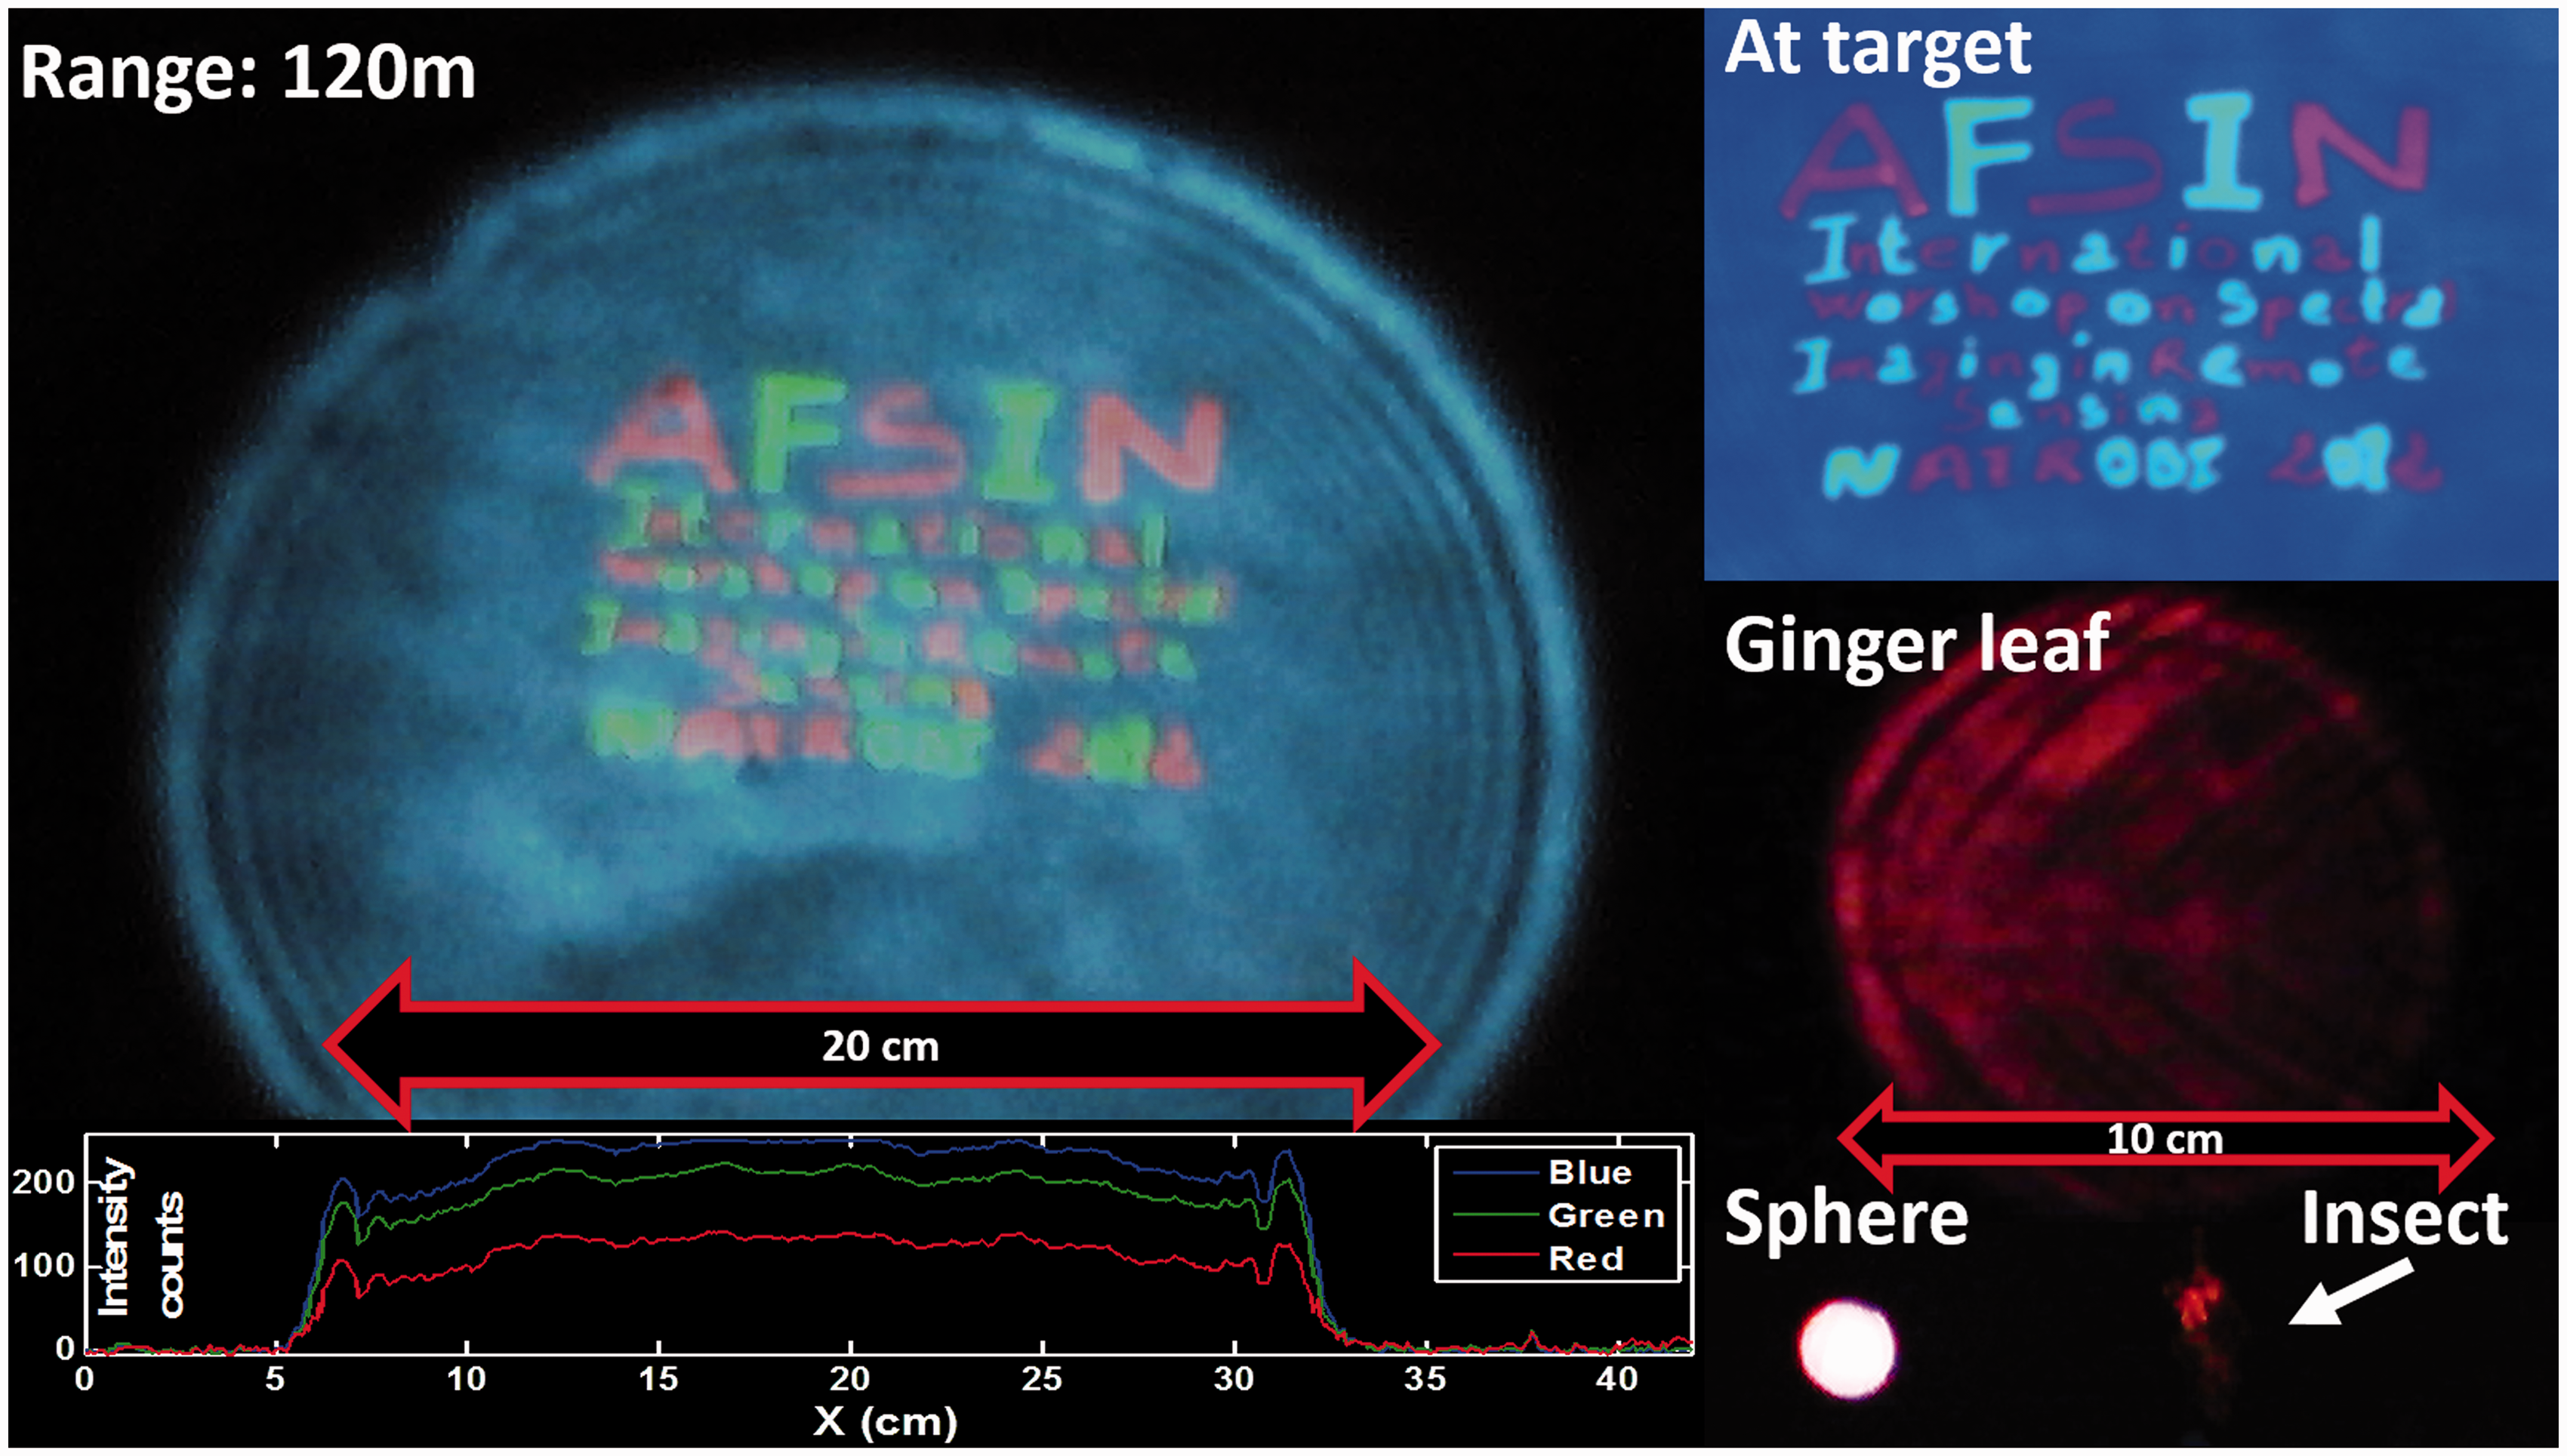
Calibration of the illuminating beam spatial distribution at target was performed by using ordinary laser print paper as a homogeneous target which is highly fluorescent. By expanding the diode laser beam with the f/8 refracting telescope we obtain close to a cylindrically symmetric top hat beam profile, as illustrated.
Water Quality Assessment Using Fluorescence and Raman Spectroscopy
The most advanced application of the remote sensing platform described in this paper is perhaps the remote measurement of water quality, which can be achieved by observing water LIF and employing the water O–H stretch Raman transition at 3400 cm–1 of the H2O molecule for normalization. These measurements were again performed at ICIPE, Nairobi using our 120 m testing range in night-time registrations. Figure 10 shows the measurement scene and the target area where a mirror was arranged to fold the laser beam and detection FOV to enable measurements on water samples, which were kept in a non-fluorescing metal container, as illustrated in the figure.
LIF-Raman water spectra performed at 120 m distance. The plot shows a number of samples ranging from clean tap water to the dirty water of a pond at ICIPE campus. Each sample is illuminated sequentially both at 405 nm (solid lines) and at 445 nm (dashed lines). As a mean of robust fluorescence spectroscopy, the Raman signals (corresponding to the probed amount of water) have all been normalized to one. The image in the lower right shows the arrangement of beam folding and container for water sample.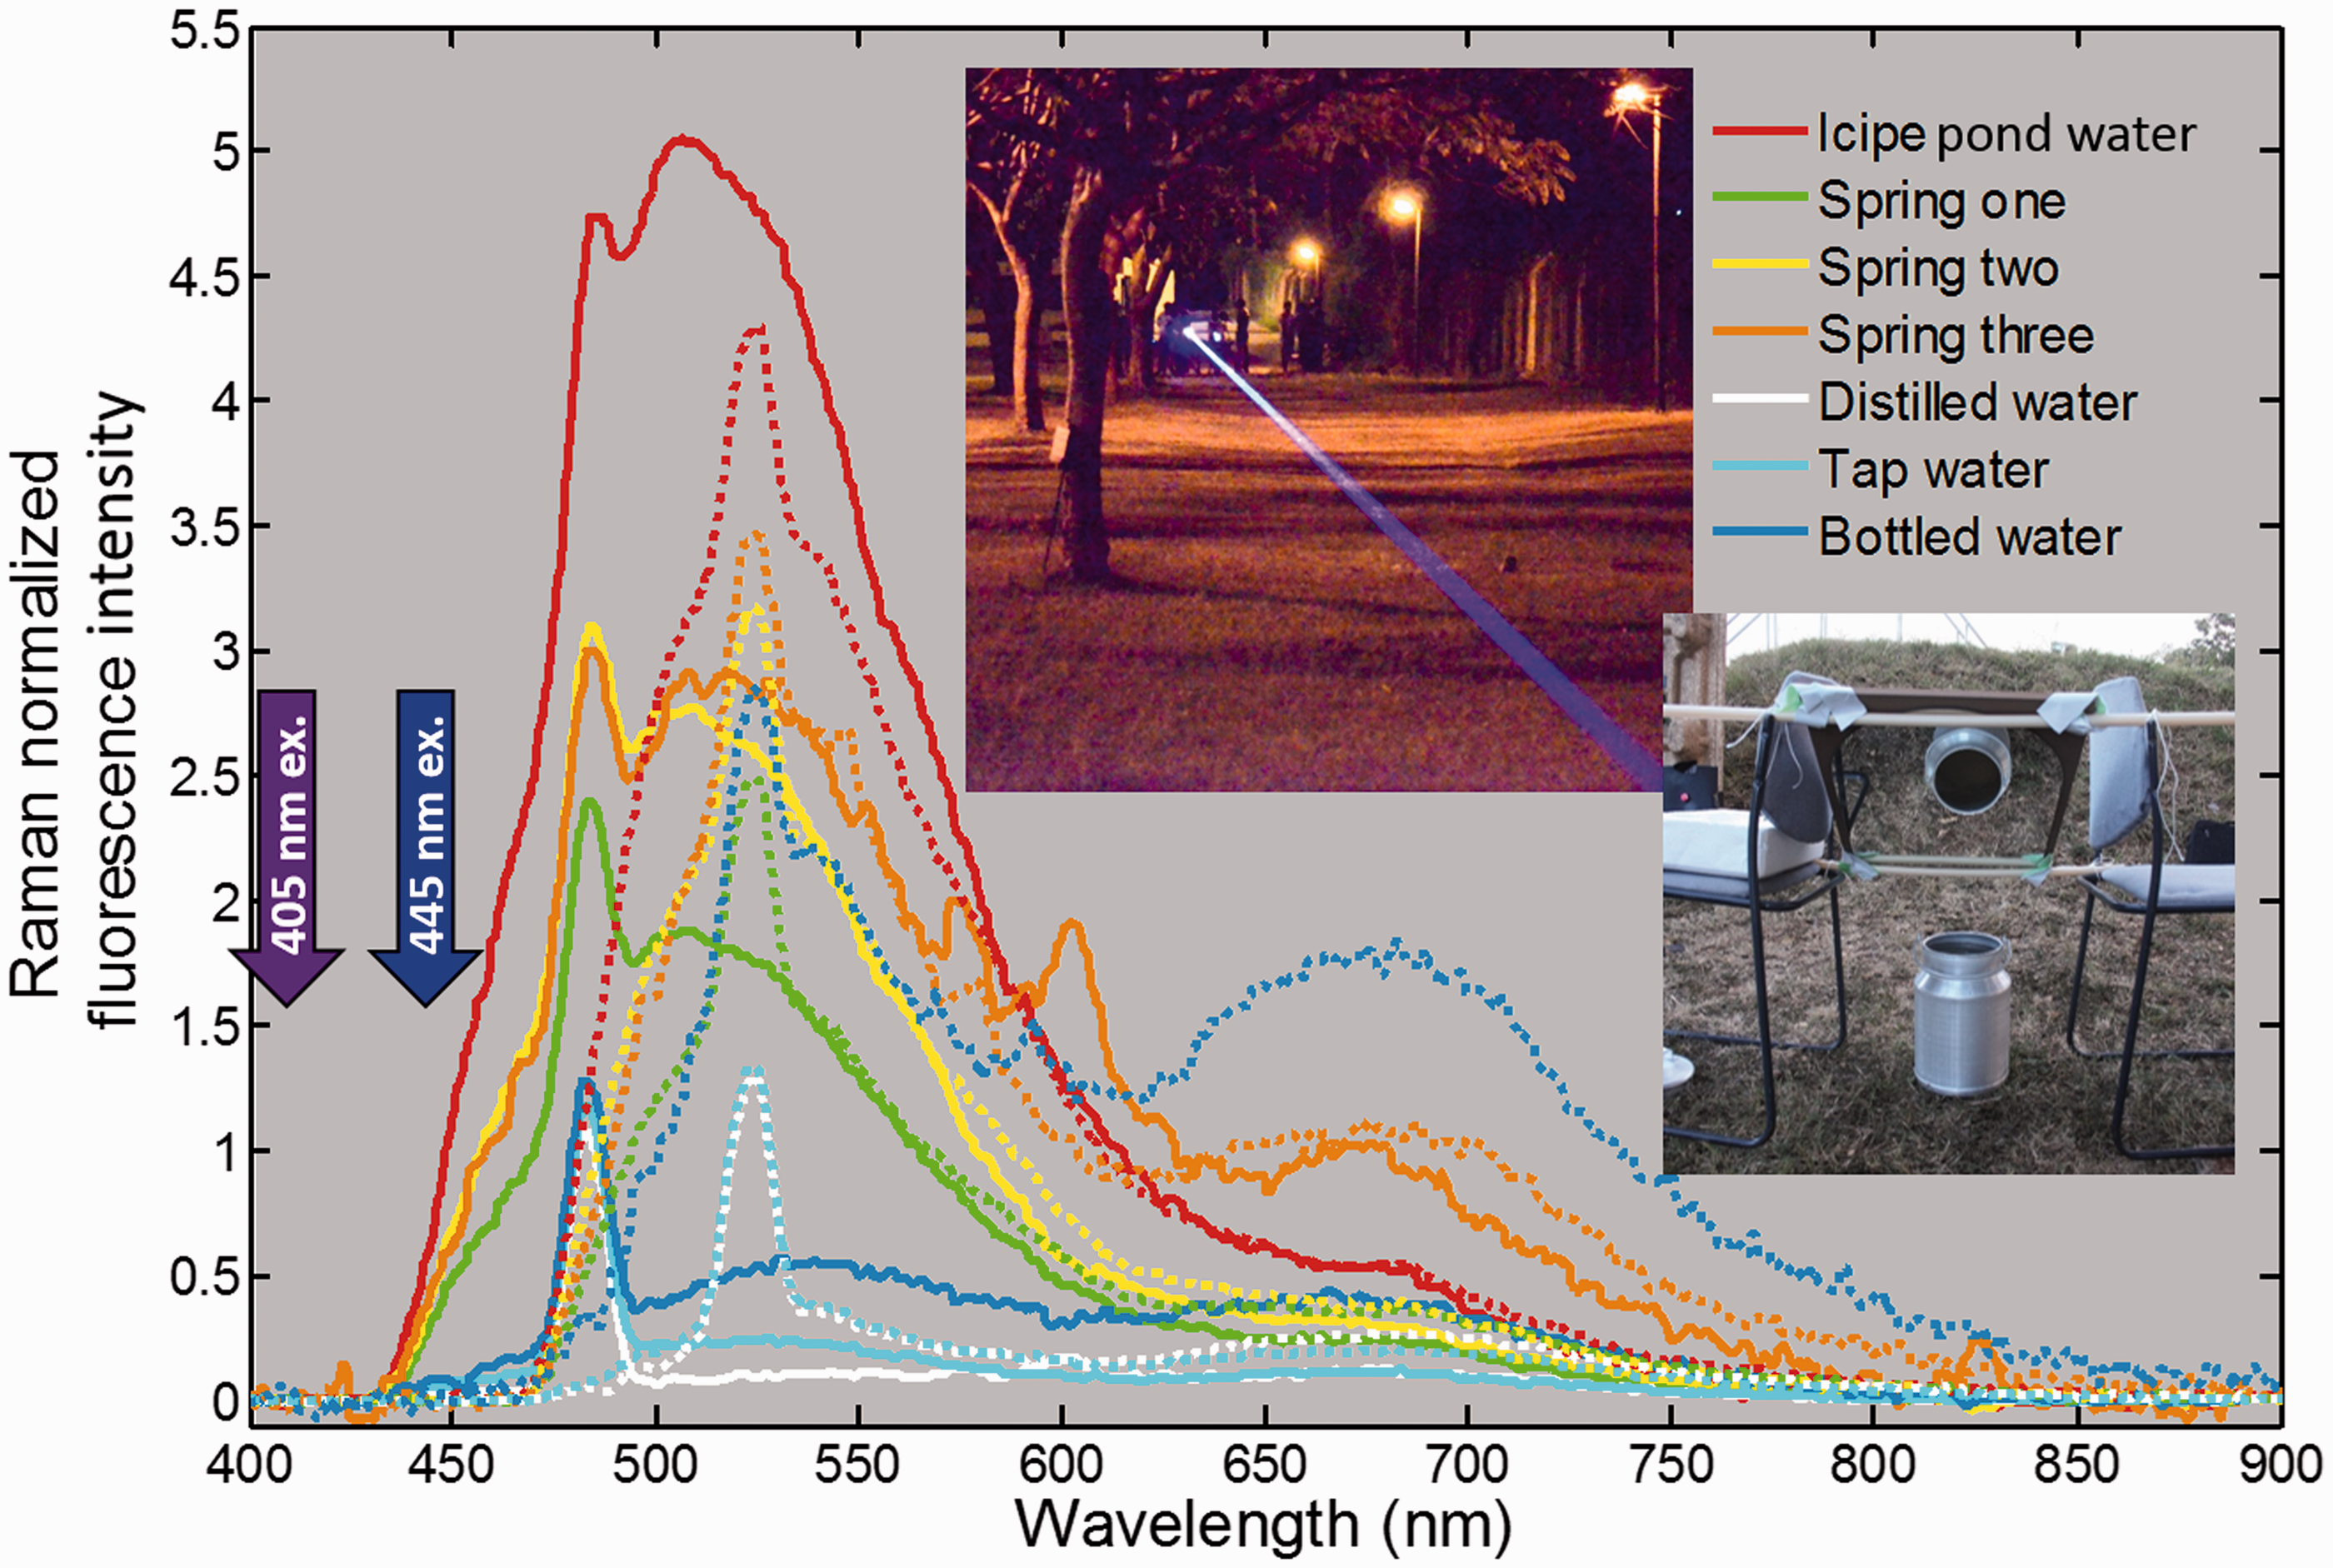
Two CW laser sources were employed subsequently in this study (actually transmitted from two independent setups with different laser and filter configurations). A 1 W diode laser unit of 445 nm with about 160 mW of laser light transmitted, or a 500 mW unit operating at 405 nm, effectively transmitting 85 mW towards the water sample target site. The beam is folded to some 15° off nadir, to avoid specular reflection from the water surface towards the remote sensing platform and the operators. The same compact fiber-coupled spectrometer as employed in recording the data shown in Fig. 9 was used. Water samples from several springs from the Lake Nakuru National Park, Kenya, were collected and compared to urban water at ICIPE, Nairobi. Counterintuitively, but in accordance with previous studies, 25 bottled water may be more contaminated than tap water. The spectra have all been normalized to a Raman signal set to unity. Recorded spectra for both excitation wavelengths are shown in Fig. 10. Long-pass colored-glass filters at 435 nm and 475 nm were employed to suppress elastic back-scattering. Distilled water and water from the local pond represent the two extremes in recorded normalized fluorescence levels.
The normalization of LIF signals to the water Raman signal was performed in the following way. The water Raman spectral emission peak is first excluded from the recorded spectrum and the missing spectral region is reconstructed with second-order polynomial interpolation. The difference between the interpolated and raw spectra, which is proportional to the Raman signal and thus the probed water volume, is normalized to unity. This normalization largely cancels out measurement geometry as well as the spatial extension of the probe volume which is governed by the varying light transport properties in the sample. This implies that the fluorescence intensity can be directly compared between samples. However, samples with high extinction and low signals, such as the sample from spring three, display poor signal-noise-ratio. Possible explanation for the features of that sample around 589 nm could be residuals from faint city lights (high pressure sodium lamps can emit a bimodal light distribution around the nominal emission line due to massive radiation trapping in the plasma).
Fluorescence emission spectra from organic compounds are generally broad and often overlap. Precise identification of the pollutants either requires linear decomposition or projection on a set of emission spectra from known pure pollutants, or the application of chemometric methods,48,49 such as, for example, singular value decomposition followed by multivariate prediction by using a training data set with pollutants determined by a gold standard. We note that the Raman signal in Fig. 10 shifts along with excitation wavelength whereas fluorescence mainly preserves its shape. To relate recordings made at different excitation wavelengths, the fact that the relative Raman strength has a λ–4 dependence can be utilized. Dual wavelength excitation enables to extract two emission spectra from the full excitation–emission-matrix 25 (EEM). In our case the violet 405 nm and blue 445 nm excitation differentially indexes the Soret band of, for example, chlorophyll a. Substances with largely overlapping emission spectra may thus be separated using the excitation wavelengths rather than the emission wavelengths.
Comments on the Construction and Utilization of the Instrumental Platform
We note that optics is a particularly suitable area of scientific endeavor in the context of developing science in low-income countries. While fundamental and basic in its nature, many of the applications do not require extensive monetary investments, while still addressing important and fundamental issues. The powerful yet inexpensive remote sensing instrument described in this paper is of great interest in many contexts, not least in solving problems in the developing world. Environmental pollution in the fast developing mega-cities in low-income countries can be assessed using atmospheric backscattering, water quality in natural reserves can remotely be monitored by fluorescence and Raman techniques, 50 and agricultural pest 37 and disease spreading vectors 51 can effectively be identified and quantified using wing-beat harmonics patterns. 28 We note that depending on the chosen beam divergence all sources are not necessarily eye-safe when transmitted remotely, and we emphasize than experiments must be under surveillance of the operators.
The observation that low-cost yet powerful technical implementations are of particular value for applications in developing countries interestingly also pertains to the industrialized world, where the same criteria are valid for successfully introduced new products. Thus, joint projects, aiming at advancing science in developing nations, in the end could bring substantial additional benefits to donor countries, apart from the humanitarian aspects. The system described here was assembled in several copies during an AFSIN 8 workshop in Nairobi, Kenya. It can now be found at university physics laboratories in Kenya, Senegal, Mali, Burkina Faso, Ghana, Ivory Coast, South Africa, Norway, and Sweden. The authors or webpage 8 administrator can provide contact details for collaboration with the particular groups.
Summary and Conclusion
We have described the design, calibration, and application of a new general-purpose optical system for active and passive remote sensing. Applications to air quality monitoring, water and vegetation status assessment, as well as flying insect identification and quantification of agricultural and epidemiological importance have been demonstrated. The flexibility of the remote sensing platform allows numerous further applications, where some are briefly mentioned, but many further remain to be explored. Following the Nairobi workshop we have successfully pursued both detection of atmospheric gases 39 and aerosols 52 using the presented lidar methods. We emphasize that despite the low cost of the instrumentation, effective usage of the presented system also relies on persistent training in physics and optics on an advanced level.
We note that oscillatory organisms are also encountered in aquatic ecology, and can be probed with equipment as discussed here. This could be a potential complimentary tool to existing optical online methods for studying aquatic fauna. 53
Footnotes
Acknowledgments
The authors thank Ernst V. Groningen, Jeremie Zuoeu, and the AFSIN participants for assistance; Majd Salman for his effort in field; and Maren Wellenreuther, Anna Runemark, and Susanne Åkesson for their valuable assistance and persistent support. Regarding work pursued at the Laser Research Institute, Department of Physics, University of Stellenbosch, South Africa, the authors thank Erich Rohwer, Hubertus V. Bergmann, Pieter Neethling, Gerhard Louwrens, Lawrence Ashworth, Nanike Esterhuizen, and John Terreblanche for their hospitality and assistance.
Funding
This work was supported by a grant from the International Science Programme, Uppsala, Sweden, a direct grant from the Swedish Research Council and a Linnaeus grant to the Lund Laser Centre. The project was additionally supported and kindly hosted by Professor Kenneth Kaduki, of the Department of Physics, Nairobi University, Kenya, during a workshop that was arranged at the International Center for Insect Science (ICIPE), Nairobi, Kenya.
Conflict of Interest
The authors report there are no conflicts of interest.