






Abstract
The need for more environmentally friendly and efficient energy conversion is of paramount importance in developing and designing next-generation internal combustion (IC) engines for transportation applications. One effective solution to reducing emissions of mono-nitrogen oxides (NOx) is exhaust gas recirculation (EGR), which has been widely implemented in modern vehicles. However, cylinder-to-cylinder and cycle-to-cycle variations in the charge-gas uniformity can be a major barrier to optimum EGR implementation on multi-cylinder engines, and can limit performance, stability, and efficiency. Precise knowledge and fine control over the EGR system is therefore crucial, particularly for optimizing advanced engine concepts such as reactivity controlled compression ignition (RCCI). An absorption-based laser diagnostic was developed to study spatiotemporal charge-gas distributions in an IC engine intake manifold in real-time. The laser was tuned to an absorption band of carbon dioxide (CO2), a standard exhaust-gas marker, near 2.7 µm. The sensor was capable of probing four separate measurement locations simultaneously, and independently analyzing EGR fraction at speeds of 5 kHz (1.2 crank-angle degree (CAD) at 1 k RPM) or faster with high accuracy. The probes were used to study spatiotemporal EGR non-uniformities in the intake manifold and ultimately promote the development of more efficient and higher performance engines.
Keywords
Introduction
As the need for cleaner and more efficient internal combustion (IC) engines increases, so too has the need for techniques to further reduce mono-nitrogen oxide (NOx) emissions. Exhaust gas recirculation (EGR) is a simple yet widely implemented technique that can effectively curb emissions in both gasoline and diesel engines. Under constant engine speed with no EGR, NOx emission is determined by many parameters, but most importantly fueling rate; 1 in the applications discussed here NOx is defined as the sum of nitric oxide (NO) and nitrogen dioxide (NO2). This is because NOx formation during combustion is determined by the extended Zeldovich mechanism, composed of three reactions: two reactions governing NOx formation from molecular nitrogen, and a third reaction that becomes significant in near-stoichiometric and fuel-rich mixtures. The rate constants of these reactions have been studied in detail.2–4 In particular, the rate-limiting step, O + N2 ↔ NO + N, has high endothermicity and activation energy due to the triple bonds of N2, where O and N are atomic oxygen and nitrogen, and N2 is molecular nitrogen. As a result, the maximum NO formation rate, given in Lee, 5 shows thermal NOx formation is non-linearly dependent on temperature. 6 Inclusion of exhaust gas to the intake charge-gas mixture reduces peak in-cylinder combustion temperatures by increasing the specific heat capacity of the mixture; this in turn significantly reduces NO formation via the non-linear rate dependence. It further reduces NOx by reducing the charge gas molecular-oxygen (O2) concentration.7–9 Despite these benefits, however, improper EGR implementation can induce greater cycle-to-cycle variations in multi-cylinder engines 10 and lead to reduced efficiency, control, and performance. In addition, as more and more engines push for higher EGR fractions, significant ignition delays can introduce further cycle-to-cycle variations11–13 as a result of in-cylinder charge-gas-composition (fuel, air, and exhaust gas) fluctuations. Non-optimum EGR implementation can also lead to cylinder-to-cylinder variations 14 within a given cycle due to improper mixing. Combustion phasing delays as a result of excessive EGR can induce engine knock and misfires under certain conditions, 15 leading to unstable operations and reduced engine durability. 16 As a result, significant interest in developing diagnostics for EGR-system optimization has steadily increased. This work describes the development and application of a fast and sensitive laser-based 4× multiplex EGR probe to on-engine measurements of spatiotemporal EGR uniformity for enhancing development of efficient, clean, and durable engine systems.
Laser-based absorption sensors are ideal for probing spatiotemporal EGR distribution due to their fast sampling rate, high selectivity, multiplex capability, and ability to withstand harsh conditions.17,18 Measurements from such sensors, in turn, can be used to design more efficient and higher performance engines. As a result, absorption-based sensors have become particularly effective in combustion diagnostics and have been implemented under high temperature and pressure conditions.19,20 They have been applied in a wide range of applications from fundamental studies of chemical kinetic parameters in shock tubes 21 to commercial sensors for emission control. 22
Recent developments in laser technology have allowed the detection of an increasing number of relevant flow-field parameters by covering greater spectral regions from ultraviolet (below 200 nm) to mid-infrared (mid-IR) (up to 20 µm). The mid-IR spectrum is of particular interest for automotive applications since many intermediate and product species resulting from combustion have unique absorption features in this region. 23 Even in regions with spectrally dense overlapping features, the high bandwidth laser output can be tuned such that trace quantities of many specific gaseous species can be monitored free of interference. 24 The EGR uniformity in an engine’s intake EGR-air charge can be quantified by monitoring CO2, a major exhaust gas constituent 25 that possesses several strong absorption features in the mid-IR spectrum.
In a previous publication, 26 we reported on a mid-IR EGR probe based on broad-band CO2 absorbance using light-emitting diodes, i.e., the MIR-LED EGR probe. That instrument also incorporated a minimally invasive single-access-point measurement probe, and was demonstrated for on-engine spatial and temporal EGR uniformity measurements. The MIR-LED diagnostic has many features amicable to on-board diagnostic (OBD) applications, including low-cost source components, and insensitivity to temperature and pressure fluctuations; this might be implemented with hardware for refreshing the optical access from particulate-matter fouling (e.g., mechanical wiping implemented via a rotating window or shape-memory alloy actuator). However, the MIR-LED EGR probe, despite providing valuable insights to advancing engine efficiency, has distinct limitations regarding temporal resolution, sensitivity, and ability to make simultaneous measurements at multiple locations. Here, we describe an improvement of this diagnostic enabled by replacing the LED source with a laser source to enable high-sensitivity, fast, and simultaneous multi-point measurements; the laser-based multiplex EGR probe. The diagnostic retains the benefits of the small single-assess-point probes for enabling broad application to advanced-packaged engines. The higher power of the laser source enables the instrument to be multiplexed to four probes for simultaneous measurements at four locations, thus quadrupling the information rate for a given experimental campaign. Higher laser power also improves the signal-to-noise ratio (SNR), lowers integration time, and thus improves temporal resolution. The narrow linewidth of the laser source allows a single CO2 absorption transition to be probed, versus the broad-band multi-line absorption of the LED-based diagnostic; this provides for uniform sensitivity over a wide range of relevant CO2 concentrations, and specifically improves the sensitivity at higher CO2 concentrations. The improved laser-based multiplex EGR probe is described along with applications to resolving actual EGR spatial and temporal distributions for developing advanced engine systems and improved design models. The results demonstrated accurate on-engine high-speed (>5 kHz; <1.2 CAD at 1 k RPM) measurements of spatiotemporal EGR uniformity up to 5% CO2 concentration, and the ability to resolve individual cylinder and cycle events.
Spectroscopy
The mid-IR spectrum typically refers to electromagnetic radiation in the 2–20 µm wavelength range. Light-matter interaction, such as absorption, at these wavelengths often results in rovibrational energy transfers. Mid-IR absorption occurs when a molecule interacts with a photon of specific wavelength matching the rovibrational energy gap of its valence electrons. The energy-level spacing of a given molecule can be affected by many factors such as molecular composition, geometry, and bonding. As such, absorption tends to be a very selective process and can not only be used to differentiate various molecules, but also their isotopes and isomers. For instance, CO2 is a linear triatomic molecule with a total of four normal vibrational modes; symmetric stretch (ν1 = 1388 cm−1 or 7.2 µm), bending (ν2 = 667 cm−1 or 15 µm, degenerate), and asymmetric stretch (ν3 = 2349 cm−1 or 4.3 µm). Various combinations of these modes contribute to the absorption spectra of CO2. With the exception of the fundamental ν1, in which the vibration mode does not interact with IR light due to the net effective change in the electric dipole moment being zero, absorption across any uniform and optically thin medium can be described using the Beer–Lambert relations,

Several considerations must be made when selecting a proper CO2 line for EGR diagnostics. The line should be free of interferences, be it self-induced or from other molecules. Water (H2O) is a major combustion product and can interfere with EGR measurements even at small concentrations. A plot of CO2 and H2O absorption cross-section in the IR spectrum is shown in Figure 1. The two CO2 bands near 1.6 µm and 4.3 µm are isolated, whereas the bands near 2.0 µm and 2.7 µm overlap with H2O bands. The absorption spectra of CO2 and H2O differ greatly, despite both being triatomic molecules, due to differences in molecular structure. Carbon dioxide is a linear molecule and therefore agrees well with a diatomic rovibrational model,
28
which assumes that the vibration and rotation in a rigid rotor are independent. Three distinct CO2 absorption bands near 2.0 µm (ν1 + 2ν2 + ν3), 2.7 µm (2ν2 + ν3), and 4.3 µm (ν3) dominate its mid-IR absorption spectrum.
Absorption cross-section of CO2 and H2O in the mid-IR spectrum at 300 K.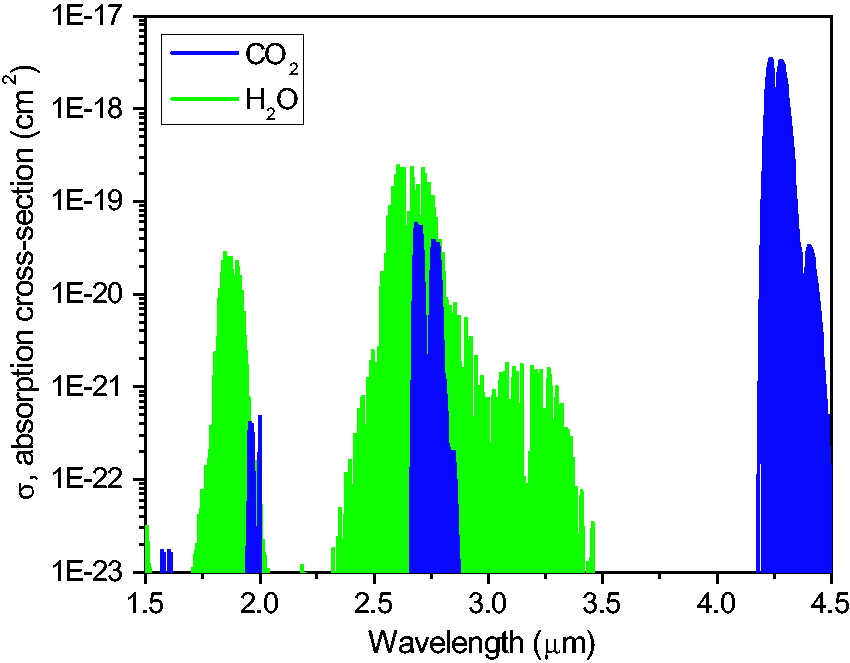
On the other hand, H2O is a bent triatomic molecule with a net dipole moment. Its molecular structure results in three normal vibrational modes, of which, fundamental O–H (hydroxyl) stretches (ν1 = 3657 cm−1 or 2.73 µm and ν3 = 3756 cm−1 or 2.66 µm) dominates the mid-IR absorption spectrum. Combination bands with its only bending mode (ν2 = 1885 cm−1 or 5.30 µm) and overtones populate the absorption bands near 1.87 um and 3.2 um. Accurate and interference-free CO2 measurements can be made by probing a CO2 absorption feature that is properly isolated from H2O features. The tunable and narrow-linewidth nature of distributed feedback (DFB) lasers allows interference-free CO2 measurements in any of three mid-IR CO2 absorption bands despite intra-band H2O interferences; this would not be possible with the broadband LED-based absorption measurements, and such broadband LED-based interference-free measurements are only possible in the 4.3 µm band due to the absence of H2O absorption features.
Another important factor to consider when selecting a proper absorption feature as the basis for measurement is the absorbance. The CO2 features near 4.3 µm are too strong for laser-based measurements, and create optically thick conditions at most CO2 concentrations relevant to engine EGR studies. Weaker CO2 lines near 2.7 µm produce more adequate absorbance levels under the EGR-application conditions. However, since the 2.7 µm CO2 band contains significant intra-band H2O features, specific care must be taken to avoid H2O interferences. In addition, the 1–1.5 atm pressure conditions inside the intake manifold can broaden nearby CO2 features such that their wings overlap the target measurement line; such is an example of self-induced interference. Careful analysis of the HITRAN database revealed several spectral regions free of H2O interferences in the 2.7 µm band. A small region centered at 2.706 µm has a few CO2 features which are sufficiently separated so as to avoid self-interference, as shown in Figure 2 for 296 K and atmospheric pressure conditions.
Simulated absorption spectra of CO2 and H2O near 2.7 µm using the HITRAN database at 296 K and 1 atm.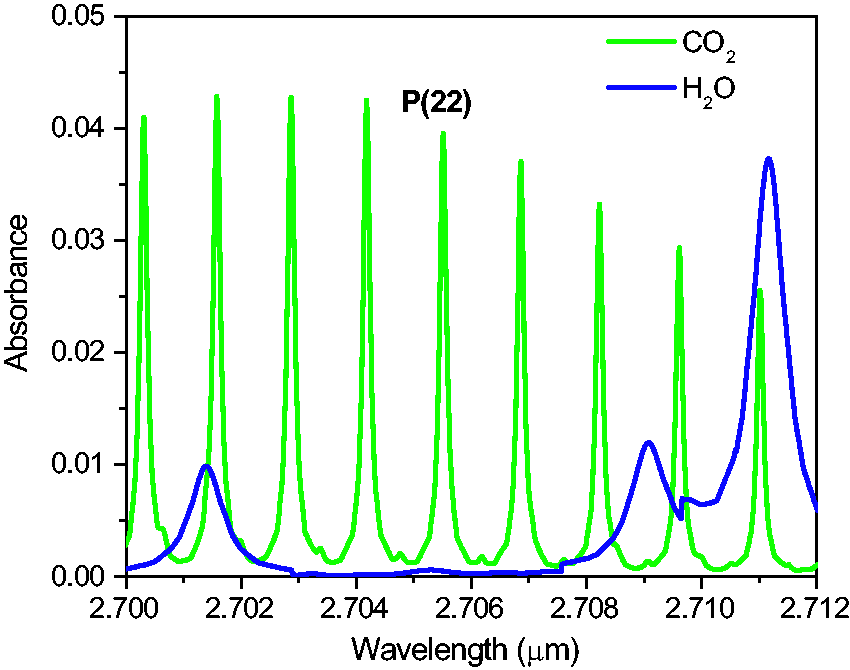
The CO2 absorption feature used for this study, P(22) at 2.7056 µm in Figure 2, is strong enough to provide precise measurements (i.e., good SNR) yet weak enough for applying the optically thin assumption at typical intake manifold CO2 concentration, temperature, and pressure conditions. It is easily accessible using a solid state DFB laser, which is ideal for field measurements due to its size and robustness. A custom laser (Nanoplus GmbH.) designed to produce stable output at 2.706 µm, specifically for the P(22) CO2 feature, and be tunable across 1.5 nm was used for this study. The laser output wavelength can be adjusted by altering the bandgap of the bulk semi-conductor material by controlling its driving current and temperature. This process is highly repeatable and is much faster than other tunable lasers such as a dye or external-cavity lasers. The resulting laser-based sensor can achieve an order of magnitude faster temporal resolution compared to our previously developed and applied light emitting diode (LED)-based sensor. 26 The LED-based system was limited to 1 kHz sampling rate due to low SNR but was usually capped at 500 Hz during engine experiments due to vibration interferences. The laser-based sensor, on the other hand, is only limited by the current and temperature controller circuitry. While the base sampling rate for this study was set to 5 kHz (1.2 CAD at 1 k RPM), the sensor can easily accommodate up to 20 kHz (1.5 CAD at 5 k RPM) resolution without significant loss of signal quality even during engine experiments; this is sufficient to resolve fast transients within a given valve event at higher engine speeds.
The laser was swept over a sufficiently wide spectral range so as to capture the entire lineshape of the selected feature. Due to coupling between the laser output wavelength and power, laser output power displayed a sawtooth pattern as the laser was repeatedly swept over the spectral window containing the target CO2 feature. The detected signal reflected this sawtooth nature with the CO2 absorption signal imbedded on the ramp and surrounded by measurement baseline beyond the spectral wings of the CO2 feature. Each sawtooth laser scan provided a measurement, and the corresponding ramp time defined the measurement temporal resolution. Since the CO2 signal is on a sloping baseline that may or may not be linear, proper baseline detection is critical for accurately assessing CO2 absorption. For this study, the baseline laser profile was sampled in advanced (in the absence of CO2), and the best polynomial fit was used to normalize the measured data. The calculated absorbance was then converted to CO2 number density using the Beer–Lambert relation. The comparison between measured and calculated absorbance is shown in Figure 3, where the simulated lineshape was calculated using the Voigt function with data from HITRAN. Results show very good agreement between the measured and calculated absorption features, which is an important verification process confirming that the baseline has been properly identified and normalized.
Comparison of measured and calculated CO2 P(22) absorption feature at 296 K and 1 bar.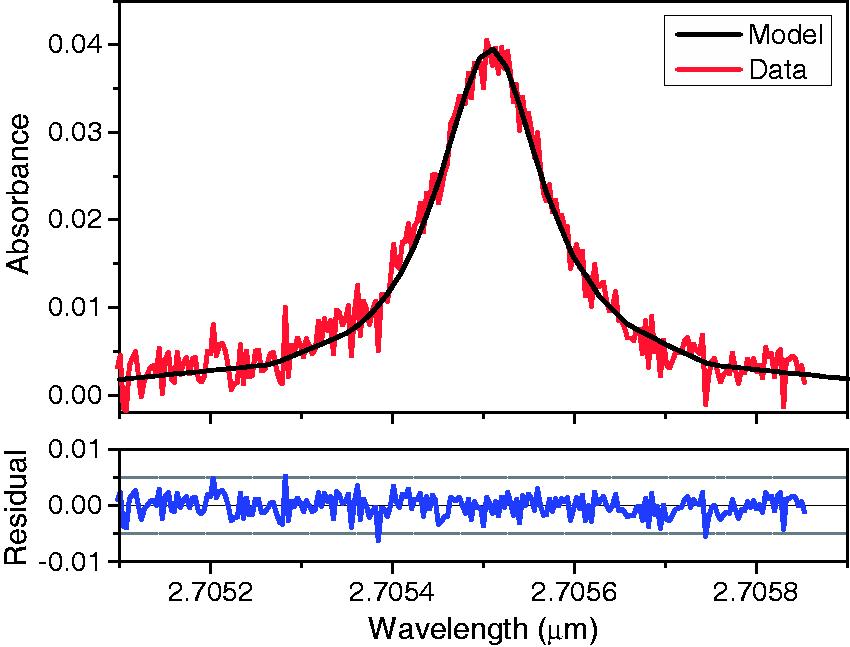
The diagnostic strategy was developed using a small flowing cell in a laboratory environment, free of interferences from engine operations. Various concentrations of CO2 balanced with N2 were examined using a gas divider. Each absorbance measurement was then fit to a best-fit Voigt profile and the area underneath the curve integrated. The integrated values can be directly correlated to CO2 concentration provided that temperature and pressure fluctuation at the measurement location are small. High-speed measurements indicated intake-manifold temperature and pressure variation to be approximately 2% and 3%, respectively. The former corresponds to 1.4% variations in absorption cross-section whereas the latter can be corrected by analyzing the measured lineshapes, i.e., pressure fluctuations were directly measured at the base sampling frequency via their impact on the spectral width of the P(22) absorption feature and corrected accordingly on a shot-by-shot basis. While this single-line diagnostic strategy is applicable for the relatively stable temperature conditions of an intake manifold, it can be limited for applications involving greater temperature variations; in subsequent development to be reported later we have incorporated a multi-line H2O diagnostic29,30 into the EGR probe for direct temperature measurement; the resulting probe 31 provides fast CO2, H2O, temperature, and pressure measurements using the multiplexed EGR probe discussed here. The single largest source for measurement uncertainty was from vibration in the hollow waveguides (HWGs), which can induce etalons and interfere with accurate baseline correction. This can result in imprecise results even when the measurement frequency is far removed from harmonics of the engine fundamental frequencies. Hollow waveguides were reinforced in an effort to mitigate these vibration-induced interferences. Measurement uncertainty under constant temperature and pressure conditions during bench calibration were minimal at 0.1% CO2 concentration fluctuations. On-engine measurement uncertainty is slightly increased to 1.1% CO2 concentration fluctuations, mainly due to HWG vibration induced by the engine. Practically, we observed that these uncertainties were much less than the actual CO2 concentration variations measured in on-engine applications.
Calibration curves for both the laser-based sensor and the LED-based sensor
26
are shown in Figure 4. The laser-based sensor provides linear sensitivity throughout the CO2 concentration range of interest, and continues to be linear up to 10% CO2 concentration. On the contrary, the LED-based sensor sensitivity rolls off at higher CO2 concentration and is therefore less sensitive at those concentrations. The reason for reduced sensitivity is likely due to inherent limitations of the LED-based system. Since the linewidth of an LED source is several orders of magnitude broader than a laser source, it was based on a broadband absorption over a CO2 band that is entirely free of H2O interference. However, due to the strong absorption characteristics of the fundamental ν3 band near 4.3 µm, the diagnostics no longer satisfied the optically thin medium assumption at higher concentrations and was thus less sensitive in that concentration range.
Absorbance comparison between the LED- and laser-based sensors using a similar probe-based experimental setup.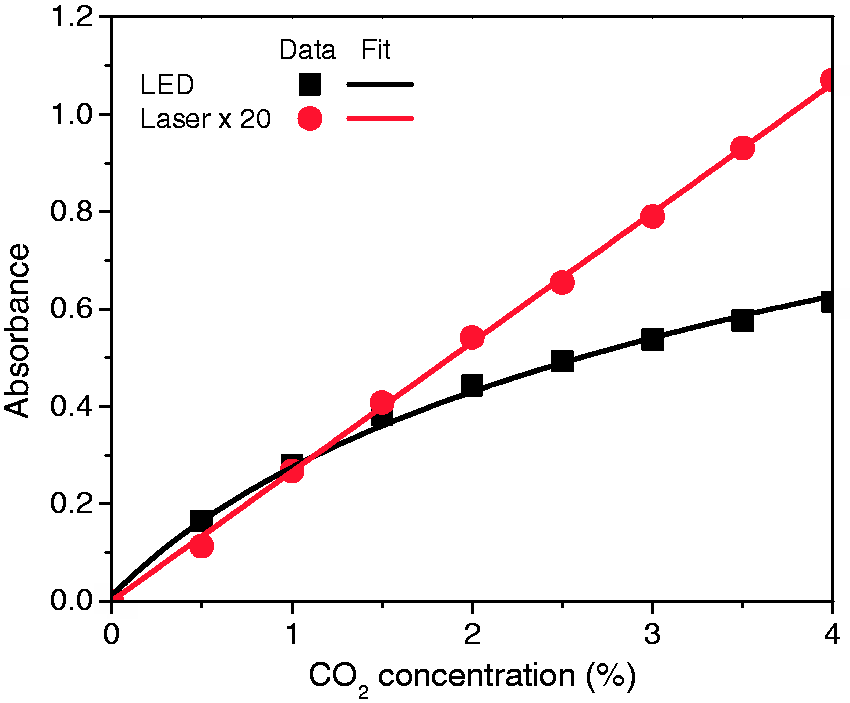
Light-source output power and coherence influences measurement sensitivity and applications. Because the laser output (2 mW) was several orders of magnitude greater than that of the LED (20 µW), it provided better SNR, and correspondingly greater detection limit and sensitivity. Moreover, the greater power and coherence of the laser source made multiplex implementation practical, and enabled simultaneous multi-probe measurements. This capability can be critical to engine development as it allows faster and more extensive system mapping, and correspondingly more efficient and thorough development. For example, single versus simultaneous multi-location measurements to quantify the impact of particular engine-parameter settings on detailed intake-EGR performance; this can be particularly applicable for modern engine systems which can have up to 16 independent control parameters to meet five or six major performance targets, and which in turn have very complex calibration spaces. Overall, the laser-based sensor far exceeds LED-based sensor in terms of sensitivity, dynamic range, temporal resolution, and multiplexing capability. These improvements enable correspondingly enhanced development of efficient and durable engine systems.
Experimental Setup
EGR Sensor
A schematic of the EGR sensor and probe is shown in Figure 5. The assembly containing the laser, beamsplitter, multiplex hardware, and detectors can be placed at a remote location in an environment-controlled enclosure. The laser was driven using a dedicated current source (ILX Lightwave LDX-3620B) and temperature controller (ILX Lightwave LDT-5910B). The laser light was separated using Pellicle beam splitters into four channels, and each channel was then focused and coupled into either a 1 m or 2 m long, 1000 µm inside diameter HWG (NA = 0.05, Polymicro Technologies, HWEA10001600) that delivered the incident light to the probe tip. Hollow waveguides are fused silica capillaries with reflective internal silver halide coatings that are flexible, have relatively small bend losses, and transmit an extremely wide range of mid-IR spectrum. Another set of catch HWGs collected and transmitted the signals from the four probes to corresponding dedicated detectors. The enclosure (containing the laser, multiplex unit, focusing optics, and detectors), and pitch and catch HWGs were purged with N2 gas to prevent ambient CO2 from infiltrating these components and interfering with the probe CO2 measurements.
Experimental setup with beam splitter assembly coupled to four probes and detectors. Probes, for instance, can be placed at the mouth of intake runners to study cylinder-to-cylinder variations.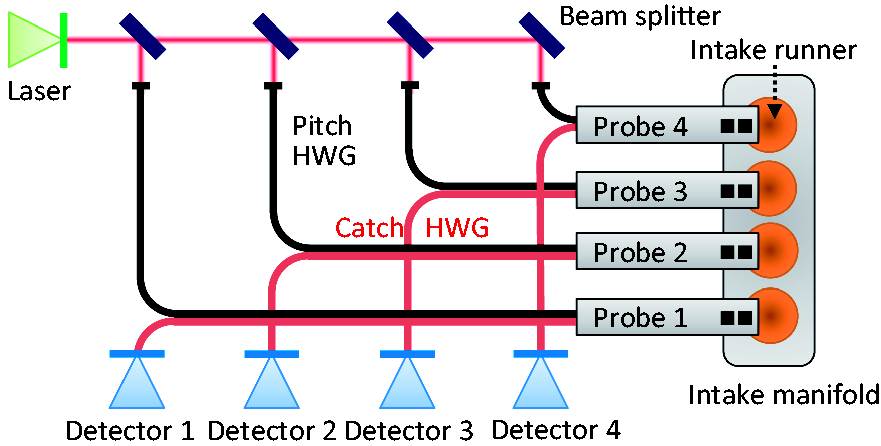
The instrument was configured to perform four simultaneous measurements. Once the incident laser light was multiplexed, each probe became a standalone sensor and the collected signals were processed independently. The EGR probe is compact (3/8-inch outer diameter) and houses optical elements and mechanical parts required to secure its various elements during engine operations and couple the laser light between the pitch and catch HWGs as shown in Figure 6 and described in our earlier work.
26
It has two measurement ducts at the probe tip for the flow-field of interest to pass through and interact with the measurement laser light; the round trip absorption pathlength is approximately 1.2 cm. The probe can resolve spatial EGR variations by translating the probe tip across the flow of interest; as shown in Figure 6, a non-swaging graphite ferrule is used to fix the probe at a given location and yet allow for subsequent translation, and the probe’s measurement-ducts geometry, which defines the absorption pathlength, remains fixed for all probe orientations and positions. The combined height of the two measurement ducts (8 mm) dictates the probe spatial resolution. The single-point-access nature of the probe allows spatiotemporal EGR mapping at many engine-system locations and in advanced-packaged engines where two-point line-of-sight access is not practical. Moreover, because probe access requires only an NPT boss to accommodate a probe-mounting union (cf., Figure 6), it requires minimal modification of stock or base engine hardware and preserves the fundamental nature of the system under study. The four probes can be translated and even removed or swapped out without shutting down the engine. They are designed to be easily disassembled, cleaned, and reassembled to minimize engine down time. Under normal operation, one or two cleanings per day were sufficient to maintain the intended probe performance; and in typical cases only the probe optical surfaces exposed to the flow required cleaning without probe disassembly. A detailed description of the probe assembly is described in Yoo et al.
26
Schematic and pictures of the EGR probe. Laser light interacts with the gas mixture in two rectangular measurement ducts at the probe tip; the arrows in the schematic labeled “Gas Flow” indicate the measurement ducts. The lower picture shows the probe with an NPT union used for single-point engine access (i.e., the NPT fitting mounts on the engine at the required access point), and the non-swaging graphite ferrule used to enable probe translation. The right picture shows the EGR probe in an intake manifold; the probe version shown had a single measurement duct, but those used in the present study are as indicated in the schematic and lower-left picture.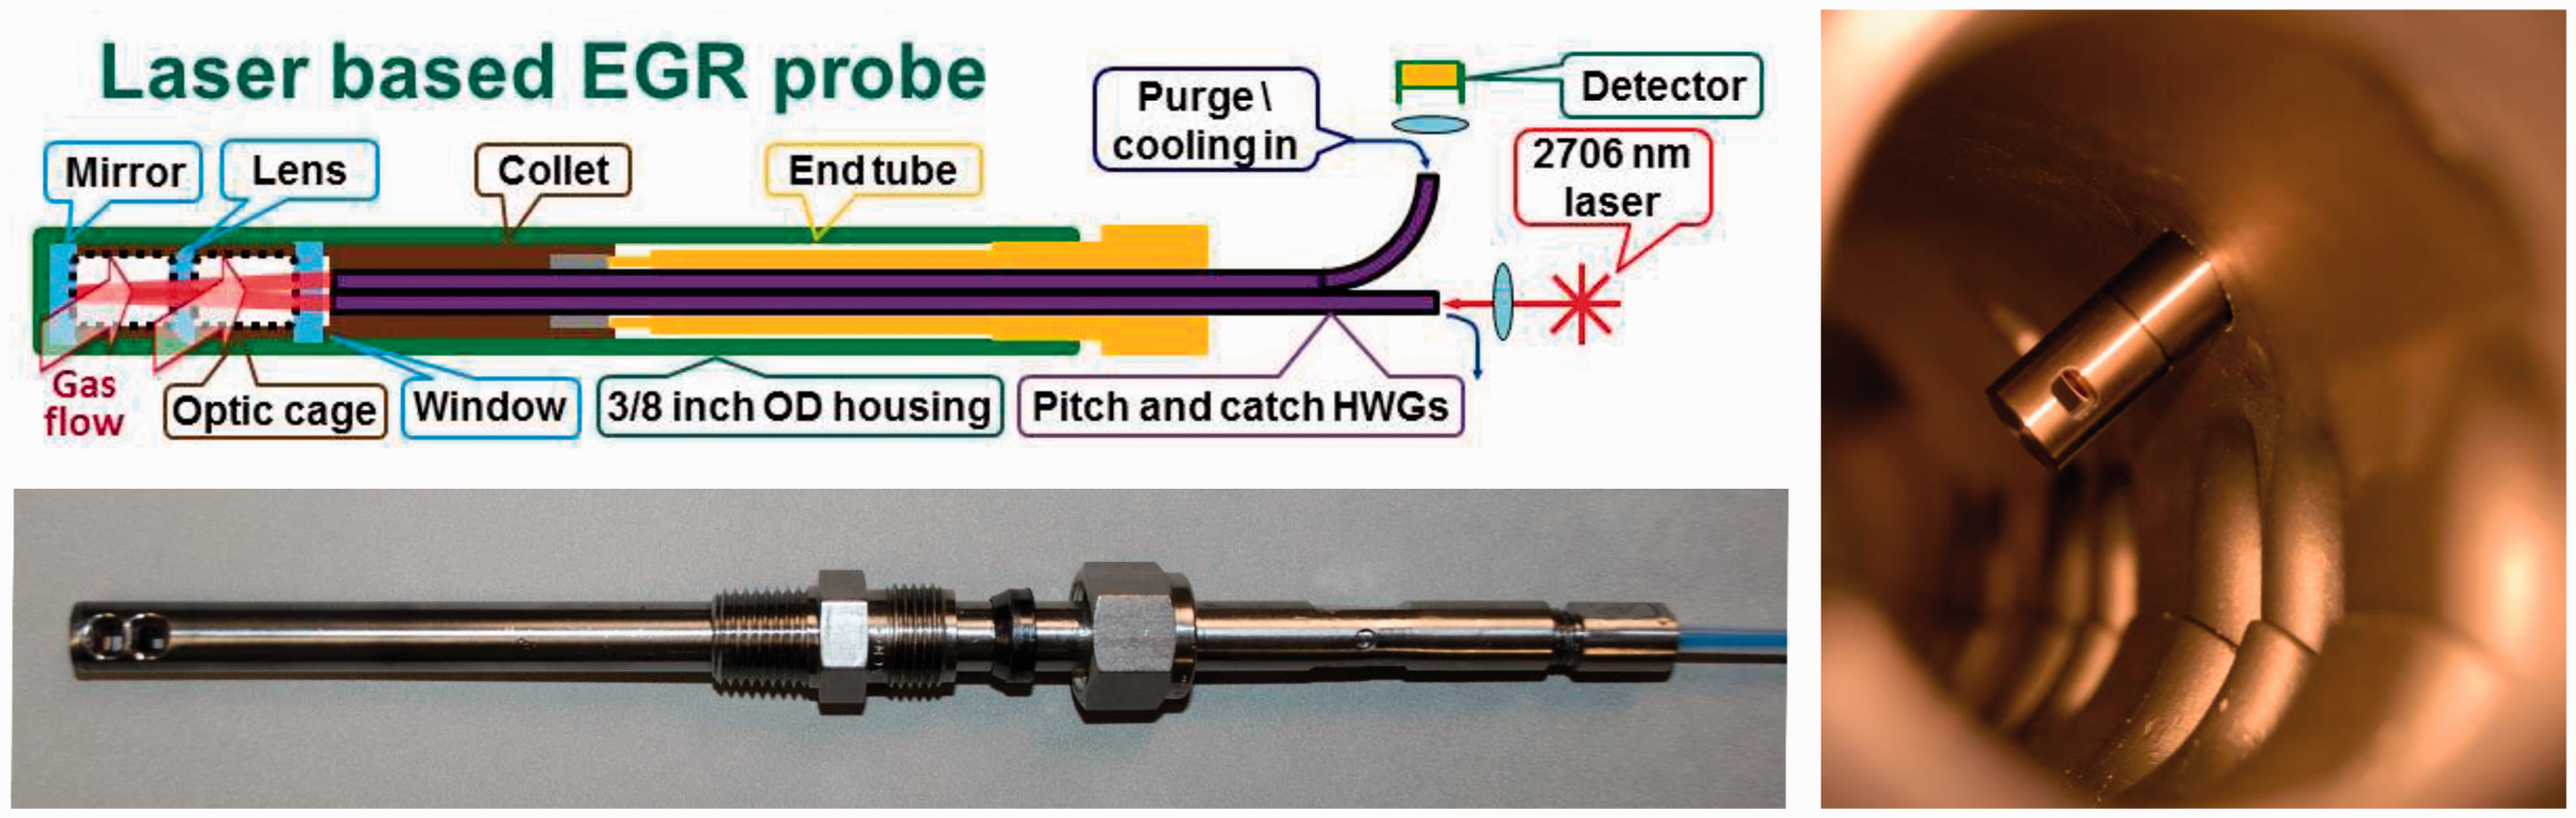
Engine
EGR probe demonstration of on-engine spatiotemporal EGR measurements was performed using an engine-dynamometer research facility in the Fuels, Engines, and Emissions Research Center at Oak Ridge National Laboratory. A four-cylinder General Motors (GM) 1.9 L diesel engine equipped with a high-pressure common rail fuel injection system, variable geometry turbocharger, and a cooled high-pressure EGR loop was used. The cylinders were driven by a fixed exhaust cam that maintained constant exhaust-valve timing regardless of engine speed. Detailed specifications of the engine are given in Yoo et al. 26 The engine was managed using a National Instruments Labview based control unit. The control system allows for full control over the various engine parameters, and was used to control the fueling rate to each cylinder and EGR-valve control. The EGR was metered by a production EGR valve mounted on one side of the intake manifold inlet; the exhaust gas entered the intake manifold normal to the fresh-air flow direction. Due to the intake and engine geometry, line-of-sight measurements across the entire manifold were impractical, and necessitated the need for a single-port probe technique. The probe was capable of traversing the entire 70 mm internal diameter of the intake manifold, and measurements were made at 10 mm intervals. The minimally invasive nature of the probe access methodology allows the major features of the intake manifold relevant to EGR spatiotemporal uniformity to perform as intended. Length markers on the probe were used to determine the radial location of the probe volume.
Results and Discussions
The laser-based multiplexed EGR probe performance was verified via in situ engine measurements at ORNL. Spatiotemporal resolution of the laser-based probe was demonstrated at several engine speeds and measurement locations within the intake manifold. The measurement locations as well as spatial resolution have been detailed in Yoo et al. 26 Spatial resolution is solely dependent on the probe-tip geometry, and is identical for the laser- and LED-based sensors since they are based on the same probe. In contrast, temporal resolution has been improved by at least an order of magnitude with the laser-based sensor. For validation, a single probe was mounted in the intake manifold immediately downstream of the EGR valve. The probe tip was positioned in the intake manifold such that it would observe the greatest exhaust-gas fluctuation. Measurements were performed at three engine speeds (1200, 1600, and 2000 RPM), and 40 ft·lb torque. For each engine-speed condition, the EGR fraction was set to the OEM (original equipment manufacturer) engine-map configuration, i.e., the base engine calibration settings specified by the manufacturer. The engine was allowed to reach stable operating conditions before data were collected, and no artificial fluctuations were introduced during measurement. The sensor was configured to acquire data at 5 kHz resolution which corresponds to 1.44, 1.92, and 2.4 CAD at 1200, 1600, and 2000 RPM, respectively.
Results from the laser-based sensor validation on the ORNL engine are shown in Figure 7, which includes a trace at 1200 RPM without EGR for comparison. The average CO2 concentration in the intake manifold with EGR for all three engine speed conditions was about 1.5%. Distinct and periodic flow features are apparent at all engine-speed conditions. These dynamic features are distinct and separated by 180 CAD for all engine speeds, indicating that they are a result of individual cylinder-exhaust events. For reference, the engine firing order was 1–3–4–2 (from left to right in Figure 7), and EGR dynamics associated with these four sequential cylinder-exhaust events occur every 720° engine cycle. At the lowest speed (1200 RPM) the intake EGR dynamics synchronous with cylinders −3, −4, and −2 (180–720 CAD in Figure 7) exhaust events display a high-frequency bimodal nature which is not present for the feature synchronous with the cylinder-1 (0–180 CAD in Figure 7) exhaust event. This is a case where the cylinder-1 combustion clearly differs from that of the other cylinders, despite the intended (desired) cylinder-to-cylinder uniformity and that all the cylinders were set to the same operating parameters. This discrepancy is likely a result of cylinder 1 experiencing higher EGR fraction charge compared to downstream cylinders, and as such its combustion characteristics are being affected; indeed, in a separate work we have reported extreme EGR spatial non-uniformity at low speeds spatially biased in a way expected to uniquely impact the cylinder-1 combustion.
26
At higher speeds, the dynamic EGR features become highly repeatable which indicates greater cylinder-to-cylinder uniformity likely due to improved mixing between the fresh air and exhaust gas. The laser-based sensor provided fast, accurate, and precise measurements under engine operating conditions. It also demonstrated that even with the shorter-wavelength laser, signal attenuation as a result of soot and window fouling was practically similar to that of the LED-based sensor and did not limit sensor application.
High-speed intake-manifold CO2 measurements under various engine speed conditions. A 1200 RPM case without EGR was collected for comparison.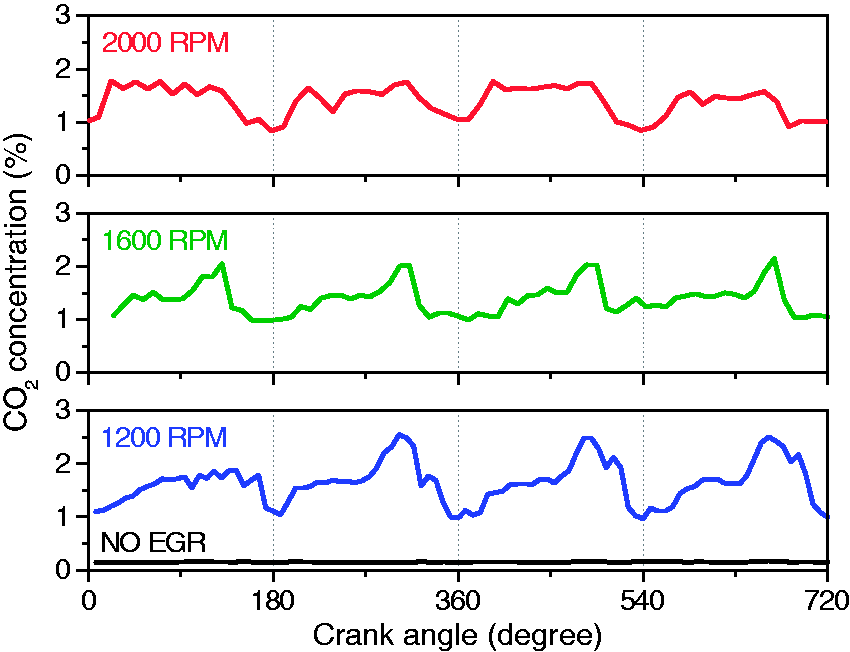
Spatially Resolved Measurements
The engine-verified laser-based sensor was used to analyze the performance of numerical design tools for engine-system-development applications by measuring EGR spatiotemporal distributions at the Cummins Technology Center in Columbus, Indiana. The validity of those tools was assessed by comparing the measured performance to model predictions. This study used a six-cylinder research (i.e., non-production-intent) engine system with an advanced intake architecture designed to minimize spatial and temporal EGR fluctuations. The intake system generally consists of an intake throttle, high-pressure EGR mixer assembly and inlet, and intake manifold (generally a long primary plenum with runners leading to the six cylinders). Two EGR mixer assemblies (Mixer1 and Mixer2) were evaluated under low, medium, and high speed and load conditions. The nominal EGR fraction differed slightly between conditions, and was set to maintain optimal engine stability. For all reported measurements, the engine was allowed to reach steady-state before data were collected at each engine condition and probe-tip location. These measurements were specifically intended to assess certain designs, models and assumptions, and the results do not reflect optimized or production EGR uniformity.
The four instrument probes were applied to monitor EGR charge entering each cylinder, and how cylinder-to-cylinder EGR uniformity was impacted by various intake-architecture parameters. The probes were positioned in the approximate center (with respect to both cross-section and length) of each intake runner and oriented normal to the bulk runner flow. The CO2 measurements were used to determine cycle-averaged EGR fraction at each measurement location. Figure 8 shows the deviation for each of the six intake runners from the commanded EGR fraction using Mixer1; perfect cylinder-to-cylinder EGR charge uniformity at the commanded value would be represented by all six data points being at zero deviation for a given engine condition. Each data point in the figure is averaged across at least 25 engine cycles.
Exhaust gas recirculation fraction measurements at several locations in the intake runner throat under various engine speed and load conditions. The deviations represent the spatial uniformity of the charge gas mixture.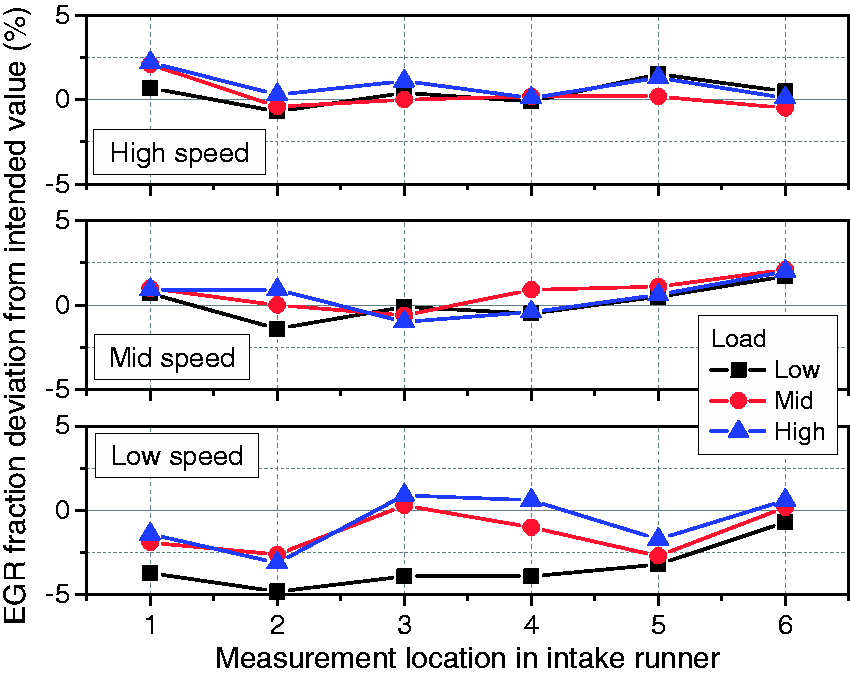
The greatest cylinder-to-cylinder EGR variation occurs at the lowest speed and is most prominent at the lowest-load condition. On the contrary, the charge gas spatial distribution is more uniform at higher engine speeds. Load conditions can also affect cylinder-to-cylinder EGR variation, particularly at the lowest speed. Overall, the mean EGR-fraction variations (averaged over the three loads and six locations) are 3.7%, 2.9%, and 2.3% at low, medium, and high engine speeds, respectively. These and other results indicate that this particular intake configuration is less effective at lower-speed conditions and would likely lead to rough idle.
Exhaust gas recirculation Mixer1 was further and more critically assessed by measuring the spatial uniformity of the EGR-air charge across the intake duct close to the mixer outlet, i.e., before additional mixing length between the mixer outlet and intake runners. An EGR probe was positioned immediately downstream of the Mixer1 output, oriented perpendicular to the flow to maximize gas flow through the probe measurement ducts, and translated across the centerline of the approximately 7 cm ID intake duct in 10 mm increments. Measurements were performed at various engine speeds and loads (same nomenclature and values used in Figure 8), and the results are shown in Figure 9. Under medium engine speed, all three load conditions produced very similar spatial EGR distribution, i.e., the CO2 concentration increased toward the distal end (70 mm), indicating a systematic spatial EGR non-uniformity exiting Mixer1 at the medium-speed condition. The low-speed results are more spatially uniform across the Mixer1 outlet, indicating good mixing along the probe-measurement path. However, there is more than a quarter percent difference in CO2 concentration at different load conditions. The differences may be due to variations in combustion characteristics that results in lower EGR charge at the low load condition. Similar variations were observed in the low speed conditions in Figure 8.
Spatial CO2 concentration distributions in the intake duct near the EGR-mixer outlet. The EGR probe tip was translated in 10 mm increments across the manifold cross-section under various engine speed and load conditions.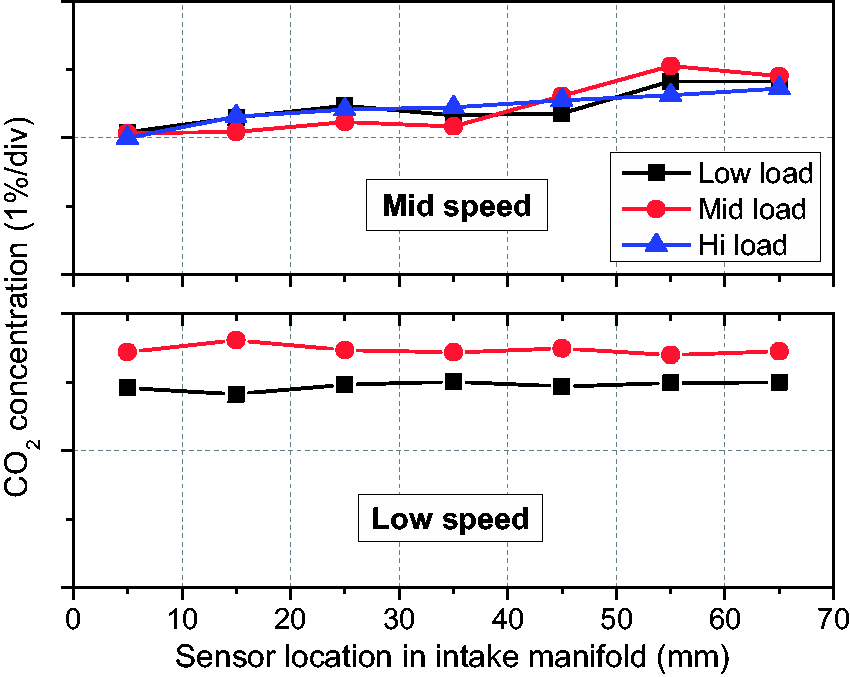
Understanding EGR spatial uniformity is an important step in improving engine efficiency. Non-uniform EGR can cause cylinder-to-cylinder charge variations inducing imbalanced inter-cylinder and inter-cycle performance, and mandating larger engineering margins and non-optimal control strategies limiting overall efficiency. Intake charge-gas non-uniformity can be particularly challenging with high-pressure EGR systems, where the air-EGR charge is not mixed through the turbocharger compressor. In more complicated situations, spatial EGR waves may propagate through the intake manifold causing similar charge-uniformity consequences depending on the timing between the intake events and the specific EGR-wave location. The EGR probe provides a broadly applicable diagnostic with single-point access, and which can quickly characterize the performance of various engine components with very little flow disturbance and hardware modification. Such in situ measurements will not only hasten the development of higher performance mixers and improved flow geometries, but also aid in the development of more accurate and detailed engine-component and system design models; this in turn accelerates and lowers the cost of developing advanced efficiency and durable engine systems. The spatially resolving EGR probe capabilities are not limited to assessing EGR uniformity, but are also applicable to other areas of efficient engine development including combustion uniformity and controls.
High-Speed Temporal Resolution
In addition to spatial uniformity, temporal uniformity is crucial for achieving peak engine performance and efficiency. Instabilities generally mandate greater engineering margins which reduce efficiency. Intake-manifold resonances can create a fluctuating EGR wave, which if synchronous with intake valve events could cause cycle-to-cycle and cylinder-to-cylinder combustion variations or instability. More likely are cycle-to-cycle variations caused by feedback inherent to the EGR loop, e.g., exhaust gas from a multi-cylinder engine subjected to cylinder-to-cylinder EGR variations will likely create a temporal train of irregular EGR pulses, which when mixed with fresh air can cause cycle-to-cycle variations. The high-speed laser-based probe can resolve temporal dynamics inside the intake manifold with near crank-angle resolution at 5 kHz temporal resolution or faster. This improved temporal resolution allows detection of short-timescale EGR dynamics that cannot be resolved via conventional analytical methodologies, and their assessment for developing more efficient and higher performance engines.
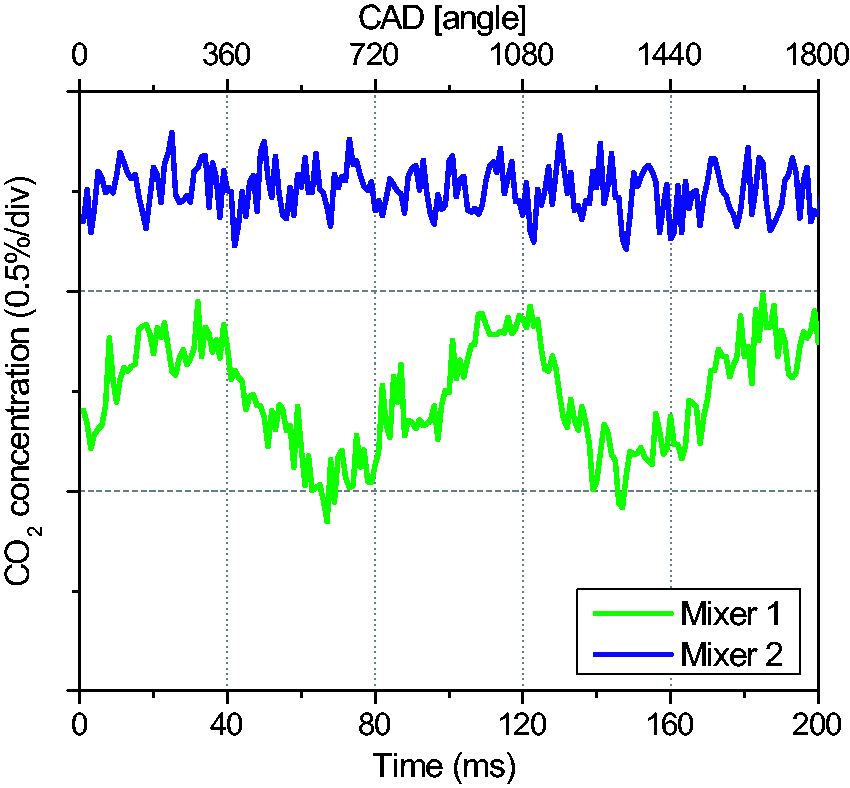
The temporal mixing capabilities of various mixing assemblies were assessed by characterizing their dynamic outlet performance under three different engine speeds and medium-load condition; same engine condition nomenclature and values used in the previous discussions. Temporal EGR uniformity results for Mixer1 are shown in Figure 10; for these measurements the EGR probe was positioned downstream of the EGR mixer in the nominal center of the main intake manifold inlet and oriented normal to the flow. For reference, the on-engine 1.1% measurement uncertainty is on the scale of the small fluctuations in the low-speed, low-load curve at approximately 400 CAD in Figure 10, and this scale can be applied to all curves; thus, it is apparent that most of the fluctuations in Figure 10 are actual variations greater than the measurement uncertainty. The relatively uniform CO2 at the higher speeds indicates good temporal mixing. However, the same assembly is not as effective at the slowest engine speed where cycle-synchronous dynamics are readily apparent. Figure 11 compares the temporal mixing performance of two EGR mixers (Mixer1 and Mixer2) at the medium speed and load condition; for these measurements, the EGR probe was positioned in the nominal duct-center of the EGR-mixer outlet and oriented normal to the flow. In Figure 11, the on-engine 1.1% measurement uncertainty is on the scale of the small fluctuations in the Mixer1 curve at approximately 120 ms; it is apparent that most of the fluctuations in Figure 11 are actual variations greater than the measurement uncertainty. These results show very different EGR temporal uniformity for the two mixer assemblies. Mixer1 exhibits periodic temporal dynamics that are synchronous with the engine cycles (720-CAD wide), and a significant peak-to-peak variation of about 0.5% CO2 concentration. Mixer 2 produces a much more temporally homogeneous EGR charge; while Mixer 2 produces higher-frequency EGR dynamics, their peak-to-peak variations are much smaller compared to those of Mixer1. The performance of the two mixers is generally similar at high speed and load condition (not shown), except the high-frequency intra-cycle dynamics are more apparent; these dynamics, also apparent in Figure 11, do not appear to be pressure or valve-event induced, and may be due to complex pulsation beating or interference within the mixer. In addition to the difference in temporal uniformity between the two mixers, the offset in Figure 11 indicates a difference in the spatial EGR distribution in the flow cross-section at the measurement location, i.e., the cycle-averaged EGR is approximately 1% greater at the mixer-out duct centerline for Mixer2 compared to Mixer1, and presumably the full-flow-averaged EGR should be identical for the two mixer configurations given that the same EGR was commanded at the common engine condition; however, because of limited time, we were unable to perform spatial mapping, like in Figure 9, of the two mixers to further prove this point.
High-speed (5 kHz) measurements of EGR temporal uniformity at the intake manifold inlet using Mixer1 at two engine speeds, and low- and high-load conditions. High-speed measurements of EGR temporal uniformity at the mixer-out location for two mixer designs, and medium speed and load engine condition. Identical measurement location with a different mixing assembly mounted upstream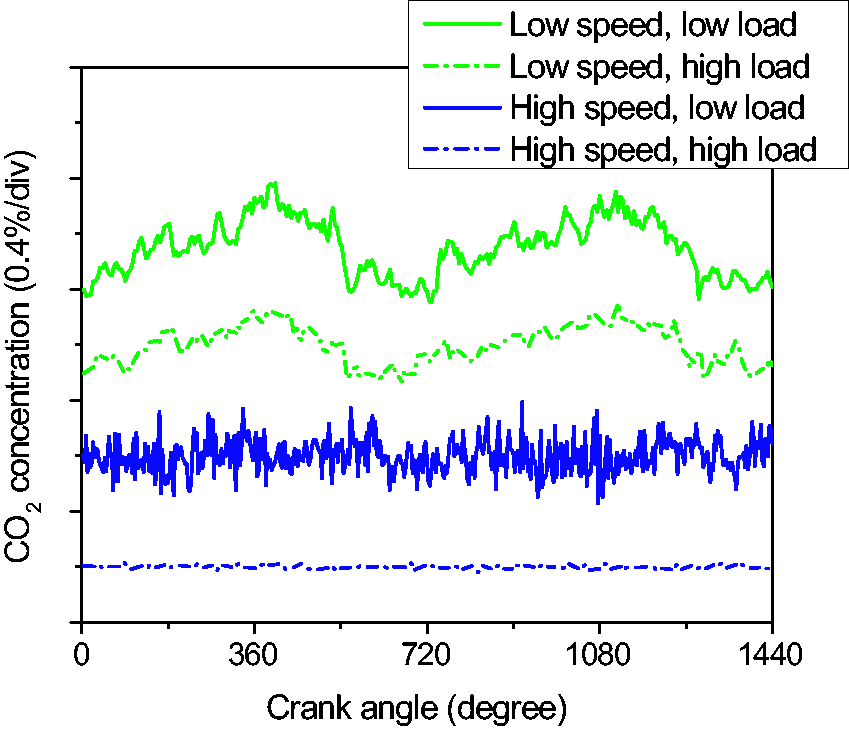
Similar measurements were made in the intake manifold to assess changes in the temporal EGR uniformity through the intake system for the two mixer designs at the medium speed and load condition. These measurements focused on the cylinder-W intake location, which was the fifth cylinder from the main intake plenum inlet, i.e., next to the furthest cylinder from the main-plenum inlet, and over 10 intake-duct diameters downstream of the mixer-out location (i.e., Figure 11 data). However, there were slight differences in the sampling location for the two mixer assessments; the EGR probe was positioned in the center of the main plenum for the Mixer1 measurements, and in the cylinder-W runner center for Mixer 2 measurements. Figure 11 shows the corresponding EGR temporal uniformity measurements for Mixer1 and Mixer 2 and the general intake valve timing sequence. Although the cycle-synchronous and greater magnitude EGR dynamics observed for Mixer1 at the mixer outlet (Figure 11) persist, the frequency has doubled to half-cycle period at the cylinder-W intake location, i.e., in addition to the peaks around 180, 900, and 1640 CAD observed in Figure 11, new features are observed at approximately 700 and 1420 CAD. This new dynamic does not appear to be due to pressure measurements; based on both an intake manifold cylinder-pressure transducer, and fast spectroscopic-based relative pressure measurements using the CO2 absorption-transition spectral width. Moreover, the structure and frequency is too slow to be attributable to reverse flow from a single valve event. Instead, the structure appears consistent with interference of two intrinsic Mixer1 EGR waves from adjacent cycles; regardless of the specific origin, this suggests complex intake flow dynamics capable of changing the nature of and yet sustaining temporal non-uniformities. Nevertheless, it is clear that the EGR is temporally non-uniform at the cylinder-W intake location, and that the EGR wave peaks during the cylinder-W intake event; this may cause cylinder-W to receive a higher EGR charge compared to if its intake timing corresponded to the valley of the EGR wave. The Mixer 2 performance is much more temporally uniform compared to Mixer1, and contains high-frequency dynamics similar to that observed at the mixer-out location (i.e., Figure 11 data). However, at the cylinder-W location, the Mixer2 charge dynamics exhibit a high-frequency cycle-synchronous low-EGR event (approximately 170, 890, and 1610 CAD in Figure 12) that is nearly synchronous with the cylinder-W start of intake and is likely due to associated flow dynamics; and the in-runner measurement location would likely be more sensitive to such high-frequency valve-induced events than the in-plenum measurements used for Mixer1. The EGR dynamics associated with the two mixers was generally similar at the cylinder-X location.
Evolution of EGR temporal uniformity through the intake system. Measurements at intake location corresponding to the fifth cylinder from the intake-manifold inlet.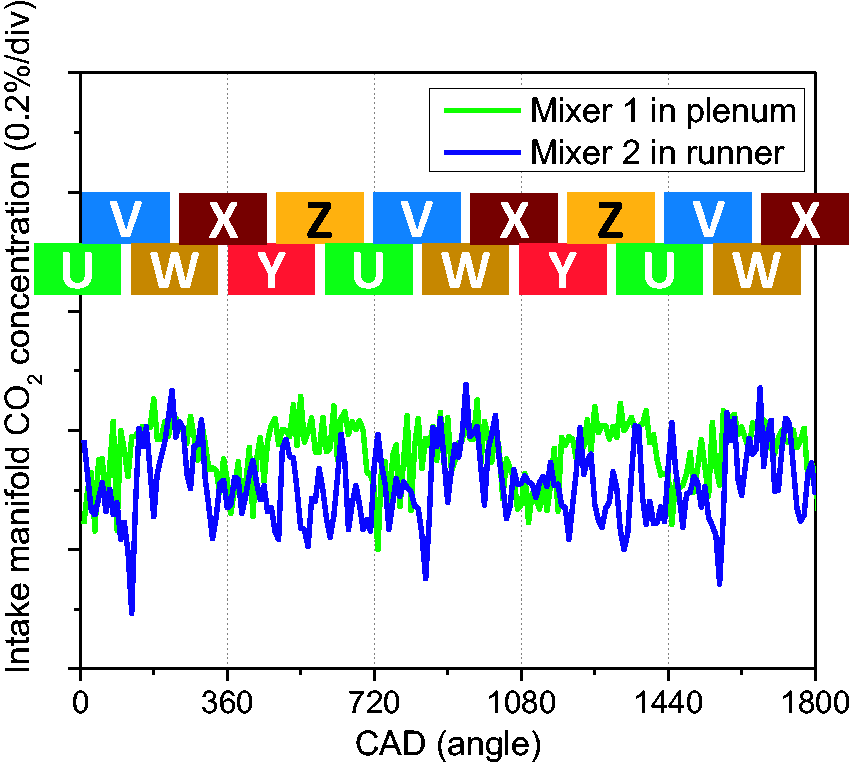
Further study of Figure 12 indicates new low-frequency Mixer2 dynamics which were not apparent at the mixer out, and which appear synchronous with those of Mixer1 in alternating half cycles, i.e., the low-frequency EGR dynamics for the two mixers overlay in the 0–360, 720–1080, and 1440–1800 CAD ranges, which also overlaps with the cylinder-W intake event. This suggests that a low-frequency EGR dynamic develops in the intake manifold independent of the mixer, and may be the source of the doubled low-frequency nature of the Mixer1 dynamic noted earlier. In fact, all of the structured Mixer1 dynamics could be due to intake-manifold dynamics, considering that the apparently broader dynamic in the 360–720 and 1080–1440 CAD ranges correspond with the intake of cylinders U and Y, which surround the cylinder-W sampling location used for Mixer1 measurements; and considering that the impact of valve events in adjacent cylinders might influence the flow dynamics in the main intake plenum. If this is the case, those dynamics might not be observed in the Mixer 2 measurements which were made in the cylinder-W runner, and which might dampen the impact of adjacent cylinder valve events, i.e., the broad low-frequency dynamics in the 360–720 and 1080–1440 CAD range are not observed for Mixer2. Regardless of the specific origin of these intake EGR dynamics, this work demonstrates the complex flow dynamics existing in the intake manifold which can influence engine performance and stability, and can be used to assess and develop advanced development models.
The EGR probe measurements have been useful for practical and fundamental assessment of the mixer designs and associated flow dynamics, as well as assessing the flow models used for system design. Figure 13 shows examples of the modeled and measured spatial and temporal EGR uniformity. The model predictions of cylinder-to-cylinder spatial EGR uniformity generally match the measurements within approximately 3–8%, and although the modeled and measured max- and min-EGR cylinders match, the model predicts different runner-to-runner distributions; the measurements also showed that certain intake locations had regularly greater variations than others. Figure 13 shows that the initial EGR mixing model was not able to accurately predict the temporal EGE dynamics, i.e., the Original EGR mixing model (black curve) has the same frequency as the measured dynamics, but different magnitude and shape. Certain modifications to the mixing model (see red dashed curve; improved EGR mixing model) greatly improved the magnitude and shape of the dynamic EGR predictions.
Application of EGR probe measurement data to tuning and assessing design models. (Top: 13T) comparing cylinder-to-cylinder spatial EGR uniformity. (Bottom: 13B) comparing temporal EGR uniformity.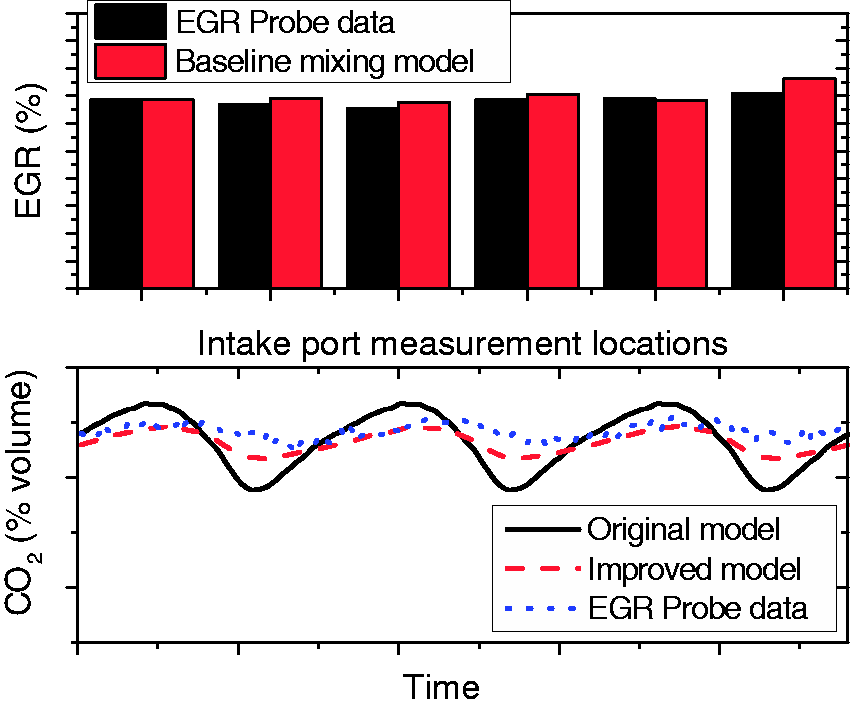
These results indicate that the laser-based probe can be used to acquire detailed short-timescale EGR dynamics with high temporal resolution. Understanding high-speed EGR dynamics is crucial for developing EGR systems and intake manifolds since homogeneous charge gas distribution to each cylinder during every cycle in a multi-cylinder engine can improve the overall engine efficiency. The EGR probe can quickly identify the effects of fast transient behaviors that affect overall engine efficiency and aid in the development of components and control schemes that can deliver a more uniform charge gas to the intake manifold. It can also be able to assess cylinder-specific combustion variations, misfires, and transients on a cycle-to-cycle basis.
Conclusion
A laser-based multiplex in situ EGR probe was developed using absorption diagnostics in the mid-IR spectral region, and enables fast, high-sensitivity, multi-point, spatially resolved, broadly applicable, and minimally invasive on-engine measurements of spatiotemporal EGR uniformity. This development is a significant improvement over our previously reported MIR-LED-based EGR probe 26 and enables simultaneous multi-probe multi-location measurements and resolution of high-speed intra-valve-event intake-charge dynamics. The probe is capable of performing detailed spatially and temporally resolved CO2 measurements using HWGs to couple the light in and out of the probe tip with minimal flow disturbances. The single-port EGR probe access allows measurements in hard-to-reach areas on a well-packaged engine with little modification to the stock or base engine hardware, and enables more accurate in situ analysis. Spatial EGR uniformity can be mapped via probe translation with 8 mm spatial resolution during engine operation. The laser-based system improves upon temporal resolution over the previously developed LED-based system by at least an order of magnitude. Moreover, the high-bandwidth laser-based measurements provided uniform high-sensitivity over a wide range of CO2 concentrations relevant to engine studies, versus the broadband LED-based EGR probe whose sensitivity dropped off significantly at higher CO2 concentrations. The laser source, due to its output power and coherence, can be multiplexed into four probes; this allows simultaneous multi-point engine measurements promoting faster technological development and providing more accurate assessment of the flow dynamics in EGR systems.
The diagnostic was developed and initially validated in an engine environment at ORNL to assess its spatial, temporal, multiplex, and on-engine capabilities. Measurements demonstrated linear response up to 5% CO2 concentration at a minimum temporal resolution of 5 kHz; more than sufficient to resolve individual cylinder valve events. The laser-based multiplex EGR probe was applied at Cummins’ development facility to assess specific intake architectures, their performance, and associated numerical design tools. These measurements provided unique insights regarding spatial and temporal EGR uniformity, and the mixing processes. In particular, the results provided unparalleled diagnostic capability of fast EGR dynamics that cannot be resolved with conventional analyzers. The improved EGR probe is capable of resolving EGR and cylinder-charge uniformity, and cylinder- and cycle-specific combustion uniformity which are key elements in improving numerical design tools and developing advanced efficiency and durability engines for improved energy security.
Footnotes
Conflict of Interest
The authors report there are no conflicts of interest.
Funding
This research was sponsored by the U.S. Department of Energy, Office of Energy Efficiency and Renewable Energy, Vehicle Technologies Program, with Gurpreet Singh, Ken Howden, and Leo Breton as the Program Managers.