
Abstract
Advances in consumer display screen technologies have historically been adapted by researchers across the fields of optics as they can be used as electronically controlled spatial light modulators (SLMs) for a variety of uses. The performance characteristics of such SLM devices based on liquid crystal (LC) and digital micromirror device (DMD) technologies, in particular, has developed to the point where they are compatible with increasingly sensitive instrumental applications, for example, Raman spectroscopy. Spatial light modulators provide additional flexibility, from modulation of the laser excitation (including multiple laser foci patterns), manipulation of microscopic samples (optical trapping), or selection of sampling volume (adaptive optics or spatially offset Raman spectroscopy), to modulation in the spectral domain for high-resolution spectral filtering or multiplexed/compressive fast detection. Here, we introduce the benefits of different SLM devices as a part of Raman instrumentation and provide a variety of recent example applications which have benefited from their incorporation into a Raman system.
Introduction
Raman spectroscopy has continually benefited from a variety of scientific and technological advances. For spontaneous Raman spectroscopy, back-thinned charge-coupled device (CCD) detectors allowed electronic readout of high-quality spectra at reasonable speeds, 1 high-power narrow-linewidth near-infrared (NIR) lasers provide almost ideal excitation sources for biological samples, 2 and high-fidelity optical filters now boast excellent rejection of excitation light with sharp edges close to the excitation frequency. 3 Coupling of these advanced optoelectronic devices to optical or completely different instruments such as scanning probe microscopes has enabled probing the molecular structure of materials with micro- or nanometer scale spatial resolution.4,5 All of these advances have transformed Raman spectroscopy from an expensive specialist technique to common bench-top instrument used across the physical and life sciences.6–8 Of course, advances in technology continue, with new and seemingly far-removed areas of optics finding uses in Raman spectroscopy instrumentation.
In this focal point review, we will describe the use of a class of devices termed spatial light modulator (SLM), which are increasingly used in various ways for both spontaneous and nonlinear Raman spectroscopic measurement. Most SLM device technologies were originally developed for use as digital display screen technology, where large arrays of individual electronically addressable pixels must rapidly modulate light by some physical means to produce an image. Perhaps the most familiar example of such a technology is the liquid crystal display (LCD), where electronic control of the liquid crystal orientation allows control of optical polarization, and, in combination with a polarizer, amplitude modulation of a backlight.
Historically, the prevalence of low-cost consumer LCDs led to their modification and use in optical instruments.
9
Here, instead of the amplitude modulation of an incoherent broadband backlight used for display purposes, laser light was directed onto the liquid crystal. As laser light is coherent, an ideal spatial cross-section of a laser beam will be constant in phase. An LCD screen can modulate the phase by some amount at each pixel at which some proportion of the laser passes through, as illustrated in Fig. 1a–c. This is the basis for a variety of subsequent techniques, which utilize the spatially modulated phase of the laser in some way as shown schematically in Fig. 2.
Basic concept of (a–c) phase and (d–f) amplitude spatial light modulation. (a) A simulated 8-bit SLM pattern, the bottom row of which is shown in (b), demonstrating the correspondence of image bit value with some phase value. The physical effect of this on a constant phase laser wavefront is shown in (c). A binary modulation pattern is shown in (d), with the data values, which correspond to the direction of a single micromirror, shown in (e). For an incident wavefront, this will direct part of the light +θ and the rest in the –θ direction. Illustration of types of spatial light modulation relevant to Raman spectroscopy. Common examples include excitation beam cross-sections, spectrally dispersed excitation pulse or spectrally modulated light detection. Patterns can include those corresponding to holographic, spatial, or spectral modulation. Results of these modulations involve multipoint illumination or spatial/spectral modulation. Other types of modulation may be possible. Importance of position of where LC-SLM placed in optical system.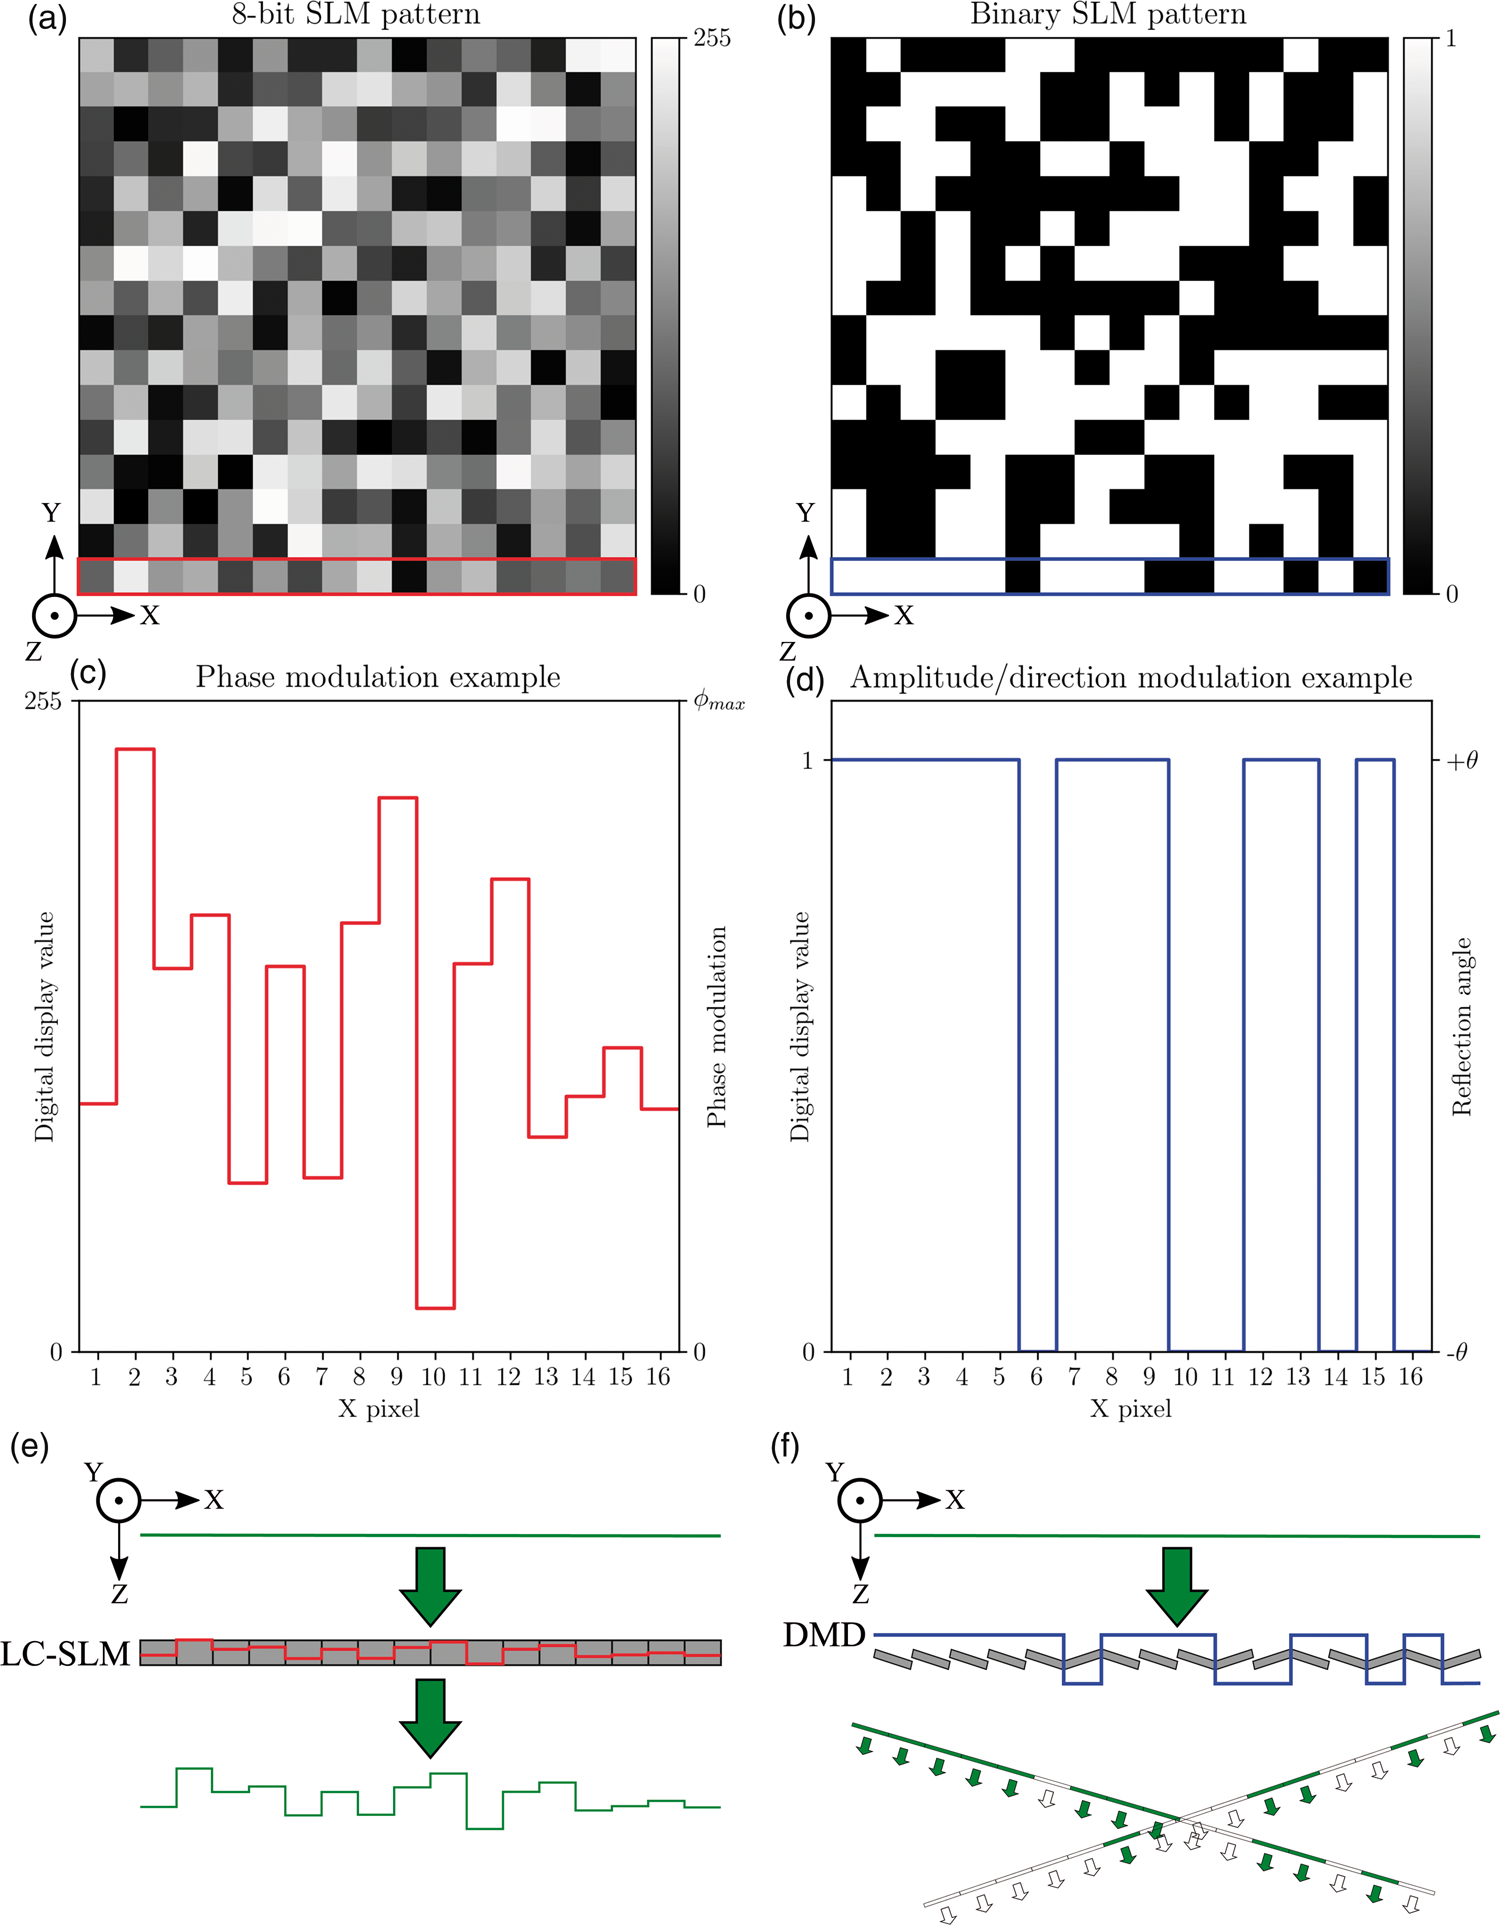

One example is for using the spatial-phase modulation to imprint a holographic pattern onto a continuous-wave (CW) laser wavefront. Placing the LCD in the back focal plane of a lens will result in a Fourier transform of the spatially varying phase pattern imprinted on the laser at the front focal point. With appropriate choice of phase hologram, the incident laser can be modulated to focus to multiple spatially separated points, allowing computer control of multiple laser foci, as used for optical trapping 9 and multifoci laser scanning microscopy.10,11 Liquid crystal spatial light modulators (LC-SLMs) have also commonly been used for shaping ultrafast laser pulses 12 and aberration correction of optical systems.13,14
More recent projection display technologies involve completely different approaches to light modulation based on micro–electro–mechanical systems (MEMS). The most successful MEMS display technology is the digital micromirror device (DMD) developed by Texas Instruments. These devices utilize arrays of microscopic mirrors (pixel units) whose reflection direction can be individually controlled electronically. Modern digital projectors utilize DMD technology, where video frames are generated by rapidly switching DMD patterns which provides spatial modulation of light amplitude to form the individual color channel image (different colors of which are generated sequentially).
Amplitude modulation with DMDs has been used for a variety of applications in optics, from single-pixel compressive sensing cameras15,16 and spatially encoded fluorescence spectroscopic imaging, 17 to their use as computer-controlled reflective apertures. 18 Many of these optical applications have focused on bright-field and fluorescence microscopy, where DMDs can modify the light fields in some desirable way as shown in Fig. 1d–f, to improve aspects of measurement such as speed or spatial resolution.
The use of SLMs in other areas of optical sensing preceded their use in Raman spectroscopy, which typically requires high-fidelity optical components to allow efficient excitation and detection, as Raman scattering is a notoriously inefficient process compared to laser-induced fluorescence emission or elastic scattering (typically 5–7 orders of magnitude lower). However, with the improvement of the optical throughput of SLMs, laser excitation and Raman detection losses have approached an acceptable operational range for their usage into Raman spectroscopy instruments.
This review will first describe commonly used SLM devices (primarily LC-SLMs and DMDs), their basic function, and some important parameters to consider for their use. Following this, we will review examples of SLMs used in Raman spectroscopy, highlighting examples where phase only, amplitude only, or phase and amplitude modulation in combination SLMs are utilized. We finish by discussing the outlook for SLMs applied to Raman spectroscopy and potential new areas for exploration.
Spatial Light Modulator Devices
Phase Modulation with Liquid Crystal Spatial Light Modulators
The LC-SLM is perhaps the most widely utilized SLM device, as liquid crystal technology was one of the earliest digital display screen technologies, the success of which has since led to them becoming relatively low cost and widespread. Generally, LC-SLMs are phase-modulation devices, where controlled phase delay is achieved pixel-by-pixel by electronic control of liquid crystal orientation axis. Nematic liquid crystals are almost exclusively used for one-dimensional (1D) or two-dimensional (2D) LC-SLMs.
The degree to which a liquid crystal is rotated determines the relative phase-shift of the light at each pixel (note: this implies the impinging light is polarized at a particular angle for efficient modulation). Liquid crystal SLMs are usually utilized in reflection mode as the LC control substrate is typically silicon (sometimes specified as liquid crystal on silicon [LCOS]-SLMs) with a high-reflectance layer. Transmission-mode LC-SLMs exist, though, are typically lower resolution and have lower optical throughput compared with their reflective counterparts.
Liquid crystal SLMs can often modulate broad spectral regions of light, in the range of 400–1600 nm, though the total phase shift will vary depending on the exact wavelength. Anti-reflective coatings can be utilized to improve throughput for a particular spectral range. The throughput also depends on other factors than reflection, such as the fill factor (percentage of total display area which can be utilized, related to dead space between active pixel regions) and the light utilization efficiency (fraction of total incident light which is controllably modulated).
Modulation speed is typically in the range of commercial display screen refresh rates (60–120 Hz), though with GPU acceleration this can be further increased.19,20 New devices developed by Meadowlark are also capable of faster refresh rates approaching 1 kHz.
The major manufacturers of LC-SLMs for scientific applications are Hamamatsu, Holoeye, and Meadowlark (formerly Boulder Nonlinear Systems). Hamamatsu has a wide selection of LC-SLMs, while Holoeye has the SLM with the largest number of pixels, and Meadowlark offer slightly higher-performance optical specifications. Jenoptic have a linear LC-SLM array for femtosecond pulse shaping. Thorlabs and Santec also have some 2D LC-SLM models, with the latter also having a model designed specifically for the ultraviolet (UV) wavelength region. Cambridge Correlators manufacture a low-cost LC-SLM (∼ £1000) option with relatively lower specifications, which is still highly suitable for optical trapping. 21 The LC-SLM cost is usually linked to optical throughput and pixel number, with the highest resolution and best performing models priced in the £20 000–30 000 region.
It should be noted that deformable mirror membranes also provide rapid continuous phase modulation, which is not polarization-sensitive, though at a much lower resolution than LC-SLMs. Such devices are typically expensive, though are more naturally suited to microscope aberration correction than LC-SLMs. 14
Positives
High pixel count displays (typically >1000 × 1000, the maximum known is 4160 × 2464 pixels for Holoeye GAEA-2); High-resolution phase control, typically ≥ 8 bits for 2π–8π phase modulation range per pixel; Some models are available with high fill factor (approaching 100%) and efficient optical throughput with anti-reflection coatings (>90% reflection); Can also be used for amplitude modulation with polarization optics.
Negatives
Polarization sensitivity; High-end models are expensive (order of £20 000–30 000); Calculation of optical efficiency is more complex than for purely reflective (mirror-based) devices, as LC modulation involves polarization, reflection, and diffraction effects; Undesirable higher-order diffraction effects from pixelated nature of device.
Amplitude Modulation with Digital Micromirror Devices
Digital micromirror devices have emerged in recent decades from MEMS technology developed by Texas Instruments primarily for projector display purposes. Image contrast in such an application is controlled by rapidly switching micromirror tilt angle with variable duty cycle corresponding to grayscale control for each color channel, with cycling through color channels building up a time-averaged color image. This technology has been exploited for binary and grayscale amplitude modulation in various areas of microscopy and imaging.
Fill factors are typically high; as the technology is mirror-based, total throughput can be >90% for visible–NIR (Vis-NIR) light. Thus, applications for modulating weak Raman photons can be implemented with negligible degradation of the signal.
Texas Instruments are the major manufacturer of DMD display devices. A low-cost DMD option is to modify a commercial projector product or evaluation board, such as the popular DLP Lightcrafter. Higher cost research-specific models also exist with direct access to the DMD display surface, with high-speed capability such as the Vialux V-700 with >20 kHz 1-bit array frame switching rates possible. Other than Texas Instruments, the Fraunhofer Institute for Photonic Microsystems also produce R&D MEMS mirror devices, including 1D DMDs with a frame rate up to 1 MHz.
Positives
Widespread commercial availability resulting in low-cost options, e.g., DLP Lightcrafter Evaluation development board available for approximately £500 (requires some modification to access DMD display); Rapid refresh rates (typically several hundred Hz minimum) possible when using predetermined low bit-depth patterns stored in on-device flash memory; Alternative display cable interfacing is simple to implement and allows standard video rate (60–120 Hz) of arbitrary patterns generated in real time; Optical losses are minimal in the UV-Vis-NIR, as the technology is based on aluminum mirrors; High-resolution displays are available (up to 3840 × 2160 in current DLP660TE devices); Not polarization-sensitive.
Negatives
Only amplitude modulation based on tilt angle is possible; Shallow mirror angles can make alignment difficult and often increases instrument size due to extra optics required. This is solved using integrated optics in commercial projector boards, which may not always be possible for prototyping in a lab on an optical table; Pixelated spatial profile can generate unwanted higher-order diffraction effects; Primarily designed for use in the visible spectral region, though NIR-optimized models are emerging.
Examples of Spatial Light Modulators Used in Raman Spectroscopy
Uses of Phase-Modulation Spatial Light Modulators
Phase-modulation SLMs are typically utilized in the excitation stage of a Raman instrument to modify the laser beam in various ways. While it may be possible to utilize modern LC-SLMs for modulating the detected Raman scattering, optical throughput is typically lower compared with mirror-based SLM devices and laser photons are generally more readily available than Raman photons. Additionally, the effects of phase control on coherent monochromatic laser light offers additional effects which can be capitalized upon, such as holographic phase patterning for multiplexed beam steering. Here, we will discuss the various applications of LC-SLMs demonstrated in Raman spectroscopy instruments for enhanced control of the excitation laser source in some way.
Spatially Controlled Spontaneous Raman Excitation
One of the biggest drawbacks in spontaneous Raman spectroscopy is the long acquisition times required for measurement, due to the inherently low Raman scattering cross-section for most materials of interest. The spontaneous Raman scattering intensity can be written as
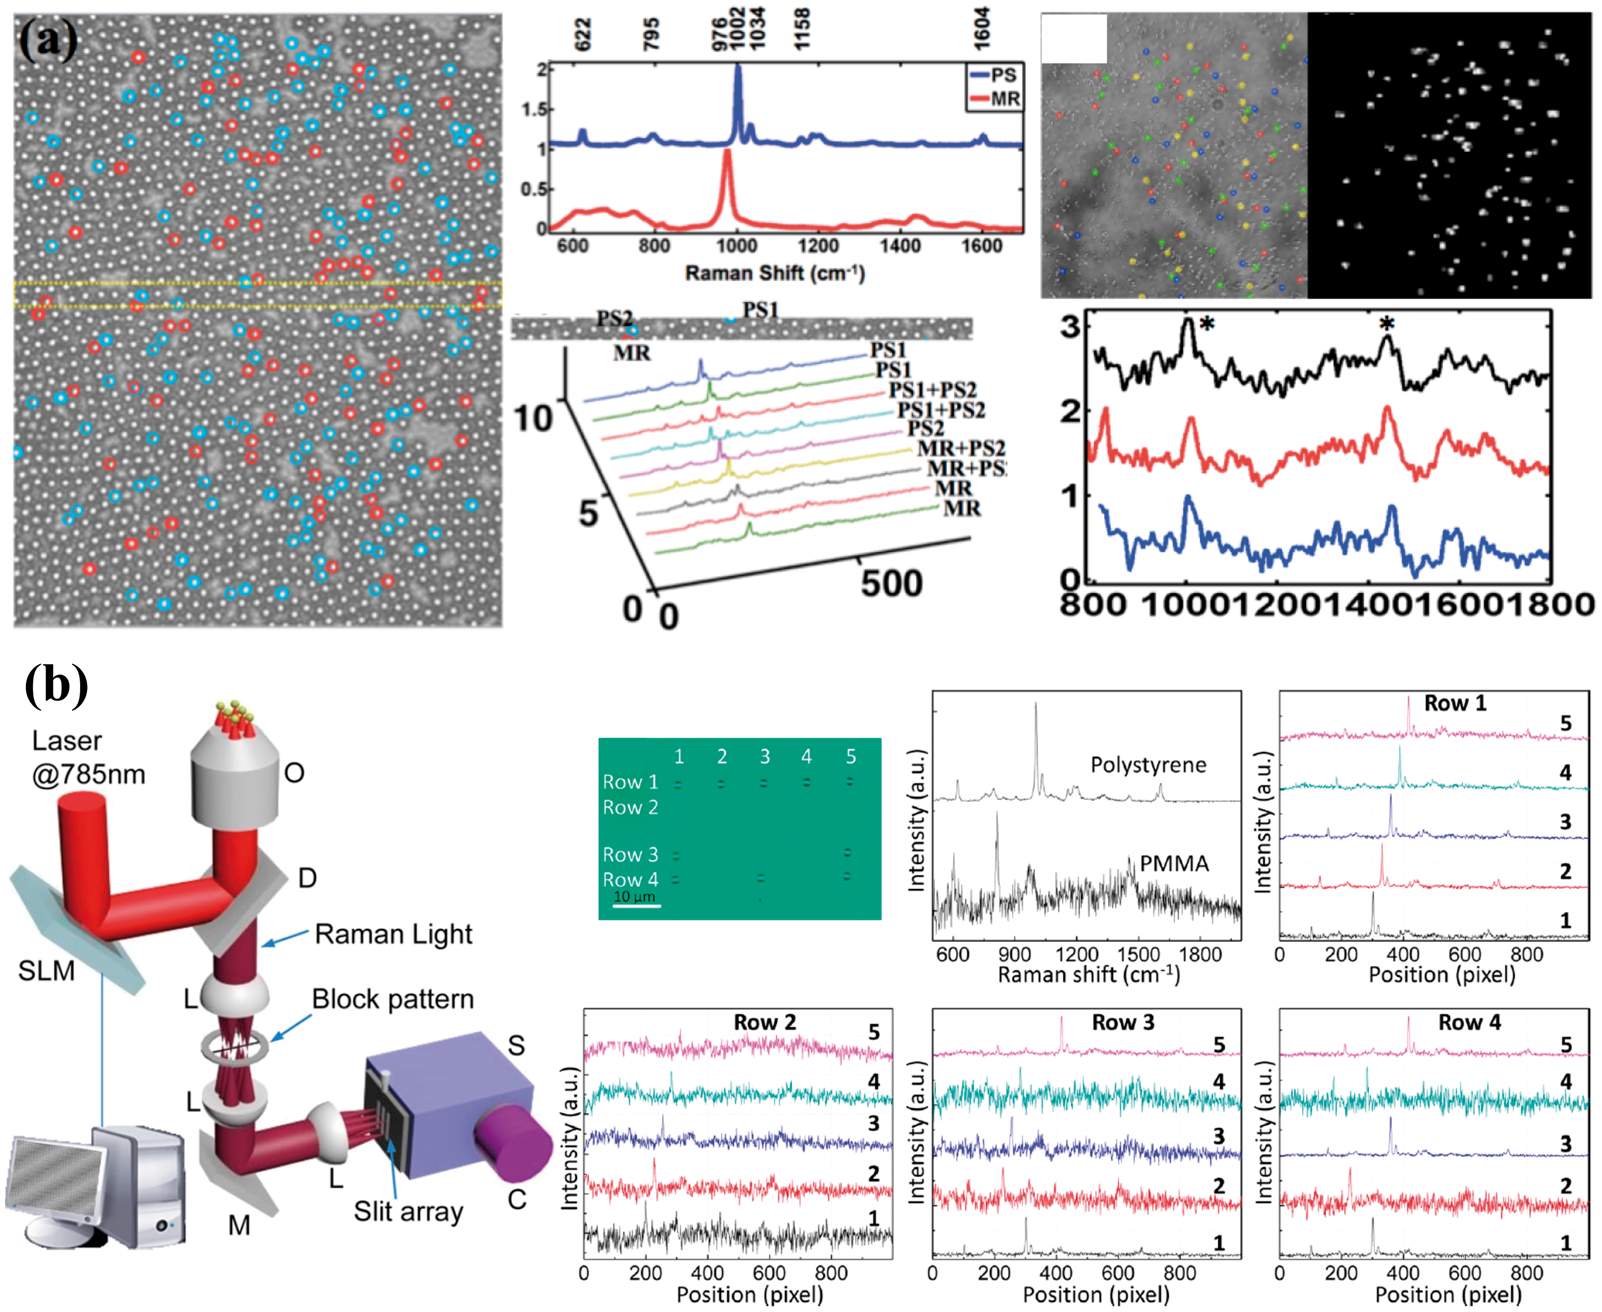
Several strategies have been proposed for increasing the speed of Raman hyperspectral imaging, including multifoci excitation, line scanning, and wide-field Raman imaging.10,22–24 One of the most direct approaches to such sampling is simply to create multiple parallelized laser excitation points for readout. Many approaches to this have been demonstrated, from using fixed optical elements such as lens arrays,22,25,26 to scanning galvo mirrors,27–29 and LC-SLMs.30–32 The LC-SLM approach allows the most flexibility, and truly simultaneous excitation (opposed to temporal scanning of a single high-power beam), though also involves added computational complexity and higher cost. Additionally, LC-SLMs generating multiple laser foci can also be utilized for holographic optical trapping (HOT). The first use of LC-SLMs for optical trapping in Raman spectroscopy was demonstrated by Qi and Shih,30 who were able to measure polymer microparticles at 1000 sampling points per second semi-randomly from a 100×100 µm2 field of view. Measurement of bacterial spores was also demonstrated at a measurement rate of 2.5 sampling points per second shown in Fig. 3a. In this study, patterns were generated such that sampling points did not overlap along one axis, as this would create cross-talk on the CCD used for Raman spectroscopic measurement.
For measurements involving sampling points overlapping on one axis, cross-talk can be avoided in several ways. Kong et al. 27 demonstrated galvo mirrors for realignment through a Raman CCD slit; however, this time-shared scheme would result in a loss of efficiency if an LC-SLM were used for power-shared excitation. In order to use completely power-shared LC-SLM excitation efficiently, Kong and Chan 32 developed an electronically controlled 4 × 5 block pattern matched to a slit array for Raman measurement from a multifocal array grid pattern as shown in Fig. 3b. With knowledge of which slit patterns were used for measurement, overlapping spectra could be computationally unmixed in post-processing, which was demonstrated for trapped arrays of polystyrene and PMMA microbeads.
Multivariate hyperspectral imaging (MHI) based on compressive detection is an alternative to achieve fast Raman mapping without using high laser power. Multivariate hyperspectral imaging is a compressive sampling strategy that utilizes a low-noise channel detector to simultaneously collect all the photons transmitted by a multivariate optical filter. In cases when the CCD read-out noise is the limiting factor, single channel detectors will have lower noise, and the collection can be much faster than CCD-based spectral detection methods. The multivariate filter plays a vital role in the MHI detection strategy, as it selects the photons to be collected, and Raman spectra are later reconstructed based on the spectral shape using the sequentially measured Raman photons. For detection of chemical mixtures, multiple spectral patterns may be needed for classifying the binned photons. Thus, the optical filter should be rapidly switched to implement different spectral patterns. Spatial light modulators are ideal for such an application, as they can be programmed to produce variable filters with different spectral shapes with a rapid refresh rate ensuring fast transitions between filter patterns. A compressed detection of Raman spectroscopy was also realized using two types of SLM: LC-SLM
33
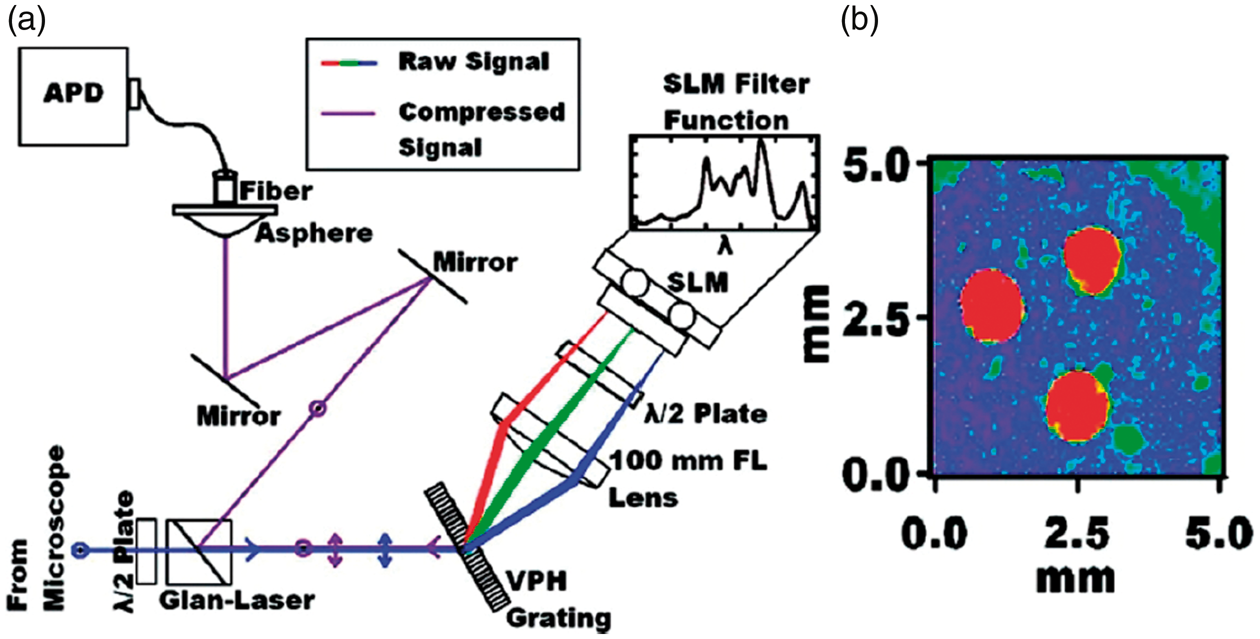
and DMD.34–37 Here we will briefly introduce the LC-SLM based system, as the DMD-based system will be presented in the amplitude-modulation SLM section of this review. Figure 4a shows the diagram of the LC-SLM based compressive detection optics. A LC-SLM was placed at the plane where a CCD camera located in a conventional Raman spectrometer. Raman scattered light was dispersed by a volume holographic grating and directed on the SLM. The SLM filter functions modulated the signal based on the polarization and reflected the desired photons back into the detection path. The reflected signal was then collected by a single channel detector, such as an avalanche photodiode (APD). Chemical imaging of an aspirin and theophylline composite sample demonstrates the high throughput of multivariate hyperspectral Raman spectroscopy using compressive detection. The total acquisition time of the chemical map shown in Fig. 4b was 30 s (100 × 100 pixels).
Examples of LC-SLMs for multipoint Raman spectroscopy. (a) Qi and Shih initially demonstrated the use of an LC-SLM for programmable multipoint illumination of laser sampling points for fast identification of microparticles. Reproduced with permission from the Optical Society of America.
31
(b) Spatial light modulator of an array of trapped particles overlapping in space, using an unmixing protocol to retrieve overlapped spectra. Reproduced with permission from the American Chemical Society.
32
(a) Multivariate hyperspectral Raman imaging optical system using LC-LSM. (b) Raman map of aspirin tablet with theophylline embedded (red), 100 × 100 pixels. Reproduced with permission from the American Chemical Society.
33
A similar approach to spatially encoded imaging was demonstrated by the group of K. Dholakia, who used an LC-SLM to create spatial eigenmodes for effective wide-field Raman imaging. 38 This approach used orthogonal 2D laser excitation patterns created by an LC-SLM to excite Raman scattering and measured using a standard Raman spectrometer. For sequential Raman measurements with different eigenmode patterns, Raman hyperspectral images could be generated, with adjustable signal-to-noise (S/N) ratio and spatial resolution depending on the number of sequential patterns utilized. Raman hyperspectral imaging of polymers, pharmaceuticals, and SERS probes was demonstrated with this approach.
The same group also utilized the first-order diffracted light from an LC-SLM for Raman measurement through a single multimode optical fiber.
39
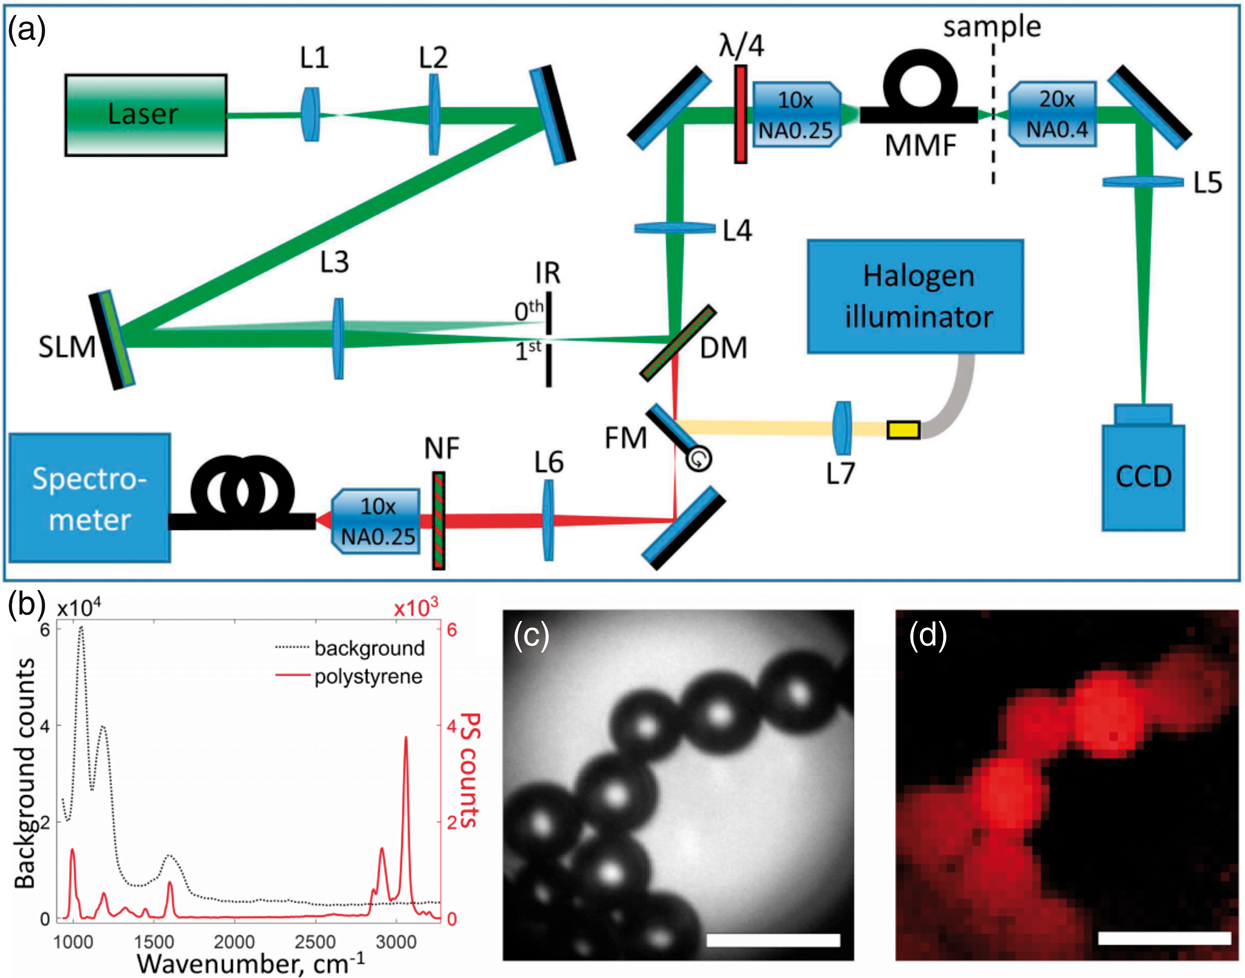
The SLM allowed the diffraction-limited excitation laser point to be spatially controlled in the third dimension (3D) at the distal end of the fiber, as shown in Fig. 5a. This enabled point-scanned imaging, which was demonstrated for polystyrene beads (Fig. 5b–d), bacteria clusters, and pharmaceuticals. This approach holds promise for endoscopic Raman hyperspectral imaging in biomedical applications.
Raman hyperspectral imaging through a multimode fiber. (a) Instrument setup. (b) Example fiber background spectra and polystyrene sample spectra. (c) A microscope image and (d) the corresponding point-scanning Raman image of polystyrene beads through the fiber. Reproduced with permission from the Optical Society of America.
39
Pulsed Laser Modulation in Coherent Raman Spectroscopy
Coherent Raman spectroscopy (CRS) techniques, in which pico- or femto-second pulsed laser excitation is used to excite molecular vibrations via the third-order nonlinear susceptibility, also have examples where SLMs have been utilized to improve the instrument in some way. However, whereas LC-SLMs used in spontaneous Raman spectroscopy are typically inspired by fluorescence or optical trapping, applications in CRS typically borrow from other multiphoton microscopy or ultrafast pulse shaping techniques. The two dominant CRS techniques are coherent anti-Stokes Raman (CARS) and stimulated Raman scattering (SRS), both of which provide orders of magnitude speed up in measurement acquisition times, though typically at the expense of spectral resolution and increased complexity. Both techniques typically require multiple laser wavelengths to generate a coherent vibrational state and to probe this state. 40
The first demonstration of coherent Raman spectroscopy with spatial light modulators was by group of Silberberg, who used an LC-SLM for pulse shaping.
41
While the refresh rate of any SLM (or indeed most optical devices) is completely out of reach of ultrashort pulse timescales, ruling out direct temporal modulation, spatial modulation of the dispersed pulse spectrum can instead be used for pulse shaping. For a femtosecond pulse, modulation of the pulse spectrum will result in the temporal profile of the pulse being modified (as the two are linked via Fourier transformation). This is typically implemented as a 4f pulse shaper, shown in Fig. 6a, where the SLM is placed at the central position of a unity magnification telescope with diffraction gratings at the front and back focal planes of the telescope.
12
Coherent Raman spectroscopy using LC-SLMs. (a) Schematic of the common 4f pulse shaper used to spectrally modulate femtosecond laser pulses. (b) Single-pulse CARS utilizing an LC-SLM pulse shaper to create a pump and temporally delayed probe. Interferograms with inset spectra of methanol (left), CH2Br2 (middle), and (CH2Cl)2 (right), and CARS spectroscopic images of CH2Br2 in a glass capillary plate. Reproduced with permission from Nature Publishing Group.
41
(b) Spectral tailoring of a femtosecond pulse for SRS imaging of multiple vibrational modes. The LC-SLM is used with polarization for amplitude modulation of the spectrum, where the spectral control is desired rather than temporal pulse control. This allowed imaging of proteins (orange, left), oleic acid (blue, center), and stearic acid (magenta, right) within a C. elegans organism. Reproduced with permission from Nature Publishing Group.
47
(d) Single-pulse 2D Raman spectroscopy, as an extension of the idea of the single-pulse CARS in (a), where instead two temporally delayed probe pulses are required for the Raman photon echo effect. Reproduced with permission from Nature Publishing Group.
46
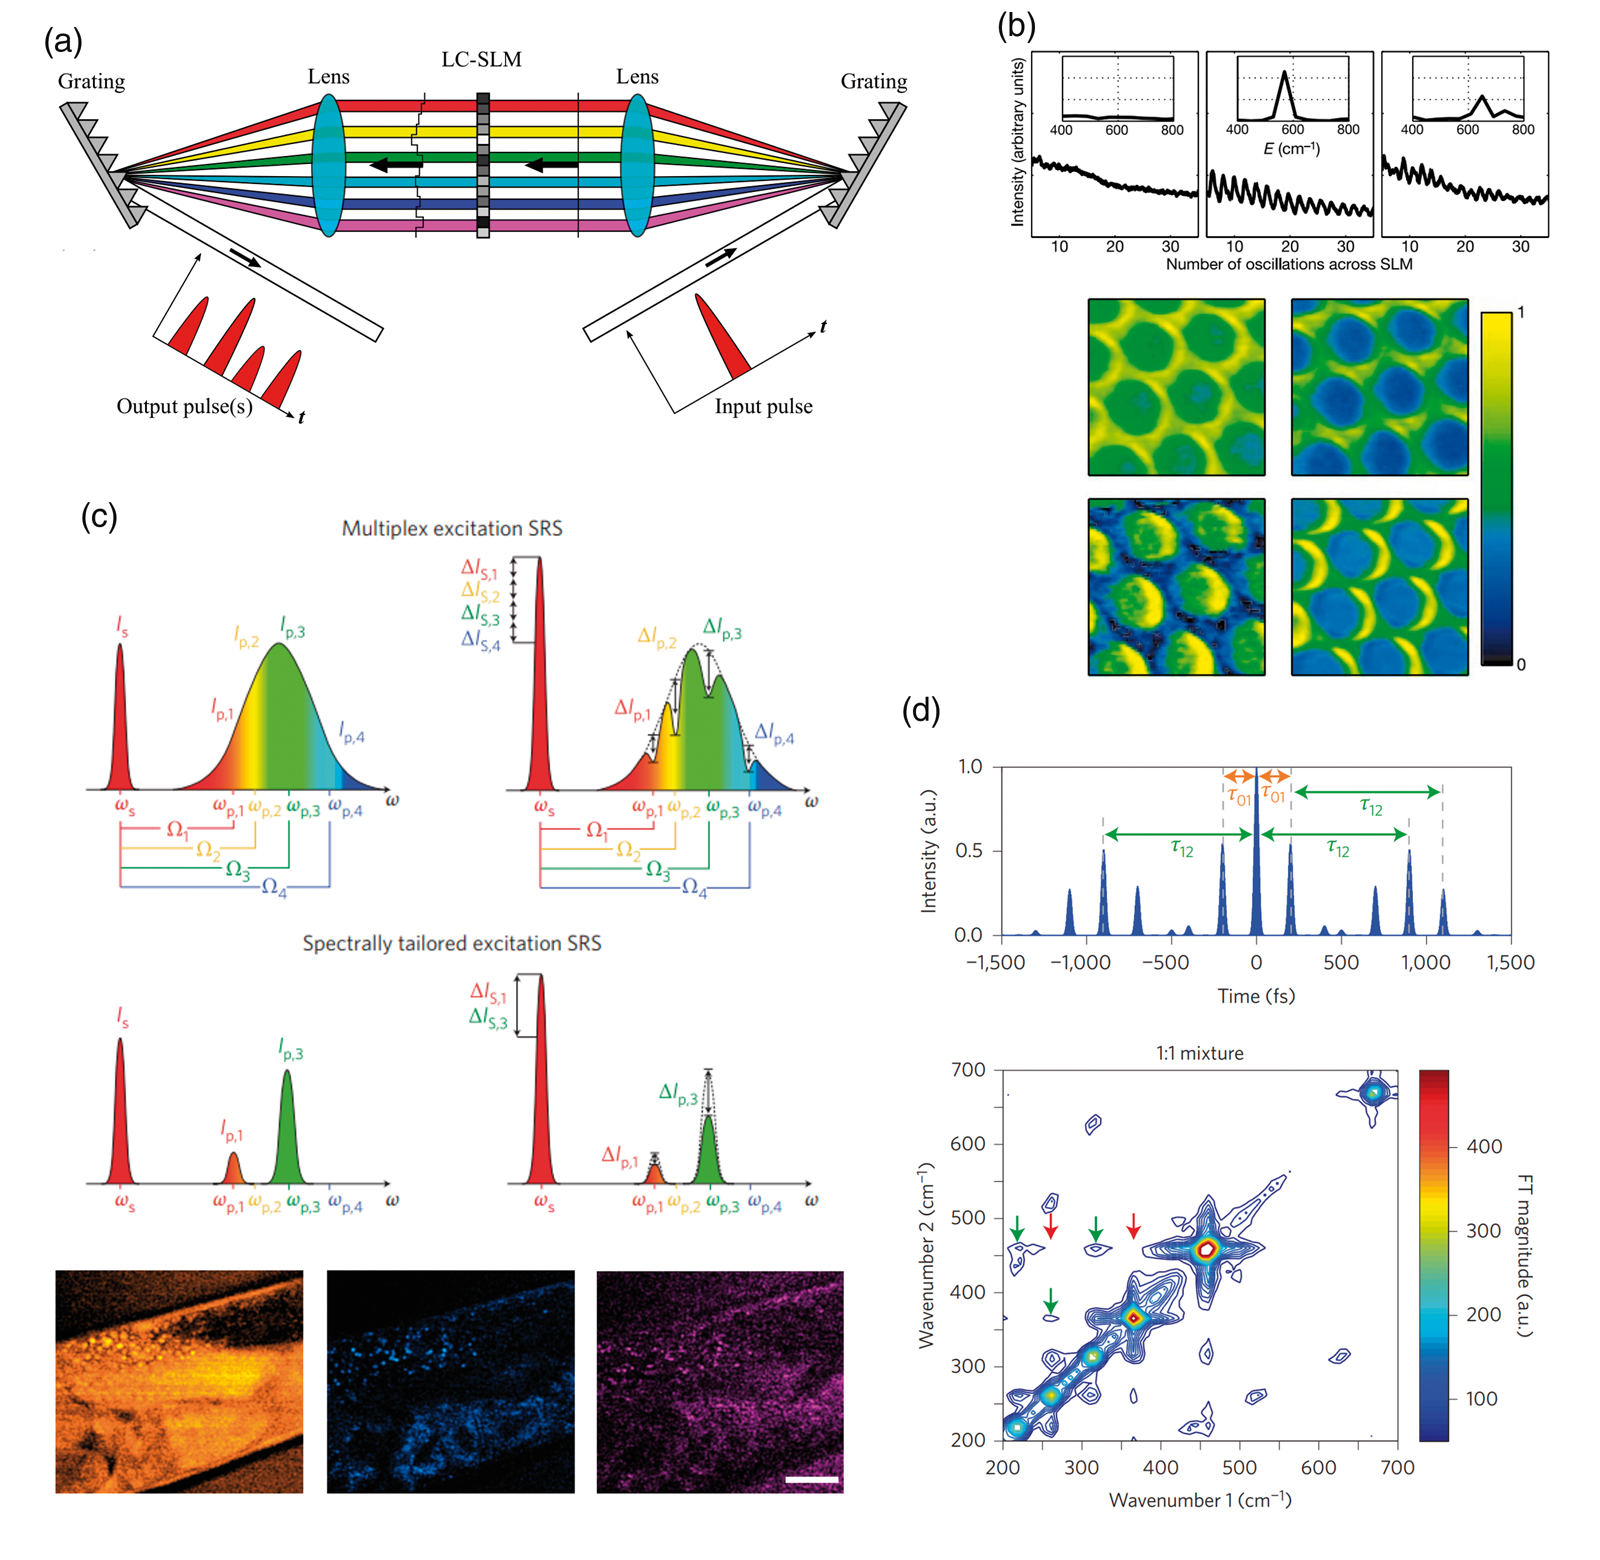
Femtosecond pulses are used for time-domain CARS, which is based on impulsive stimulated Raman scattering, whereby all modes within the pulse bandwidth are excited by a pump pulse, and CARS detection carried out using a time-varying probe pulse, generating a CARS interferogram, which upon Fourier transformation produces a CARS spectrum. Dudovich et al. utilized a pulse shaper to convert a single pulse into a pump pulse and temporally varying probe pulse, simplifying the optical setup considerably. This was possible using an LC-SLM in a pulse-shaping layout, to convert a single pulse into two controllably temporally separated pulses, which were utilized as pump and probe for the CARS process. 41 Using this approach, CARS spectra were able to be acquired in the 400–800 cm–1 spectral range, and CARS images of CH2Br2 liquid in a glass capillary plate were demonstrated (Fig. 6b). Using the core idea of single-beam pulse shaping, many other Raman-based excitation schemes have also been demonstrated including phase-contrast 42 and single-beam SRS. 43 The group of Motzkus have also extended the single-beam CARS approach by utilizing the attenuated edge of a pulse spectrum in the LC-SLM pulse-shaper as a local oscillator for heterodyne amplification to increase sensitivity by several orders of magnitude, 44 and have also combined the pulse-shaping CARS technique with other multiphoton imaging modalities. 45 Single-pulse 2D Raman spectroscopy was also demonstrated as shown in Fig. 6d, where pulses at three different excitation time-points were generated. 46 These methods utilize the impulsive stimulated Raman process driven by short (femtosecond) but broadband laser pulses to excite all vibrational modes within the pulse bandwidth. However, many CARS and SRS instruments utilize two or more narrowband picosecond pulses to excite Raman scattering from specific targeted vibrational modes. Halfway between is the use of both femtosecond and picosecond pulses for multiplex SRS/CARS. Freudiger et al. utilized an SLM to tailor the femtosecond pulse spectrum in a multiplex SRS microscope, allowing selective SRS excitations of vibrational modes within the pulse bandwidth as shown in Fig. 6c. 47 A pulse shaping configuration was also used for programmable control of a supercontinuum source, allowing shorter (femtosecond) pulse excitation for optimized second/third harmonic generation and two-/three-photon fluorescence microscopy, while picosecond pulses were programmed for CARS and SRS excitation. 48 Stranick et al. also used LC-SLMs for phase-contrast CARS microscopy, where the SLM in order to create a digital phase mask. 49
Phase modulation with a deformable mirror membrane was demonstrated by Wright et al. for adaptive aberration correction of a picosecond pulsed laser for deep-tissue CARS microscopy. 50 In principle, LC-SLMs can be utilized for such aberration correction, though deformable mirrors are better suited to this specific task as their phase modulation is continuous, not pixelated. 14
Uses of Amplitude Modulation Spatial Light Modulators
Raman Spectrometer Using a Digital Micromirror Device and Single-Element Detectors
Wagner et al. first proposed a relatively inexpensive solution to build an optical spectrometer using a DMD and a single-element detector, such as a photomultiplier tube (PMT).
52
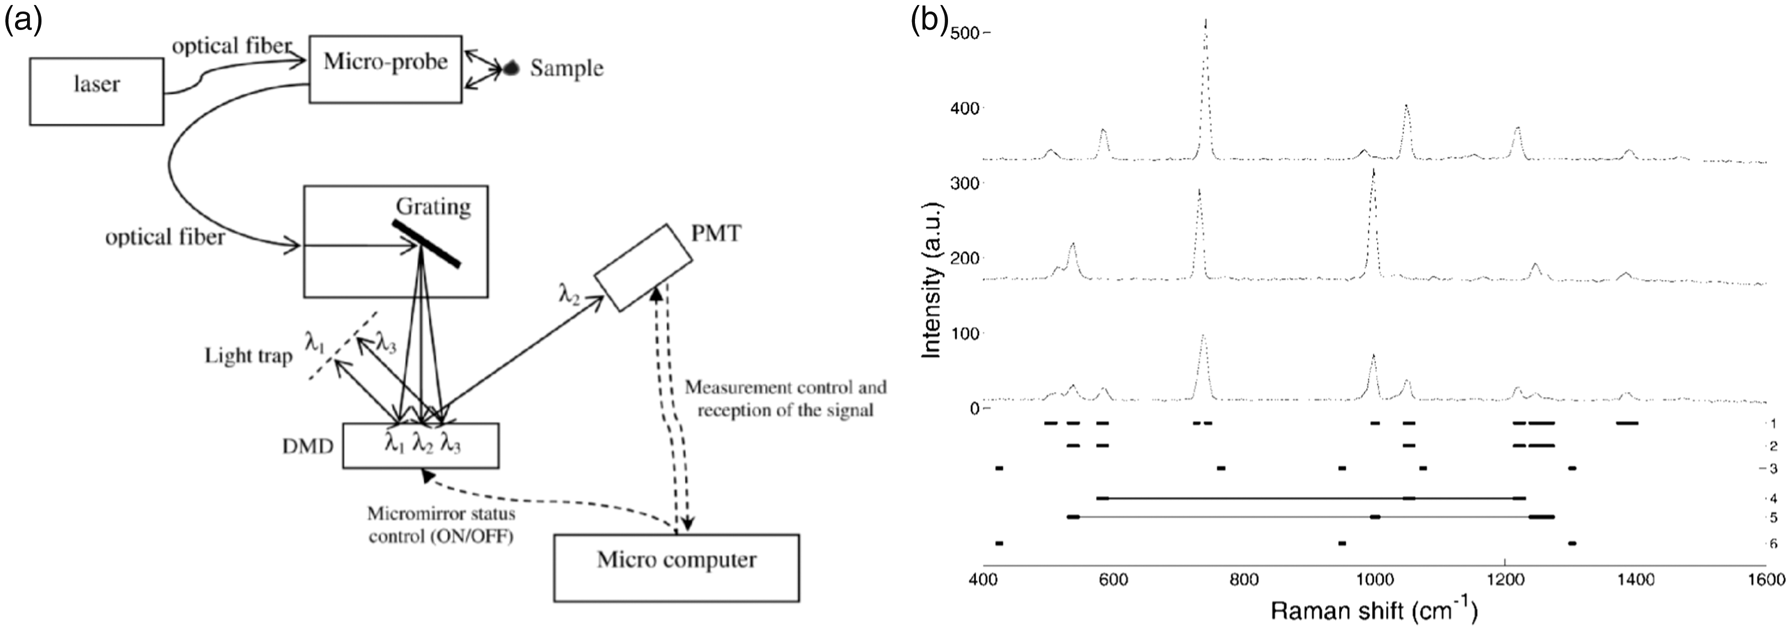
Quyen et al. subsequently demonstrated the use of a DMD/PMT spectrometer in Raman applications (schematic description shown in Fig. 7a).
51
Compared to typical Raman spectroscopy instruments, the major change in this prototype is the use of a DMD as light modulator in the detection path to select Raman light with specific wavelengths to the PMT. The dispersed Raman light from the grating is directed onto the DMD, which consists of 1024 × 768 micromirrors that can be tilted ±12° relative to the normal of the display surface. The 1024 columns of micromirrors are divided into 256 groups. By sequentially directing a group of mirrors towards the PMT (with other mirrors directed in the opposing direction), a Raman spectrum can be obtained, in a similar manner as with a Raman spectrometer based on a scanning monochromator. To maintain good spectral resolution for the measured spectrum, only a few columns of micromirrors are switched on at a time, though this leads to lengthy measurement time when acquiring a full spectrum. It was later suggested that analytical precision could be maintained if multiple characteristic peaks of a sample spectrum are measured at the same time, which can be facilitated by the DMD/PMT configuration for multipeak Raman measurement. By taking the advantage of DMD/PMT Raman spectrometer, Quyen et al. demonstrated that wavelength selection sampling is almost as good as whole spectrum recording in terms of qualitative analysis and quantitative analysis. Identification and quantification of binary and ternary mixtures of chemicals were accurately achieved by selective multipeak sampling (Fig. 7b). Compared to whole spectrum analysis, the total measurement was significantly shortened by skipping the recording of non-informative data in the spectrum. However, a priori knowledge of the sample spectrum is required for peak selection.
(a) Schematic of a DMD/PMT Raman spectrometer. (b) Raman spectra of chemical mixtures acquired by the DMD/PMT Raman spectrometer. Lines beneath correspond to the characteristic peaks selected by the DMD. Reproduced with permission from SAGE publications.
51
The acquisition speed can be further improved by combining DMD/PMT Raman spectrometer with compressive detection approaches, which has been reviewed recently. 53 The use of DMD to encode a Raman spectrum for measurement onto a single-pixel detector was achieved by Ben-Amotz et al. using binary filters, enabling rapid chemical classification and simultaneous imaging of two chemical species in a sample.34,54 Since the switching time of DMD mirrors can be as short as 10 µs, multiple filters can be quickly configured with varying integration times to achieve rapid Raman measurements. Rather than sequentially select Raman bands on the DMD, rapid chemical classification was implemented by differentiating the Raman scattering photons based on the filter configuration and integration time for each filter set. The filters were generated based on the pure Raman spectral features of the components of interest. In other words, training spectra of the chemicals to be identified are required to construct accurate filters for compressive detection. Similar to the DMD/PMT-based Raman spectrometer, full Raman spectra of the samples were measured by DMD-based wavelength scanning. The obtained training spectra were then used as an input to generate optimal filters. There are different ways to generate filters. Digital and analogue compressive detection strategies have been used for constructing filters. As DMD works only in a binary manner, digital filters are more suitable. In contrast, LC-SLM works better with analogue detection strategy. 33
Later, the same group extended the DMD-based binary compressive detection strategy by using two detectors to collect the Raman photons in two different channels. 36 With two detectors, all Raman photons can be collected by using a pair of complementary binary filters that direct photons toward either of the detectors. The optical layout is slightly different from that which uses a single detector, as the two detectors are facing the ±12° position relative to the DMD, respectively. By using complementary binary filters, the number of measurements can be reduced compared to single detector strategy. Moreover, the most significant advantage of using two detectors is that when only two significant components to be classified or quantified, only a single pair of complementary filters is needed, and there is no dead time or delay due to switching the DMD mirrors. For classifying an acetone and benzene liquid mixture, the total measurement time was 10% of the single detector approach. Raman imaging of a two-component sample mixture with 600 × 600 um area (240 × 240 pixels) was finished in 4 s, demonstrating the capability of DMD/PMT-based compressive detection for fast hyperspectral Raman imaging.
More recently, Scotte et al. compared the speed performance of DMD/PMT-based compressive Raman imaging to two state-of-the-art hyperspectral Raman imaging systems. 37 The configuration of the DMD/PMT-based system was similar to the one shown in Fig. 7a, while the other two instruments using a CCD or an electron multiplying CCD (EMCCD). By imaging powder mixture samples mimicking micro-calcifications relevant for breast cancer diagnosis, the authors showed that the DMD/PMT-based compressive system allows 100 × and 10 × faster acquisition speed than the CCD- and EMCCD-based systems, respectively.
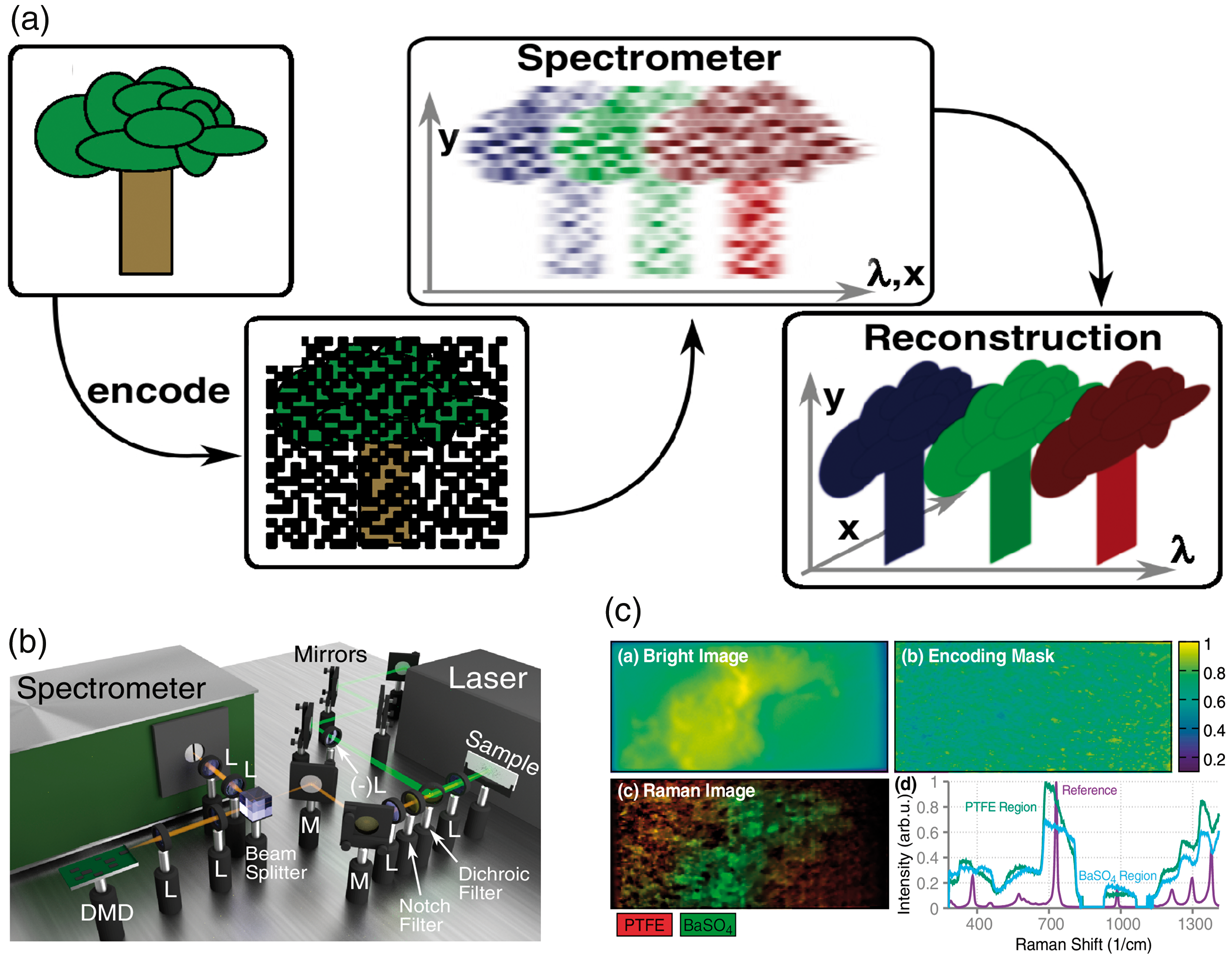
While DMD/PMT-based compressive detection provides a means to increase the speed for chemical classification and imaging, the original spectral information is lost during the computational analysis, as the latter is performed before data acquisition. Thompson et al. reported a technique of single-shot compressed hyperspectral Raman imaging by utilizing a combination of DMD and spectrometer to achieve spatio-spectral compressive detection, where full spectral information can be retrieved after reconstruction.
35
Instead of a single-channel detector, a spectrometer consisting of a grating and a CCD camera was used for detection. Figure 8a shows the concept of this approach to compressed Raman imaging. Similar to DMD/PMT-based compressive detection, here the DMD was used to encode a binary mask onto the image of the sample. The grating in the spectrometer then sheared the spectral information in the spatial domain, and the CCD detector captured the full spectral information at each pixel of the acquired image. Afterwards, a full-resolution hyperspectral data cube was recovered from the encoded 2D CCD image. Hyperspectral Raman image of barium sulfate (BaSO4) powder on an olytetrafluoroethylene (PTFE) block was successfully recovered from a compressed data. The latter was obtained in a single acquisition with a CCD integration time of 5 s. Compared to the aforementioned DMD/PMT-based compressive detection strategy, speed may not be an advantage for DMD/CCD-based compressed sensing, but the key advantage lies in the fact that full spectral information is reserved, and no prior knowledge of the sample is needed for constructing the encoding mask.
(a) Concept of compressed Raman imaging. The Raman scattered light is firstly encoded with a binary mask on a DMD, then imaged by a spectrometer. The latter spatially shears the image based on the spectral content. Last, a reconstruction algorithm based on the encoding mask recovers hyperspectral images of the original scene. (b) Experimental setup. (c) Recovered Raman image compared to bright-field image. Reproduced with permission from the Optical Society of America.
35
All examples of DMD-based sensing above utilized spontaneous Raman spectroscopy; however, broadband SRS measurements have also been demonstrated recently utilizing a DMD with a single-pixel detector for Hadamard-based spectral compressive sensing. 55
Digital Micromirror Device-Based Spatially Offset Raman Spectroscopy
Noninvasive chemical depth profiling of materials is of high interest to a broad range of applications, such as the pharmaceutical industry, security, food quality inspection, and non-invasive medical diagnosis. Confocal Raman spectroscopy is a popular choice for noninvasive spectral depth profiling, but the depth range is usually limited to the order of micrometers. Matousek et al. introduced a technique called spatially offset Raman spectroscopy (SORS) that can measure subsurface chemical information from materials eliciting high levels of light scattering. 56 Spatially offset Raman spectroscopy is based on the multiple diffuse scattering of light in turbid media and involves laterally offset detection relative to the laser excitation spot on the sample.
The implementation of SORS is usually achieved with fiber optics bundles, where optical fibers are arranged in one or more concentric circles to realize spatial offsets for Raman photon collection. Since the fibers are fixed in the bundles, these probes lack the ability to change the spatial offsets. Therefore, the range of sampling depths is limited by the radii of the concentric circles. Inverse SORS improves the flexibility by delivering the excitation beam with an annular profile at the sample and detecting the Raman photons through the optical fibers at the center of the probe. 57 Some other methods have also been proposed to achieve adjustable spatial offsets for SORS measurement, but either involves modifications of the mechanical parts in the optical system 58 or have low optical throughput. 59
Liao et al. recently proposed a novel design to implement SORS by using a DMD added to a conventional Raman spectrometer. 60 The system enables efficient and flexible collection of SORS signals, with software-configurable selection of the spatial offsets, requiring no changes to the optical system or mechanical adjustment. Single-point, annular, and multi-offset collection geometries can be easily achieved by altering the pattern displayed on the DMD.
A schematic of the DMD-SORS system is shown in Fig. 9a. The excitation laser is guided into a microscope and focused on to the sample as in a conventional backscattering Raman instrument. Backscattered Raman photons are collected by the objective and focused onto a DMD by a lens. The DMD is placed at a sample-conjugate plane to serve as the spatial offset controller for SORS measurement as well as slit/pinhole for the Raman spectrometer.
(a) Schematic of SORS optical system using DMD as a computer-controlled spatially offset mask. (b) Single-offset semi-annulus collection geometry with high efficiency. (c) Multiple-offset collection geometry with low efficiency.
55
(d) Digital micromirror device-SORS detection of mineralization through chicken skin and tissue engineering scaffolds.
60
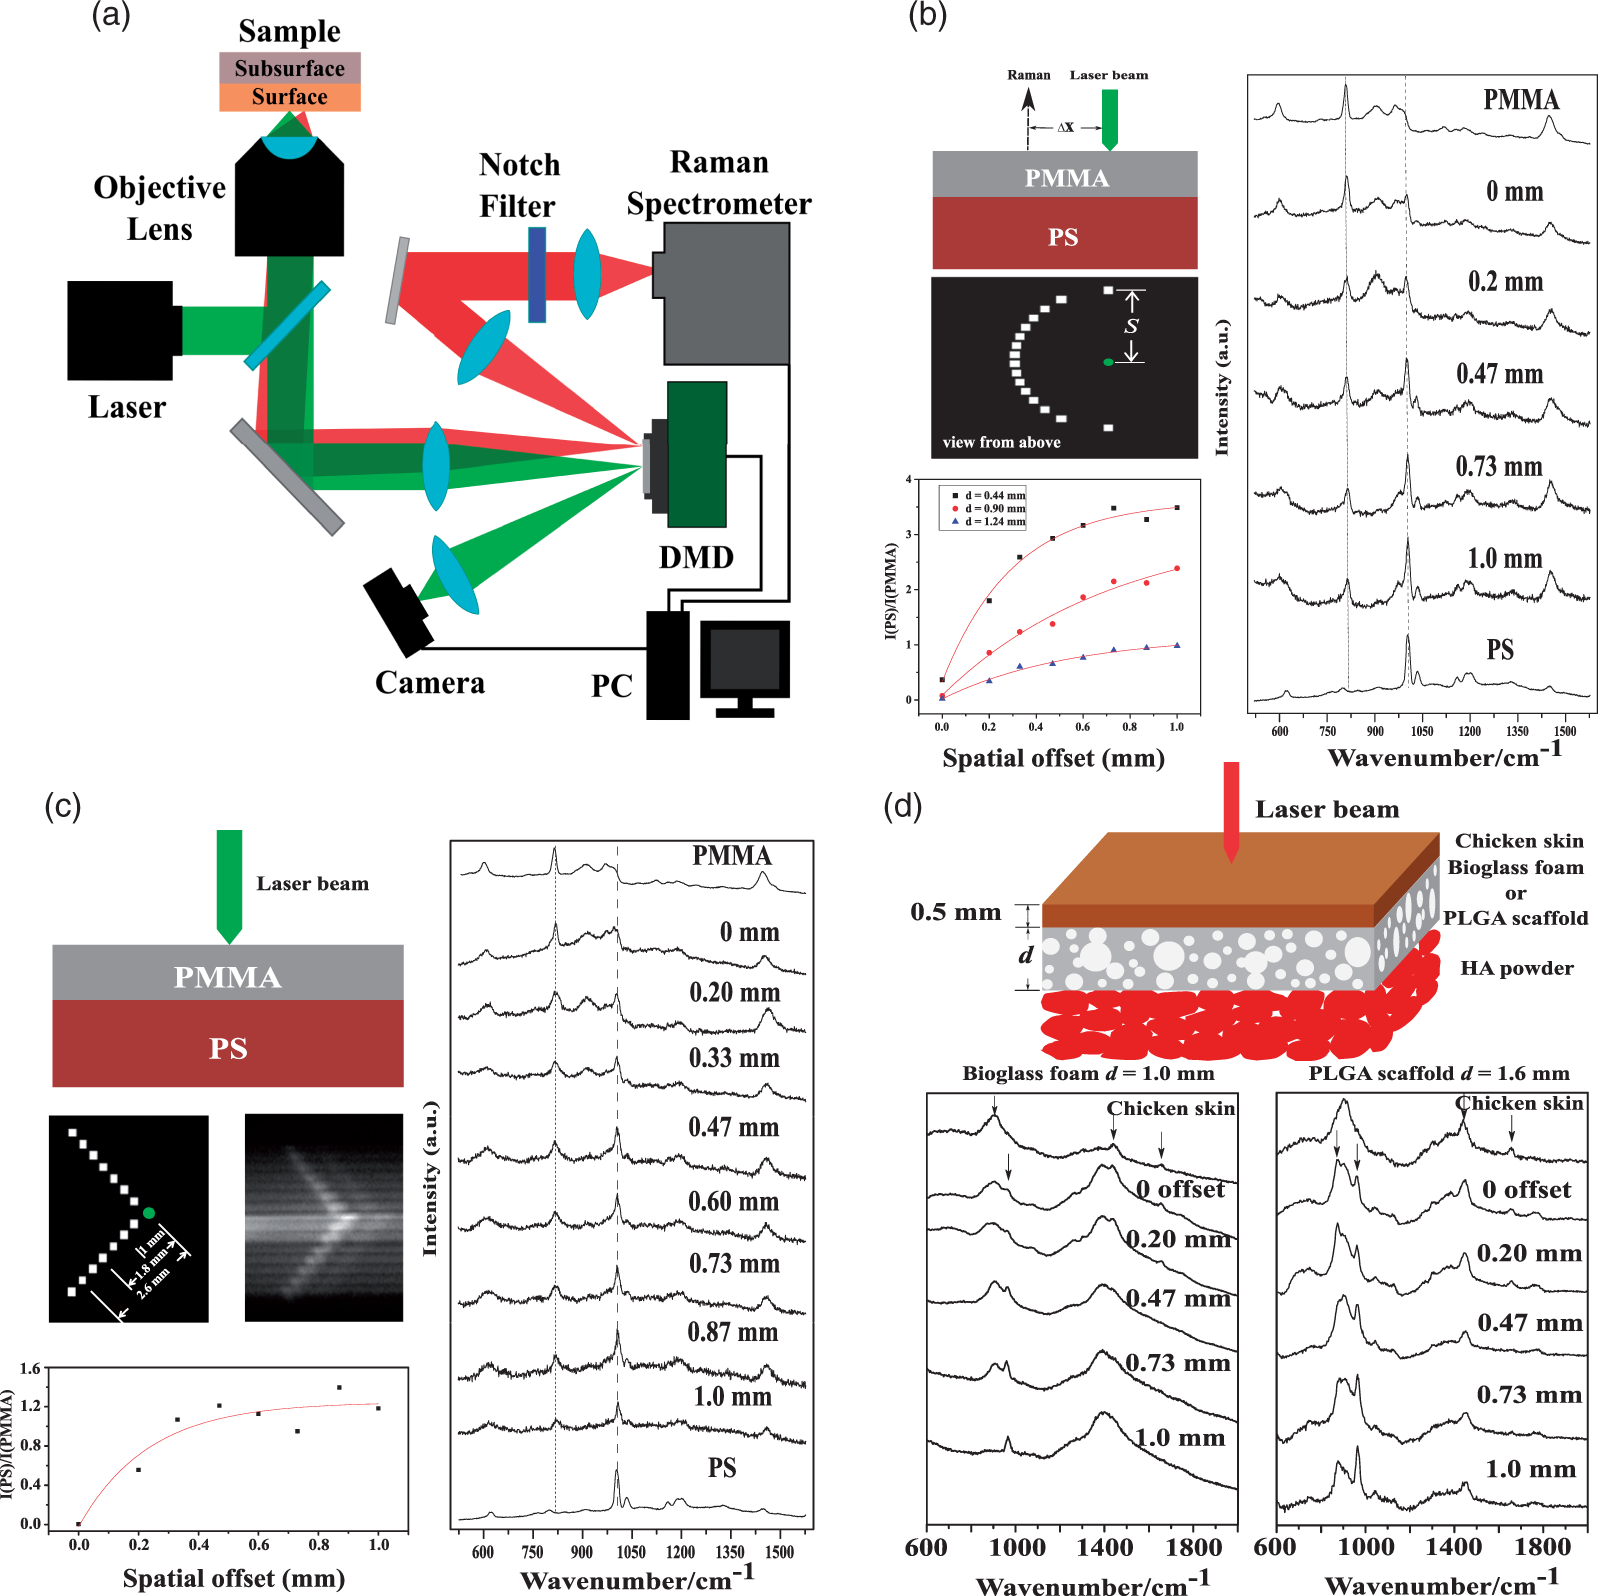
The DMD is at the core of this SORS system, as the spatial offsets are implemented by displaying binary images with annular-like collection patterns. As illustrated in Fig. 9b, a semi-annular pattern consisting of 16 collection points is displayed on the DMD. Each point is a group of tiled DMD mirrors (“on” state) that guide the Raman signal toward the spectrometer, while all the black area are mirrors in the “off” state, where light is rejected from the spectrometer. These collection points are equally distant from the central point that corresponds to the conjugated point of the laser on the sample, so that an averaged SORS spectrum can be obtained by horizontally shifting and vertically overlapping the stripes of acquired CCD Raman image. The collection points were arranged in a way that there was no more than one point in the on state horizontally, so that the crosstalk of Raman spectra on the CCD can be prevented. Vertical gaps of 10 micromirrors were retained for the same reason. The actual spatial offset on the sample is determined by the radius of the semi-circle, S, displayed on DMD, and the focal lengths, f0 and fm, of the focusing lens in front of the DMD and the microscope objective, respectively. This concentric collection geometry can provide collection efficiency up to ∼ 25%, comparable to that of optical fiber bundles with tightly packed collection fibers. Moreover, the key advantage of the DMD-SORS system lies in the fact that the values of spatial offset can be easily changed, as the binary image on DMD is software-configured and requires no movable mechanical parts. The range of spatial offsets is only restricted by the dimension of active area of the DMD and the CCD sensor. For the initial demonstration, values of spatial offset could be readily selected in the range of 0–1 mm using a 2× microscope objective with a 90 mm focal length. The capability and flexibility of the DMD-SORS was demonstrated by measuring a two-layer structure consisting of a PMMA sheet as the top layer and a PS sheet as the bottom layer. From Fig. 9b we can see, as the value of spatial offset increased from 0 to 1 mm, the Raman band at ∼ 809 cm–1 assigned to PMMA decreased gradually, while the intensity of Raman bands assigned to PS increased.
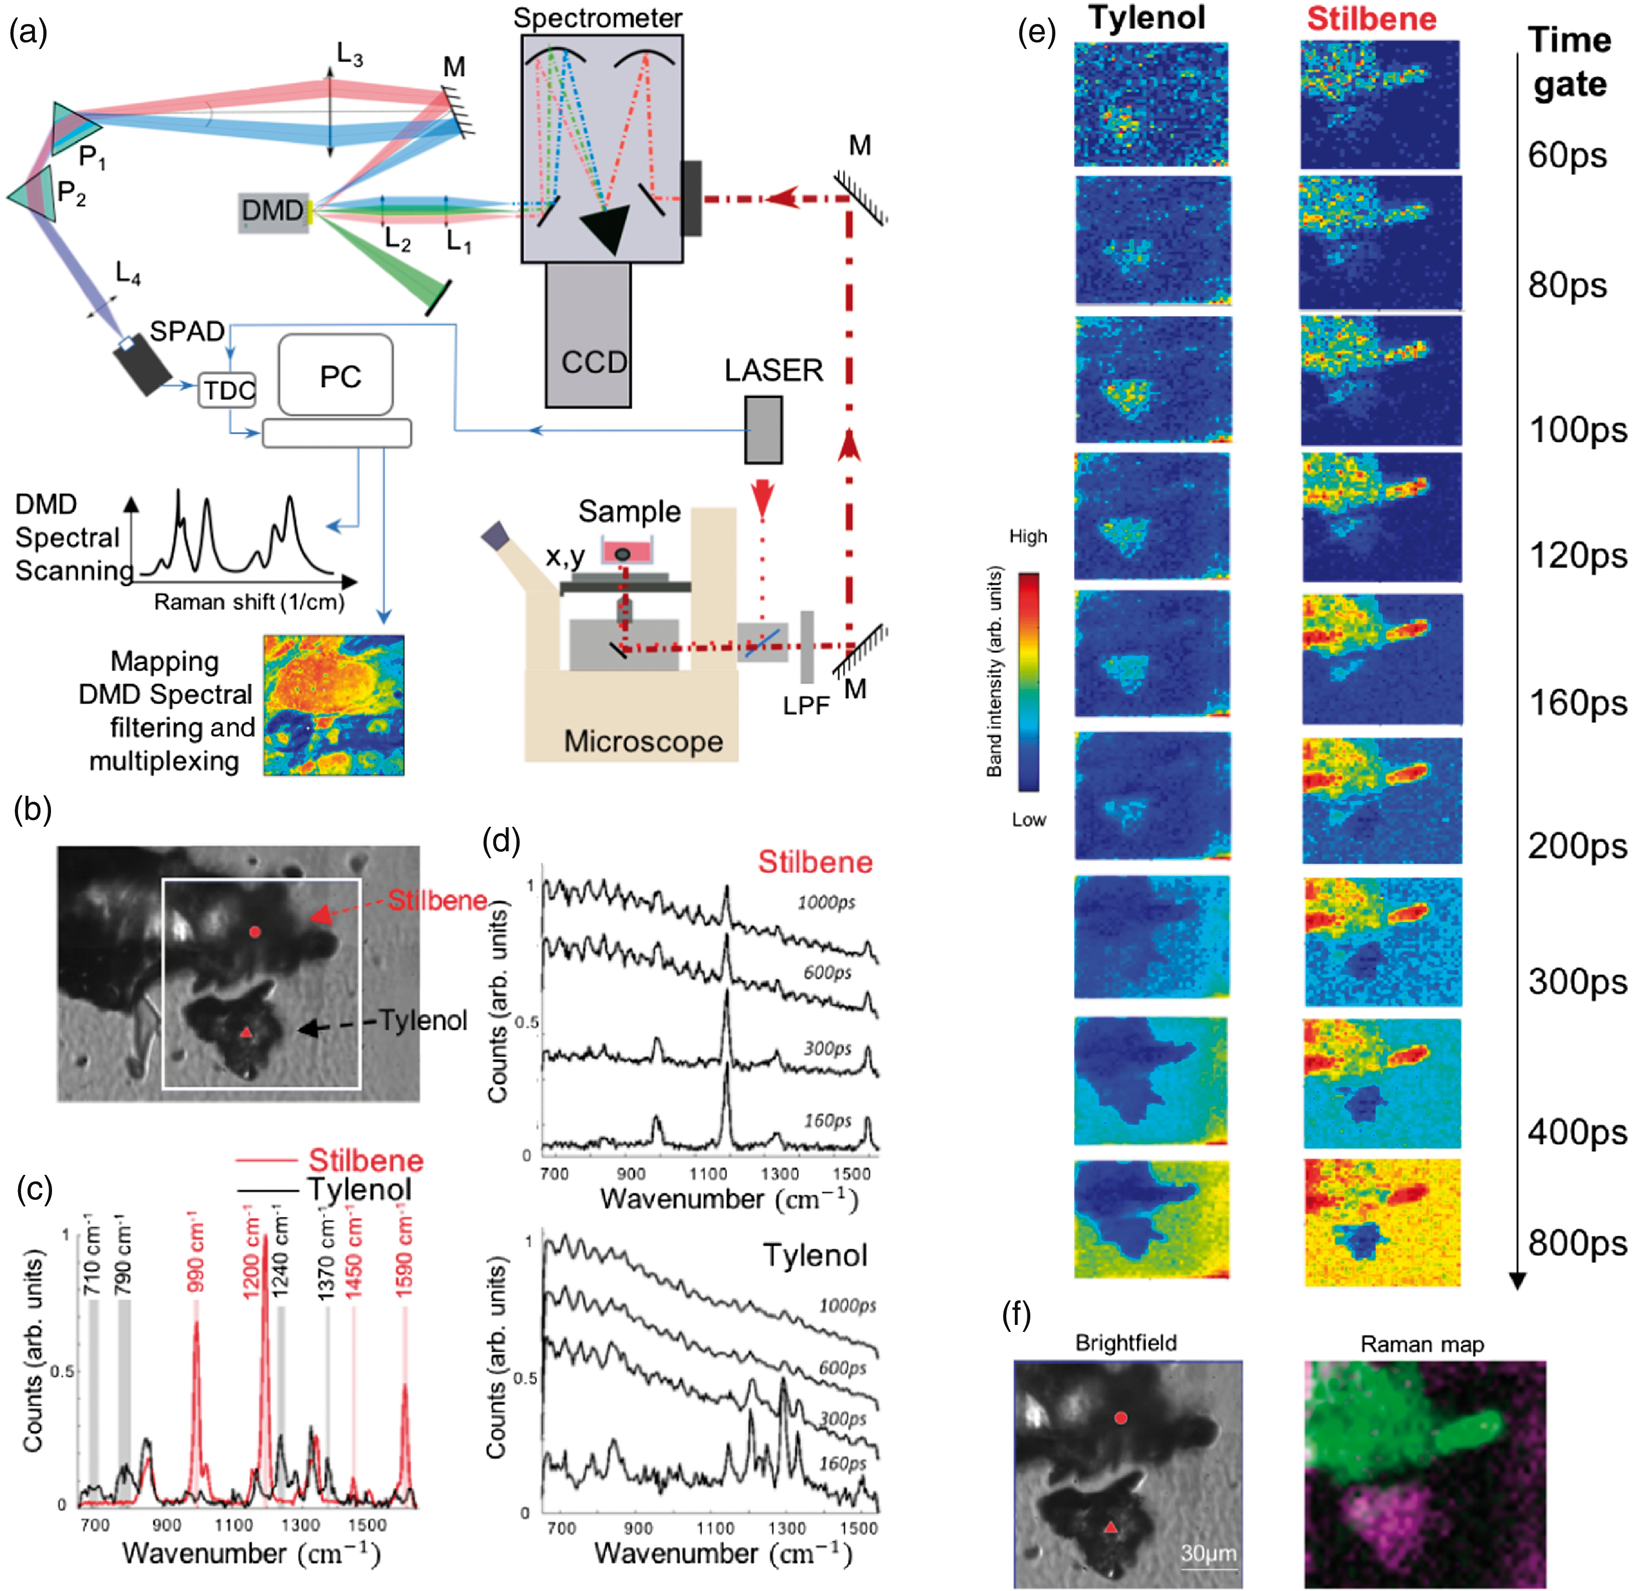
(a) Schematic of DMD/SPAD-based time-gated Raman spectroscopy system. (b) Bright-field image of the Tylenol and stilbene powder on a glass coverslip (mapping area 120 × 120 µm). (c) Time-gated spectra of stilbene (circle) and Tylenol (triangle). The bands used for multiplexing are highlighted. (d) Time-gated Raman spectra at the same locations after the addition of the fluorescing dye on top of the sample. (e) Time-gated Raman maps acquired in the DMD multiplexing mode corresponding to the Tylenol (left) and stilbene (right) bands. Acquisition times: 3 min for stilbene maps, 27 min for the Tylenol maps. (f) Combined pseudo-color Raman map: Tylenol (purple) and stilbene (green); time gate was 120 ps for Tylenol, and 160 ps for stilbene, total time: 30 min. Reproduced with permission from the Optical Society of America.
64
To further demonstrate the flexibility of DMD-based SORS, measurements with simultaneous multiple offsets were carried out. A collection geometry using a V-shaped pattern was used, as the points in each arm represent different spatial offsets from the laser excitation position. As depicted in Fig. 9c, eight SORS spectra with different offsets can be obtained from the two-layer polymer sample in a single acquisition. The ratiometric data of Raman intensity clearly show that there was a trend of intensity increase from the bottom layer as the spatial offset increased from 0 to 1 mm. Since there were only two collection points for each offset, the collection efficiency was reduced compared to concentric semi-circle geometry, led to lower S/N ratio of the spectra.
Later, the authors investigated the feasibility of using DMD-based SORS for nondestructive characterization of bone tissue engineering scaffolds.61,62 Raman spectroscopy is a powerful technique for the characterization of tissue engineering scaffolds and cells. 63 However, measuring molecular signals from the inner parts of the scaffolds is hampered by the high level of optical scattering elicited by these materials. Spatially offset Raman spectroscopy measurements on 3D tissue engineering scaffolds show that hydroxyapaptite (HA) can be reliably detected up to depths of 0–2.3 mm. Furthermore, SORS detection of HA was also possible when the scaffolds were covered by a 1 mm thick fresh chicken skin (Fig. 9d). These proof of principle experiments demonstrate the feasibility of using DMD-based SORS for monitoring the in vitro and in vivo mineralization of bone tissue engineering scaffolds.
Digital Micromirror Device–Single Photon Avalanche Diode-Based Time-Gated Raman Spectroscopy
Laser-induced fluorescence emission is a major problem in Raman spectroscopy measurements of pigmented samples, including many biological samples. A variety of fluorescent components in tissue give a strong and broad emission that swamp the weak Raman signal. Various strategies have been used to suppress the fluorescence background in the Raman spectra. Laser-induced tissue fluorescence is often spectrally active in the UV and visible range, so it can be effectively avoided in Raman measurement by using an excitation laser with wavelength in the NIR, e.g., 785 nm. However, in many cases, the use of 785–850 nm lasers is still not sufficiently effective when it comes to pigmented biological samples. An excitation wavelength further in the NIR, e.g., 1064 nm, can be used to avoid auto-fluorescence, but requires different components for the optical system, in particular InGaAs or Ge CCD detectors. The dark current and read-out noise levels of these detectors are several orders of magnitude higher than the Si CCD used when using lasers with wavelengths shorter than 850 nm. In addition, increasing the wavelength of excitation laser also reduces the efficiency of Raman scattering (Raman efficiency ∼ λ–4). The fact that Raman scattering has a much shorter lifetime (<1 ps) than fluorescence emission (range from a few nanoseconds to tens of nanoseconds) makes it possible for separating Raman photons from fluorescence background in the time-domain using time-gating methods.
Recently, Corden et al. reported time-gated Raman spectroscopy using a single photon counting detector with a DMD for spectral filtering and multiplexing. 64 The optical system is depicted in Fig. 10a. A picosecond pulsed laser with 60 MHz repetition rate at 775 nm wavelength was employed as excitation source. Similar to previously introduced DMD/PMT-based Raman spectrometer, a combination of a spectrometer and a DMD was used for selecting the photons corresponding to the Raman bands of interest. The collimated Raman scattered and fluorescence photons from the spectrometer were directed onto the DMD, where columns of mirrors were switched on and off to select the desired Raman bands. The selected photons were then fed into a single photon avalanche diode (SPAD) after spectral recombining using two prisms. The SPAD separated the Raman and fluorescence in the time domain, achieving in this way a high level of fluorescence background suppression in the Raman spectra.
To demonstrate the capability of the system for time-gated Raman mapping, a mixture of trans-stilbene and Tylenol powder was covered with a fluorescing dye solution was used (Fig. 10b). Full Raman spectra of pure trans-stilbene and Tylenol were first acquired by notch DMD scanning, respectively, in order to identify the Raman bands that can be used to discriminate between the two materials, as shown in Fig. 10c and 10d. Then, the powder mixture with covered by the fluorescing dye solution was imaged by raster scanning. In a first scan shown in Fig. 10e, the columns of DMD mirrors were set to select and multiplex the Raman bands corresponding to trans-stilbene. For the second scan, a different group of mirrors were used for selection of Raman photons from Tylenol. Raman photons were separated from the fluorescence background using a time gate of 160 ps. Figure 10f shows the pseudo-color Raman map corresponding to the mixture powder sample, demonstrating that the fluorescence background was effectively suppressed, and the two components in the powder were identified. While the total imaging time is on a similar time scale to standard Raman point mapping (30 min for a 40 × 40 pixel image: 0.9 s dwell time), the S/N ratio enhancement in the presence of strong fluorescence enables the measurement of previously difficult or even impossible to measure samples.
Uses of Multiple Spatial Light Modulator Devices
Multi-Focal Raman Microspectroscopy
Using a high laser power to create multifoci for excitation of Raman scattering is a promising strategy to improve the acquisition speed of Raman imaging. In principle, the acquisition time can be decreased by a factor equal to the number of laser foci, while various optical elements have been used for generation-fixed patterns of multifoci, such as a microlens array,
25
diffractive optical elements,
65
and galvomirrors.
28
Sinjab et al. developed such a multifoci Raman microspectroscopy system utilizing LC-SLM and DMD.
10
The schematic description of the instrument is shown in Fig. 11a. The LC-SLM generates the desired pattern of laser foci and the DMD in the detection path functions as a software configurable reflective pinhole array. Both the SLM and DMD are synchronized and controlled through software, any changes of the position and number of the laser foci in real time can be rapidly achieved without requiring any hardware alteration.
(a) Schematic description of multifoci Raman system using SLM and DMD. (b) Simultaneous multifoci Raman measurements on skin tumor resection for cancer diagnosis. Reproduced with permission from the Optical Society of America.
10
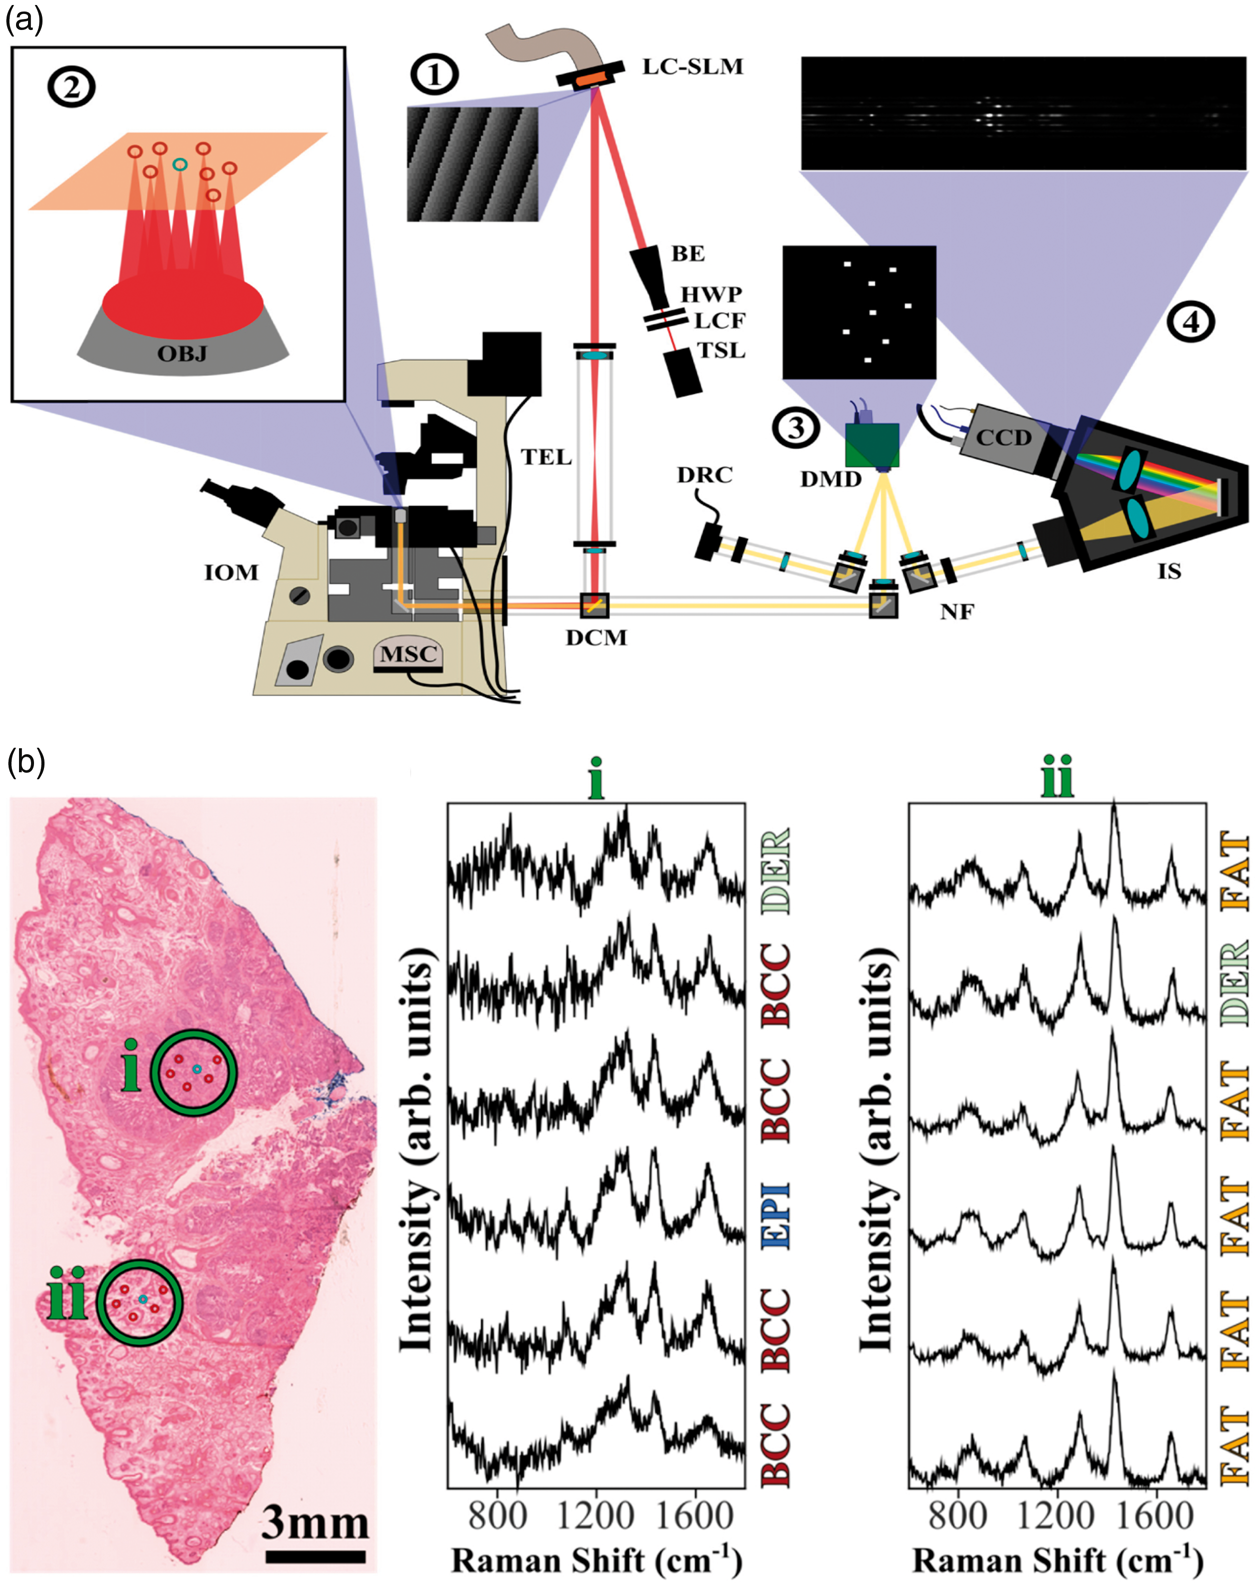
The authors tested the feasibility of multifoci Raman microspectroscopy (RMS) for fast cancer diagnosis. Raman microspectroscopy has been demonstrated for measuring chemical differences between healthy tissue and tumor with high sensitivity and specificity. 66 However, Raman imaging of large tissue sample is often a long process, makes it unsuitable for intro-operative diagnosis. A multimodal spectral imaging (MSI) combining selective sampling Raman spectroscopy and auto-fluorescence imaging was used to image large tissue samples to detect residual tumor cells. 67 Tissue autofluorescence (AF) imaging were first used to eliminate the unsuspicious area, the remaining part was then used to select and prioritize the sampling points for Raman measurement, with an optimized MSI algorithm allowing high diagnosis accuracy while minimizing the number of Raman acquisition. 68 With this sampling strategy, the time for cancer detection of tissue resections can be effectively shortened, and diagnosis of basal cell carcinoma of surgically resected skin tissue was achieved in 30 min. 69 To further increase the speed and diagnosis accuracy, multifoci RMS was employed for cancer detection after generating sampling points from AF imaging. A continuous wave Ti:sapphire laser (3 W output, <1 W total at sample) with 785 nm wavelength was used to generate multifoci created by the LC-SLM, and Raman spectra from six sampling points of skin tissue resections were acquired simultaneously, as shown in Fig. 11b. Diagnosis of large skin tissue samples (∼1 cm2) obtained in surgery was achieved in 11 min, indicating the speed advantage of multifoci RMS. This initial study demonstrates the potential of this approach to enable intraoperative use of Raman spectroscopy for cancer surgery, in particular for cases where the size of the resected tissue can be as large as several centimeters, as is in the case of breast cancer.70,71 This instrument approach could also be utilized for other selective point-sampling approaches.72,73
Multi-Focal Raster Scan Imaging
While multifocal Raman scanning can improve the speed of Raman mapping, cross-talk caused by overlapping laser beams and diffuse scattering of Raman photons reaching the detector can degrade the depth discrimination compared to single-beam confocal Raman microscopy. The SLM/DMD multifoci Raman system provided the flexibility to investigate the depth-discrimination and speed performance of multifoci Raman hyperspectral imaging. 11 Multi-focal patterns with different periods were readily realized and used to study the effects of laser foci overlap and Raman signal cross-talk on spectral depth discrimination.
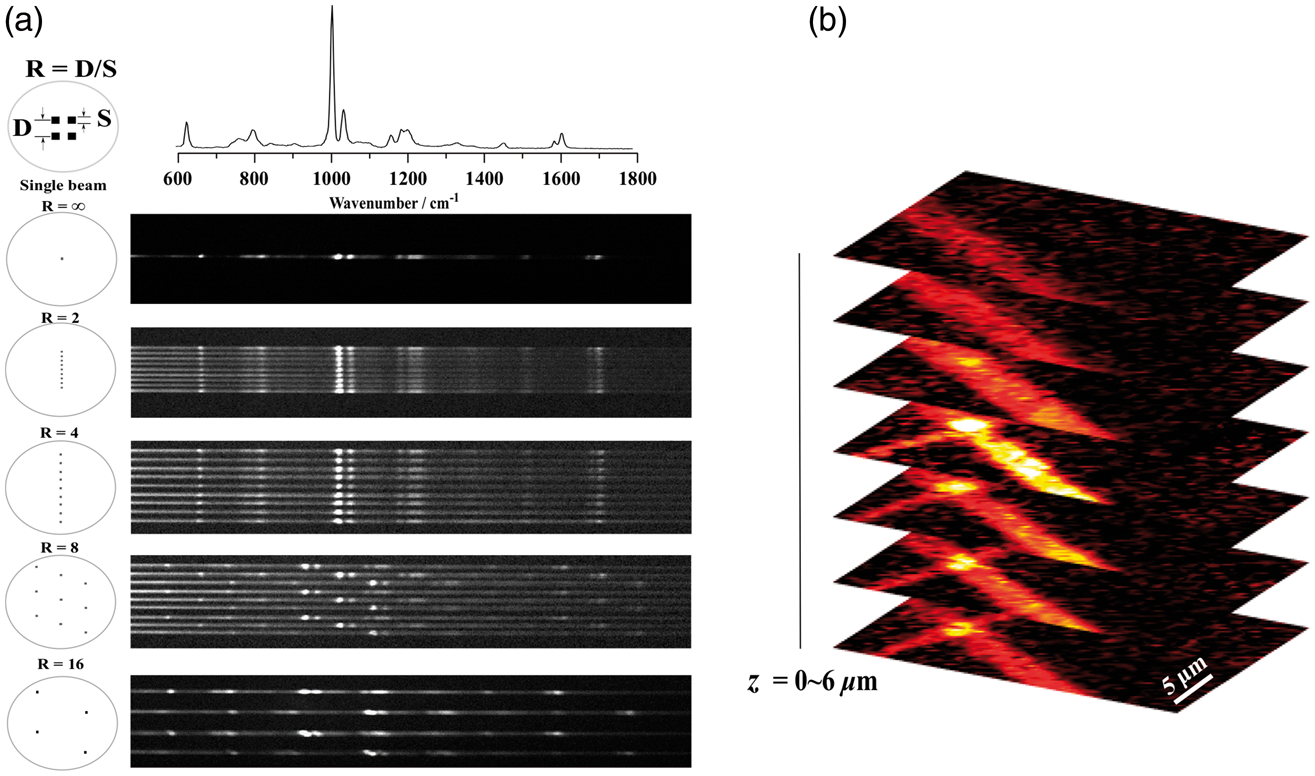
To investigate the influence of the distance between adjacent laser foci on the depth discrimination of multifoci confocal Raman system, optical configuration with different distance-to-size ratio (R) were compared. The parameter, R, refers to the ratio between the distance between the centers of adjacent pinholes, D, and the diameter of the pinhole, S (Fig. 12a). Nine laser foci configuration with R from 2 to 16 were easily achieved without altering any optical components in the system, as the SLM/DMD provided the flexibility to modify the number, location, and spacing among the laser foci. Figure 12a shows the Raman CCD images using different laser foci configuration. After optimizing the configuration for fast spectral Raman imaging with good depth discrimination, a nine-beam, R = 8 configuration was used for hyperspectral imaging of micromaterials and cells. Figure 12b shows an example of optical sectioning of diphenylalanine microtubes, showing good depth discrimination and speed performance highlighting the advantage of SLM/DMD-based multifoci Raman imaging.
Spatial light modulator/DMD-based multifoci confocal Raman imaging. (a) Spatial light modulator/DMD patterns and corresponding Raman CCD images used for multifocal hyperspectral Raman imaging. (b) Optical sectioning by multifoci Raman imaging of diphenylalanine microtubes. Reproduced with permission from John Wiley and Sons.
11
Laser Tweezers Raman Spectroscopy
Using the LC-SLM/DMD combination in the previous section, but coupled with a much higher NA objective, simultaneous multipoint holographic optical trapping (HOT) and Raman spectroscopy could be carried out.
74
The LC-SLM used was controlled by RedTweezers software developed by Bowman et al.,
20
which utilized GPU processing to provide high-speed calculation of phase holograms (>60 Hz), allowing real-time and interactive optical manipulation of microparticles. Sinjab et al. extended this to incorporate Raman spectroscopy by using the same trapping beams for excitation, and collecting the backscattered Raman light through a dichroic mirror, and imaging the sample plane onto a DMD device to allow the spatial filtering before entering the spectrograph. The performance of the instrument (acquisition times, spatial resolution, spectral resolution, etc.) was found to be comparable to single-beam Raman microscopes, which allowed dynamic RMS measurements to be carried out, as shown in Fig. 13a. Here, four polystyrene microparticles were manipulated by the user in software in real time, while Raman spectra and microscope camera images were acquired (microscope light switched on during the first 90 s). The read-out was limited to 10 Hz (4 × 10 spectra/s) by the spectrometer shutter.
Holographic optical trapping Raman microspectroscopy. (a) Video frames and time-course Raman spectra dynamic manipulation–measurement experiment of four trapped 3 µm polystyrene beads in four regions of the FOV, from which Raman spectra were acquired at 10 HZ (total 40 spectra/s). (b) Multiple trapped cells in different flexible configurations and controlled excitation power to avoid damage. Reproduced with permission from the Optical Society of America.
74
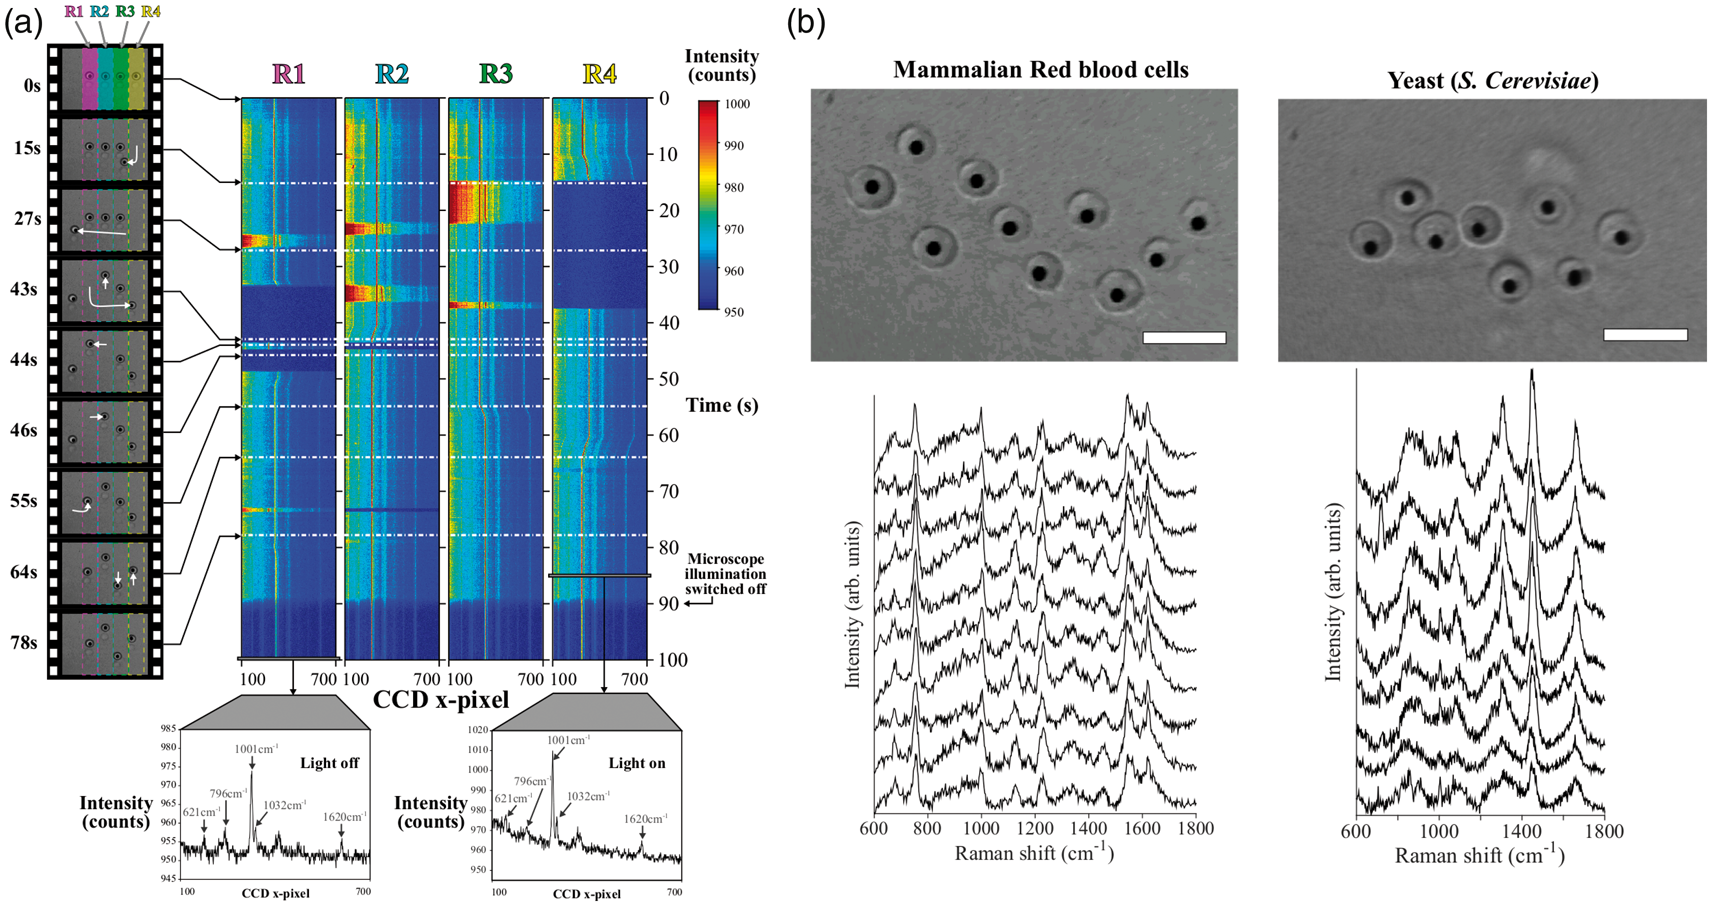
Using the HOT-RMS instrument, it was possible to trap and manipulate various cell types, while simultaneously measure their Raman spectra, as shown in Fig. 13b. The sensitivity of particular live cells to persistent laser irradiation was investigated using time-course measurements, by observing changes in the raw data baseline and changes in Raman bands at various laser excitation powers to determine the damage thresholds.
To demonstrate the unique capability of this approach, the HOT-Raman instrument was used to investigate the spectral changes in human dendritic cells (DC) and T-cells during the formation of an immune synapse. Multiple floating T-cells could be optically manipulated into contact with an adherent DC. After attachment, HOT-Raman spectroscopy was utilized to measure at specific spatial locations of the interacting cell system, to determine differences between junctions and the main cellular bodies. The Raman difference spectra suggested increased protein content at the junction, agreeing with previous studies based on Raman hyperspectral imaging. 75
Conclusion
We have reviewed the use of SLM devices within the broad field of Raman spectroscopy, highlighting a multitude of novel instrumentation approaches and their various applications. Such devices have many advantages, as they allow real-time software control, increased instrument flexibility, options for automation, and allowing digital signal processing techniques applied to light in spatial, spectral, and temporal domains.
Liquid crystal spatial light modulators are particularly useful for providing a flexible way of controlling the spatial and temporal properties of the laser excitation in spontaneous and coherent Raman spectroscopies. Examples of this ranged from generating multipoint spontaneous Raman excitation for improved measurement times to shaping pulsed laser beams to allow coherent Raman spectroscopy using single laser sources. Liquid crystal SLMs have not often been utilized for modulation of Raman scattered photons, likely due to the expected losses in an already Raman weak signal. However, the demonstration of an LC-SLM for compressive sensing by modulating the Raman spectrum shows that high-performance LC-SLMs have sufficient throughput to be useful for applications in Raman spectroscopy. 33 This feasibility of using an LC-SLM for modulating Raman signals may lead to novel applications in the future.
Other phase modulation devices such as deformable mirrors, which have thus far not been widely utilized in Raman spectroscopy, may offer improvement of aberration correction, 14 which has been demonstrated to be useful for focusing within highly scattering tissue for CARS. 50 These devices may also be useful for correcting aberrations in spontaneous Raman hyperspectral imaging on high-background substrates, where it has been shown that spherical aberrations can lead to increase contamination of the Raman spectrum due to the shot noise caused by the Raman photons generated in the substrate even after background subtraction. 76
Digital micromirror devices have typically been utilized in the detection stages of Raman instruments, as their high reflectivity and fill factor facilitate the necessarily high throughput required for detecting the weak spontaneous Raman scattering signal. Examples included spectral modulation of the Raman signal for computational, compressive, or fluorescence-rejection purposes and sample-conjugate spatial modulation for multiconfocal and spatially offset Raman measurements. Digital micromirror devices could also be utilized for modulation of the Raman excitation laser, for example in Hadamard-encoded imaging, though this would result in significant losses during the patterning process which LC-SLM approaches could reduce. One possibility may include dynamic range enhancement for wide-field Raman excitation, as has been demonstrated for bright-field imaging. 77
Another potential use of DMDs is for periodic shadowing spectroscopy, which is essentially spatial lock-in detection for removal of undesirable stray light. This involves periodic amplitude modulation of light being analyzed by a spectrometer along the spatial (slit) axis, with the signal retrieved via a lock-in procedure using the known patterning process as the reference waveform. This was initially demonstrated for a variety of spectroscopy techniques (including CARS) using a fixed Ronchi grating for patterning, and later for emission spectroscopy using a DMD with additional dynamic range enhancement.78,79 The latter DMD approach could also be utilized for Raman spectroscopy and could also be combined with other DMD-based methods as only one spatial axis is required for the shadowing pattern. Spatial patterning can also be used for structured illumination microscopy, 80 which has also been demonstrated in RMS using a fixed patterned line illumination, 81 which could also use either an LC-SLM or DMD in principle allowing enhanced flexibility in pattern generation.
While the focus of this review has been on Raman spectroscopic applications, SLMs may also be of use to infrared vibrational spectroscopy, particularly due to the limitations of 2D detectors in this spectral region. Digital micromirror devices, in particular, have been utilized beyond their optical specifications for video-rate single-pixel vibrational imaging of gas leaks at 1500 nm 82 and for combined Vis–NIR single-pixel microscopy. 83 With the emergence of novel high-power IR sources, it can be expected that many more possibilities will emerge in this direction, particularly as SLM devices operational in the NIR-MIR are developed further. 84 In addition to SLM optical properties, increased update speeds for pulse-shaping applications would be desirable for some Raman applications where rapid pulse control is required, such as Fourier-transform CARS, which is currently achieved by much faster mechanical scanning processes.85,86
In summary, SLM devices have been shown to augment many existing Raman instrument modalities, enhancing several applications in the spatial and spectral domains in the process. In some cases, SLMs have even allowed Raman instrumentation concepts which would otherwise not have been possible at all.
Footnotes
Conflict of Interest
The authors report there are no conflicts of interest.
Funding
This research received no specific grant from any funding agency in the public, commercial, or not-for-profit sectors.