
Abstract
The exposure of mining workers to crystalline particles, e.g., alpha quartz in respirable dust, is a ubiquitous global problem in occupational safety and health at surface and underground operations. The challenge of rapid in-field monitoring for direct assessment and adoption of intervention has not been solved satisfactorily to date, as conventional analytical methods such as X-ray diffraction and infrared spectroscopy require laboratory environments, complex system handling, tedious sample preparation, and are limited by, e.g., addressable particle size. A novel monitoring approach was developed for potential in-field application enabling the quantification of crystalline particles in the respirable regime based on transmission infrared spectroscopy. This on-site approach analyzes samples of dust in ambient air collected onto PVC filters using respirable dust sampling devices. In the present study, we demonstrate that portable Fourier transform infrared (FT-IR) spectroscopy in combination with multivariate data analysis provides a versatile tool for the identification and quantification of minerals in complex real-world matrices. Without further sample preparation, the loaded filters are immediately analyzed via transmission infrared spectroscopy, and the mineral amount is quantified in real-time using a partial least squares regression algorithm. Due to the inherent molecular selectivity for crystalline as well as organic matrix components, infrared spectroscopy uniquely allows to precisely determine the particle composition even in complex samples such as dust from coal mines or clay-rich environments. For establishing a robust partial least squares regression model, a method was developed for generating calibration samples representative in size and composition for respirable mine dust via aerodynamic size separation. Combined with experimental design strategies, this allows tailoring the calibration set to the demands of air quality management in underground mining scenarios, i.e., the respirable particle size regime and the matrix of the target analyte.
Keywords
Introduction
Work in surface and underground mining operations such as coal, metal or limestone mines inevitably leads to exposure of humans to crystalline dust particles, which may adversely affect the health of mining workers. This global problem poses the challenge of providing sensing technologies and data evaluation methods for rapid on-site reaction and intervention in support of occupational health and safety.1–7 Especially respirable dust particles, which may enter unciliated airways have the highest hazard potential, as they are suspected of causing various lung diseases. Consequently, methods for rapid in-field monitoring enabling the immediate assessment of hazards are demanded facilitating on-the-spot intervention strategies.1,5,8–10
Most studies related to this field specifically target the quantification of respirable crystalline silica (RCS), i.e., alpha quartz, which is well known to cause lung diseases such as silicosis while also being suspected to be a lung carcinogen.11–13 This hazardous effect relating the exposure of mining workers to dust containing RCS was readily confirmed during past studies,4,14–16 and resulted in a permissible exposure limit (PEL) of 0.1 mg/m3 respirable dust present in metal/non-metal mines, as prescribed by the U.S. Mine Safety and Health Administration (MSHA). Additionally, a recommended exposure limit (REL) of 0.05 mg/m3 was introduced as a time-weighted average for up to 10 h per day during a week of 40 h work by the National Institute for Occupational Safety and Health (NIOSH).1,10
However, besides RCS mine dust can also be composed of various other respirable particles, originating from the rather complex ore matrix. Likewise, these components including but not limited to dolomite, calcite, and alumosilicates are suspected of causing pulmonary diseases.17–19 Thus, to ensure the safety of exposed workers, selective particle sampling and analysis are needed, differentiating various particle types in size and composition originating from the surrounding stone matrix.
A standard laboratory method for analyzing respirable crystalline silica is X-ray diffraction (XRD; NIOSH method 7500) adopted in the United States by the Department of Labor, Occupational Safety and Health Administration (OSHA), and by MSHA in metal/non-metal mines. This method is capable of the identification and quantification of respirable crystalline silica. For that method, respirable dust particles in ambient air are collected onto PVC filters using body-mounted sampling devices. The loaded filters are then sent on to an appropriately equipped laboratory and analyzed in a controlled environment using XRD after proper sample preparation, which includes low temperature ashing or chemical extraction.1,5,7,10,20
However, conventional laboratory techniques do not enable rapid in-field monitoring of respirable dust components due to the required sample preparation routines, the need for laboratory environments, and complex analysis procedures. Additionally, XRD is limited by particle size effects (e.g., line broadening) especially in the respirable size regime.21–24
Fourier transform infrared (FT-IR) spectroscopy is an alternative analytical method, adopted for the quantification of RCS in respirable dust samples (NIOSH 7603). Portable FT-IR analyzers are commercially available, which renders this technique field-deployable for rapidly analyzing samples, collected for exposure monitoring. The analysis of samples in the field is possible via an analytical approach called direct-on-filter (DOF), in which the sample is analyzed while still on the same media used for sampling. Hence, this technology promises to fill the gap of lacking rapid on-site monitoring and assessment of hazards related to the exposure of human workers to mine dust. Especially for crystalline matrices, it has been demonstrated during earlier studies that FT-IR spectroscopy provides a versatile tool for the identification and quantification of a wide variety of minerals, including organic matrix components even in most complex scenarios.5,23,25
Infrared spectroscopy was previously used for analyzing mine dust particles collected onto PVC filters by NIOSH via portable IR spectrometers that may be directly adapted for in-field usage. The obtained results were comparable to the results obtained via NIOSH method 7500.1,20,26,27 Hence, the DoF filter method combined with portable FT-IR systems was included in ISO 19087:2018 by the International Organization for Standardization (ISO 19087:2018-Workplace Air-Analysis of Respirable Crystalline Silica by Fourier-Transform Infrared Spectroscopy, 2018). However, it was revealed that quantification may be affected by background signatures, spectral matrix complexity (e.g., IR band overlaps), particle size distribution, and especially by matrix effects if unexpected mineral components occur within the analyzed sample; these effects are usually summarized by the term “analytical confounders".1,5,6,20,28
Cauda et al.1 faced this challenge via a sector- and a mine-specific approach, which tailors a univariate quantification to a specific deposit with a similar matrix composition. An alternative approach is resorting to advanced multivariate data analysis strategies as shown, e.g., by Bayman et al., directly calibrating natural coal and non-coal mine dust samples for RCS quantification.6,20
Most recently, the research teams of Mizaikoff and Cauda have collaboratively shown a proof-of-principle study based on advanced multivariate calibration routines, combined with the specific capabilities of two different types of IR spectroscopic data acquisition via a uniquely robust partial least squares regression (PLSR) model, that more adequately addresses those challenges. It was shown that the combination of experimental design and multivariate regression is capable of both, rapid identification, and prediction of a variety of analytes within a multimineral mixture with essentially no sample preparation in a very short period of time.5
In the present study, we have evolved these concepts from a proof-of-principal to the direct usage of PVC filters, enabling DoF routines for direct in-field analysis in underground and surface mining scenarios. Specific confounders arising from the filters themselves were addressed, and an improved strategy was established for DoF filter loading to generate controlled calibration models, which can be applied to real-world samples. Additionally, an advanced method for size selection evolving the methodology developed by Barone et al.8 was used to perfectly match the calibration samples to the respirable, and thus most hazardous, size regime. This allows tailoring the calibration model to the matrix, particle size, and composition of analytes in a specific deposit, and thus augments the sector/mine-specific approach established by Cauda et al.1 using a multivariate regression approach, which effectively addresses the issue of matrix-based analytical confounders.
As multivariate calibration models enable the quantification of multiple constituents per sample, the generated calibration model is capable of quantifying not only alpha quartz, which remains to be a main target for most studies in this field. Other minerals were calibrated alongside, which on the one hand side enables the implementation of matrix constituents into the calibration for increasing robustness against analytical confounders, and on the other hand side gives access to quantitative data on the presence of potentially even more hazardous crystalline dust components.5,29–32 Last but not least, the utility of the developed approach was shown for typical limestone matrices, i.e., calcite, dolomite and quartz, which are all potentially hazardous.17–19 The application of experimental design algorithms further allows to drastically reduce the amount of samples required per calibration, and thus promises rapid adaption to other matrices and mining scenarios.5,33
In summary, the developed IR-based analysis technique provides superior performance for a wide variety of particles in the respirable size regime, and promises a versatile, adaptable and readily portable system for controlling air quality in mining operations.
Methods
The present laboratory study was conducted at the NIOSH Pittsburgh Mining Research Division laboratories in Pittsburgh, Pennsylvania, while the associated multivariate data analysis was developed and evolved at Ulm University, Germany. First, relevant mixture compositions were identified, and the mixture composition was determined. Then, mixtures were prepared as discussed below, and respirable dust samples were obtained. Finally, these samples were measured spectroscopically in the laboratory, and the spectra were used to establish appropriate multivariate models suitable for on-site data evaluation.
Experimental Design and Multivariate Approach
For multivariate data analyses, the Eigenvector Toolbox software package (Eigenvector Research Inc.) was used. The PLSR method was applied for calibration, quantification, and identification of minerals in given mixtures.
Mineral mixtures according to experimental design.
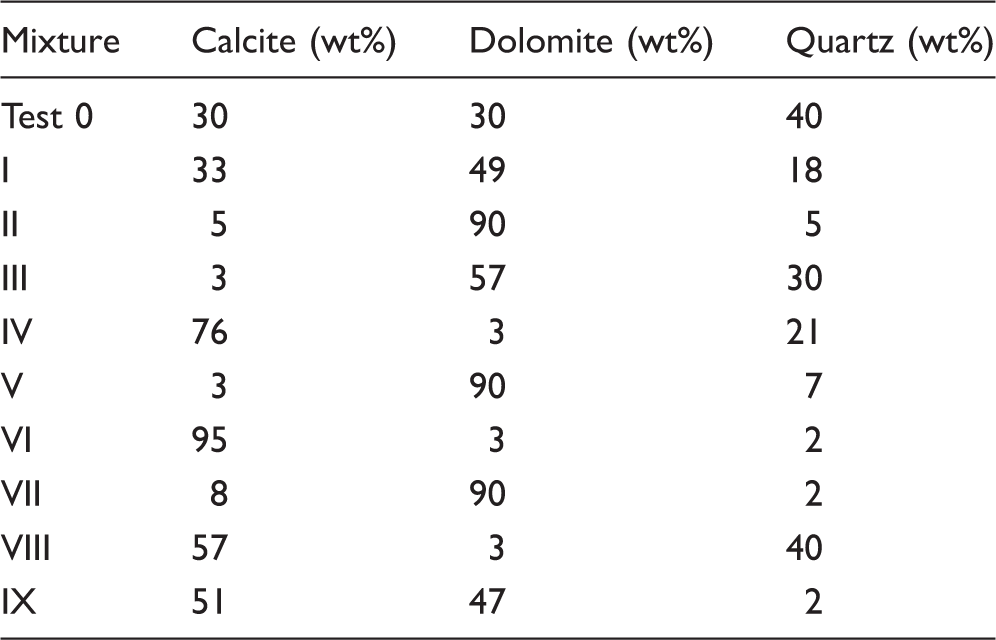
The experimental design algorithm used during these studies was an “extreme vertice algorithm” via the R-Statistics software package (The R Foundation, Austria) combined with the “mincalib” add-on package. The extreme vertice design is based on a “simplex centroid design” with constraints. The constraints (Table I) were set to match real-world samples with known mineralogy. The experimental design algorithm applied in these studies is based on a geometric triangular function, and thus minimizes collinearity of the calibration samples to ensure maximum utility of the data in multivariate calibration models. Besides circumvention of collinearities, the user benefits from a drastically reduced amount of required calibration samples, compared to a fully factorized calibration demanding for all possible combinations of the three components.30,33–35
Sample Preparation
Respirable Powder Preparation
Powders of pure calcite and dolomite (Wards National) were ground in an agate mortar. Quartz was purchased as Minusil 5 (US Silica) with an average particle size of 5 µm. All powders were size separated prior to deposition via aerodynamic size separation and filter collection. The dry process involved (i) de-agglomerating and aerosolizing mineral dust using a modified small-scale powder disperser, (ii) size separating the dust using a stainless-steel cyclone operated approximately at 16 lpm, and (iii) collecting respirable dust penetrating the cyclone onto a sintered stainless-steel filter. Resulting powders were characterized using the aerodynamic particle sizer, and via a computer-controlled scanning electron microscope. This methodology allows for the preparation of dry respirable powder needed for the calibration of analytical techniques. For a detailed description see Barone et al.8
Mixture Preparation
After size separation of respirable single minerals, the calibration samples were mixed and prepared according to an experimental design routine described above. The targeted mass of each respirable particles mineral in a mixture was weighed in the respective percentage abundance in each mixture. To ensure exact masses, the procedure was conducted using a polonium target to exclude effects of static loading. The weighted minerals were mixed in a weighing boat and the mixture was washed out of the weighing boat and dispersed using isopropylic alcohol (IPA). The mineral mixtures dispersed in IPA were sonicated for approx. 1 h, to ensure a homogeneity and were dried overnight at 100 ℃.
Calibration Sample Preparation
A slurry-deposition-based sampling procedure was adopted. Subsequently, several samples could be reproducibly generated with predictable masses deposited onto PVC filters.
In order to calibrate particles deposited onto PVC filters in a laboratory environment, a routine slurry deposition technique was experimentally established with the goal to rapidly generate controlled samples on filter media as close to air collected samples as possible. The respective calibration mixtures onto a PVC filter generating a reproducible target mass and reproducible deposition pattern via an established routine for sample generation. The dried mineral mixtures were subsampled with a target mass of approximately 1.4 mg, which ends up in masses between approx. 0.8 mg and 1.2 mg after deposition. Those mixtures were again dispersed in isopropylic alcohol, and then sonicated to ensure that they are perfectly mixed and deagglomerated. The loading process was conducted in a Büchner funnel device linked to a vacuum pump by pouring the IPA dispersed mixtures gently onto the filter and washing with IPA. At least three filters were generated for each mixture.
All PVC filters (5 µm pore size, diam. 37 mm) were weighed before and after loading, and the loaded masses were documented to check for reproducibility. The weighing procedure was done in an air-controlled room to assure constant humidity and temperature. To circumvent electrostatic loading, the filters were treated with a polonium target before weighing.
Calibration Sample Analysis
Instrumentation
Infrared measurements were executed using a portable Bruker Alpha FT-IR Spectrometer (Bruker Optik) equipped with a transmission cell (Bruker Optik) using the internal thermoelectrically cooled DLaTGS detector.
Spectra Collection Parameters of the Calibration Samples
Spectra were recorded from 4000 cm−1 to 400 cm−1 with 16 averaged scans at a spectral resolution of 4 cm−1 according to the standard measurement procedure for air collected samples established by NIOSH. A filter holder was used to hold the filter in place within the transmission cell. All filters were analyzed at least four times. The center area of the filter was analyzed from both sides (front and back), and two off-centered measurements were collected from each sample to determine any inhomogeneities in deposition patterns. Data acquisition was done via the Opus 8.1 software package (Bruker Optik). IR spectra were collected from all blank and loaded filters.
As all filters were gravimetrically and spectroscopically identified, and filters with deviations in loaded mass (i.e., compared to filters of the same mixture) and thus spectral intensity deviations were kept for augmenting the model. All filters may thus be considered as well characterized individual samples.
Pre-Treatment of Spectra for Multivariate Data Analysis
The raw spectra (without filter background correction) were loaded into the software in two blocks: (i) a spectral data block and (ii) a concentration data block. Within the concentration data block, the masses of each mineral for every single spectrum are entered. Those masses are carefully weighed, as described above. No other corrective approach was applied to the spectra, i.e., no background correction, etc. as to assure that the method may be automated without the need of collecting filter backgrounds.
Multivariate Calibration Model
The IR spectra collected from samples prepared via slurry deposition were used as-is without any background correction for establishing the multivariate model. Within the software package, any mathematical preprocessing can be applied automatically to all data; hence, all spectra were limited to the range of 550 cm−1 to 1750 cm−1 to avoid evaluating spectral data carrying no relevant analytical information, which only adds noise to the model. Additionally, a baseline correction and autoscaling were applied to all spectra, which mean centers the data and scales it to unit variance. The data set was then split into a calibration and a validation data set using a random data split approach which was carefully revised to ensure no replicates were moved to the validation data set.
Results
Calibration Mixture Spectra
Figure 1 shows exemplary spectra of all nine mixtures. The spectra were baseline corrected due to drifts caused by the PVC filter background. For the carbonates, the spectra feature a characteristic stretching vibration centered at 1460 cm−1, as well as dolomite-specific carbonate bending vibrations bands at 729 cm−1 and 884 cm−1. Calcite-specific bending vibrations are located at 712 cm−1 and 879 cm−1. For quartz, the asymmetric stretching vibration arises at 1095 cm−1. The symmetric stretching vibration doublet of quartz arises between 800 and 760 cm−1.23,36
Transmission IR spectra of calcite, dolomite and quartz deposited onto a PVC filter. Vibrations arising from dolomite and calcite are highlighted in green, quartz vibrations are highlighted in blue, and non-highlighted vibrations are assigned to the PVC background (black spectrum).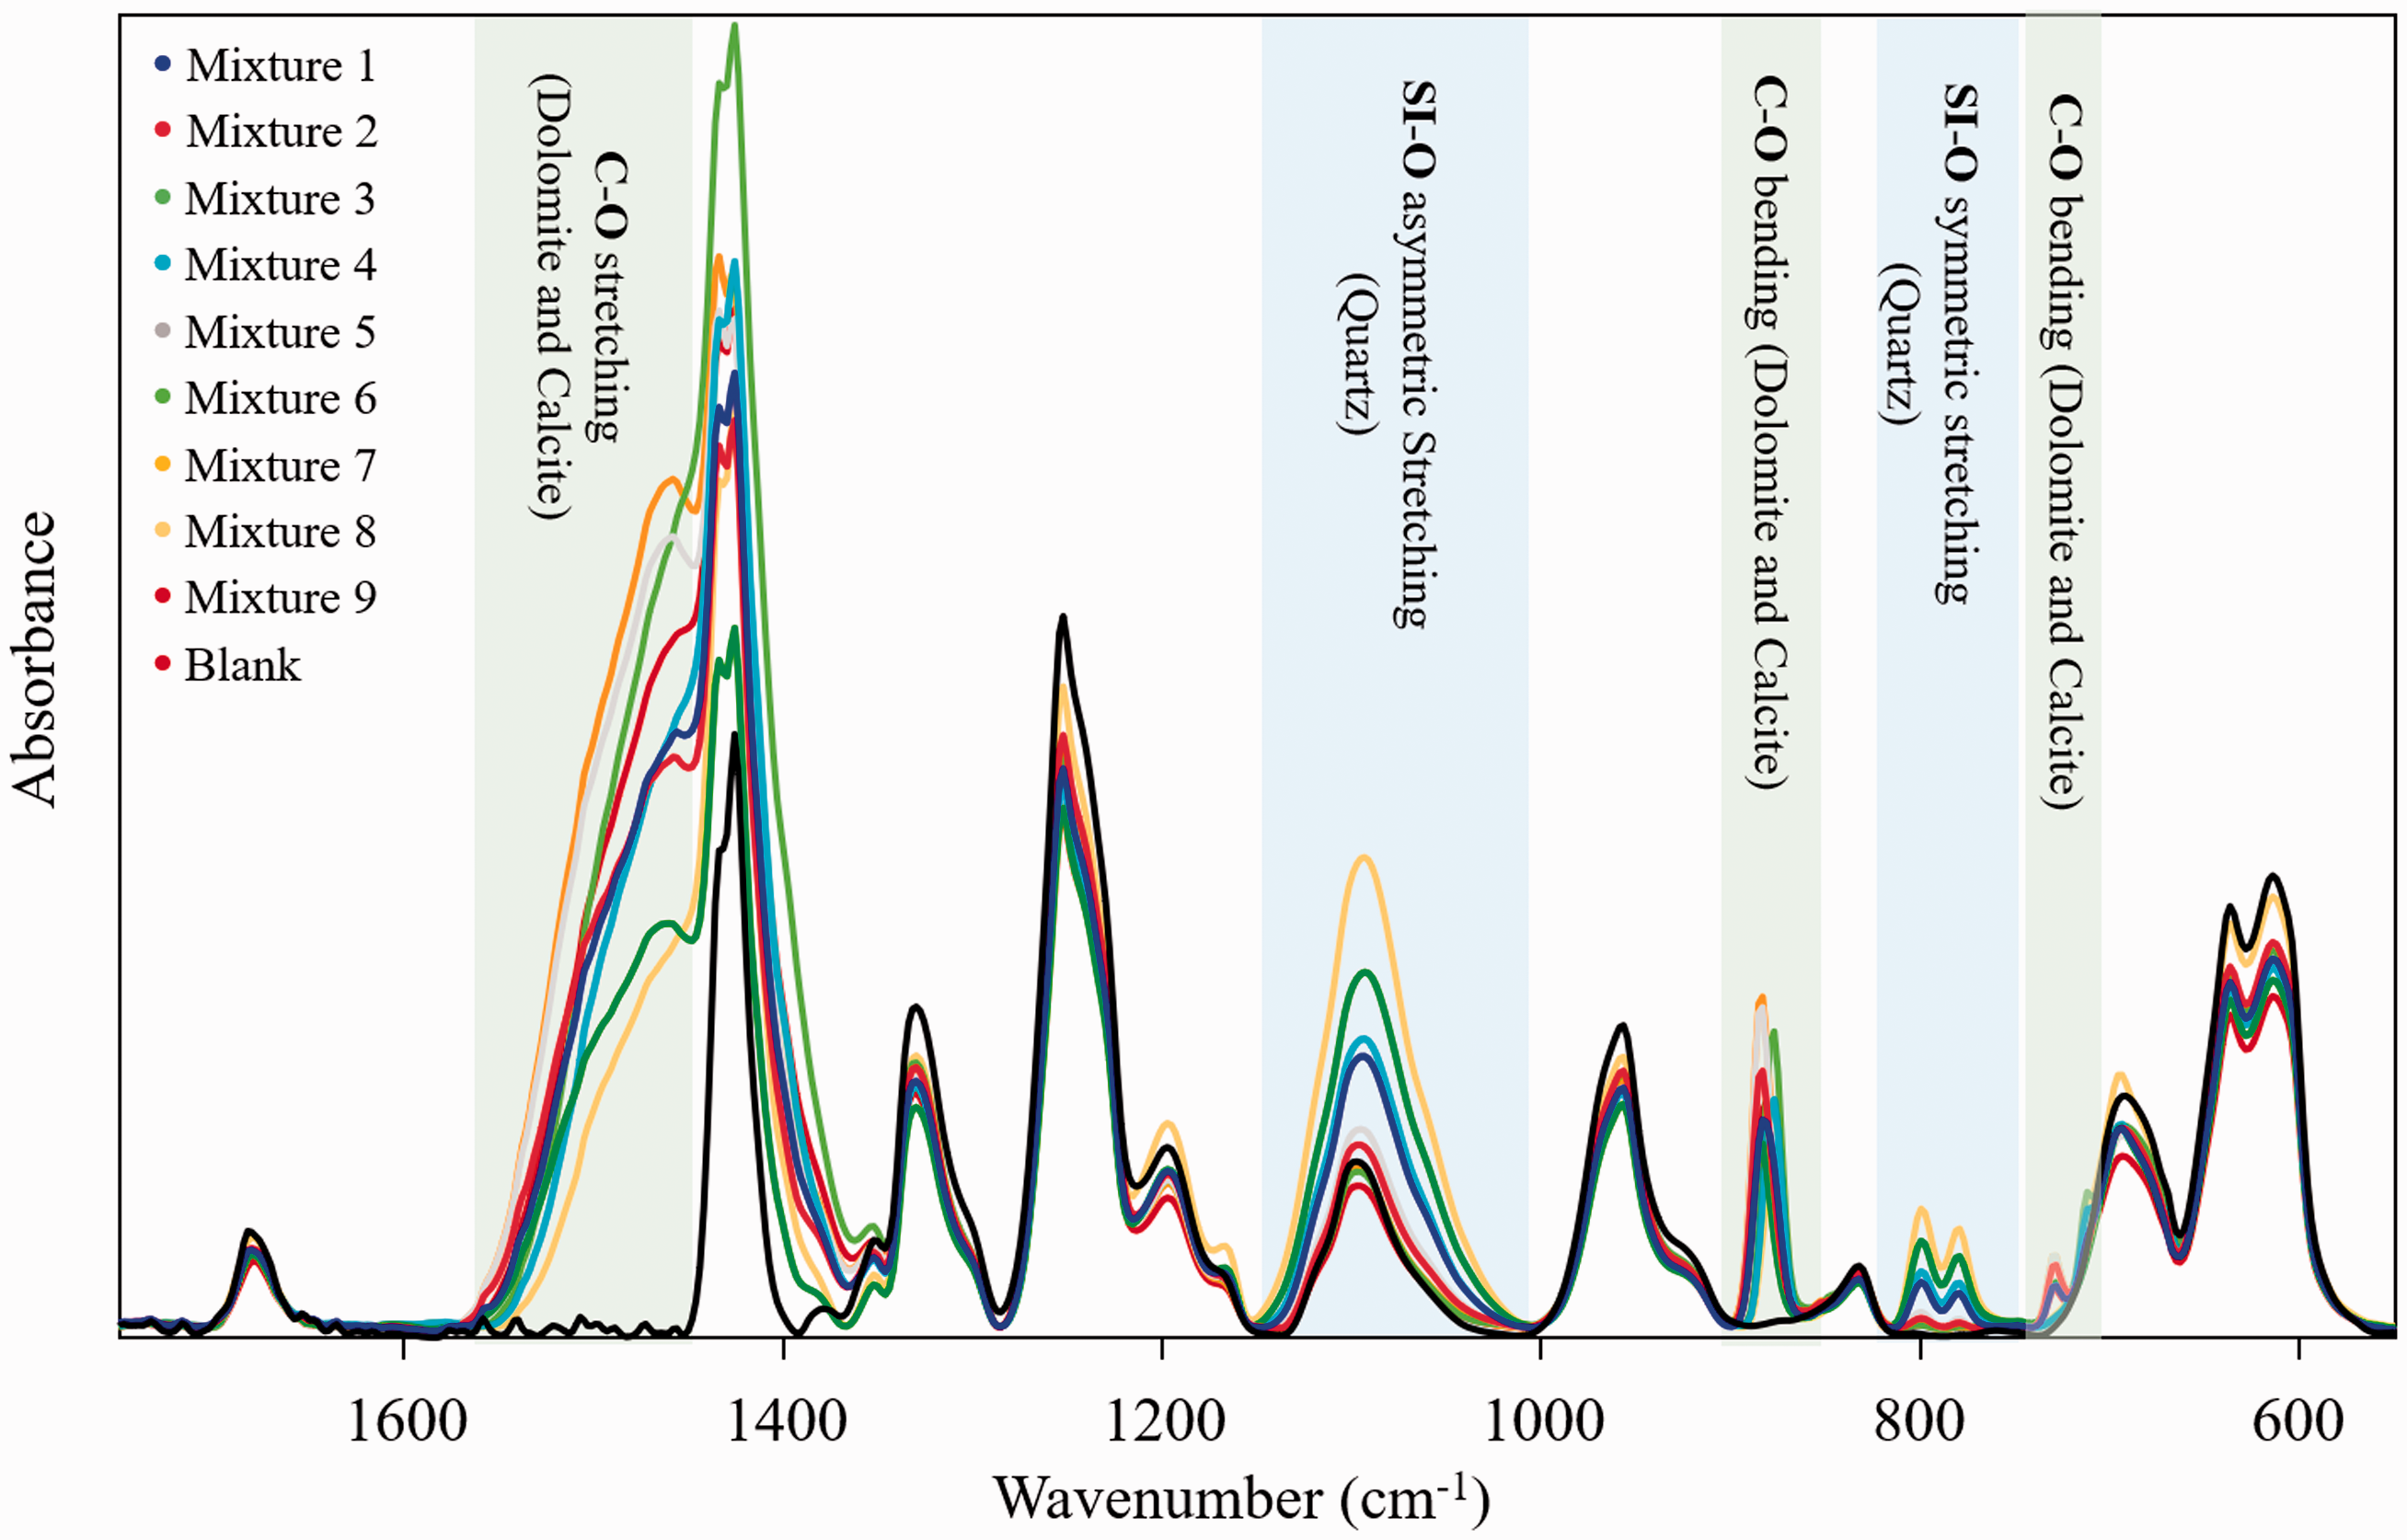
Conventional Univariate Calibration Model
A conventional univariate calibration model was established with the analyzed samples. A blank filter from the same lot was used as a background, and the spectrum was subtracted from every sample spectrum. The quartz symmetric stretching vibration was integrated in the range 816–767 cm−1. The calibration provided a goodness of the fit (R2) value of approx. 0.973 with standard deviations between 0.01% and 17.4%. The limit of detection (LOD) for this univariate calibration of quartz (i.e., using the mean standard deviation) was calculated at approximately 24 µg for a filter loaded with a maximum of 500 µg of dust material. The application of this calibration model for the prepared samples is shown in Fig. 2.
Conventional univariate calibration of quartz using slurry deposited filter samples.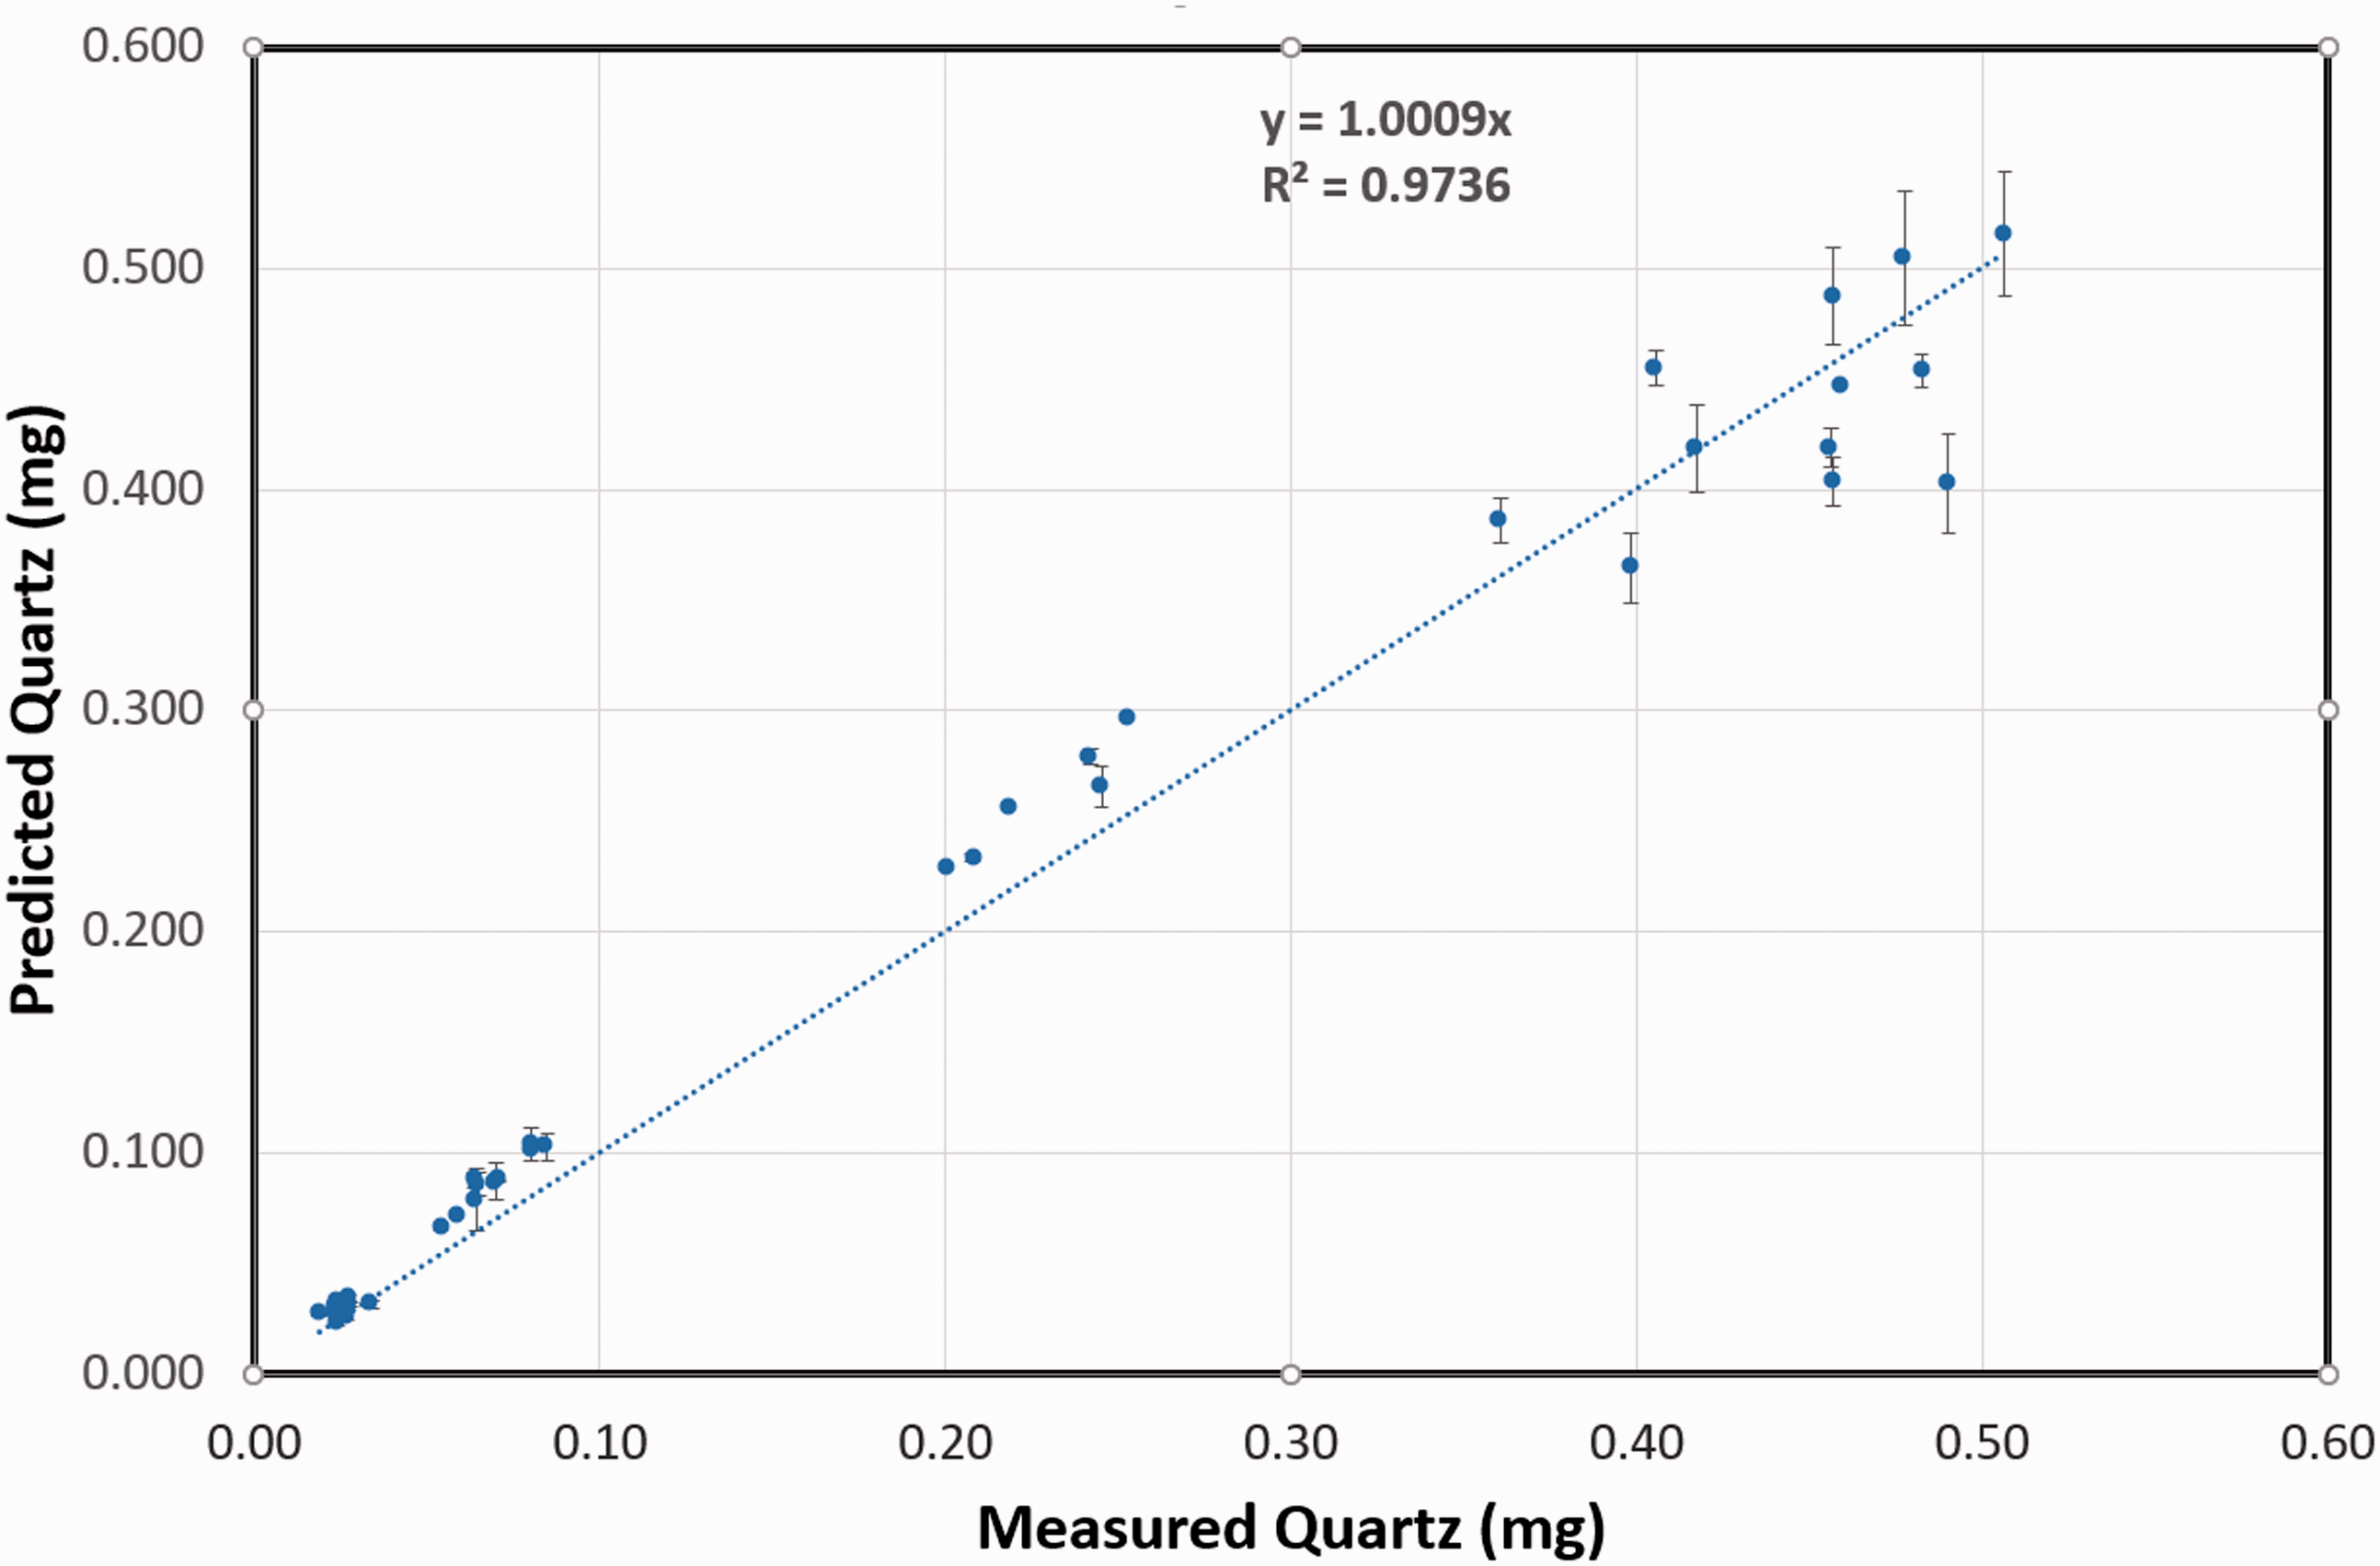
Multivariate Calibration Model
All PVC filters were weighed prior to and after deposition, and the amount of any material deposited onto those filters was precisely determined along with changes in overall mass. Thus, each filter may be regarded as an independent sample within the applied PLSR model, as would be the case in real-world sampling scenarios in mine environments. For this approach, the raw data were used without any corrections prior to establishing the model.
The results of the PLSR model are shown in Fig. 3. For the model, a total of seven latent variables were used chosen by revising the RMSEC/RMSECV versus latent variable number plot being aware to choose as less factors as possible to prevent fitting noise. In total, this results in a cumulative variance capturing 98.55% of the total variance within the dataset. This resembles the spectral complexity of the minerals vibrational pattern and the overall low noise level within the selected region. The spectral region selection limited to the evaluated range at 550–1750 cm−1 avoiding processing spectral data carrying no relevant analytical information. The main preprocessing steps of the raw spectra involved a baseline correction based on an automatic weighted least squares algorithm followed by autoscaling. The scores plot in Fig. 3 compares the scores of latent variables 1 and 2. It is immediately evident that all nine calibration mixtures could be unambiguously classified. The 95% confidence ellipses are clearly separated from each other. The model was confidently able to distinguish between all mixtures. Test 0 mixture is standing out, as it shows higher deviations in mineral mass, and was thus classified as different group.
Multivariate calibration and validation of nine filter sample groups containing calcite, quartz, and dolomite along with a test mixture of the same minerals.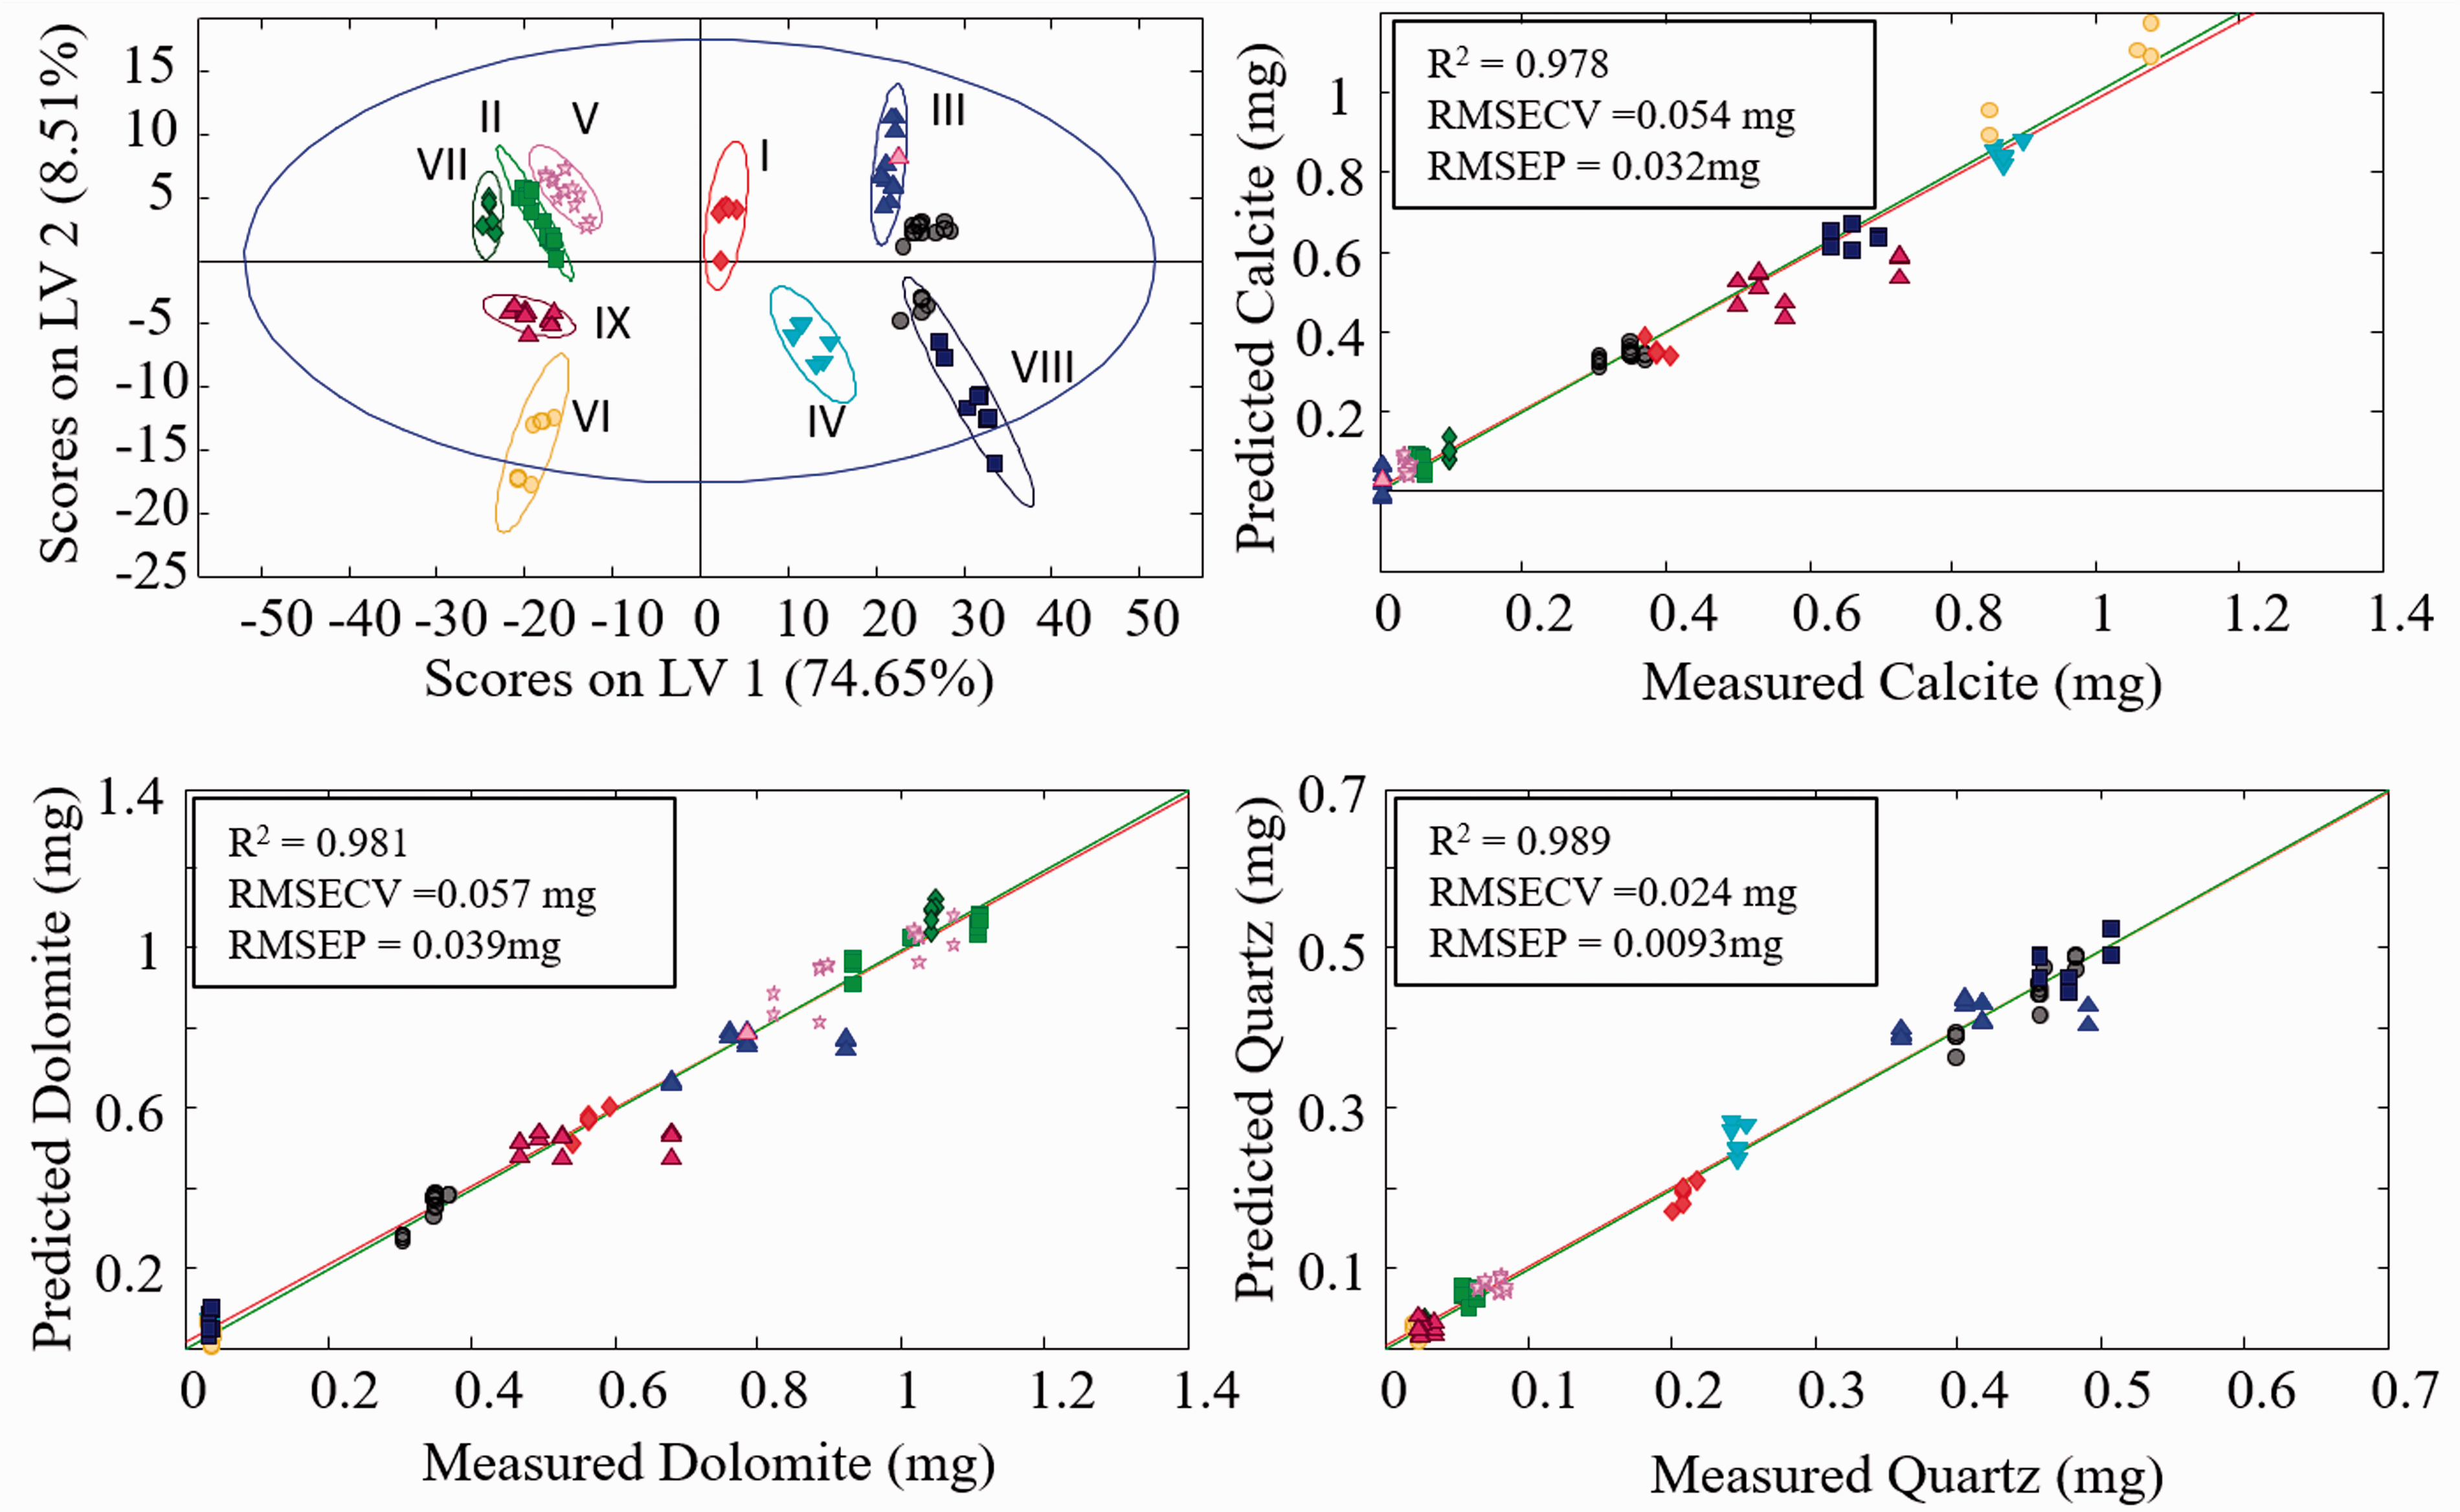
The calibrated target minerals, i.e., calcite, dolomite, and quartz were calibrated with excellent precision. The calibration functions in Fig. 3 all show linear correlations with a goodness of the fit (R2) value of 0.978 for calcite, 0.981 for dolomite, and 0.989 for quartz, respectively. The root mean square error of cross-validation (RMSECV) gave values of 0.054 mg for calcite, 0.057 mg for dolomite, and 0.024 mg for quartz, respectively. Hence, each component was calibrated with exceptionally low deviation from the reference value.
The main error occurring for any prediction based on a given calibration model is described as the so-called root mean square error of prediction (RMSEP).30 All minerals were quantified with satisfactorily small RMSEP values, namely 0.032 mg for calcite, 0.039 mg for dolomite, and 0.0093 mg for alpha-quartz.
Discussion
Calibration Mixture Spectra
As stated above, prior studies by Cauda et al.1 showed that respirable silica particles can be quantified via IR methods; however, analytical confounders may affect the estimation. Those confounders can be caused by mineralogical composition of the samples or variations in particle size.1,5,21 In addition, the substrate, i.e., the used filter plays an important role, as it has its own quite populated spectral pattern. From Fig. 1, it is evident that the intense PVC background (black spectrum) results in significant IR-band overlaps. For quartz, only the asymmetric stretching vibrations of quartz remain unaffected by the filter background. The symmetric stretching vibration is completely overlapped. For the carbonates, bands indicative of calcite and dolomite at 712 cm−1 and 729 cm−1 are barely distinguishable from the filter background spectrum.23,36 Remaining carbonate bands show overlaps with the filter or each other. The main deviation though was assessed comparing different filters to each other. While the initial sample mass used for deposition is known and controllable, samples finally vary in total deposited masses at the substrate. This difference in mass is obtained by simple weighing and was then introduced as an additional variable into the multivariate calibration model, thus considering each filter an independent sample and different deposited masses. However, spectral changes between filters are not only generated by the deposition procedure. Regarding the 1425 cm−1 signal of PVC in Fig. 1, substantial changes in intensity are observed. Here, especially the filter thickness plays an important role. Within the recorded data of this study, weighted filter masses showed differences of up to 34%. This may lead to significant spectral distortions caused by the filter background. During the univariate calibration, only a single exemplary filter was subtracted from the dataset. As the integrated quartz signal is the only IR signature not strongly affected by the filter spectral characteristics, this may be an appropriate method when analyzing quartz only. However, if other analytes need to be quantified in addition, this is an intrinsic multivariate problem, as the filters are by no means uniform in their spectral characteristics. In turn, subtraction of each individual filter background spectrum is not a viable option during in-field assessment of hazards, as such methods should be readily automated without having to calibrate each and every filter. For this reason, in the present study, the variability of the filter background for each sample was used as a component of the multivariate model, i.e., the spectra were used without any background correction.
Results with Conventional Univariate Calibration Model
The attempt of a univariate calibration integrating the quartz signal using spectra from the produced dataset (Fig. 2) provides, as anticipated, a useful linear model. It is evident that higher concentrations of quartz could be predicted with less precision, which renders this classical regression approach not suited for the prediction of high exposure scenarios. The resulting limit of detection for that dataset was calculated at 24.3 µg with a limit of quantification of 80.3 µg. These figures-of-merit are insufficient for the concentrations expected in most limestone mines according to Table I. However, calibrations of pure quartz only yielded limits of quantification of 15 µg, as reported by NIOSH. This indicates that the presence of other minerals may act as a confounding factor. Another possible explanation for the low precision at high quartz levels is the method used for the creation of the calibration samples. Minerals other than quartz may not be calibrated at all using this conventional approach, as the IR signature of the filter entirely convolutes the spectral features of the sample components. Hence, the filter background is another significant analytical confounder when it comes to real-world measurement scenarios.
In a real-world in-field scenario, an analytical method providing the date for intervention of hazards clearly has to handle these problems. A background subtraction of each individual filter would circumvent several issues (e.g., spectral filter background, etc.), however is not practical. In addition, quantifying multiple minerals by individual peak integration in mixture would be time consuming, as each component has to be individually calibrated.
Last but not least, analytical confounders (e.g., particle size, impurities, variable filter background, etc.) arising from increasingly complex matrices may additionally distort the already complex structure of the infrared signature.1,5
Results with Multivariate Calibration Model
Compared to the univariate approach, a multivariate approach allows to quantify different analytes simultaneously. Additionally, the applied PLSR approach allows to circumvent dealing with the immediate complexity of the spectrum by evaluating the data in the variance data space expressed as Eigenvectors, i.e., the so called latent variables (LV).29,30,33 For this approach, the raw data are used without any background correction, and are subject to several data preprocessing steps as part of a fully automated data evaluation routine.
Thus, obtained component calibration models provide superior predictivity for all three analytes. Especially with regard to the fact that some samples only contained trace amounts (i.e., <25 µg) of alpha-quartz particles, the established models provide exceptionally accurate predictions for the most hazardous analyte, which is of utmost relevance for the utility of this method in real-world monitoring scenarios in mining environments, and for providing solid data enabling effective interventions. The rather excellent values for correlation and predictivity demonstrate that the combination of experimental design, multivariate regression, and IR-based direct analysis techniques is capable of rapid identification, quantification, and prediction of a variety of analytes within multimineral mixtures augmented by minimal sample preparation, as direct IR analysis of loaded filters may be accomplished in <30 s.
In detail, the relevance of individual variables or spectral datapoints within a PLSR model may be evaluated using so-called selectivity ratios providing a numerical assessment. The higher the value of the selectivity ratio, the more weight the associated wavelength has during the prediction. Values lower than the 95% confidence limit are not considered for the prediction.23,37 Consequently, the selectivity ratios for each component were calculated and compared to the corresponding IR spectra. Figure 4 shows the selectivity ratios for the three minerals and their 95% confidence limits. For materials with less distinct IR signatures owing to overlapping features of the filter material, these plots provide insight into the wavelengths that are most relevant for each specific mineral. For calcite and dolomite, even the usually highly indicative carbonate bending peaks at 712 cm−1 and 727 cm−1, and the out-of-plane bending vibration at 875 cm−1, which are hardly recognizable due to the filter background, are in fact considered relevant for the calibration and prediction, which certainly may not be immediately presumed via visual inspection of the spectra.23,36 For quartz, evidently the asymmetric stretching vibration at 800–760 cm−1 provides the main contribution during the prediction; however, also the highly overlapped symmetric stretching vibration at 1200–900 cm−1 has a substantial relevance for accurate predictions.23,36 Due to band overlaps, this feature is not easily accessible for conventional calibration methods, yet appears to be of immediate relevance in the selected PLSR approach. Hence, the established multivariate model was capable of unambiguously extracting the most relevant spectral features for accurately predicting the quantitative composition of all multimineral samples loaded onto PVC filters despite the rather complex structure of the associated infrared spectra convoluted with several analytical confounders.
Selectivity ratios for calcite, dolomite, and quartz along with the respective 95% confidence limits.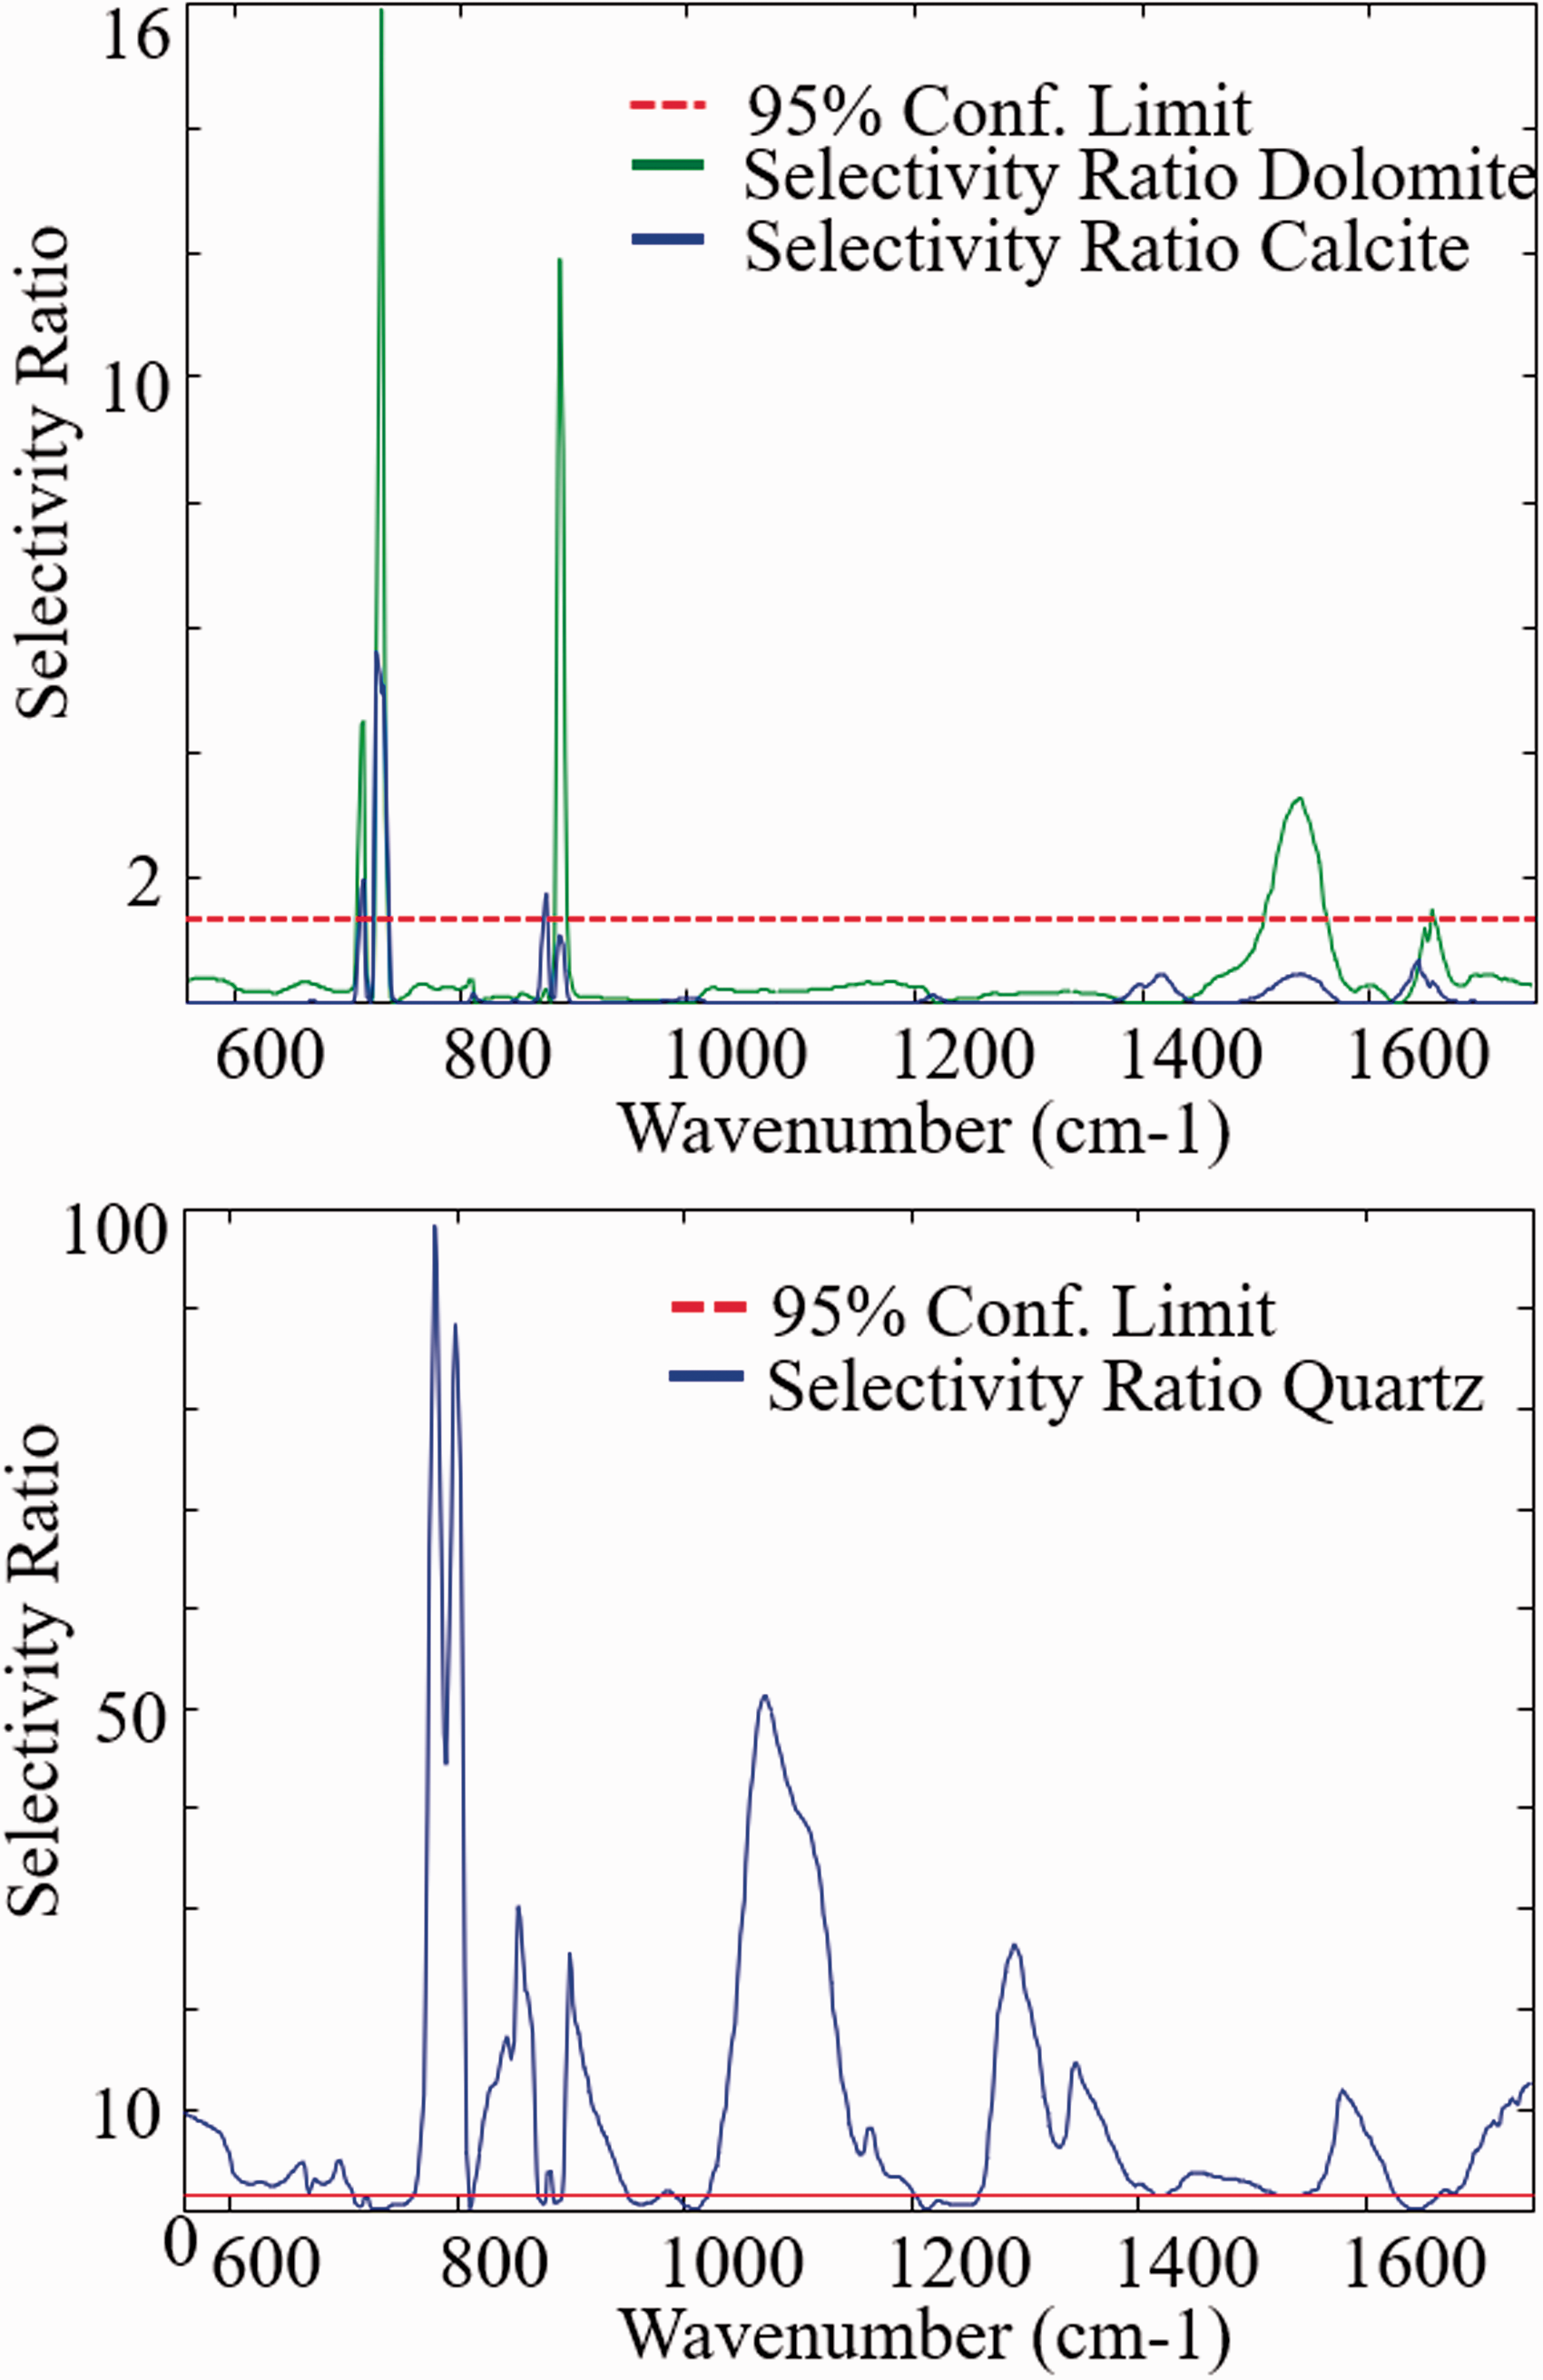
Conclusion
A simple field-deployable IR method combined with an advanced PLS regression model was developed promising rapid, accurate, and robust monitoring of respirable particles without any sample preparation based on PVC filters contained in sampling cassettes already used for exposure monitoring in mining scenarios. Compared to conventional univariate calibration approaches, the established multivariate method takes the presence of other minerals into account and may quantify additional components within complex dust matrices. The developed multivariate models not only provides accurate quantitative compositional information, but may be readily and rapidly adapted to a wide variety of mineral mixtures and associated mining scenarios. The established PLSR model was based on transmission IR spectra collected by directly analyzing DoF PVC filters, as used in ISO 19087:2018 and NIOSH 7500 despite the filter medium acting as a spectral confounder.
Due to established calibration technique for based on laboratory-made calibration sample mixture deposition, such models are readily tailorable to a matrix of interest—here, a mixture of calcite, dolomite, and quartz—by experimental design algorithms, which ideally augments with the sector/mine-specific approach established by Cauda et al.,1 using a multivariate regression approach effectively addressing matrix-based analytical confounders. The present study shows excellent predictability of three hazardous analytes, i.e., calcite, dolomite, and quartz in complex mineral mixtures at concentration levels relevant to underground mining scenarios. Contrary to state-of-the-art techniques, which usually focus on alpha-quartz only, the presented approach may be tailored to any kind of multicomponent mixture considering the present minerals. The developed PLSR approach was capable of automatically extracting the most relevant spectral features from rather complex infrared spectra despite strong convolution of the analyte's spectral features with the IR signature of the filter background. Hence, based on the DoF approach, a method for rapid direct assessment of potential intervention measures in underground and surface mining scenarios where human workers are exposed to hazardous dust particles has been established, which promises a versatile tool for controlling air quality, and thus quality of life, for the involved personnel.
Footnotes
Acknowledgments
The Focused Ion Beam Center Ulm is thanked for assistance with SEM imaging and crystallographic interpretation.
Disclaimer
The findings and conclusions in this paper are those of the authors and do not necessarily represent the official position of the National Institute for Occupational Safety and Health, Centers for Disease Control and Prevention. Mention of any company or product does not constitute endorsement by NIOSH.
Declaration of Conflicting Interests
The author(s) declared no potential conflicts of interest with respect to the research, authorship, and/or publication of this article.
Funding
The author(s) disclosed receipt of the following financial support for the research, authorship, and/or publication of this article: The authors appreciate the financial support for this study by CDC-NIOSH.