
Abstract
The present study has investigated the transformation of sesame oil kept at low temperature during a definite period of time for refinement (called winterization) as an inactive drug ingredient by using two-dimensional difference spectra (2D-DS) analysis of spectra collected using a near-infrared (NIR) and mid-infrared (MIR) dual-wavelength spectrometer (NIR–MIR-DWS). The NIR and MIR spectra were measured nearly simultaneously from samples of sesame oil before and after winterization. The difference spectrum analysis of the obtained NIR–MIR data elucidated that, after the winterization process, the absorbances at peaks attributed to C=O, C=C, and OH groups decrease while the absorbances arising from the main chain (CH2) increase. The result indicated the removal of lignan and the fatty acids with relatively short main chains. Moreover, sesame oil unwinterized was cooled from room temperature to near 1 ℃ and subsequently warmed to room temperature. And the cycle was repeated two times. Real-time monitoring during the cooling and warming processes were carried out using the NIR-MIR-DWS. The prediction results obtained from partial least square calibration model for the temperature suggests that there are subtle differences in the oil composition between the first cooling process and after the warming and cooling cycle. For the more detailed analysis, the 2D-DS method is proposed. The results of the analyses using 2D-DS revealed that the starting point of the transformation is around 15 ℃. It can be estimated that sesame oil is mainly transformed by the first cooling down. Moreover, it was implied that the structure of methylene (CH2) was significantly related to the modifications in sesame oil with temperature change. A series of experimental results elucidated that the winterization of sesame oil removed its impurities and stabilized its conditions. These results are probably the first report on the effect of the winterization process on sesame oil.
Keywords
Introduction
Near-infrared (NIR) spectroscopy has numerous advantages for process monitoring, including the ease of nondestructive and in situ analyses, as well as the availability of optical fiber and non-contact probes. Because of these features, NIR spectroscopy has recently become an indispensable technique for the quantitative and qualitative analysis of real-time process monitoring and quality control in a variety of industries.1–7 The use of NIR spectroscopy has now spread to multiple fields, such as agriculture, foods, polymers, petroleum, and pharmaceuticals. 4
Recently, there has been an increase in an interest in process analytical technology (PAT) because a guide for industry PAT was issued from the U.S. Food and Drug Administration (FDA) in 2004. 8 PAT is a key term in the next generation of pharmaceutical manufacturing processes, and process understanding is a particularly significant point for the realization of PAT.8,9 The FDA guide on PAT focuses on the importance of process understanding. There are several specifications and requirements, such as wireless data communication for blending processes and contamination monitoring for bio-reactors, which must be met for the realization of process monitoring. Various spectroscopic methods have been proposed for PAT and investigated in the literature.5,8–11
However, there are a few examples that consider effective process monitoring strategies and analyses for scaling up from a lab process to a pilot process or from a pilot process to a commercial process and an expeditious realization of the real-time release. Real-time release is the ability to evaluate and ensure the quality of the in-process and/or final products based on process data.12,13 When scaling up a lab process to a pilot process or a pilot process to a commercial process, the requirements for an optimum analyzer performance change in each step. This means that no single analyzer may be ideal for a lab, a pilot, or a commercial process. For example, mid-infrared (MIR) spectroscopy is a general tool for monitoring reactions in a lab. It is powerful for the identification of samples, but it does not always perform satisfactorily in a pilot process or commercial plant because of the requirement for a thin sample and the lack of availability of long distance optical fibers. On the other hand, although NIR spectroscopy is clearly one of the best available tools to monitor real-time processes, it may not be sufficient to understand a process in detail because of overlapping of complex and broad bands arising from overtones and combination modes in the NIR region.
Considering the background described above, we proposed a dual-wavelength spectrometer (DWS) that enables the measurement of the NIR and MIR spectra nearly simultaneously as a method to bridge the gap between the lab, the pilot, and commercial processes.14–16 It is now possible to monitor changes of the NIR and MIR spectra nearly simultaneously and treat these regions as a single spectrum by using the DWS.
Generalized 2D correlation spectroscopy (2D-COS) has become a popular and well-established tool for spectral data analysis. 17 2D-COS is a tool for mathematical analysis tool that can significantly enhance the spectral resolution and characterize the specific sequential order of spectral intensity changes.17–21 In addition, 2D-COS enables the establishment of unambiguous band assignments through the correlation of changes in the band intensity. The application of correlation analysis to a situation in which two different types of spectra are obtained for a system under the same perturbation is an interesting example of 2D-COS. In particular, the 2D NIR and MIR hetero-spectral correlation analyses are valuable since the assignment of the NIR bands can be achieved by correlating the NIR bands with MIR bands. 21
The possibility of a combined use of the NIR and MIR spectra has been studied by several research groups. For example, Amari and Ozaki investigated the initial oligomerization of hydroxyethyl terephthalate using the 2D-COS of attenuated total reflection Fourier transform infrared spectroscopy (ATR FT-IR) and FT-NIR spectra. 22 Czarnik-Matusewicz et al. explored a temperature-dependent water structure by using IR and NIR to assign the OH groups of water, 23 and Cocciardi et al. studied the relationship of the NIR and MIR spectra of water solutions containing glucose and fructose or fructose and galactose. 24 Genkawa et al. reported the detailed development of a dual-wavelength system and demonstrated some examples of application. 16 Nishii et al. studied ethanol concentration in a fermentation process by using 2D-COS and NIR–MIR-DWS.25,26 Additionally, Morita developed a program for 2D-COS named 2DShige that is very user friendly. 27 Furthermore, various modified 2D-COS methods such as two-trace two-dimensional (2T2D) correlation spectroscopy have been proposed. 28 However, 2D-COS is not necessarily sufficient for real-time process monitoring owing to its limitations related to the application of process monitoring, such as the requirement of equally spaced perturbations and the perturbations with one direction (ascending or descending order). The data obtained from winterization are bidirectional in terms of the cooling down and warming up temperatures, the temperature intervals are not even, and the data contain hysteresis. Considering the limitation of the 2D-COS, we have proposed a simple two-dimensional difference spectrum (2D-DS) method as the real-time monitoring tool of NIR–MIR-DWS.
Sesame oil has been used as an inactive drug ingredient for intramuscular injections or a crude drug in the pharmaceutical industry.29–31 The main constituents of sesame oil are unsaturated fatty acids (oleic acid: ∼40 w/w%; linoleic acid: ∼45 w/w%) and saturated fatty acids (from C14 to C24 fat acid: ∼15%). The constituent ratio of the oil depends on the place of production and the species. 32 In general, the purity of the raw sesame oil changes with the production site and includes a minute amount of impure substances. Therefore, the oil is purified by the process called as “winterization”, in which the sesame oil is kept at low temperature for a definite period of time. After the winterization, the sesame oil is filtered by paper filter at the low temperature and returned to room temperature for use as an inactive drug ingredient or pharmaceutical crude oil. Moreover the winterization has been used for a long time as a purification process of the edible oils such as cottonseed oil, corn oil, sunflower oil, and palm oil to avoid clouding or white turbidity at low temperature.33,34 The winterization is also known as dewaxing, and the process of the dewaxing has been studied in petrochemical industry as well. 35 However, it is unnecessary to use the winterization for the refinement of the edible sesame oil, because there is little clouding at low temperature by the little impure substances in sesame oil. Nevertheless, to achieve a higher purity of sesame oil as an inactive drug ingredient, the winterization process is applied.
Though the sesame oil is purified by the winterization, it is rare to use a spectroscopic analysis method for monitoring the winterization process of sesame oil. Moreover, it is very difficult to monitor the effect of the winterization by using NIR or MIR instrument, because the spectrum change of sesame oil by the winterization is rather smaller than the change of the sesame oil by the temperature. Although it is not yet the standard industry practice to apply spectroscopic analysis to this kind of traditional product process, the FDA recommendation to adopt PATs requires deeper knowledge on the manufacturing of a product.
The objective of this paper is to increase the knowledge on the winterization process of the sesame oil for the process understanding by using 2D-DS method and NIR–MIR-DWS. In this paper, the relation of NIR and MIR regions spectra at specific temperature has been studied by the difference spectra (DS) and 2D-DS method calculated from NIR and MIR region spectra of sesame oil measured by NIR–MIR-DWS. DS and 2D-DS at specific temperature have clarified the relation between NIR and MIR spectra at different temperature and suggest the starting temperature of winterization, and the order of the chemical transformation.
It seems like that the combination of 2D-DS and NIR–MIR-DWS can increase the knowledge for the process understanding on the transformation of sesame oil by the winterization.
Experimental
Instrumentation
Figure 1 illustrates a schematic of the NIR–MIR-DWS and the related experimental setup. The NIR–MIR-DWS is a trial product developed at Yokogawa Electric Corp. owing to a grant from the New Energy and Industrial Technology Development Organization, Japan. The spectrometer consists of the following components: a Fourier transform (FT)-NIR–MIR interferometer (Yokogawa Electric Corp., FIR1000), an optical switch (Axiom Analytical) to change the light paths, a transmission immersion NIR probe (path length: 1 mm, φ16 mm, trial product of Axiom Analytical and Yokogawa Electric Corp.), an ATR immersion MIR probe with zinc selenide internal-reflection element (ZnSe IRE) (Axiom Analytical: DPR207), an Indium Arsenide (InAs) NIR detector (AIT Analect), a mercury–cadmium–tellurium mid-IR detector (InfraRed Associates Inc.; FTIR-18-1.00), a system control box (Yokogawa Electric Corp.; trial product), a data logger (Yokogawa Electric Corp.; DX100), a temperature controller (OMRON: E5AC), a heater (ASONE: STNH-1101), a refrigerator (Thomas: TRL-117SF), and a personal computer for data input/output.
Schematic diagram of the NIR/MIR dual-wavelength spectrometer (NIR/MIR-DWS) and experimental setup.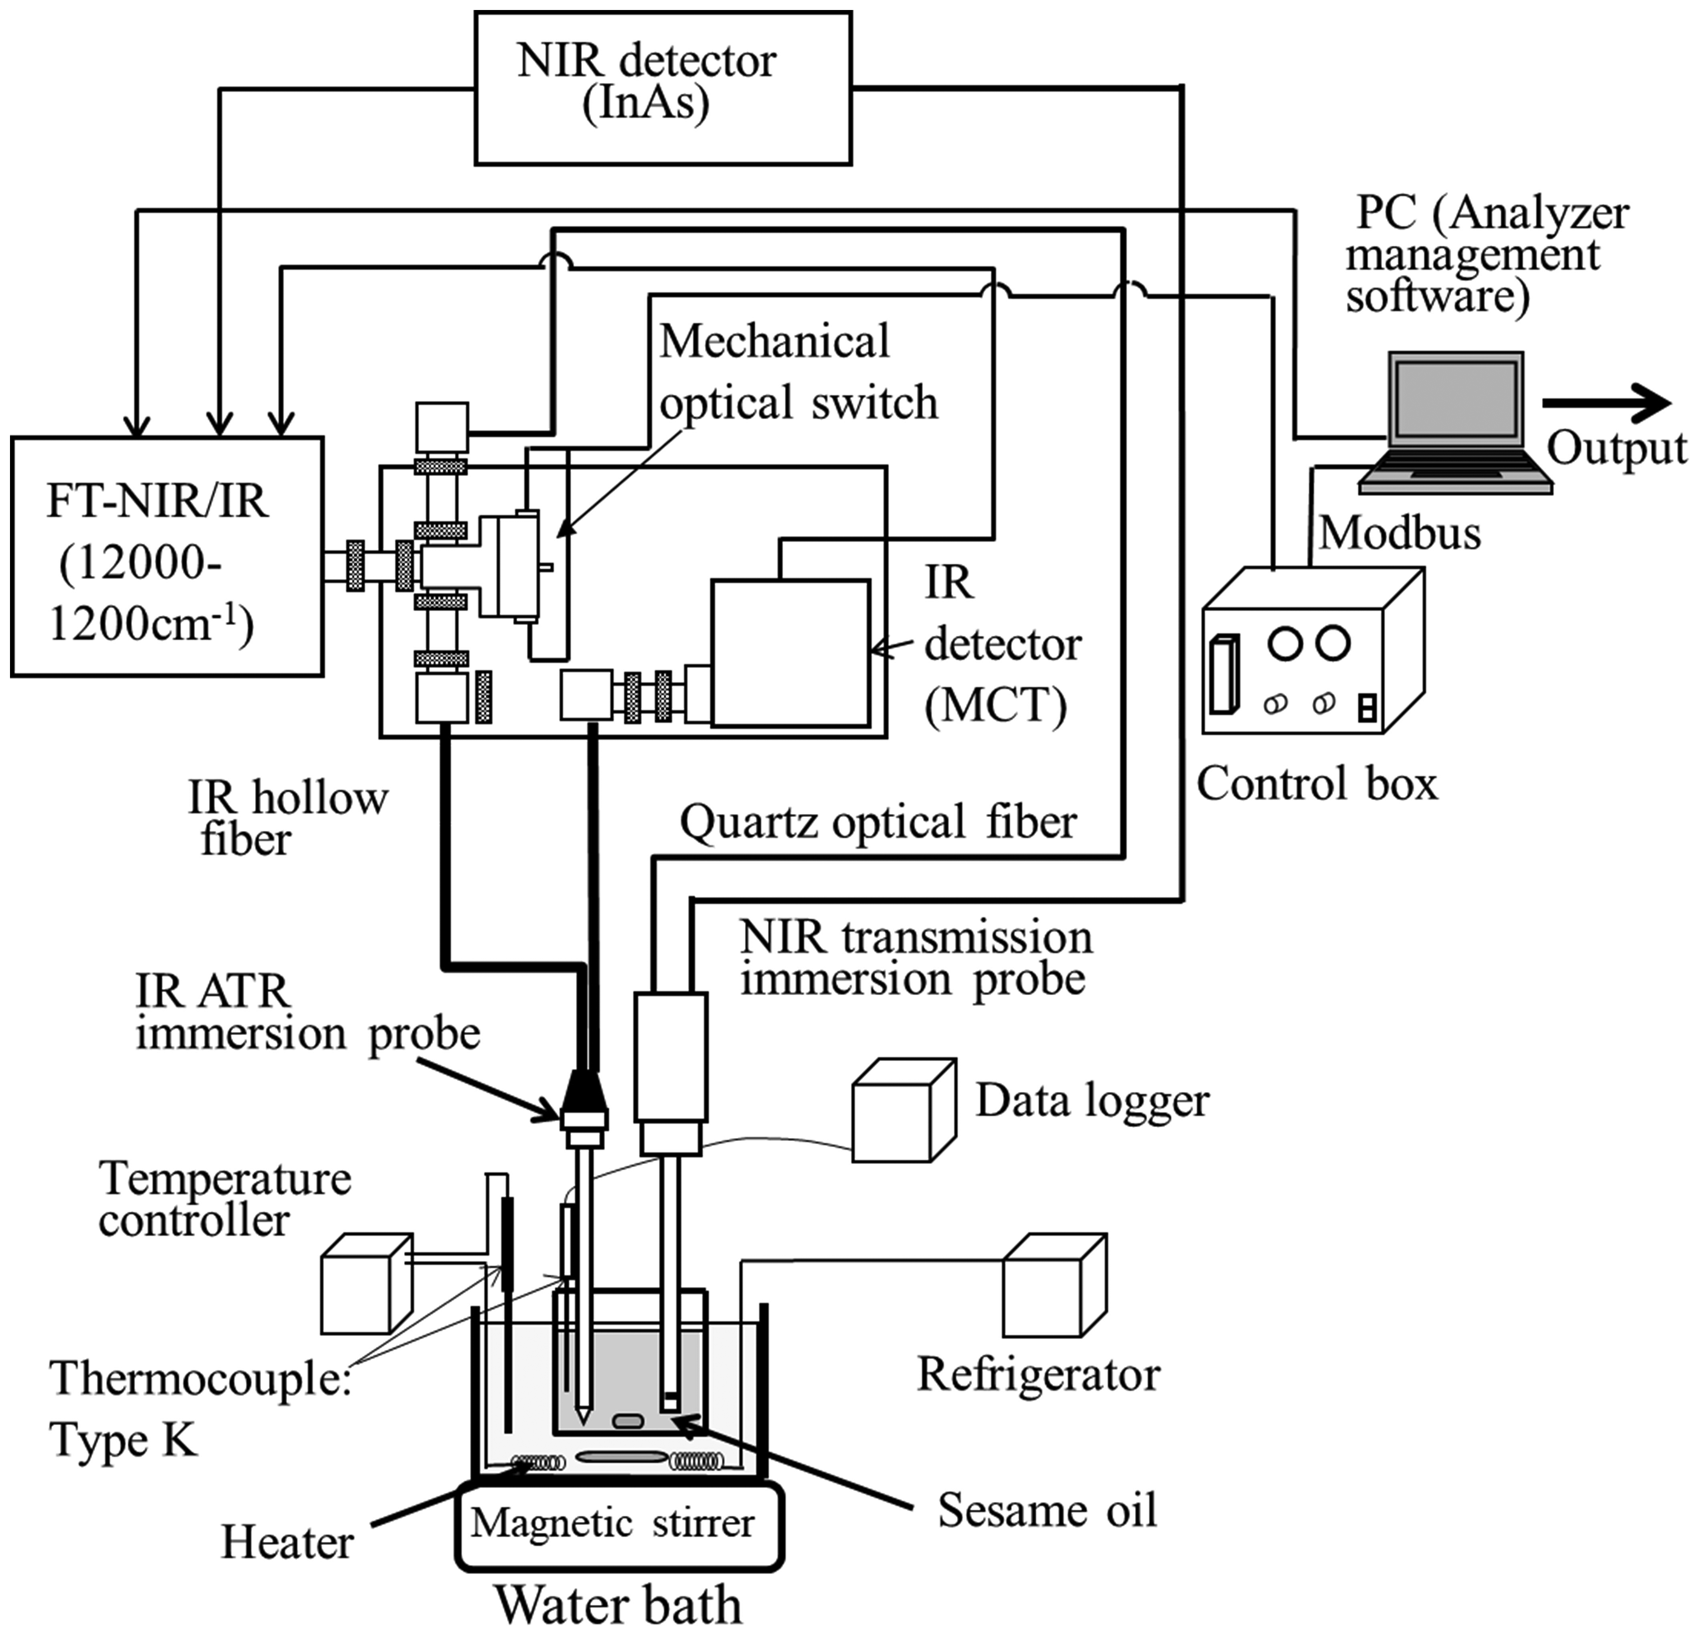
The NIR and MIR detectors were cooled with a Peltier device and liquid nitrogen, respectively. A silica optical fiber (Ceram Optec; 2 m) and hollow fibers (Doko Engineering LLC; 1 m) were used as optical waveguides for the respective NIR and MIR sides of the instrument. Hollow fibers transmit MIR light without special spectral loss.
The analyzer management software to control the NIR–MIR-DWS was developed based on the Symbion software (Symbion Systems Inc.). The Symbion management software for NIR–MIR-DWS can automatically change the optical path by the optical switch, collect NIR or MIR spectrum alternately, and combine those spectra like one spectrum which has NIR and MIR regions (10000–1200 cm–1). The management software has also a capability to calculate 2D-COS algorithm, though 2D-COS was not used in this study.
The boundary between NIR and MIR regions was set at 4200 cm−1, considering the decrease in the signal-to-noise ratio due to optical fiber losses. The detail of the NIR–MIR-DWS was described in Genkawa et al. 16
The sample was set in a saltwater bath (∼5 w/w% salt) in which the temperature was controlled by an external heater (Asone, STNH-1101) and cooling unit (Thomas TRL-117SF).
Sesame Samples
Sesame oils before and after winterization were supplied as generous gifts from a Japanese pharmaceutical company.
Data Analysis
The Pirouette software program (v.4.5, Infometrix) was employed for data analysis. Calibration models for predicting the temperature of the sesame oil were developed by use of partial least squares (PLS) regression. Mean centering was applied to all of the PLS calibration models as a preprocessing step. GNU Octave 5.10 (GNU Project) was used for preprocessing the spectra and the calculation of 2D-DS.
For obtaining stable and repeatable spectra for the calculation of DS and 2D-DS, smoothing (Savitzky–Golay filter with polynomial order three, window length seven) and a six-point baseline correction (linear fit to 8979, 7598, 6300, 6166, 5319, and 4802 cm−1) was applied to the NIR spectra (10000–4200 cm−1). In the MIR region (4200–1200 cm−1), smoothing (Savitzky–Golay filter with polynomial order three, window length seven) and an 11-point baseline correction (linear fit to 4104, 3498, 2499, 2260, 2079, 1901, 1631, 1550, 1485, 1400, and 1334 cm−1) were applied. The MIR spectra of sesame oil measured during cooling and warming process for the simulation of the winterization were applied ATR correction algorithm 36 to fix the penetration depth. The following are the constants for ATR correction.
The refractive index of the sesame oil was 1.473, 37 and the refractive index of ZnSe was 2.4, 38 and the angle of incidence was 45 °.
Results and Discussion
Results
Difference Spectra Analysis of NIR–MIR Spectra Measured Before and After Winterization of Sesame Oil Samples at Room Temperature
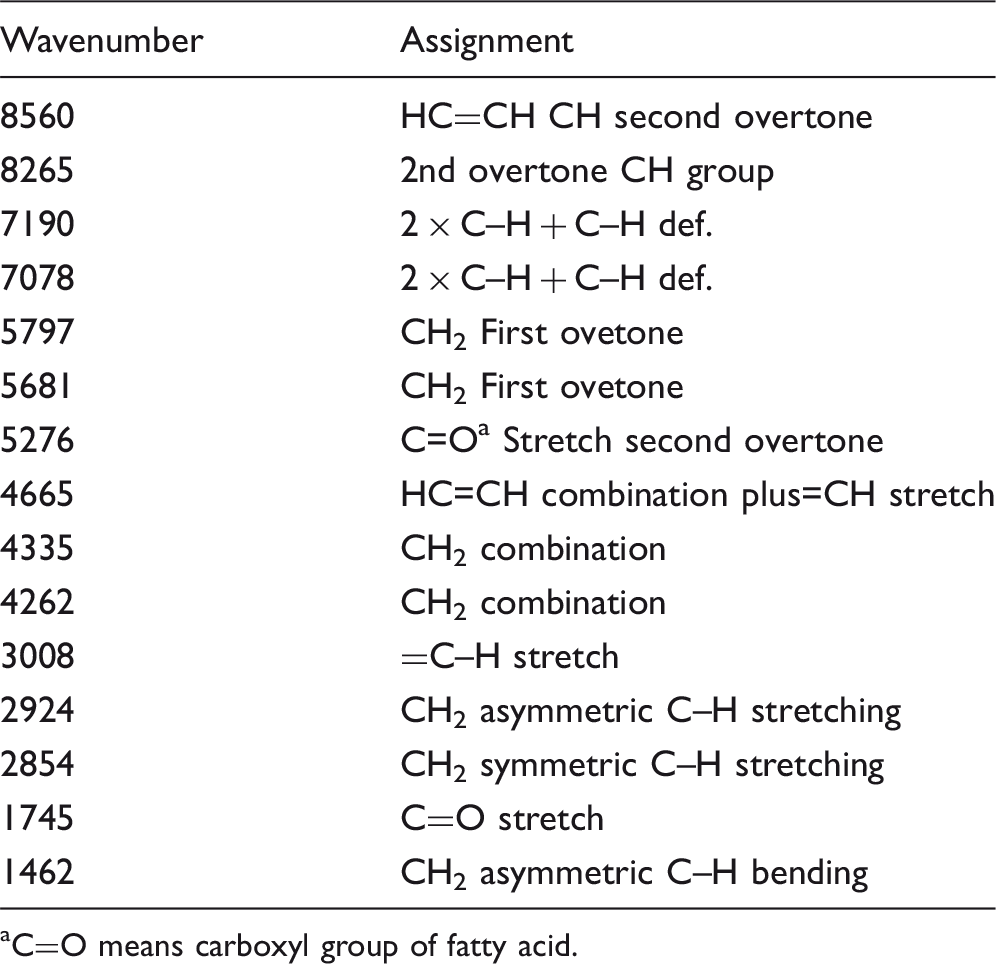
Eight spectra of sesame oil before winterization were collected from three bottles (two or three spectra from each bottle) using NIR–MIR-DWS at 26.4 ± 0.5 ℃. The same numbers of spectra were measured from three bottles after winterization using the same measurement conditions as before winterization. Average spectra were calculated from each before and after spectra. Figure 2 depicts the average near-infrared/mid-infrared (NIR/MIR) spectra in the 10000–1200 cm–1 region of sesame oil before and after winterization. NIR and ATR probes were designed that it is possible to measure spectrum from small volume (30 ml) sample. Adding it, as NIR–MIR-DWS were designed that the absorbance values in NIR and MIR region are nearly same, it is possible to overview and treat as a single spectrum from NIR to MIR region. The differences in the average spectra before and after winterization were too small to pick out clear differences from Fig. 2. Table I summarizes the band assignments for the NIR–MIR spectrum of sesame oil. As sesame oil consists mainly of oleic acid and linoleic acid, the assignments were made by referring to the assignments of NIR–MIR spectra of oleic oil and linoleic oil reported previously.39–48
Average combined NIR/MIR spectrum of sesame oil before and after winterizing at room temperature (26.4 ± 0.5 oC). (spectral resolution: 8 cm−1; scan number: 512; background: 999). The band assignments of an NIR/MIR spectrum of sesame oil. C=O means carboxyl group of fatty acid.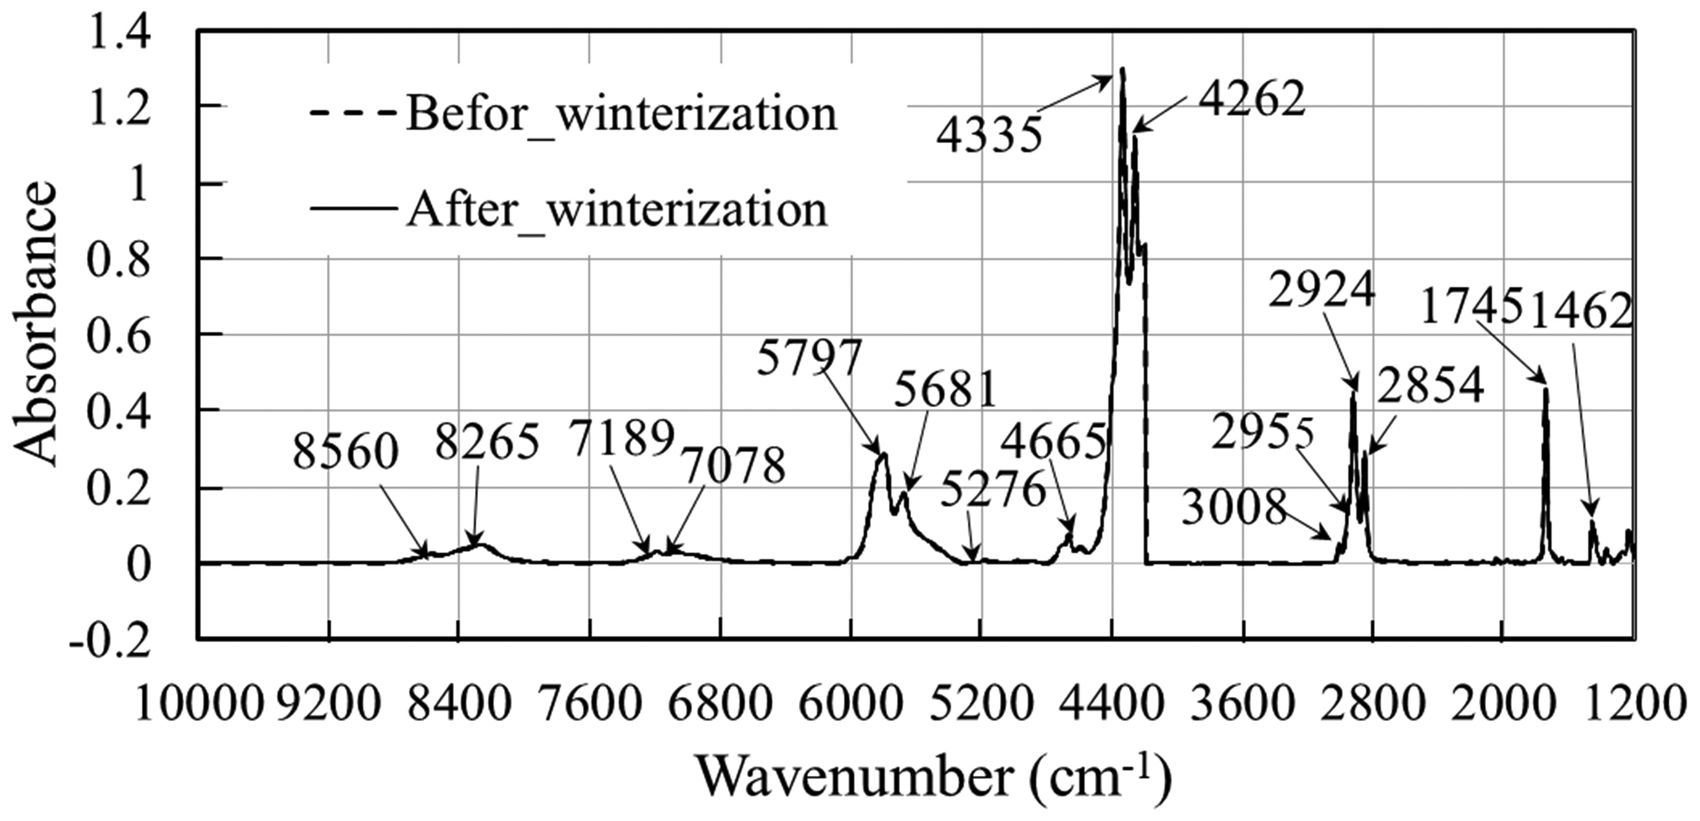
Difference spectrum analysis was applied to investigate the differences between the before and after winterization spectra. As described above, after winterization, the sesame oil is filtered by filter paper at low temperature. Therefore, it is very likely that the difference spectra contain some information about the change in the sesame oil due to the winterization process. Figure 3 shows the difference spectrum calculated from the spectra shown in Fig. 2. To calculate the difference spectra, the before-winterization spectrum was subtracted from the after-winterization spectrum. It is noted that there are some differences in peak positions between the spectra in Figs. 2 and 3. These slight differences in the spectra represent a shift in wavenumber between the before- and after-winterization spectra.
Difference spectra calculated by using averaged spectra at room temperature (26.4 oC) before and after winterizing.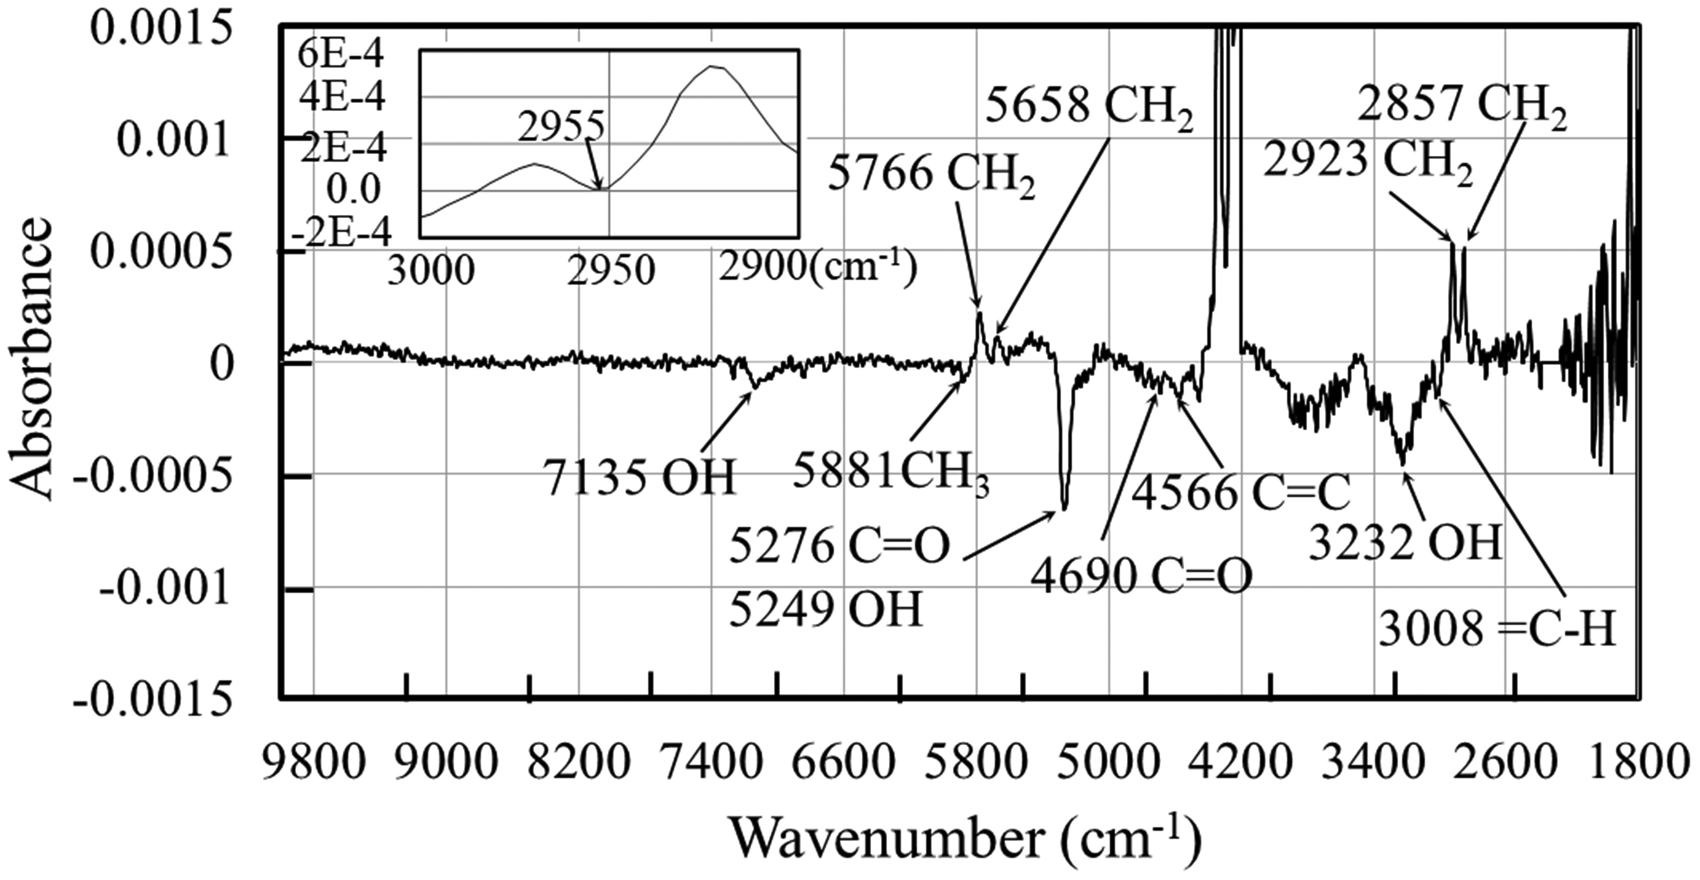
The second derivative was applied to the difference spectrum around the 5260 cm–1 region for detailed analysis using resolution enhancement. Figure S1 (Supplemental Material) illustrates the enlarged second derivative spectrum of the difference spectrum from 5400 to 5150 cm–1. Although the absorbance values of the two peaks at 5276 and 5249 cm–1 become positive by the second derivative, it is evident from Figure S1 that there are two peaks attributable to C=O and OH near 5260 cm–1. We neglected the peak at 2365 cm−1 because its intensity depended on the amount of carbon dioxide in atmosphere. It can be seen from Fig. 3 and Figure S1 that the bands attributed to the CH2 groups (2857, 2923, 5658, and 5766 cm−1) increased, while the bands arising from to the C=O group (5276 and 4690 cm−1) and OH groups (7135, 5249, and 3232 cm–1) decreased. Though the absorbance value is very low, HC=CH groups (4566 and 3008 cm−1) and CH3 group (5881 cm−1) look like decreasing. As the concentration of the substance filtered by the winterization is probably <1 or 2 w/w%, some peaks of the difference spectra may be buried in the noise.
It is evident from Table I, Figs. 2 and 3, and Figure S1 that after winterization, the C=O and OH groups decrease, while the CH2 groups increase. As described above, the main constituents of sesame oil are fatty acids, such as palmitic acid, oleic acid, and linoleic acid. The chemical structure of these fatty acids does not have the OH group that exhibits spectrum peaks at 7135, 5249, and 3232 cm–1. Therefore, these peaks seem to imply the presence of substances with OH functional groups. Sesame oil has lignans such as sesaminol and sesamol as the minute components. 49 These lignans have the OH end groups in their chemical structure, but they do not have the CH2 group. Therefore, it can be inferred that the lignans were removed by the winterization process.
The results, therefore, suggest that lignan and/or unsaturated fatty acids with relatively short main chains was lost, while the fatty acid with relatively long main chains was enriched due to the winterization process.
Monitoring of the Winterization Process Using NIR–MIR-DWS
To better understand the winterization process, the spectrum of sesame oil was measured by NIR–MIR-DWS during cooling from 25 °C to ∼1 °C as a simulation of the winterization process. The sesame oil for the cooling process experiment was an unwinterized sample with a different lot number from the oil shown in Fig. 2. The cooling process was carried out in four temperature steps (that is to say, near 25 °C, near 15 °C, near 10 °C, near 5 °C, near 1 °C). The sesame oil sample was slowly changed during about 15 min at each step. After cooling down to near 1 °C, the temperature of the sample was slowly re-elevated to room temperature, cooling down to 5 °C again, and finally re-elevated to room temperature (Fig. 6). As there is a 2.5 min time difference between NIR and MIR spectrum according to the change of optical path in the NIR–MIR system, two NIR spectra or MIR spectra at 5-min intervals were averaged alternately to reduce the effect of the measurement at different time. The spectra measured at different temperatures were added 0.07 Abs for offset adjustment in the NIR region (10000–4200 cm–1), and the pretreatments (smoothing, baseline correction, and ATR correction in MIR region) described in the data analysis were applied.
A comparison the temperature measurement by thermocouple with the predicted temperature using calibration models NIR-7 and MIR-2.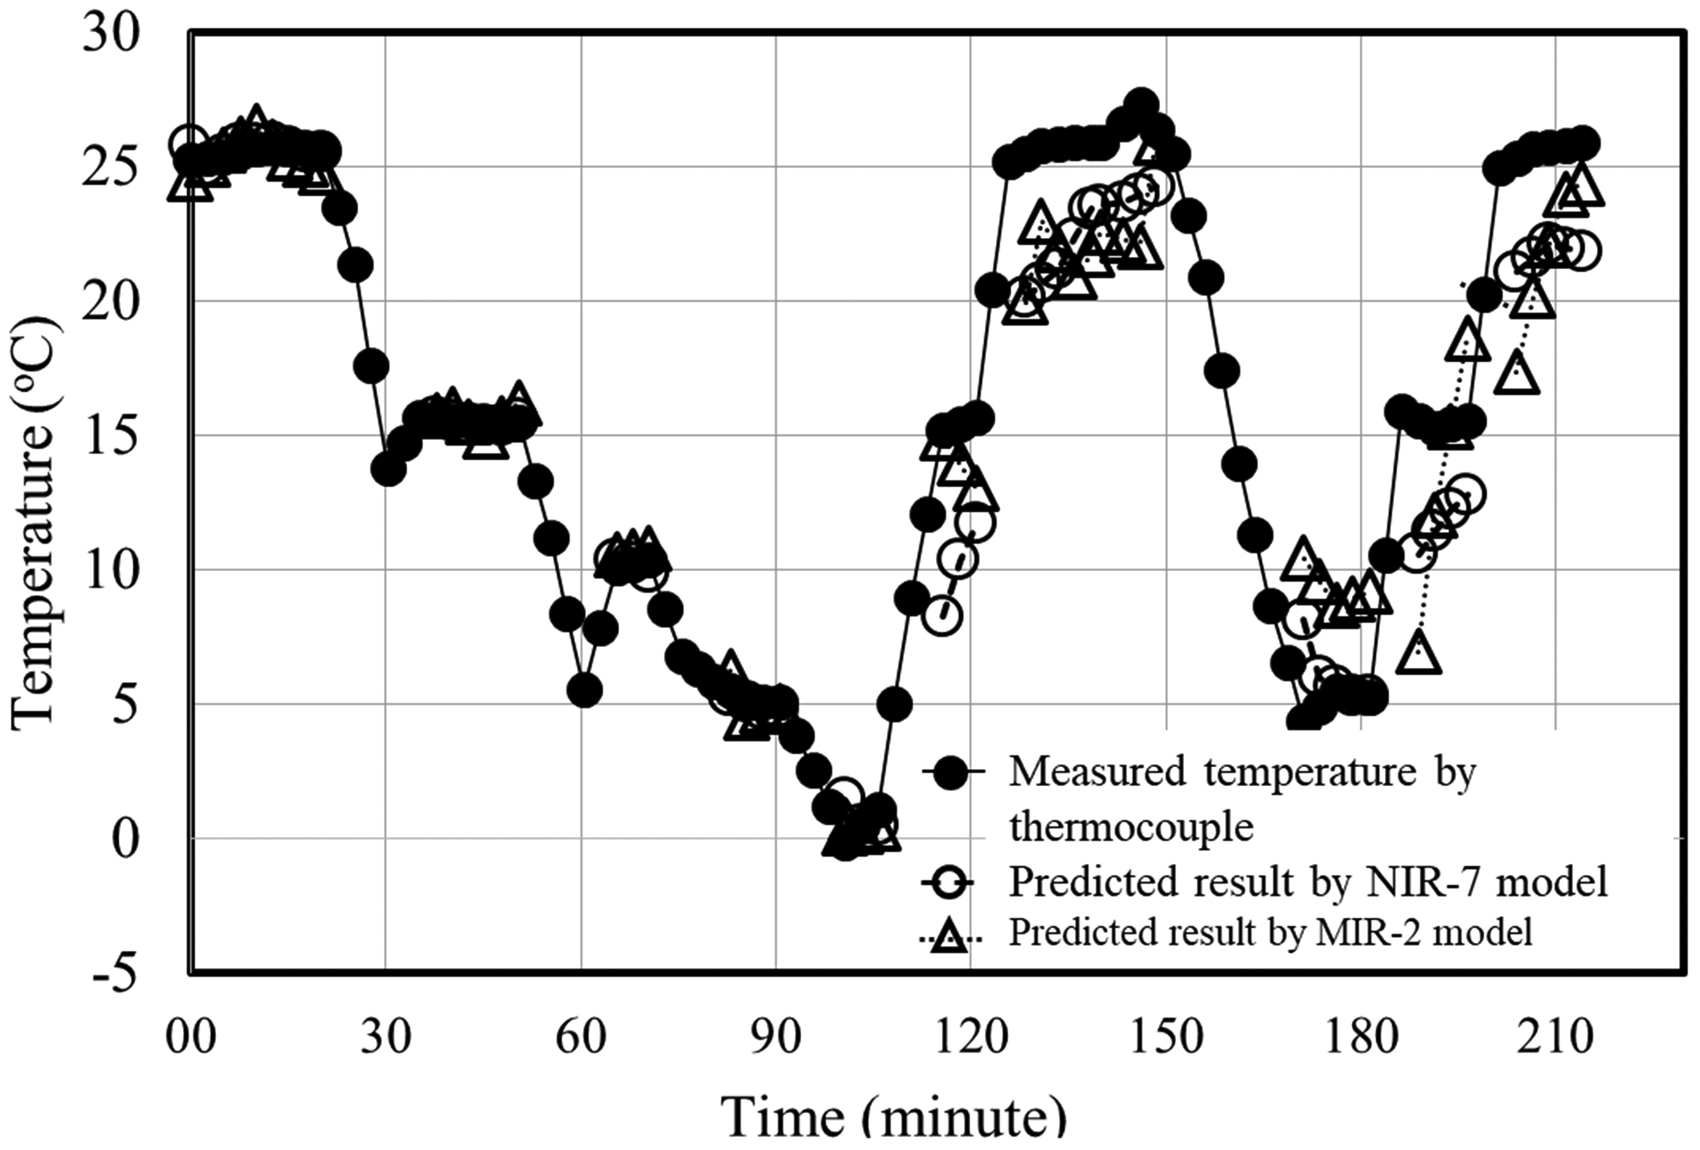
Difference Spectra Analysis of Sesame Oil in the Cooling Process
As finding small differences among the spectra at different temperatures is extremely difficult, difference spectra analyses were applied. Figure 4 depicts the difference spectra of sesame oil calculated at four different temperatures (15.6, 10.3, 5.3, and 0.7 °C; the average temperature at each step) using the spectra measured during the first cooling process from room temperature to around 1 °C.
Difference spectra at different temperatures, with respect to the average spectrum measured at 25.6 °C. (Three difference spectra at 15.6 °C, 10.3 °C, and 5.3 °C are shifted the baseline to distinguish.)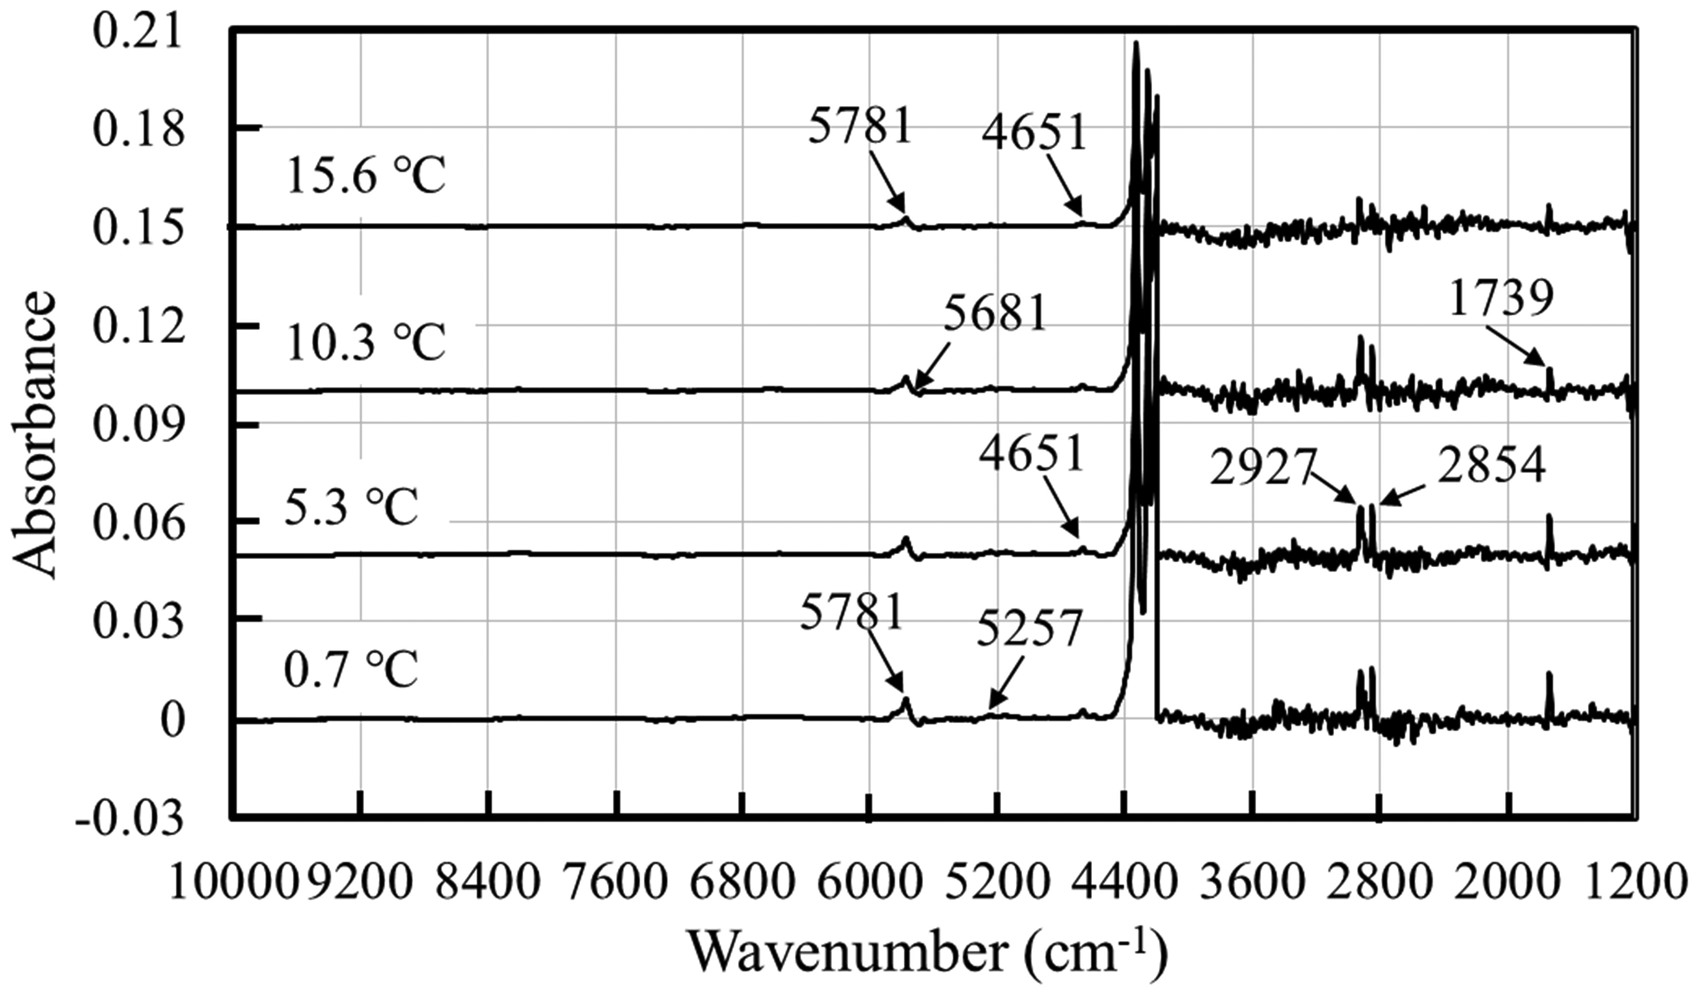
The reference spectrum used for calculating the difference spectra was the average of the five spectra measured at 25.6 °C. Average spectra at different four temperature were derived from three spectra measured at same temperature.
It can be seen from the Fig. 4 that the NIR peaks at 5781 cm−1 (νCH2) and 4651 cm−1 (νHC=CH), and the peaks at 2854 cm−1 (ν1CH2), 2927 cm−1 (ν3CH2), and 1736 cm−1 (νC=O) in the MIR region increased, as the temperature of the sesame oil decreased. Generally, the density of the fatty oil increases as the temperature decreases. From that reason, it is conceivable that the peaks in the spectrum of sesame oil increases as temperature decreases, if there is no degeneration of sesame oil by decreasing temperature.
Specifically, a mini peak was observed at 5681 cm–1 (CH2) in the difference spectra of Fig. 4. It can be observed that the temperature coefficient of absorbance at 5681 cm–1 in sesame oil is different from the temperature coefficient of other CH2 peaks shown at 5781, 2854, and 2927 cm–1.
Calibration Model for the Temperature of Sesame Oil Using PLS Regression
The calibration models for the prediction of sesame oil temperature were developed by PLS to investigate the relationship between temperature and the sample spectra.
The models were developed from the spectra measured during the first cooling process. The calibration models (Table S1, Supplemental Material) were separately developed for the NIR and MIR regions. Figure 5 indicates the result of the calibration models NIR-7 and MIR-2. The predicted results (root mean square error of predictions (RMSEPs)) obtained from spectra measured warming and cooling processes after first cooling process seems too large comparing with root mean square error of calibrations (RMSECs) and root mean square error of cross-validations (RMSECVs) of calibration models.
The result of the calibration model NIR-7 and MIR-2. NIR-7: RMSEC: 0.43, RMSECV: 0.64, RMSEP: 3.72, Factor: 3, wavenumber region: 7637–4540 cm–1 pretreatment: Baseline correction, first derivative, and mean centering MIR-2: RMSEC: 0.33, RMSECV: 0.86, RMSEP: 4.96, Factor: 4, wavenumber region: 2885–2738, 1955–1666 cm–1 pretreatment: baseline correction, first derivative, and mean centering.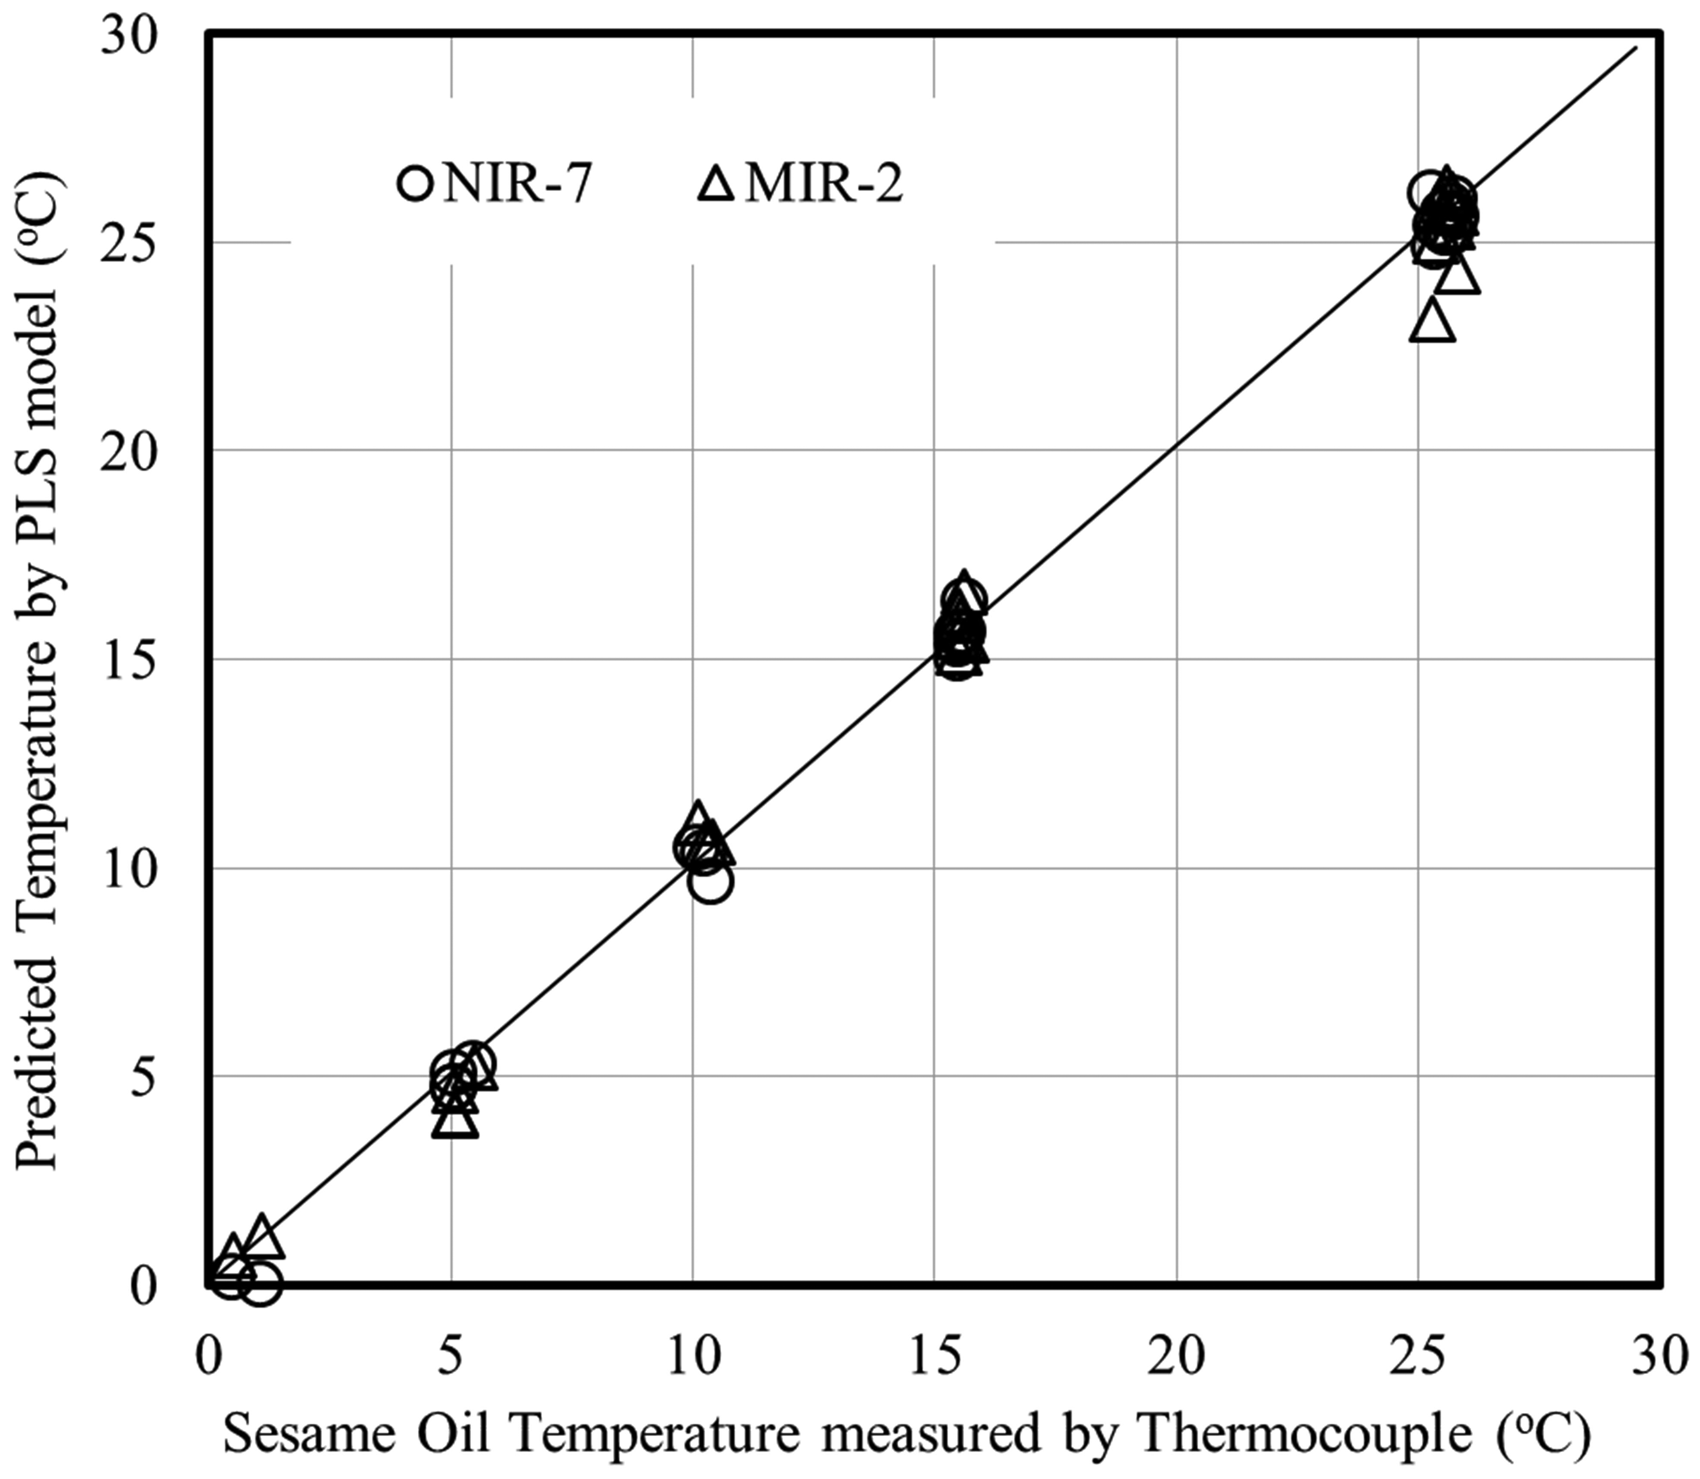
Figure 6 shows a comparison of the temperature measurement by thermocouple with the predicted temperature using calibration models NIR-7 and MIR-2. In Fig. 6, it can be seen that there is some hysteresis between the first cooling down process and other warming and cooling processes. The difference of the predicted values from between NIR-7 and MIR-2 models in Fig. 6 seems to show that there is different time for sample substitution between NIR probe and MIR–ATR probe.
To confirm the hysteresis of the cooling and warming process, score plots using all cooling–warming process data were investigated. The score plots of NIR7 models are shown in Figure S2 in the online Supplemental Material. The score plots of the NIR region, especially the factor 1, imply that there may be some hysteresis between the first cooling process and the after-warming and subsequent cooling processes. However, it looks like the intermediate condition of the cooling and warming process is unclear from the score plot. Though the score plot of MIR-2 is not shown in this paper, the score plot of MIR denoted similar result with NIR score plot.
Two-Dimensional Difference Spectra Analysis of NIR–MIR Spectra of Sesame Oil Collected During Cooling and Warming Process from Room Temperature to Near 1 °C
As described above, the difference spectra and score plot derived from PLS model are useful to investigate temperature-dependent variations in spectra. However, the result of the score plot is not enough to obtain the better understanding on the relation between the transformation of sesame and temperature change. 2D-COS is the representative method for the analysis on the relation between NIR and MIR using temperature change of sample as the perturbation.
Though 2D-COS is an excellent method, it seems like that there are some limitations to apply to the cooling and warming process as shown in Fig. 6. 2D-DS was devised as a tool for analyzing the spectra measured during the cooling down and warming up process.
The 2D-DS is a simple method obtained from the multiplication of difference NIR and MIR spectra, and 2D-DS was calculated using Eq. 1. The denominator of 2D-DS denotes the average of the multiplication by the absorbance of MIR and NIR spectra. Though 2D-DS cannot indicate the order of the chemical change such as asynchronous 2D-COS, it is possible to show the change of the intensity as the multiplication of the absorbance at each wavenumber in NIR and MIR difference spectra. Moreover, 2D-DS is suitable to make real-time monitor, because the 2D-DS does not need convolution calculation and special condition such as evenly spaced data requested by 2D-COS. The program for 2D-DS was developed by us using GNU Octave v.5.1.
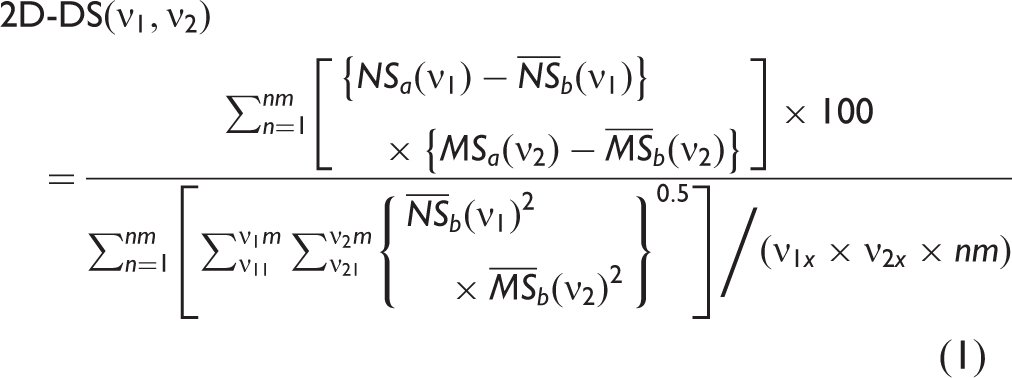
The difference spectra at four different temperature steps (Fig. 6) were calculated from six spectra at near 15.6 ℃, three spectra at near 10.3 ℃, five spectra at near 5.2 ℃, three spectra at near 0.5 ℃, three spectra at near 15.5 ℃, nine spectra at near 26.1 ℃, five spectra at near 5.1 ℃, four spectra at near 15.5 ℃, and five spectra at near 25.5 ℃. The reference spectrum for calculating difference spectra was an average spectrum calculated from the first nine spectra measured at near 25.6 ℃. NIR (7637–4540 cm–1) and MIR (3600–1400 cm–1) wavenumber regions were selected for the calculation of the Eq. 1, as including representative peaks of sesame oil spectrum.
Figure 7 shows a three-dimensional image of 2D-DS at 15.6 and 0.5 ℃ during the first cooling process based on the calculation from Eq. 1. It is evident that the peak height increases as the temperature decreases. The value of 2D-DS calculated from Eq. 1 denotes the rate (%) to the sum of product at each wavenumber absorbance value in the NIR and MIR reference spectra; therefore, it can use the changes in the peak height of 2D-DS as the traceable index for the changes in the NIR and MIR spectra. Table II indicates the changes in the representative peaks obtained from 2D-DS. The results of 2D-DS show the polarity of the temperature coefficient during absorbance. If the temperature coefficients of the NIR and MIR spectra are equally positive or negative, the values of 2D-DS become positive. Additionally, when the polarity of the temperature coefficients is different between the NIR and MIR spectra, the results of 2D-DS are negative.
3D image of 2D-DS calculating from Eq. 1, at the first cooling process. (a) 15.6 ℃, (b) 0.5 ℃. The change of the peak value in 2D-DS by the temperature change of sesame oil.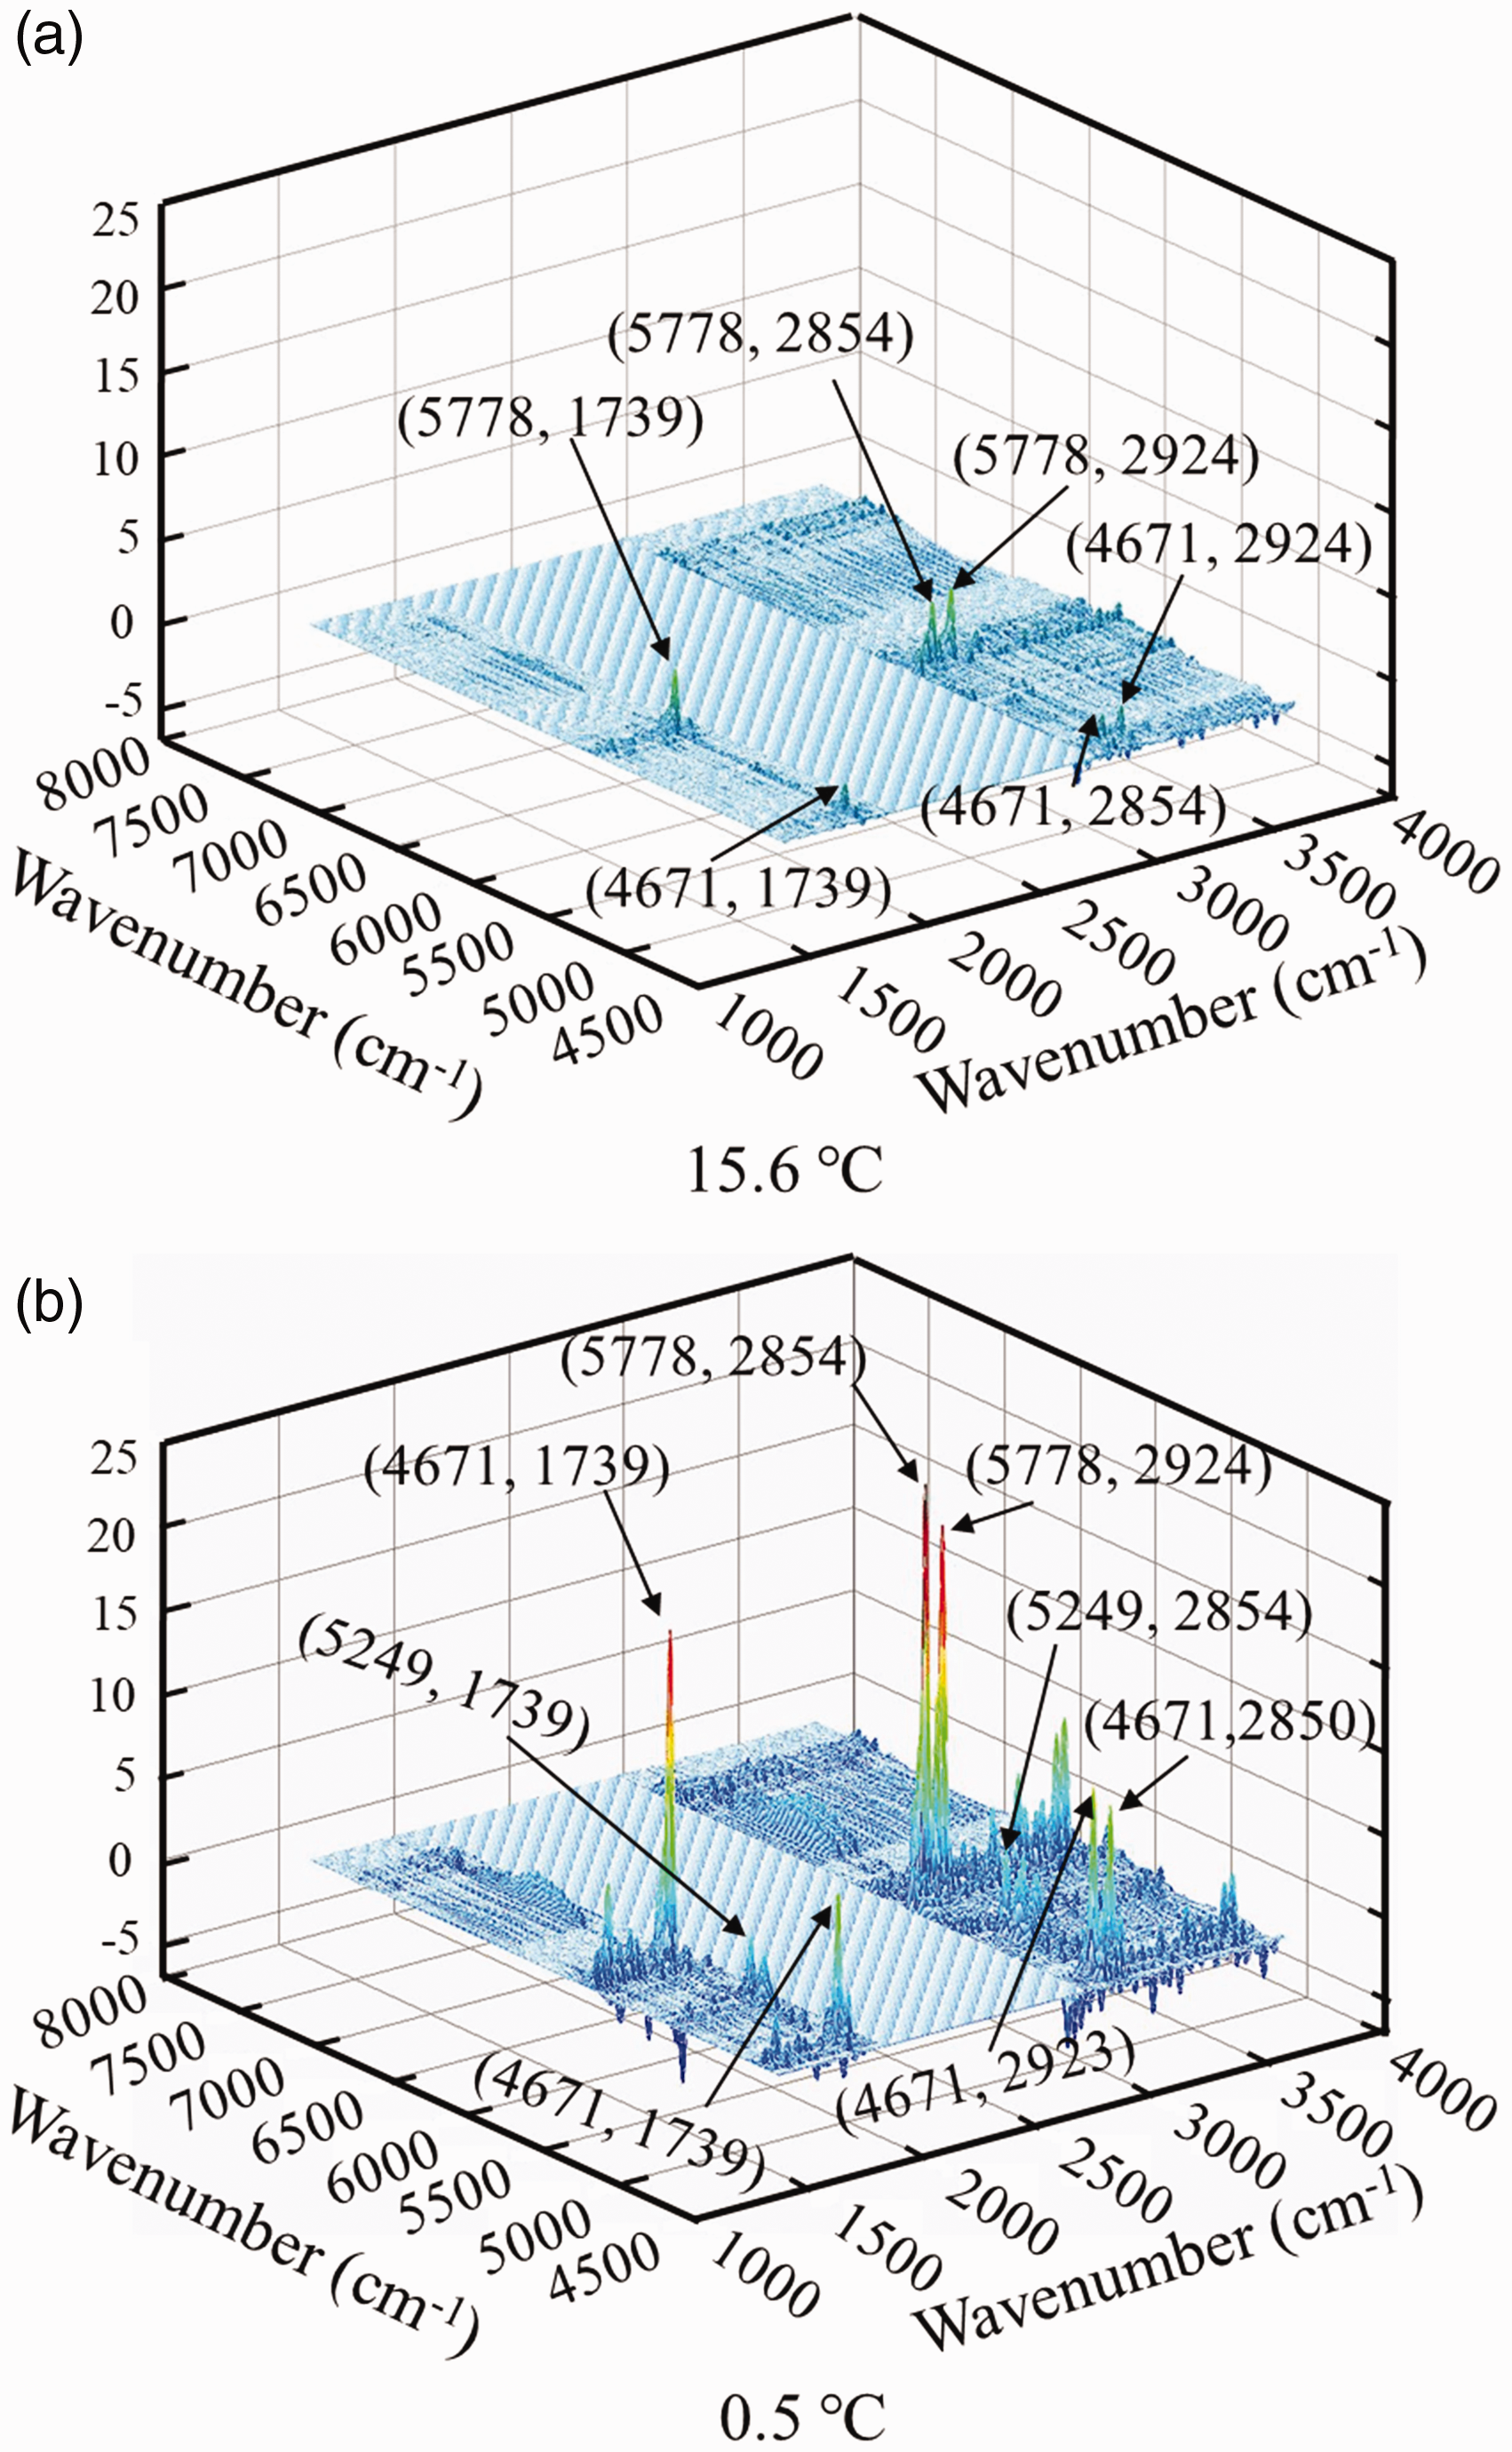
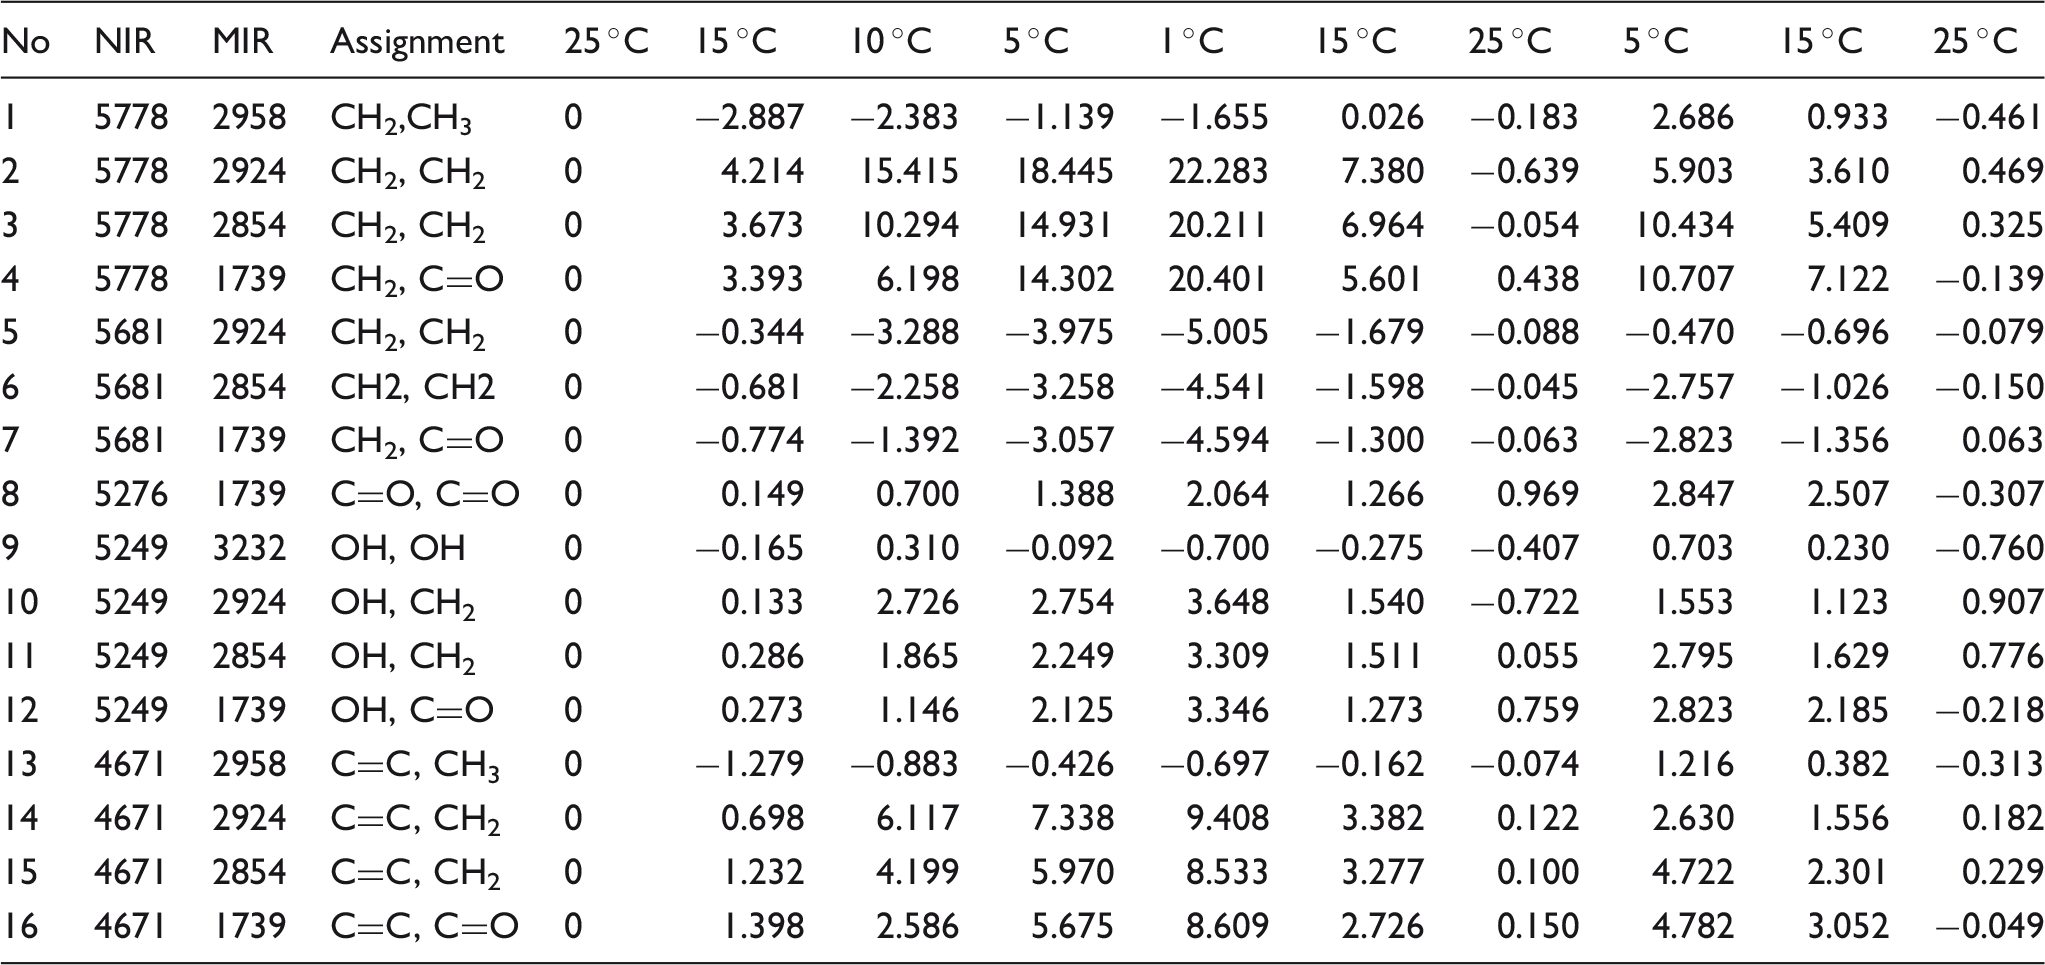
Figure S3 depicts the changes in the representative peaks taken from the first four cooling steps from Table II. The results in Figure S3 denote that the 2D-DS peaks of CH2, CH2 (5778 cm–1, 2924 cm–1) are positive, but those of CH2, CH2 (5681 cm–1, 2924 cm–1) are negative. The results of CH2, CH2 (5681 cm–1, 2924 cm–1) imply that the peak at 5681 cm–1 in the NIR region of sesame oil is not the first overtone of the CH2 stretch at 2924 or 2854 cm–1. Moreover, the 2D-DS peaks, CH2, CH2 (5778 cm–1, 2924 cm–1) and CH2, CH2 (5778 cm–1, 2854 cm–1), are responsible for significantly nonlinear changes from 15 to 10 ℃. In contrast, the 2D-DS peaks, CH2, C=O (5778 cm–1, 1739 cm–1), C=O, C=O (5276 cm–1, 1739 cm–1), and C=C, C=O (4671 cm–1, 1739 cm–1), are responsible for commencing a large change from 10 ℃. These results suggest the presence of some order on the transformation of sesame oil by cooling. The changes in the 2D-DS peak CH2, CH3 at 5778 cm–1, 2958 cm–1 are not reliable because the peak at 2958 cm–1, associated with CH3, lies on the shoulder of the large peak assigned to CH2 at 2924 cm–1. Accordingly, the 2D-DS peak at 5778 cm–1, 2958 cm–1 becomes unstable owing to the changes in CH2, CH2 at the 5778 cm–1, 2958 cm–1 peak.
Figure 8 illustrates the changes in the seven representative peaks of 2D-DS during the temperature change depicted in Fig. 6. If the transformation of sesame oil by winterization only includes a density change due to a change in the temperature, there should be no changes in the peak of 2D-DS between the first and second cooling. However, a relatively large change can be observed at the first cooling and warming process with hysteresis; furthermore, the change and hysterics decrease after the second cooling and warming. From Fig. 8, the difference in the 5 ℃ peaks CH2, CH2 (5778 cm–1, 2924 cm–1) between the first and second cooling is larger than that in the 5 ℃ peaks C=O, C=O (5276 cm–1, 1739 cm–1) between the first and second cooling. In contrast, the results obtained from Fig. 8 and Table II demonstrate that the changes in C=C by the cooling process are similar to those in CH2. The above results show that the positive temperature coefficient of the peak attributed to C=C by winterization is larger than the negative coefficient of the C=C peak that is dependent on the transformation caused by winterization. Subsequently, the temperature coefficient of C=C approaches the coefficient of CH2. Thus, it can be estimated that the main transformation of sesame oil by winterization occurs in the CH2 group.
The change of the representative seven peaks in 2D-DS during temperature cooling and warming process depicted in Fig. 6. (The first 25 ℃ values have added some values to distinguish each data.)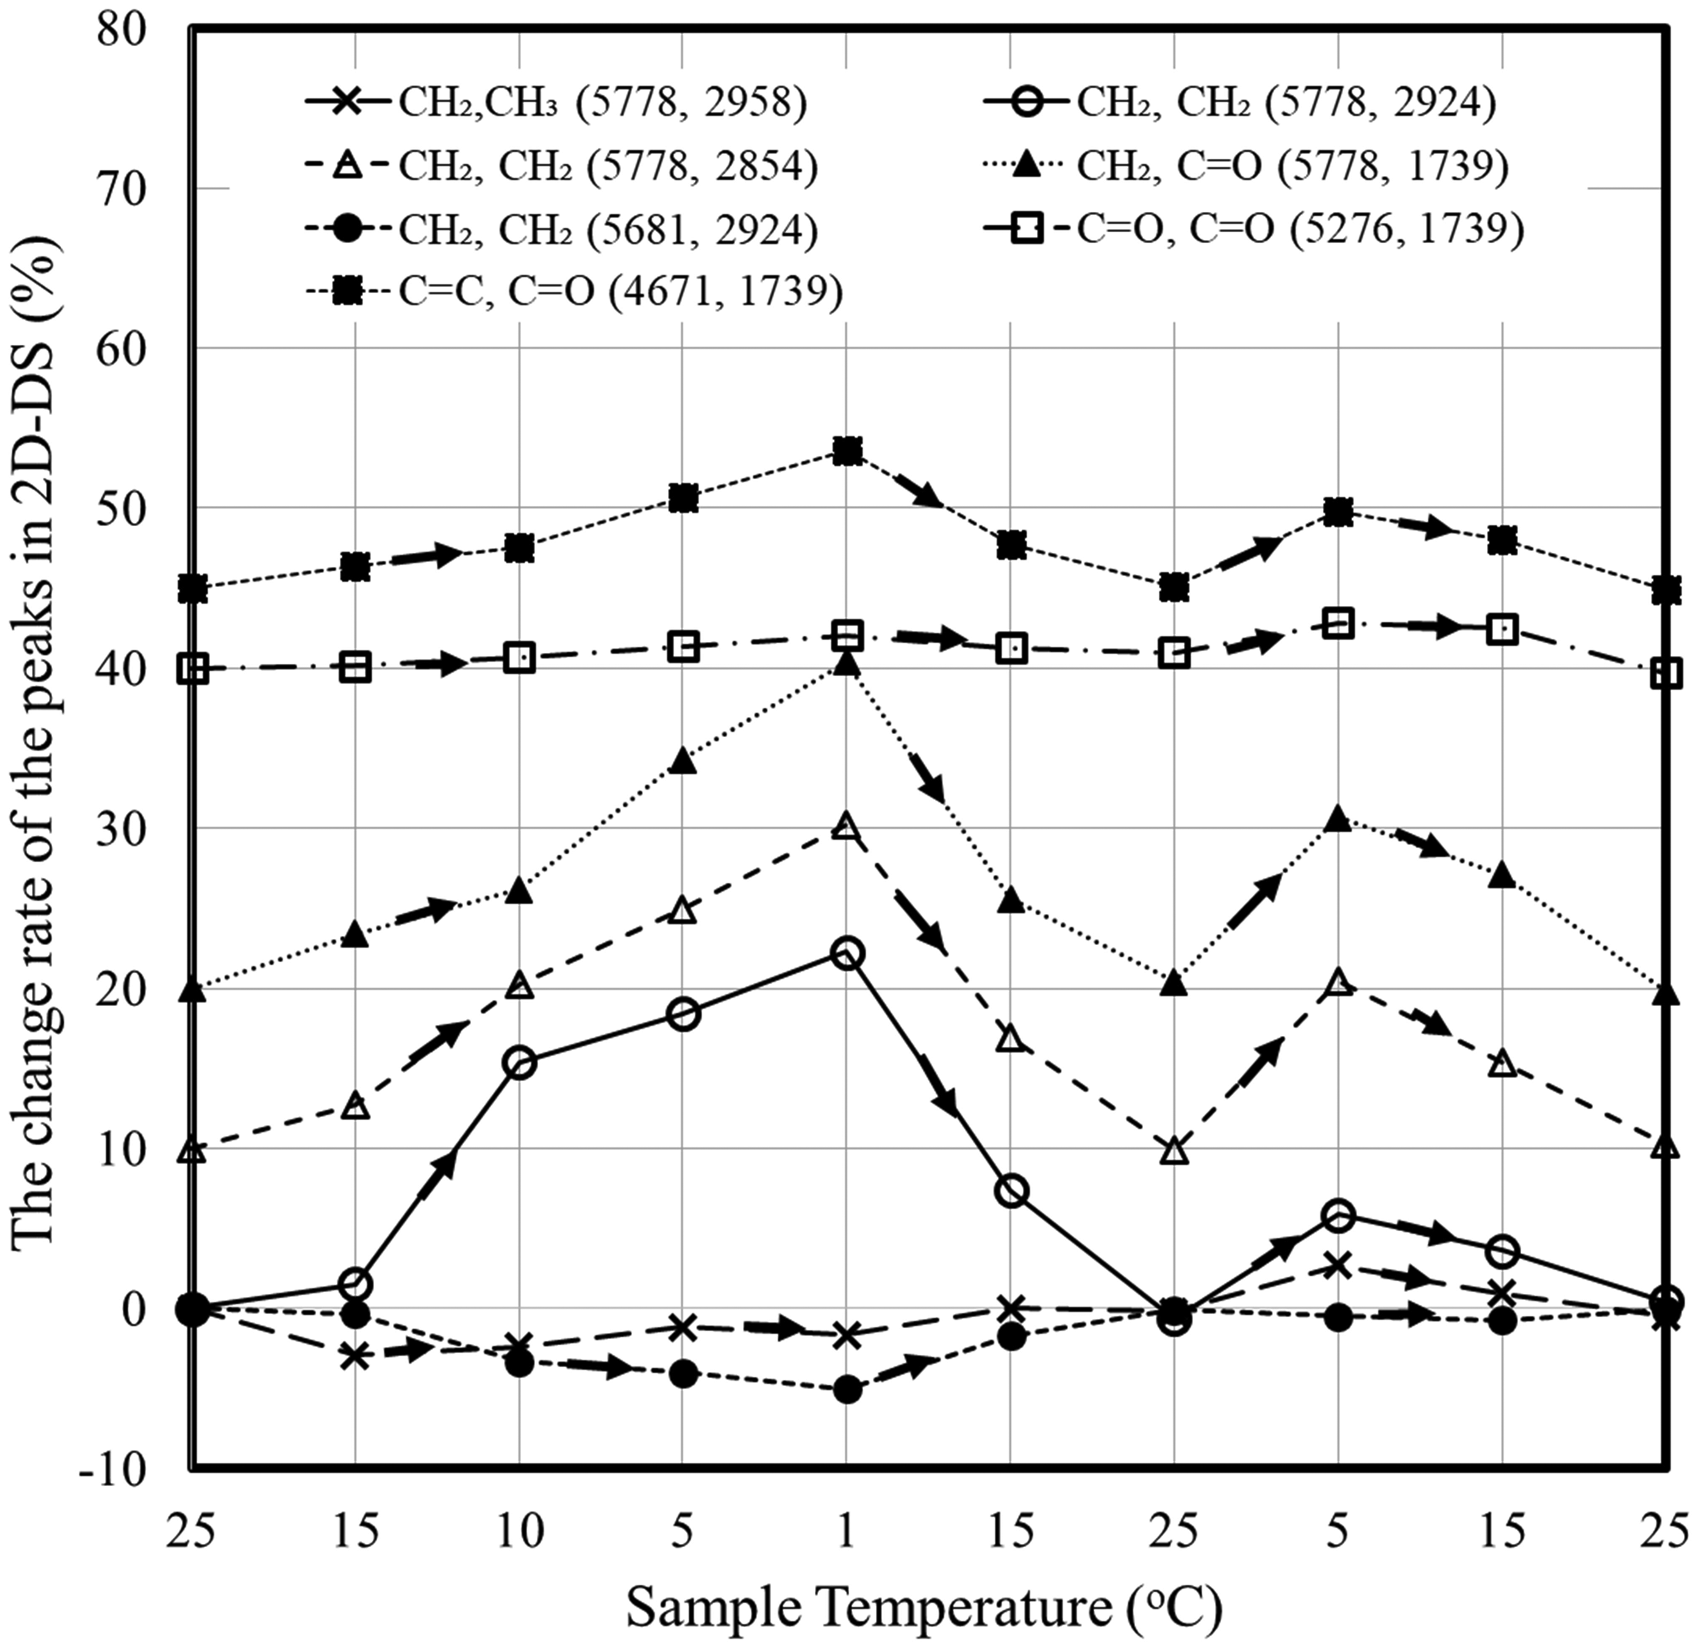
The results shown in Fig. 8 and Figure S3 reveal that winterization begins near 15 °C, and the maximum transformation occurs in the CH2 group of sesame oil during the first cooling process. The melting point of oleic acid, one of the main components of sesame oil, is approximately 15 °C, 40 hence, it can potentially affect sesame oil. The second step need not be monitored because winterization is subjected to the filtering process at low temperatures during the first cooling. However, the results observed from Fig. 8 suggest that one of the effects of the winterization on sesame oil is the stabilization of its conditions.
Conclusion
We have investigated the transformation of sesame oil by monitoring the winterization process using of NIR–MIR dual-wavelength spectrometer (NIR/MIR-DWS) and two-dimensional difference spectrum (2D-DS) method. The results of the investigation revealed as follows.
The difference NIR–MIR spectra of sesame oil before and after winterization elucidated that the winterization process removes the lignans in sesame oil along with the unsaturated fatty acids with a relatively short chain.
The maximum transformation of sesame oil by winterization occurs during the first cooling process. The transformation of sesame oil by winterization probably starts around 15 ℃ from the CH2 group. The results of the analysis using 2D-DS suggested that the winterization of sesame oil leads to the stabilization of its conditions. To the best of our knowledge, these results are the first report on the effect of the winterization process for the sesame oil as a pharmaceutical inactive drug ingredient. It has been demonstrated that the combined system with NIR–MIR-DWS and 2D-DS is very useful for the understanding of the real-time process monitoring and available at scaling up.
Supplemental Material
sj-pdf-1-asp-10.1177_0003702820969192 - Supplemental material for Use of Near-Infrared–Mid-Infrared Dual-Wavelength Spectrometry to Obtain Two-Dimensional Difference Spectra of Sesame Oil as Inactive Drug Ingredient
Supplemental material, sj-pdf-1-asp-10.1177_0003702820969192 for Use of Near-Infrared–Mid-Infrared Dual-Wavelength Spectrometry to Obtain Two-Dimensional Difference Spectra of Sesame Oil as Inactive Drug Ingredient by Masahiro Watari, Akifumi Nagamoto, Takuma Genkawa and Shigeaki Morita in Applied Spectroscopy
Supplemental Material
sj-zip-2-asp-10.1177_0003702820969192 - Supplemental material for Use of Near-Infrared–Mid-Infrared Dual-Wavelength Spectrometry to Obtain Two-Dimensional Difference Spectra of Sesame Oil as Inactive Drug Ingredient
Supplemental material, sj-zip-2-asp-10.1177_0003702820969192 for Use of Near-Infrared–Mid-Infrared Dual-Wavelength Spectrometry to Obtain Two-Dimensional Difference Spectra of Sesame Oil as Inactive Drug Ingredient by Masahiro Watari, Akifumi Nagamoto, Takuma Genkawa and Shigeaki Morita in Applied Spectroscopy
Supplemental Material
sj-pdf-3-asp-10.1177_0003702820969192 - Supplemental material for Use of Near-Infrared–Mid-Infrared Dual-Wavelength Spectrometry to Obtain Two-Dimensional Difference Spectra of Sesame Oil as Inactive Drug Ingredient
Supplemental material, sj-pdf-3-asp-10.1177_0003702820969192 for Use of Near-Infrared–Mid-Infrared Dual-Wavelength Spectrometry to Obtain Two-Dimensional Difference Spectra of Sesame Oil as Inactive Drug Ingredient by Masahiro Watari, Akifumi Nagamoto, Takuma Genkawa and Shigeaki Morita in Applied Spectroscopy
Footnotes
Acknowledgments
The authors would like to thank Yokogawa Electric Corp. and S. T. Japan Inc., which gave permission for submission of the manuscript. The authors also express thanks to Mr. Higashiyama of S. T. Japan for strong support at various opportunities in this study.
Declaration of Conflicting Interests
The author(s) declared no potential conflicts of interest with respect to the research, authorship, and/or publication of this article.
Funding
This study was supported by the Innovation Promotion Program (2009) from the New Energy and Industrial Technology Development Organization (NEDO), Japan.
Supplemental Material
All supplemental material mentioned in the text, consisting of three figures and one table, is available in the online version of the journal.
References
Supplementary Material
Please find the following supplemental material available below.
For Open Access articles published under a Creative Commons License, all supplemental material carries the same license as the article it is associated with.
For non-Open Access articles published, all supplemental material carries a non-exclusive license, and permission requests for re-use of supplemental material or any part of supplemental material shall be sent directly to the copyright owner as specified in the copyright notice associated with the article.