
Abstract
This study proposed a methodology to evaluate the potential of midinfrared (MIR) spectroscopy as a process analytical technology (PAT) tool for in situ (in-line) monitoring of cell culture media constituents, paving the way for on-line bioprocess monitoring and control of mammalian cell cultures. The methodology included a limit of detection (LOD) analysis and external influence investigation in addition to the calibration model development. The LOD analysis in the initial step provided a detailed procedure by which to evaluate the monitoring potential of the instrument of choice, for the application in question. The external influence study highlighted the potential difficulties when applying this technique to a typical mammalian cell culture. A comparative investigation between a fixed conduit immersion probe and flexible fiber-optic immersion probe was also carried out. Limitations associated with the use of MIR spectroscopy in the cell culture environment were also examined. A preliminary investigation, on components typically found in mammalian cell cultures, involving spectral characterization and limit of detection analysis was completed. It was evident at this initial stage that glutamine, could not be accurately detected at levels typically found in a mammalian cell culture medium. Results for glucose and ammonia, however, proved promising. A seven-concentration-level experimental design was used, and partial least squares regression employed, to develop calibration models. Optimized model results echoed the results of the preliminary analysis with the percentage error of prediction for glucose as low as 6.03% with the fixed conduit probe and glutamine having a higher error of 63.06% for the same probe. Comparison of the model results obtained from both probes supported the fixed conduit as the more accurate of the two probes for this experimental setup. The effect of external influences on the MIR spectra and hence the concentrations predicted by the model were also examined. These were subjected to statistical analysis to determine the significance of the effect. This study demonstrates that MIR spectroscopy as a PAT tool has limited potential for mammalian cell culture monitoring due to low concentrations of analytes present and outlines a method to allow the system to be evaluated.
Keywords
INTRODUCTION
With increasing pressure from regulatory authorities on industry to develop processes embracing “Quality by Design” initiatives, there is a growing demand to establish reliable tools and systems capable of meeting this need.1,2 With regard to monitoring and control of bioprocesses, this need translates to a search for robust instrumentation capable of monitoring the key process analytes and metabolites in real time. Such information could potentially be used in the development of process control tools and hence would meet the fundamental principles of “Quality by Design” and “Design Space”. 3 Achieving on-line or real-time measurement and control allows for instantaneous analysis of the results and correction of offsets before the process moves outside of its design space. 4 In a typical bioprocess a quantitative and qualitative analysis of all the major analytes in real time will provide vital information on the process and facilitate the identification of key parameters capable of improving process outputs, e.g., biomass, product secreted, etc. 5 The first step in developing such a system lies in the identification of a reliable monitoring technique, which could further be used as an integral part of an advanced control system.
Infrared spectroscopy has the ability to monitor several of the analytes present in the culture media at any one time and as such is potentially a powerful tool in bioprocess monitoring.5–7 Such techniques can be used in situ (in-line), making them noninvasive and eliminating the need for sample removal, thereby reducing the risk of culture contamination due to possible compromised sterility. 8 Sample preparation is not required and spectral information is obtained instantaneously. These features make infrared techniques suitable for inclusion in control systems developed to function within a process analytical technology (PAT) environment, an initiative proposed by the FDA in 2004 9 and further supported by the International Conference on Harmonisation 10 in 2006. The spectral data gleaned from such sensors must undergo some form of multivariate analysis in order to extract the desired information. 11 With respect to the monitoring of bioprocesses, both the chemometric and infrared techniques serve as a lock and key to releasing bioprocess data. Both near-infrared (NIR) and mid-infrared (MIR) spectroscopy have been used for bioprocess monitoring but with mammalian cell culturing, sterility is critical, so in situ probes are preferable. 12 In situ sampling is possible with both techniques and is well documented for NIR,12–17 but less so for MIR spectroscopy, when applied to mammalian cell culture media components.18,19
A preliminary step to developing a multi-analyte calibration model is to identify the instrument detection limits for each of the analytes under investigation. The limit of detection (LOD) is the lowest concentration of analyte in a sample that can be detected but not necessarily quantified under the experimental conditions of the method. 20 Determining the LOD for a multivariate calibration is significantly more complex than establishing that of a univariate model. To date, few studies have included this preliminary step in similar works despite its importance in an initial feasibility study.
A number of external influences are likely to be present throughout the course of a cell culture. The effect of these influences on the collected spectra and the media concentration values predicted by the model are of interest when considering the implementation of a calibration model in a monitoring or control application. The significance of the impact of the external influence can be examined using hypothesis testing. This can provide an insight into the effect of changing environmental factors on cell culture measurements using MIR. It also highlights when and where influences should be incorporated into the model, so as to ensure optimum results.
The aim of this work was to outline a method to examine the potential of MIR as a PAT tool to measure the varying media component concentrations of mammalian cell cultures in real time. This was achieved by developing a partial least squares (PLS) calibration model using synthetic samples, which ensure that the model remained generic and non-specific to any single bioprocess. The methodology also included a logical sequence of preliminary steps, including a detailed limit of detection analysis, prior to the application of MIR to a mammalian cell culture. In addition, two probe types were used to determine the effect, if any, on results when the sampling device was varied but the detector remained the same.
MATERIALS AND METHODS
The concentrated stock solutions described above were used to prepare a series of dilute solutions. These were then scanned in triplicate, with the K6 conduit probe and the collected spectra plotted and examined. This allowed for a preliminary investigation into the presence of outliers and also an investigation into the LOD based on a simple visual test. The point where the component peaks could not be clearly distinguished from the instrument noise was defined as the observed LOD. This is only possible for MIR spectroscopy as it is based on fundamental vibrations and the peaks can be directly related to a chemical bond; such a step could not be done for NIR spectroscopy.
As multivariate analysis techniques are usually necessary to fully exploit vibrational spectroscopy data, a method for determination of LOD for multivariate spectral data is needed. Unfortunately there is no generally accepted method for this but an approach used by many authors is to transform the multivariate data to univariate data by the use of chemometric techniques 21 such as PLS regression. 22 The method outlined by Ortiz et al.23,24 is used here. It allows for the assessment of the LOD of an analytical method by evaluating false positive and false negative probabilities after data has been transformed by PLS. The false positive probability follows a Student's t-distribution with (n – 2) degrees of freedom, where n is the number of samples, while the false negative probability has a non-central Student's t-distribution with (n – 2) degrees of freedom and a parameter of non-centrality, which needs to be established. Critical values for both types of Student's t-tests and the parameter of non-centrality were determined using the statistical toolbox in MATLAB (v7.9.0.529 (R2009b), The MathWorks Inc., Cambridge, UK). Development of PLS models was carried out using the PLS toolbox (V6.2 Eigenvector Research Inc, Wenatchee, WA, US) for MATLAB. In all cases the spectral data were mean centered and first- and second-derivative pretreatments using a segment size of 15 points were calculated using quadratic Savitzky–Golay 25 filters. Statistical analysis was applied to the regression between actual concentration values and those predicted by leave-one-out cross-validation.
The spectral data were exported from the iCIR software (Mettler Toledo AutoChem, Inc., Columbia, MD, US) and imported into MATLAB. Mean values of the triplicate scans were used for model development. Preprocessing in the form of mean-centering was initially applied to all spectra. A second-derivative pretreatment using a segment size of 15 points was also examined as second-derivative pretreatments can eliminate the effect of linear baseline spectral off-sets 27 that are likely to occur over the course of a culture. Partial least squares regression, optimized by leave-one-out cross-validation, was used to develop separate calibration models for each of the eight components.
The calibration model was validated in two ways. First, a four-level multivariate design was employed. This was similar to the seven-level design used for the creation of the model; however, only 16 samples of varying concentration were generated. Each of these 16 samples was scanned with both probes, as before. The spectral data resulting from these scans was then input into the model and the component concentrations in each of the 16 samples were predicted by the model. These predicted values were then compared to the actual values. Secondly the cell culture medium was spiked with known concentrations of different components and the model was used to predict the resulting increase in concentration. The results of all models were evaluated by the root mean square errors of calibration, cross-validation, and prediction (RMSEC, RMSECV, and RMSEP) as well as the LOD for a multicomponent mixture.
External influence investigation summary.
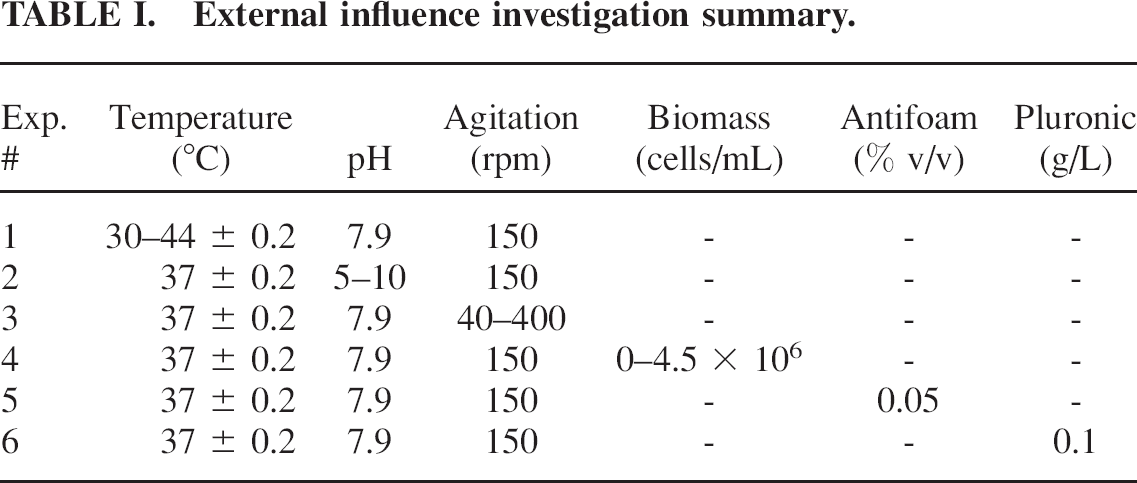
Partial least squares regression was the multivariate technique employed to assess the effect of an influence when the influence was varied (temperature, pH, agitation, and biomass), and PLS-DA (partial least squares discriminant analysis) 28 was the multivariate method used for examination if an influence impacted the spectra when present (antifoam and pluronic). The data was subjected to two tests, a spectral test and a relevance test. The spectral test involved the data undergoing a multivariate transformation followed by hypothesis testing. The relevance test examined the effect (if any), on the predicted glucose concentration values. Pre-treatments in the form of mean centering followed by second derivative using the Savitzky–Golay method were applied to all spectra prior to modeling, and in all cases, cross-validation was used to optimize the models.
A PLS model was constructed to determine whether there was a relationship between the spectra and the external influence variables, temperature, pH, agitation, and biomass. Plots of predicted magnitude of influence applied versus actual values for each of the tests yielded the coefficient of determination (r 2 ) and hence the correlation coefficient (r) was calculated. Based on a Student's t-test, Pearson's correlation 29 was used to test the significance between the influence and the spectral measurement. The null hypothesis (H0) was that the influence had no effect on the spectra. Where t > tcritical at a significance level (α) of 0.05, H0 was rejected and this implied that the external influence under investigation had a significant effect on the spectra. Where t < tcritical at α = 0.05, H0 was accepted and this implied that the external influence under investigation did not have a significant effect on the spectra.
The same statistical test was employed when determining the relevance of the impact of each influence on the predicted glucose concentration values. In this case, the optimum PLS model for glucose, established in the calibration model development section, was used to predict the glucose concentration. A plot of magnitude of external influence versus predicted glucose concentration provided r 2 values for each of the external influences, and as before, a Student's t-test was used to establish whether the influence had a significant impact on the predicted glucose concentration values at α = 0.05.
Multivariate discriminant analysis was used for tests involving antifoam and pluronic as these were not varied. In both cases concentrations typically used in cell culture media were added. A PLS-DA model was used to transform the data with respect to the presence or lack of influence applied. A Student's t-test was used to interpret the results of the PLS-DA and determine the significance of the effect of both antifoam and pluronic on the spectra. In this case, H0 was that all samples were the same and the alternative hypothesis (Ha) was that samples with the influence applied were different. The same hypothesis test was also applied to the predicted glucose concentrations for the same sample set.
All experiments were carried out using both the AgX 9.5 mm × 2 m fiber silver halide probe (flexible) and the K6 conduit 16 mm probe (fixed).
RESULTS AND DISCUSSION
The spectra of concentrated solutions of each of the pure components were examined to determine the wavenumber ranges over which absorbance occurs. Concentrated stock solutions, within the water solubility limits of each of the components, were used as all absorbance features may not be clearly evident in dilute solutions. The wavenumber ranges established at this stage are shown in Table II. These were used when developing and applying the calibration model. This ensured that the predictions were based on the underlying chemical principle and not metabolism-induced correlations.19,30
Preliminary analysis results.
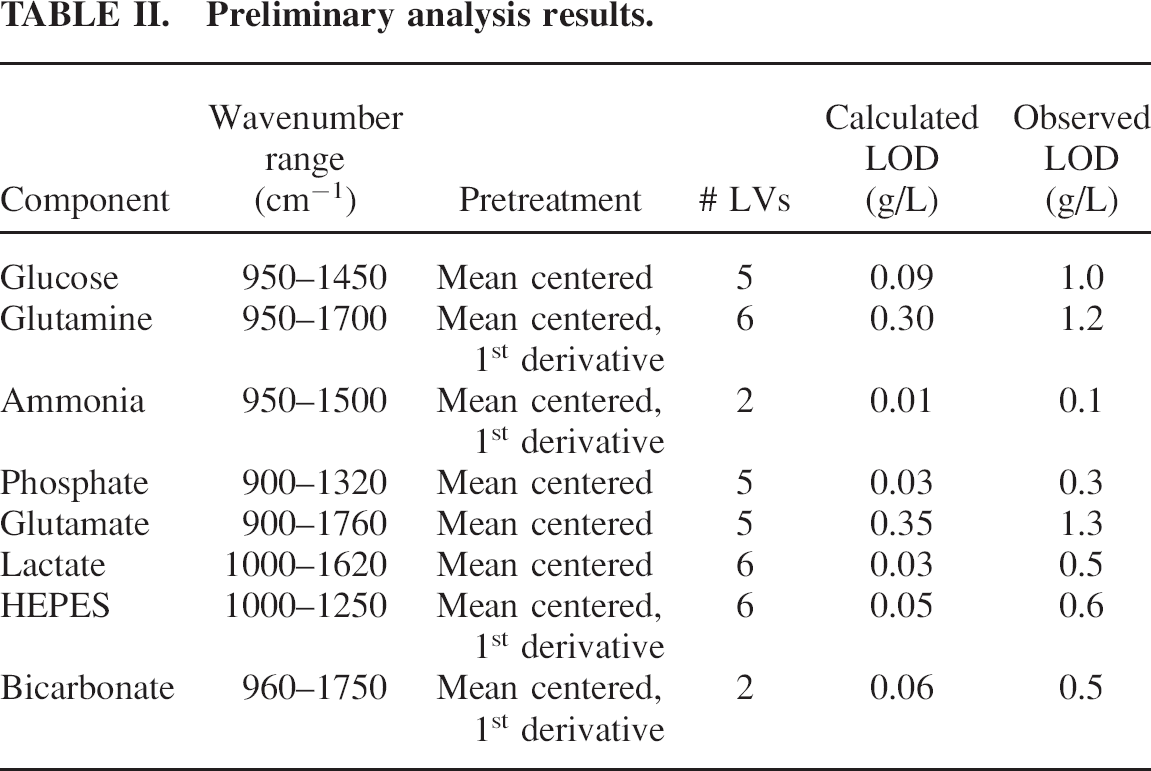
The observed LOD for all components can be found in Table II alongside the LOD determined using a PLS model which has been subjected to hypothesis testing ensuring false positive and false negative probabilities of 0.05. The PLS model details used in the calculation of these LODs have also been included in Table II. The observed and calculated LODs differ by an order of magnitude for all components with the exception of glutamine and glutamate, which differ by a factor of 4. This shows that a visual inspection is not sufficient to determine such a parameter and more information can be gleaned using a chemometric technique which is as expected for a multivariate data set. Glucose, ammonia, phosphate, lactate, HEPES, and bicarbonate could all be detected to levels of 0.09 g/L or lower. Glutamine and glutamate were not detected to as low a level as the other components. This is most likely due to the fact that the molecular bonds present in these components tend to have weak absorbances in the MIR region detectable with the instrument used in this study. 31 These LOD values are based on pure component solutions and are only applicable to single-component measurements. This is a simple feasibility study and it establishes at an early stage the ability of the MIR instrument to measure the components at the low levels found in mammalian cell cultures.
The results obtained using both probe types varied considerably and as the experimental design and detector were unchanged, a comparison between both probes was carried out in an attempt to establish possible causes for the differing results. The MIR range is generally considered to lie between 4000 and 400 cm−1. Both probes have a reduced effective range due to absorbance of the diamond ATR crystal over the range of 2250–1950 cm−1. In addition the fiber-optics of the flexible probe themselves absorb infrared radiation, further reducing the effective range of this probe to wavenumbers less than 1950 cm−1. While the K6 conduit fixed probe measured absorbance between 4000 and 2250 cm−1, spectra in this region were extremely noisy and therefore unusable. At lower wavenumbers and also close to the ATR absorbance region, the spectra exhibited a large degree of noise, meaning that the two probes under investigation had the same usable wavenumber range (1800–900 cm−1); therefore any discrepancies in results between the two probes cannot be attributed to differing wavenumber ranges.
The most significant difference between both probes is the geometry of the probe tip. The K6 conduit probe contains a recessed diamond crystal. The outer probe casing forms a gradual slope to the ATR crystal, thus allowing for shearing of bubbles, which may adhere to the crystal surface. The silver halide fiber-optic probe also contains a recessed diamond crystal; however, in this case the outer casing does not form a gradual slope, but rather the crystal is set at a 90° angle to the casing and hence a “pocket” at the probe tip allows for the entrapment of bubbles. Removing bubbles from the tip of this probe proves more difficult as the shear forces at the probe tip do not reach the bubble trapped inside. In addition, the high surface tension of water results in bubbles in aqueous solutions adhering to the probe tip, 21 making this application (to an aqueous-based cell culture media), more problematic than typical applications in reaction chemistry.
Calibration model results for all samples are shown in Table III. These models are based on calibration samples which contain varying amounts of all eight components of interest. In the majority of cases, the RMSEC values are lower for the K6 conduit probe than those for the silver halide fiber-optic probe. All the RMSEC values are less than 0.25 g/L, and in the case of ammonia, it was as low as 0.02 g/L. Different concentrations of each of the eight components were used, corresponding to typical values in cell culture media. In order to put the RMSEC in perspective, a percentage error of calibration (PEC) was calculated for each of the models by dividing the RMSEC by the average concentration used in the calibration. While the RMSEC for glutamate and glutamine appear quite low for both probes, they represent quite high percentage errors, indicating that problems are likely with the prediction ability of the glutamate and glutamine models. The percentage errors of cross-validation and prediction (PECV and PEP), calculated in a similar manner to the PEC, were greater than 60% for glutamate and glutamine, thereby indicating that the predicted concentrations of glutamate and glutamine are not reliable. This supports the results of the preliminary analysis wherein the LODs were higher than those of the other components and close to the maximum concentrations typically found in a cell culture environment. Based on this information, these component models were not further validated using the spiking test.
Calibration model results.

All other components had lower percentage errors than glutamine and glutamate, with glucose and ammonia showing the lowest percentage errors of approximately 15% or less regardless of probe type or validation set used (Table IV). A plot of predicted glucose concentration versus actual glucose concentration as measured with the K6 conduit probe can be seen in Fig. 1. This model had low percentage errors and it can be seen that all samples lie close to the 1:1 calibration line.
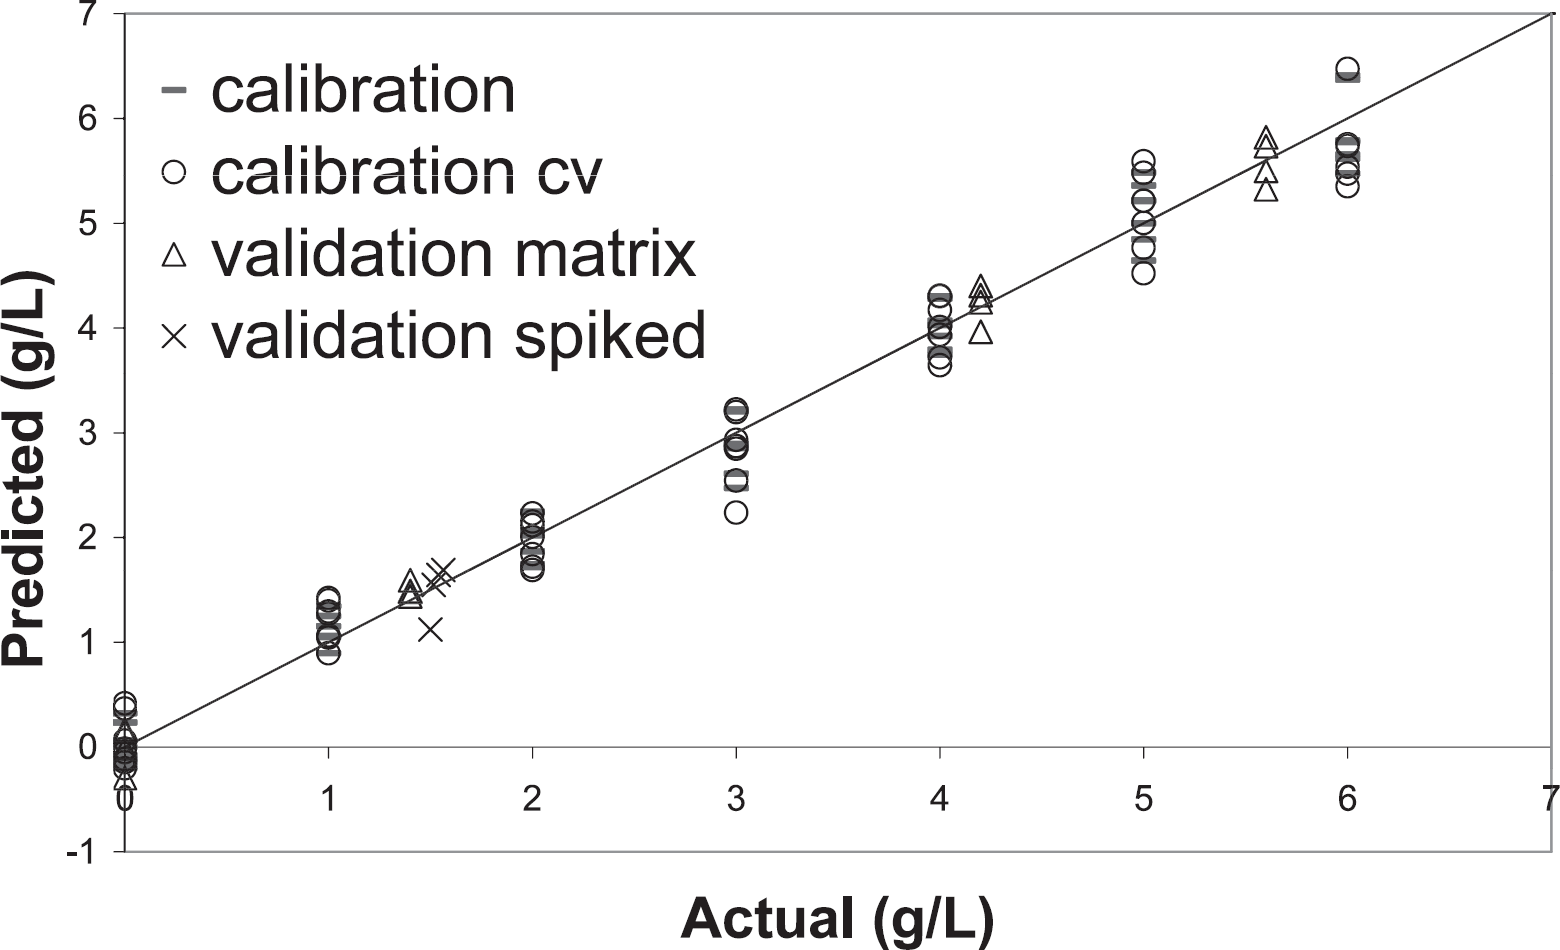
Plot of predicted versus actual glucose concentrations for calibration and validation data, as measured with K6 conduit probe.
Validation results.
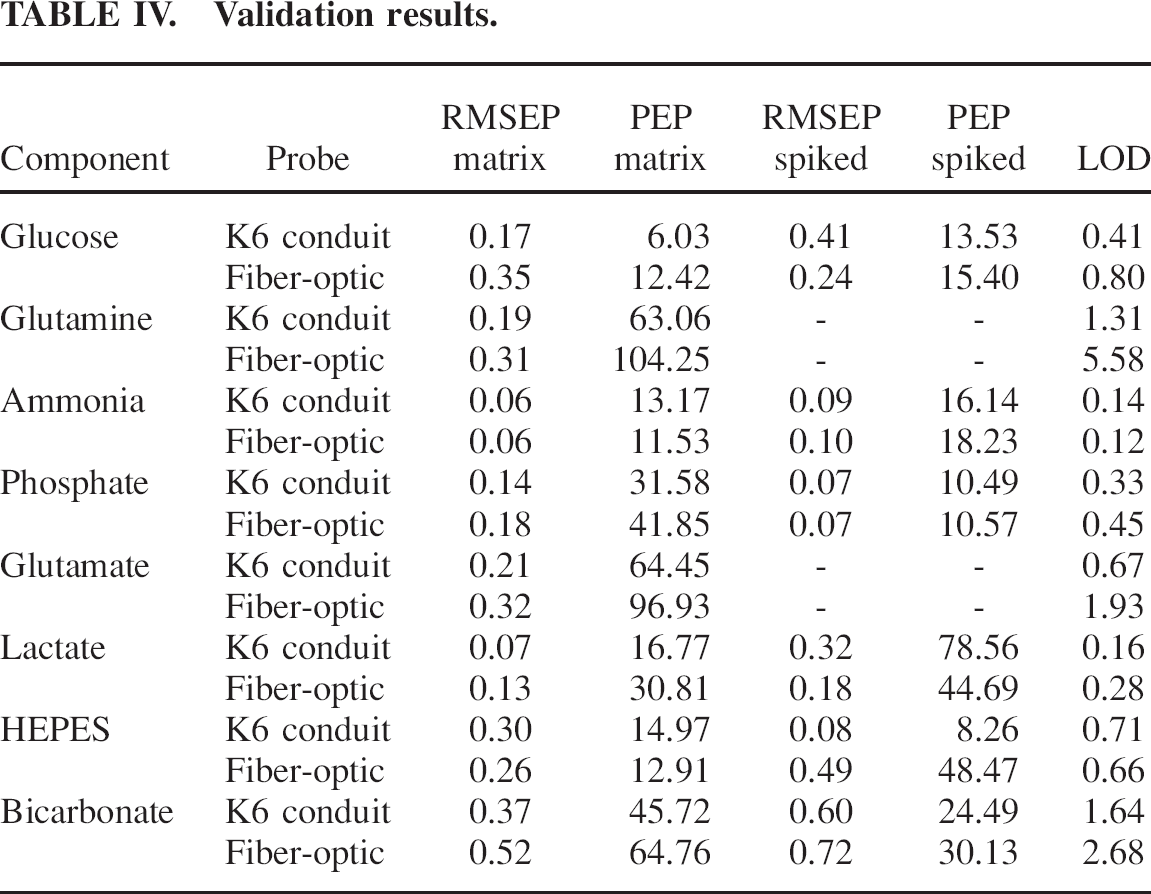
Table V provides a summary of literature examples of infrared spectroscopy instruments with different types of sampling being used to measure glucose concentration, with glucose being the most common metabolite measured in bioprocesses. For the sake of comparison with the results in this study, any values reported as mM were converted to g/L and reduced to two significant figures.
Infrared spectroscopy instruments being used to measure glucose in bioprocesses.
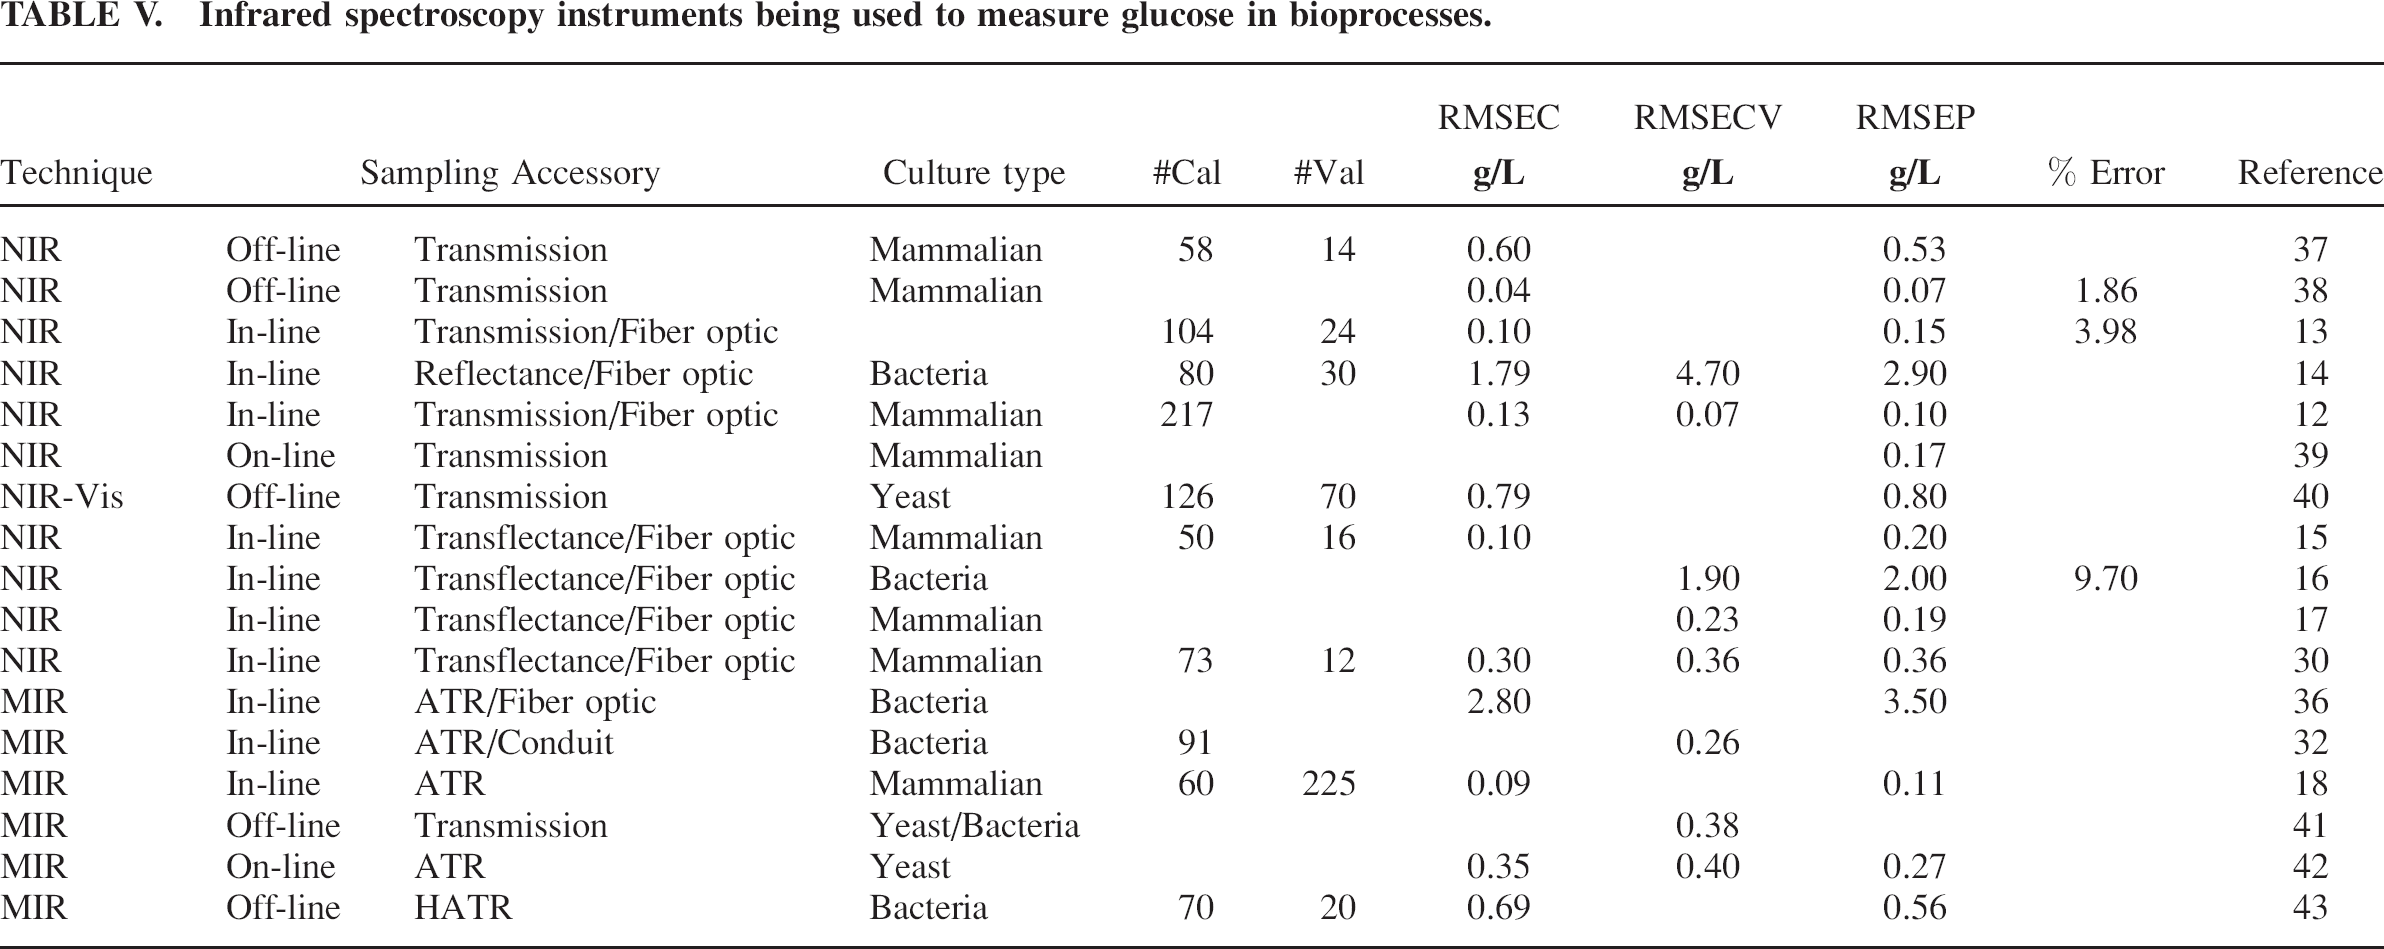
When results from this study are compared to those listed in Table V, it can be seen that the RMSEC values are of the same order of magnitude, but without a percentage error value it is not always appropriate to compare these. The most comparable study was that of Rhiel et al. 18 wherein an RMSEC value of 0.09 g/L was obtained. While this value is lower than that achieved in this study, models were developed with a larger number of calibration samples, which could improve the error values. As stated previously, an experimental design requiring a minimal number of samples (49) was used in this study. 26 When the model was applied to the validation matrix samples, phosphate, lactate, and bicarbonate all had lower errors when the K6 conduit probe was used. The errors for HEPES were lower for the fiber-optic probe but only by a small amount. Samples of media spiked with known amounts of a given component represent a slightly more difficult test for the model as these samples had unknown components present as the exact composition of the commercial medium used was not known. Spiked sample PEPs for glucose, ammonia, and lactate were all higher than for the validation matrix samples. The results for the other components did not give consistent results for the different validation sets. Of the nine studies with in situ probes in Table V, only three of these achieve a lower RMSEP than that reported in this study, but as stated above, a direct comparison is not always possible without details on the percentage error.
In a similar way to the calibration models of single components in the Preliminary Analysis section, the models made from multicomponent samples were subjected to the same hypothesis test to determine an LOD with a false positive and false negative probability of 0.05. Every component had a higher LOD value in a multicomponent mixture than that calculated using single-component samples. In almost all cases the value was an order of magnitude higher and for glutamine, glutamate, and bicarbonate, the LOD value was larger than the maximum concentration of each component that was used to make the calibration samples.
Hypothesis test results for external influences.
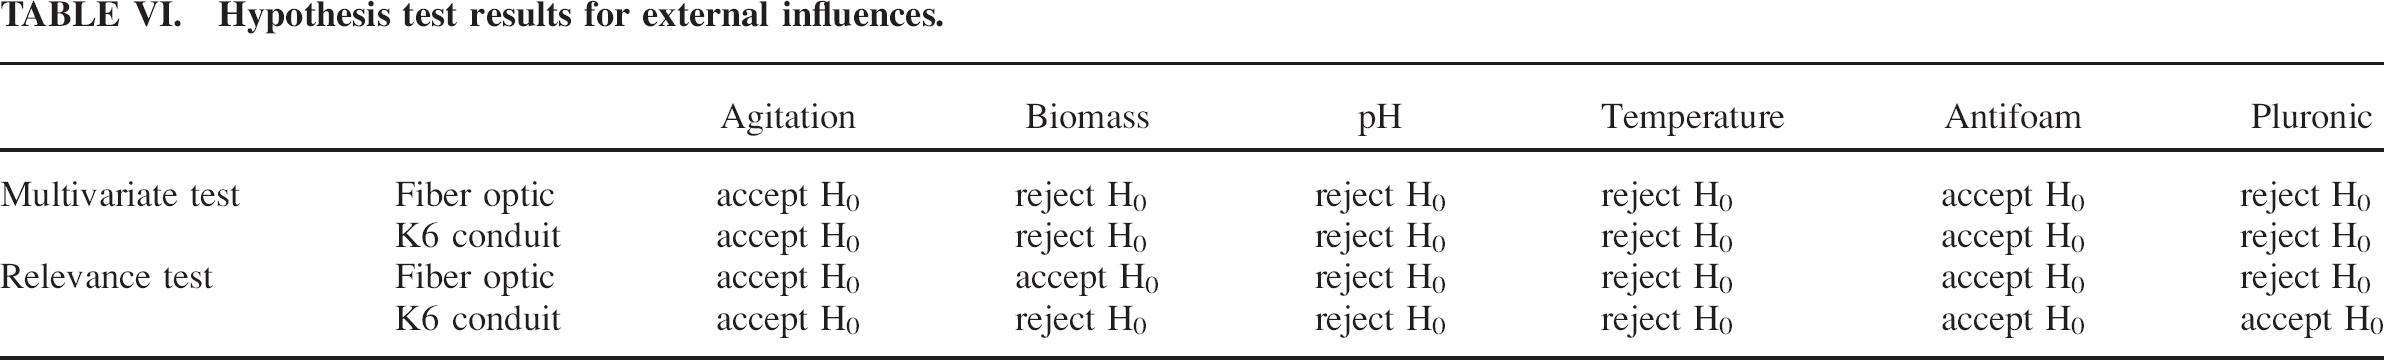
Based on the results of the statistical tests applied to variation in pH, as expected, H0 was rejected both for the spectral test and the relevance test, for both probes. Varying pH changes the chemical constitution of the media and based on the underlying principle of infrared spectroscopy, 44 it follows that the spectra will also change. The cell culture environment requires tight control of the pH; therefore, major shifts in pH, resulting in inaccurately predicted values, are unlikely to occur. However, for the development of a calibration model where the system is likely to experience pH changes, pH should be used as an additional factor in the experimental design.
Statistical analysis of biomass concentration indicates that the spectra and hence the predicted concentration values will change as the biomass concentration increases. By simulating the growth of a cell culture the sample media could possibly have been altered with the addition of small amounts of spent media in which the cells were suspended prior to addition. This potential change, which would not occur over the course of an actual cell culture, could have been confounded with the effect of the increasing biomass concentration. The relevance test indicated that this is not a significant result for the fiber-optic probe while for the K6 conduit probe it was calculated to be significant at α = 0.05. Previous studies have shown that biomass concentration can have an effect on NIR spectra due to light scatter and the fact that biomass absorbs in the NIR region.14,16 The ATR sample method for MIR instruments results in a short penetration depth of the MIR light source45,46 so scatter effects will not be present. 36
The effect of varying temperature was calculated to have a significant effect for both the spectral and relevance tests, for both probes. This is not unexpected as temperature impacts the bonds between the molecules, which is the underlying principle of vibrational spectroscopy including MIR. 47 As with pH, temperature is tightly controlled in mammalian cell cultures, so unless deliberate temperature shifts are necessary, this factor does not need to be accounted for in the model. If the same model was to be applied to a cell culture with identical parameters with the exception of temperature, it would need to be recalibrated accounting for the temperature change by including temperature as a factor in the experimental design.
Pluronic can sometimes be added to mammalian cell cultures and the effect of addition at typical concentrations appears to have a significant effect on a spectral level. This result was found using both probes. The relevance test indicated that it was not significant for the K6 conduit probe but that it was a significant effect for the fiber-optic probe. Given this difference, it would be recommended that if pluronic is to be added to a cell culture, it should be included in the experimental stage. This would not be difficult to do as it would be present at the same concentration in each sample.
CONCLUSION
This study outlines a methodology for evaluating the potential of mid-infrared spectroscopy as an on-line tool for monitoring mammalian cell culture media constituents. This method is beneficial as it identifies at an early stage where the technique may be best applied. A detailed comparison of two sampling systems is also outlined. This highlights any issues due to differing design of “sample to crystal” interface areas. The importance of a chemometric technique in the treatment of the data for the LOD analysis is clearly evident as the observed LOD was always found to be greater than the calculated LOD. The LOD results indicate that at concentration levels found in cell cultures, certain components, e.g., glutamine, lie below the detection ability of the instrument. Also, the LOD for each component is significantly higher in the multicomponent mixture than in the single-component mixture.
An experimental design using a sample set of 49 and concentrations typically found in a mammalian cell culture were used in the development of the calibration models. The study indicates the applicability of the technique in the monitoring of glucose and ammonia, both of which are major media constituents in mammalian cell cultures. Although all eight components investigated cannot be reliably monitored, due to their presence at such low concentration levels, there is potential for the development of a control platform, of a mammalian cell culture, based on glucose and ammonia. It should be noted that the accuracy of the prediction ability of a model is very much dependent on the sample set size and the concentration level of each of the components present. An increase in the number of samples in the sample set should improve the accuracy of the model.
Finally the external influence series of experiments indicate that changes in certain environmental conditions will impact spectra. However, it must be noted that maintaining these environmental conditions relatively constant is crucial to the overall bioprocess. Therefore, changes will impact results; however, the range over which these changes can occur without impacting the bioprocess is so tight that the process will be affected before the spectra are impacted.
Footnotes
ACKNOWLEDGMENTS
The authors wish to acknowledge the financial support from Science Foundation Ireland (grant no. 08/IN.1/B1948) and Enterprise Ireland (‘Bioapplication of PAT'—Industry Led Research Programme grant no. IN-2008-0102).