
Abstract
Mid-infrared attenuated total reflection (ATR) spectroscopy is a powerful tool for in situ monitoring of various processes. Mesoporous silica, an extensively studied material, has already been applied in sensing schemes due to its high surface area and tunable surface chemistry. However, its poor chemical stability in aqueous solutions at pH values higher than 8 and strong absorption below 1250 cm−1 limits its range of applications. To circumvent these problems, a mesoporous zirconia coating on ATR crystals was developed. Herein, the synthesis, surface modification, and characterization of ordered mesoporous zirconia films on Si wafers and Si-ATR crystals are presented. The modified coating was applied in sensing schemes using aromatic and aliphatic nitriles in aqueous solution as organic pollutants. The mesoporous zirconia coating shows strong chemical resistance when kept in alkaline solution for 72 h. The success of surface modification is confirmed using Fourier transform infrared (FT-IR) spectroscopy and contact angle measurements. Benzonitrile and valeronitrile in water are used as model analytes to evaluate the enrichment performance of the film. The experimental results are fitted using Freundlich isotherms, and enrichment factors of 162 and 26 are calculated for 10 mg L−1 benzonitrile and 25 mg L−1 valeronitrile in water, respectively. Limits of detection of 1 mg L−1 for benzonitrile and 11 mg L−1 for valeronitrile are obtained. The high chemical stability of this coating allows application in diverse fields such as catalysis with the possibility of in situ monitoring using FT-IR spectroscopy.
Introduction
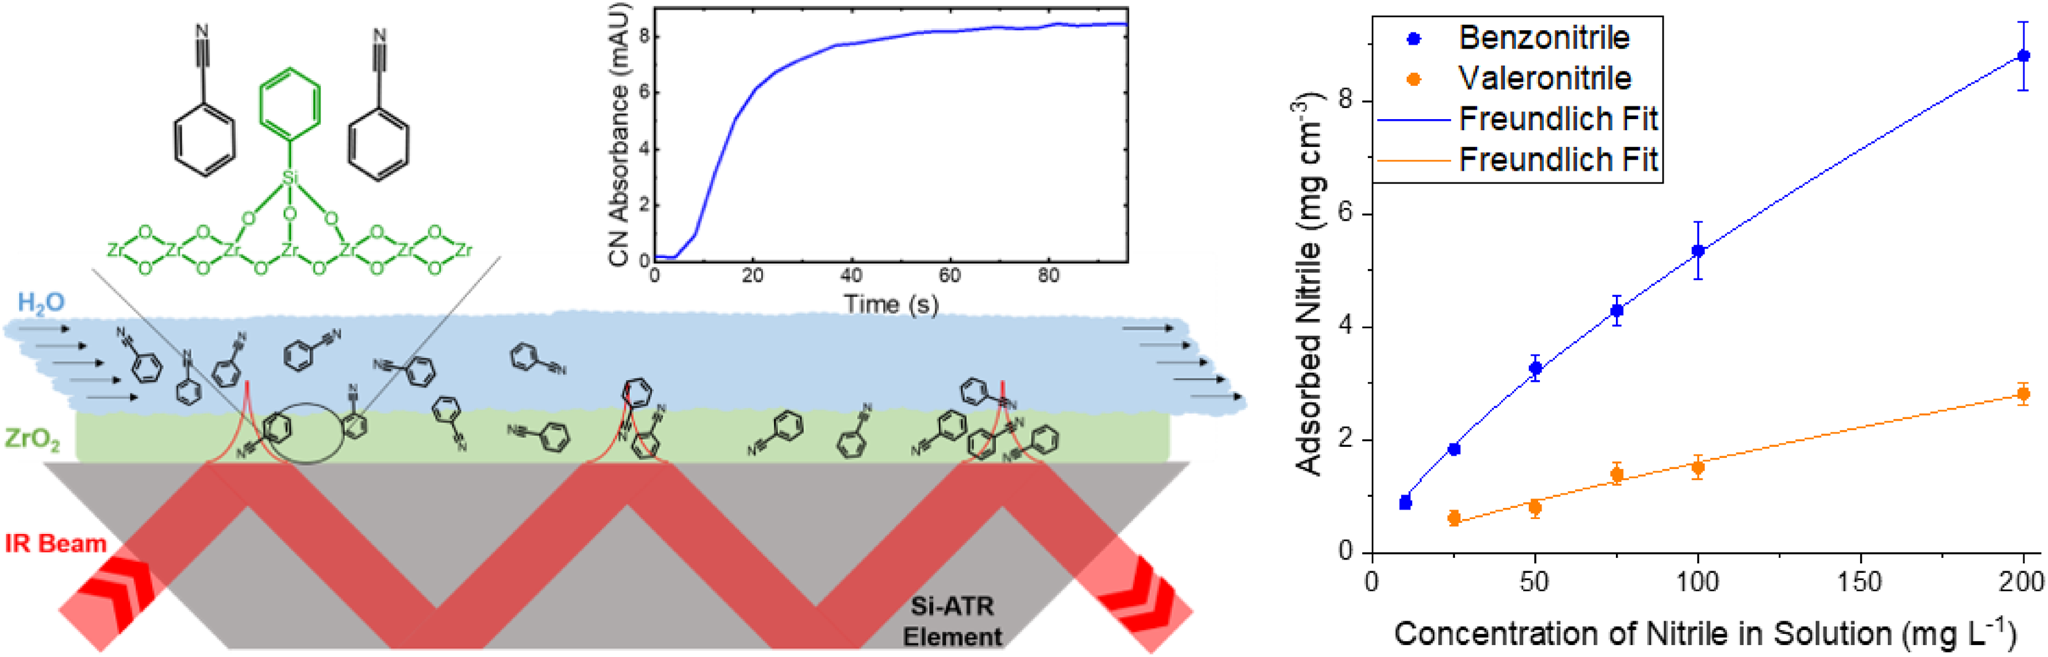
In typical attenuated total reflection Fourier transform infrared (ATR FT-IR) sensing schemes, claddings are used to increase selectivity and sensitivity by enriching the analyte in the probed volume of the evanescent field. Furthermore, these coatings can introduce additional benefits, for instance hydrophobicity to exclude water, as seen in Fig. 1. Thereby the strong background absorption of water is reduced, which allows to increase the number of total reflections also contributing to an increased sensitivity. This concept has been proven on attenuated total reflection (ATR) crystals and optical fibers coated with polymers,1–7 zeolites,8,9 metal oxides,
10
sol-gels,
11
and mesoporous silica12–14 to detect volatile organic compounds in the gas or aqueous phase. Mesoporous materials show advantageous properties for sensing applications, such as large surface areas, adjustable porosity and pore size distribution, and ample possibilities for chemical surface modifications allowing to discriminate different analytes according to their size, polarity, or functionality.15–20 ATR FT-IR sensing scheme using enrichment layers.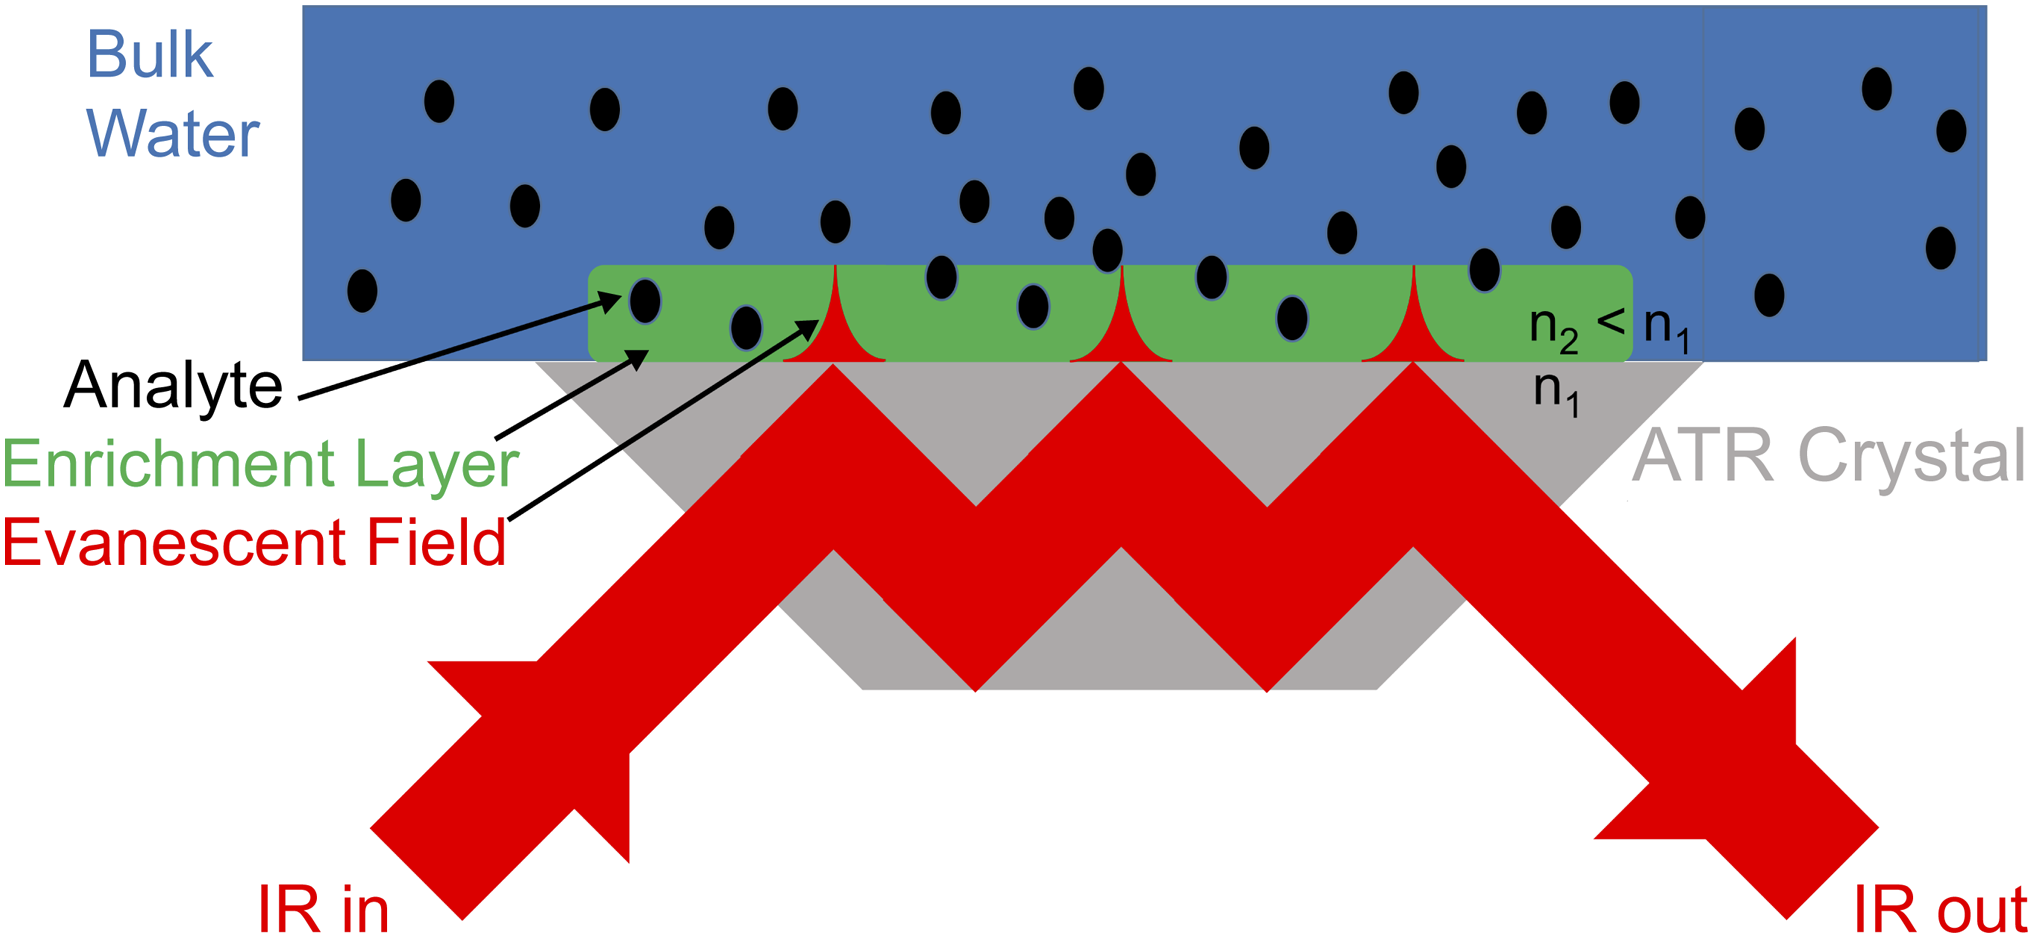
Mesoporous silica (SiO2) has been widely applied in sensing schemes; however, its application is limited by its chemical stability in aqueous solutions at pH values above eight.21–23 Furthermore, the strong absorption below 1250 cm−1 of the SiO2 network prevents analysis of various organic and inorganic sulfur- and phosphorus-containing compounds, such as sulfates and phosphates. 24 Zirconia (ZrO2) shows spectral transmittance in the fingerprint region until 1100 cm–1, high thermal, mechanical, and chemical stability and is therefore already widely applied in the field of chromatography,25,26 but its application as enrichment layer is yet pending.
In this work, we demonstrate the first application of an ordered mesoporous ZrO2 coating in sensing applications using ATR FT-IR spectroscopy. We present the synthesis and the surface modification of a mesoporous ZrO2 coating as well as its characterization using FT-IR spectroscopy, X-ray diffraction (XRD), grazing-incidence small-angle scattering (GI-SAXS), and contact angle measurements. ZrO2 coatings were prepared by spin coating a precursor solution onto Si wafers or prepared rectangular Si-ATR crystals (20 × 10 × 0.5 mm3). After aging and calcination, the coating was functionalized using silanes. In enrichment studies, benzonitrile and valeronitrile were chosen as model analytes for aromatic and aliphatic compounds, as the obtained results can be benchmarked against findings from a previous study employing mesoporous silica films with the same analytes. 13 The experimental data was fitted using Freundlich and Langmuir isotherms, and the adsorbed amount of analyte, the response time as well as the limits-of-detections were quantified.
Experimental
Reagents and Materials
Acetone (VWR, HiPerSolv Chromanorm for high-performance liquid chromatography, or HPLC, ≥99.8%), benzonitrile (C6H5CN, Sigma-Aldrich, 99%), cetyltrimethylammonium bromide (CTAB, Sigma-Aldrich, 99%), chloroform (CHCl3, VWR, anhydrous ≥99.5% stabilized with iso-amylene, AnalaR Normapur analytical reagent), ethanol (EtOH, Chem-Lab, 100% p.a.), hydrochloric acid (HCl, VWR, 37%), Pluronic F-127 (F-127, Sigma-Aldrich, BioReagent), tetraethoxysilane (TEOS, Sigma-Aldrich, 99.5%), trichloro(phenyl)silane (TCI, ≥98.0%), valeronitrile (C4H9CN, Sigma-Aldrich, 99%), zirconium(IV) propoxide (Zr(OPr)4, AcroSeal, ACROS Organics, 70 wt% in 1-propanol).
Synthesis of Mesoporous Zirconia
The synthesis was adapted from the literature. 27 First, 0.72 g F-127 Pluronic was suspended in 12.4 g (15.7 mL) absolute EtOH and 1.5 mL conc. HCl was added under stirring. After completely dissolving the surfactant, 3.2 g (3.4 mL) of a 70 wt% Zr(OPr)4 in 1-propanol was added dropwise under vigorous stirring. This resulted in a final molar ratio of 1.0 : 0.0075 : 2.4 : 35.2 : 2.4 for Zr(OPr)4 : F-127 : HCl : EtOH : PrOH. The obtained solution was stirred for 3 h at ambient temperature. The substrates used for spin coating were ultrasonically cleaned in EtOH for 15 min. The relative humidity of the spin coater chamber was adjusted to 50% and approximately 50 µL of this solution were spin coated onto Si wafers or Si ATR crystals at 2000 rpm for 30 s. After spin coating, the samples were aged for 2 h at ambient temperature, 1 day at 60 °C and at 110 °C, 150 °C, and 185 °C for 2 days each. After aging, the FT-IR spectra of ZrO2-coated Si-ATR crystals showed bands associated with the surfactant F-127 (Fig. S3, Supplemental Material). Removal of the surfactant by solvent extraction caused damage to the coating, so the surfactant was removed via calcination instead. Then, they were calcined at 500 °C with a heat ramp of 1 °C min−1.
Surface Modification of Mesoporous Zirconia
The functionalization was adapted from the literature.28,29 The ZrO2-coated Si ATR crystals were ultrasonically cleaned in acetone, EtOH, and deionized water for 10 min each. After purging the sample with dry air, the coating was pre-treated at 110 °C for approximately 12 h. Then, it was placed in a three-neck round-bottom flask with a reflux condenser and bubbler, N2 inlet, and a vacuum connection. The coating was dried in vacuo at 150 °C for 2 h. After purging the flask with N2, 20 mL of CHCl3 and 400 µL of trichloro(phenyl)silane was added at ambient temperature. The reaction mixture was kept in inert atmosphere for 24 h. Then, the solution was removed and the ZrO2 coating was ultrasonically cleaned in acetone, EtOH, and deionized water for 10 min each. After purging the sample with dry air, the coating was placed in the oven at 90 °C for approximately 12 h.
Synthesis of Mesoporous Silica
The mesoporous SiO2 coating was synthesized as previously reported.13,30 A sol was prepared by diluting 2.08 g TEOS with 2.2 mL of EtOH and adding 0.9 mL of a 0.056 M solution of HCl in H2O. The mixture was stirred for 3 h at 40 °C. Then, 0.041 g CTAB was dissolved in 0.5 mL EtOH, 0.5 mL of the reaction solution added, and the solution was stirred for 5 min. The solution was spin coated at 2000 rpm for 30 s at a relative humidity of 50% onto a Si substrate, which was ultrasonically cleaned in EtOH for 15 min prior to deposition. Afterward, the coated substrate was pre-treated at 110 °C overnight, cooled to ambient temperature, followed by calcination at 400 °C for 5 h with a heating ramp of 1 °C min−1.
Fourier Transform Infrared Spectroscopy
The FT-IR spectra were collected using a Vertex 80v spectrometer (Bruker Optics) operated with OPUS 7.5 software. A mercury–cadmium–telluride detector cooled with liquid nitrogen was used. All IR spectra were collected with a mirror speed of 80 kHz, a spectral resolution of 4 cm−1 and a total of 64 scans (measurement time: 14.9 s) except for the IR spectra of enrichment studies, where 16 scans were averaged for each spectrum (measurement time: 3.75 s). Scans were obtained in double-sided, backward–forward acquisition mode. The aperture was set to 6 mm to obtain the best signal-to-noise ratio. Throughout measurements, the interferometer compartment was evacuated, while the sample compartment was continuously flushed with dry air. For the enrichment studies, the computed absorbance spectra were converted to ascii files in OPUS and evaluated using Matlab R2020a, including baseline subtraction as well as integration of the IR bands.
Methodology for Thin Film Characterization
Optical Setup
Double-sided polished 10 mm × 20 mm × ∼525 µm Si wafers were provided by the IMEC/Ghent University. The wafers were glued to an aluminum holder with a defined angle of 45° using wax. Then, the facets were polished using Al2O3 with a grain size of 30 and 9 µm, followed by diamond polishing with a grain size of 3, 1, and 0.1 µm.
A home-built ATR mount and an aluminum flow cell were used for ATR FT-IR measurements.13,31 A stainless steel tubing (1/16″, 0.75 mm I.D.) inlet was attached to the flow cell as well as a PTFE tubing (1/16″, 0.75 mm I.D.) outlet. Liquids were transported using a peristaltic pump (Ismatec).
Microscopy
Microscopic images were taken using a Hyperion 3000 FTIR microscope (Bruker Optics).
X-ray Diffraction
X-ray diffraction patterns were collected using an X’Pert Pro diffractometer and Data Collector software by PANalytical (Almelo). This instrument was equipped with a Cu anode, whereby a voltage of 45 kV and a current of 40 mA were applied, resulting in a wavelength of 1.54 Å. Bragg–Brentano geometry was used with 0.04 rad Soller slits and a divergence slit of 1/4° as well as an anti-scatter slit of 1° in the incident beam path. An anti-scatter slit of 5.0 mm was used in the diffracted beam path and an X’Celerator detector. X-ray diffraction patterns were recorded at ambient temperature between 1° and 6° with a step size of 0.01° and a counting time of 60 s at each step. The sample holder was rotated with a rotation time of 4 s. Evaluation of the wide-angle XRD patterns was performed using HighScore Plus software by PANalytical (Almelo). Non-ambient XRD measurements were conducted using an Empyrean multipurpose diffractometer and Data Collector software by PANalytical (Almelo) equipped with an HTK-1200N chamber (Anton Paar). Samples were placed in the chamber on the ceramic sample holder and fixed with a thermal paste. The same configurations as mentioned for XRD patterns were used for the measurement.
The GI-SAXS measurements were conducted using an Empyrean multipurpose diffractometer and Data Collector software by PANalytical (Almelo) equipped with a Cu anode, where a voltage of 45 kV and a current of 40 mA were applied, resulting in a wavelength of 1.54 Å. A focusing X-ray mirror, a divergence slit of 1/32°, and a GaliPIX3D detector were used. The measurement was conducted as described by PANalytical’s guidelines. The collected diffraction patterns were evaluated using XRD2DScan software by PANalytical (Almelo).
Contact Angle Measurements
These measurements were performed using a drop shape analyzer 30 (Krüss) in combination with the provided Advance 1.5.1.0 software. The device was equipped with a charge-coupled device camera. Static contact angles were determined by placing a 3 µL drop of water on the sample’s surface. Data analysis was performed by the Young–Laplace method within the instrument software.
Profilometry
Film thickness was determined using a DektakXT profilometer with Vision64 software (Bruker). The coating was scratched using a pincer after spin coating. The obtained data was analyzed using the Data Analyzer of the software.
Ellipsometry
The refractive index of ZrO in the mid-IR region was obtained using a mid-IR ellipsometer (IR-VASE, J.A. Wollam) equipped with a thermal broadband source, a deuterated triglycine sulfate detector and an FT-IR spectrometer, at a resolution of 2 cm–1. A reference scan on a bare Si substrate, cleaved from the same wafer as the sample, was recorded and fitted using a model for Si including Drude absorption due to free carriers. These parameters were consequently applied to fit the spectra of a Si/ZrO layer stack, using an isotropic bulk model for ZrO with a filling factor of unity.
Results and Discussion
Characterization of Mesoporous Zirconia
Temperature stability studies of the mesostructure were performed after the aging process to determine the optimal calcination temperature for surfactant removal from the coating and further increased stability. To this purpose, a ZrO2-coated Si wafer was heated to 900 °C, during which XRD patterns were collected every 5 °C. Upon increasing the temperature, the diffraction peak decreases in intensity and shifts to higher diffraction angles (2θ), indicating a contraction of the structure (Fig. 2a). A local maximum is reached at 600 °C, and at 900 °C there is still a diffraction peak discernible, whose intensity increases upon cooling to 25 °C. The decrease in mesoporous ordering can be explained by recrystallization processes, which is evident from the wide-angle XRD patterns in Fig. 2b. After increasing the temperature to 900 °C, broad diffraction peaks associated with a cubic or tetragonal ZrO2 structure become visible. (a) XRD patterns of a mesoporous ZrO2 coating on a Si wafer from 25 °C to 900 °C with emphasis on the measurements at 25 °C, 600 °C, and 900 °C and at 25 °C after heating to 900 °C. (b) Wide-angle XRD patterns of the same coating prior to the temperature treatment and at 25 °C after heating to 900 °C.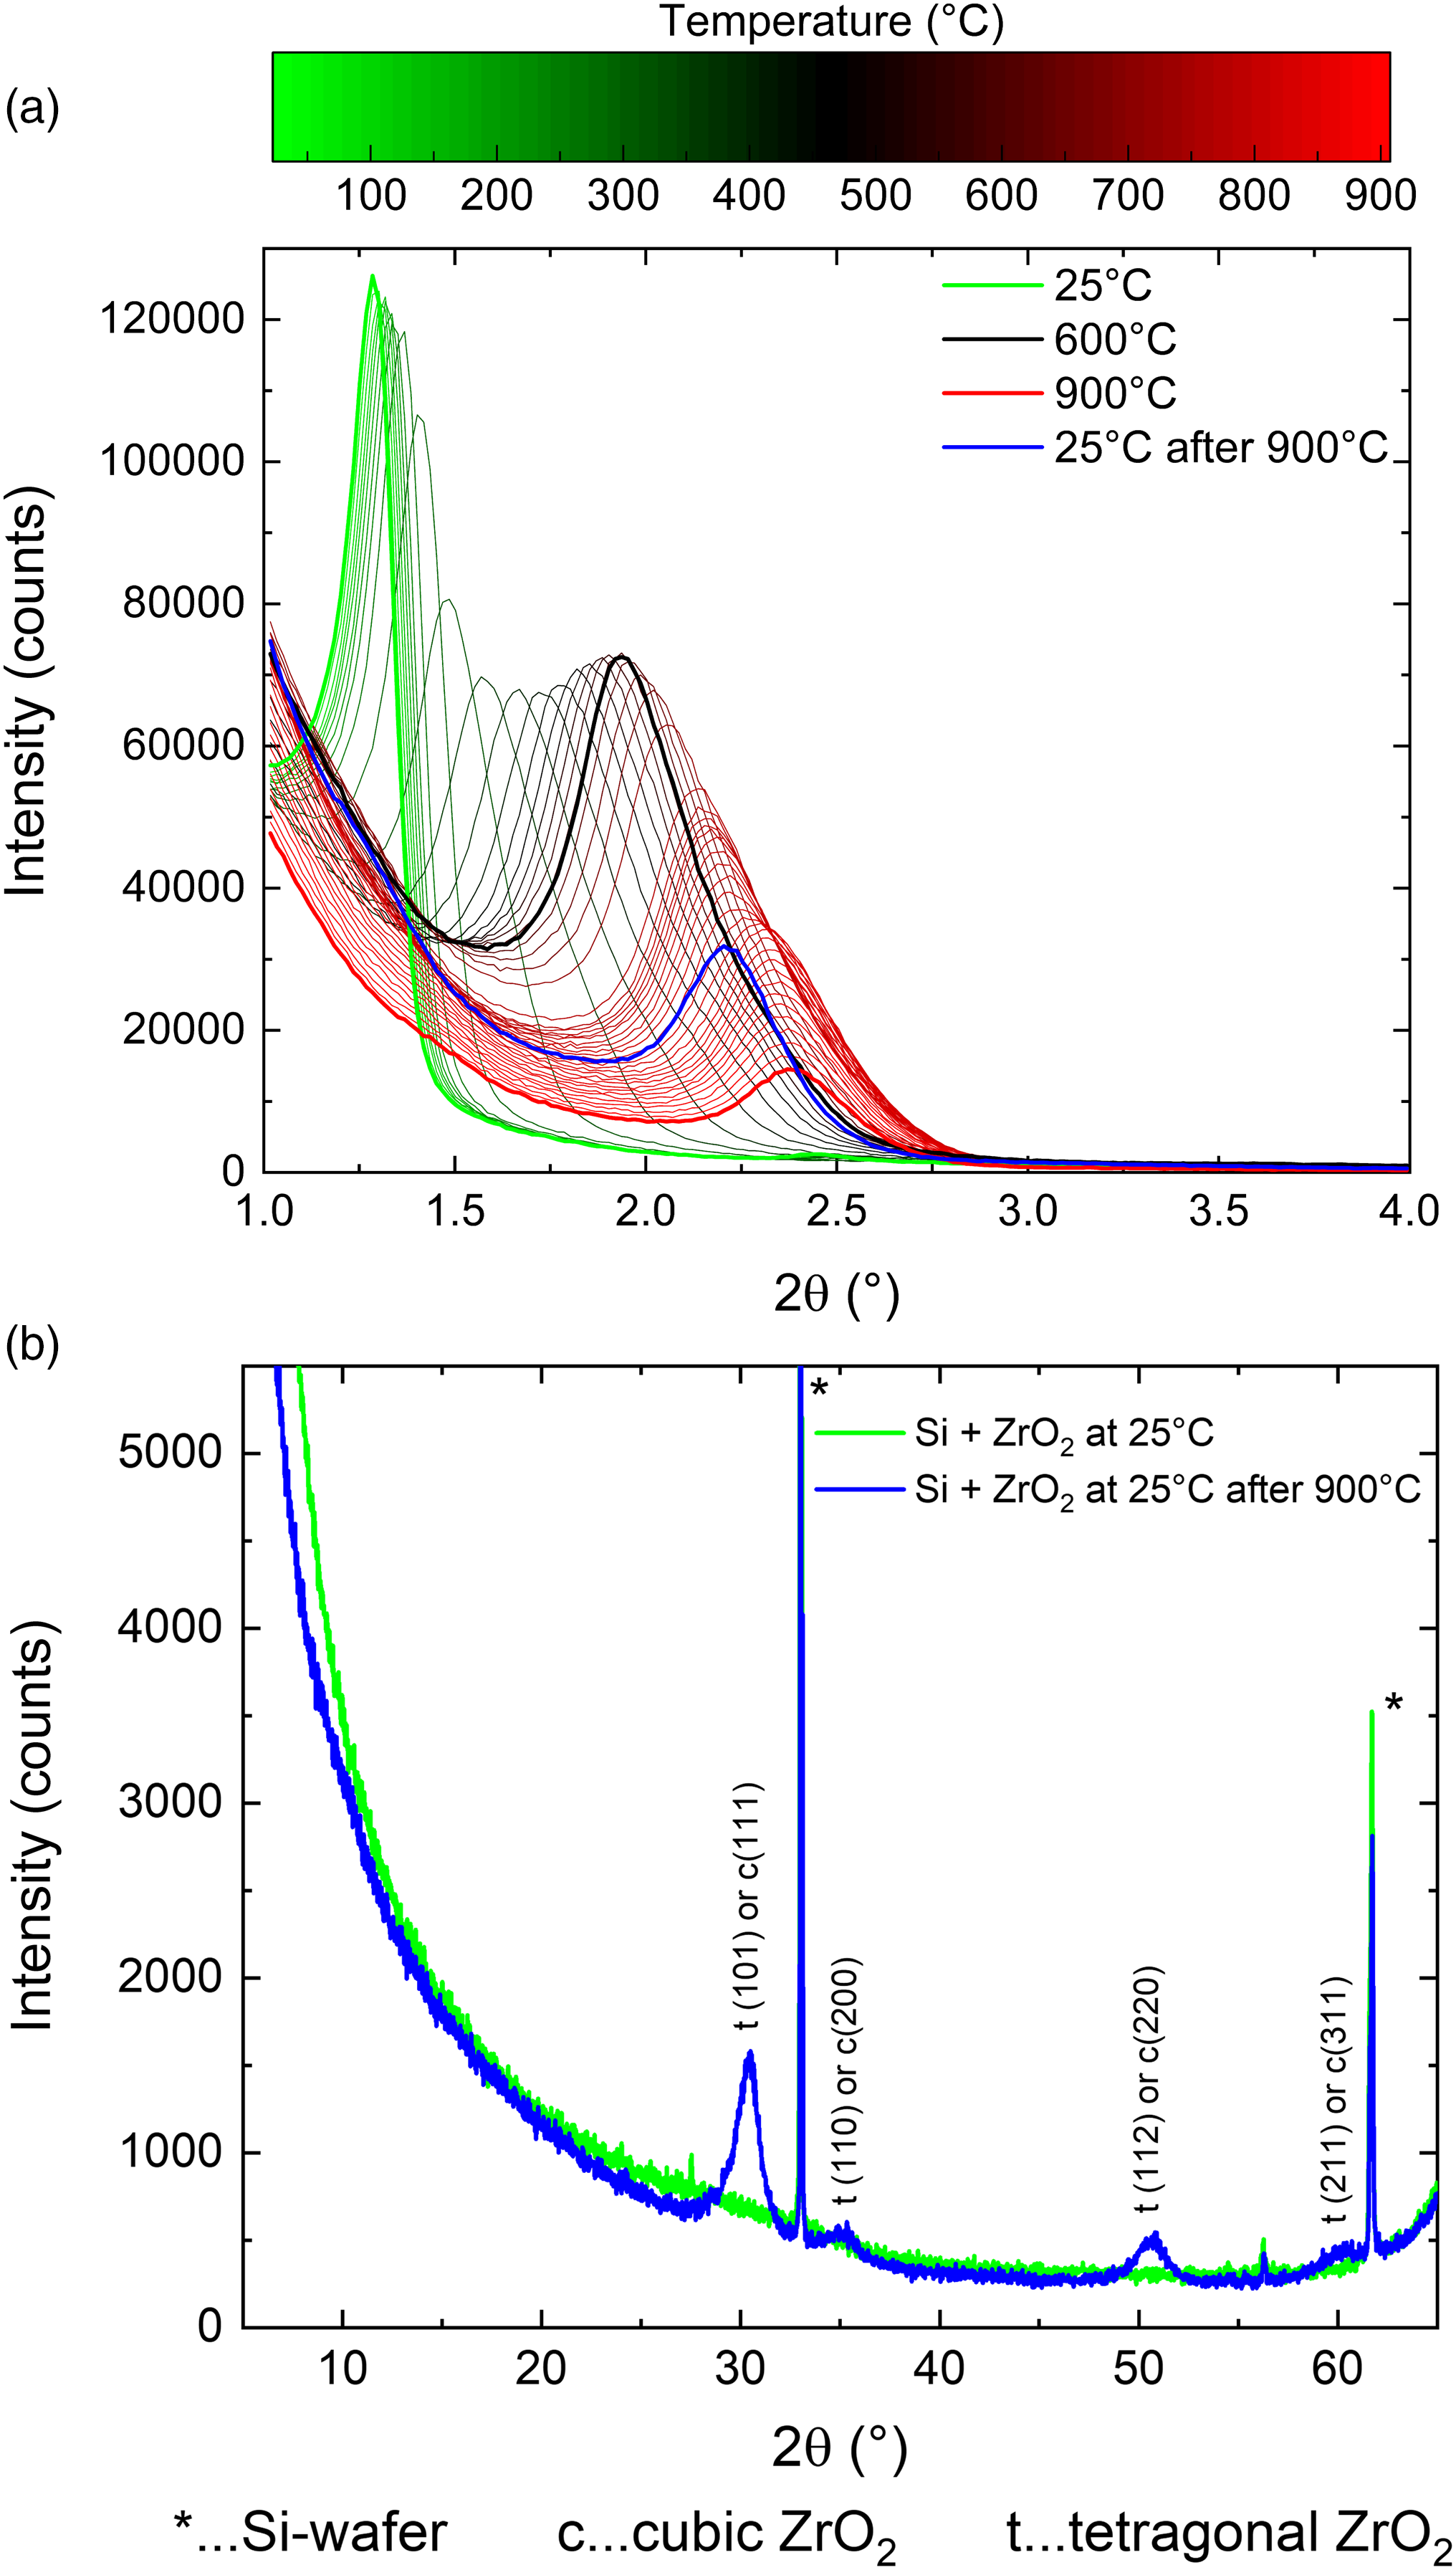
Calcination of the mesoporous ZrO2 coating was performed at 500 °C with a heating ramp of 1 °C min−1. Small-angle XRD patterns show the presence of a cubic mesostructure (see Figs. 3a and 3b), while wide-angle XRD indicate no diffraction peaks associated with recrystallization and thus potential pore collapsing (see Fig. S4). Film thicknesses of 365 ± 5.9 nm before and 237 ± 11.4 nm after calcination were measured for the ZrO2 coating, which corresponds to a film contraction to 65% of the initial film thickness. The FT-IR absorbance spectra of ZrO2 on a Si ATR crystal before and after calcination are displayed in Fig. 3c. The removal of the surfactant after calcination is evident from the absence of C–H stretching vibrations at 2966 cm–1 and C–H bending vibrations between 1200 and 1500 cm–1.
24
GI-SAXS patterns of cubic mesoporous ZrO2 coatings (a) after the aging process and (b) after calcination at 500 °C. (c) FT-IR absorbance spectra of the mesoporous ZrO2 coating with band assignments after the aging process and after calcination at 500 °C.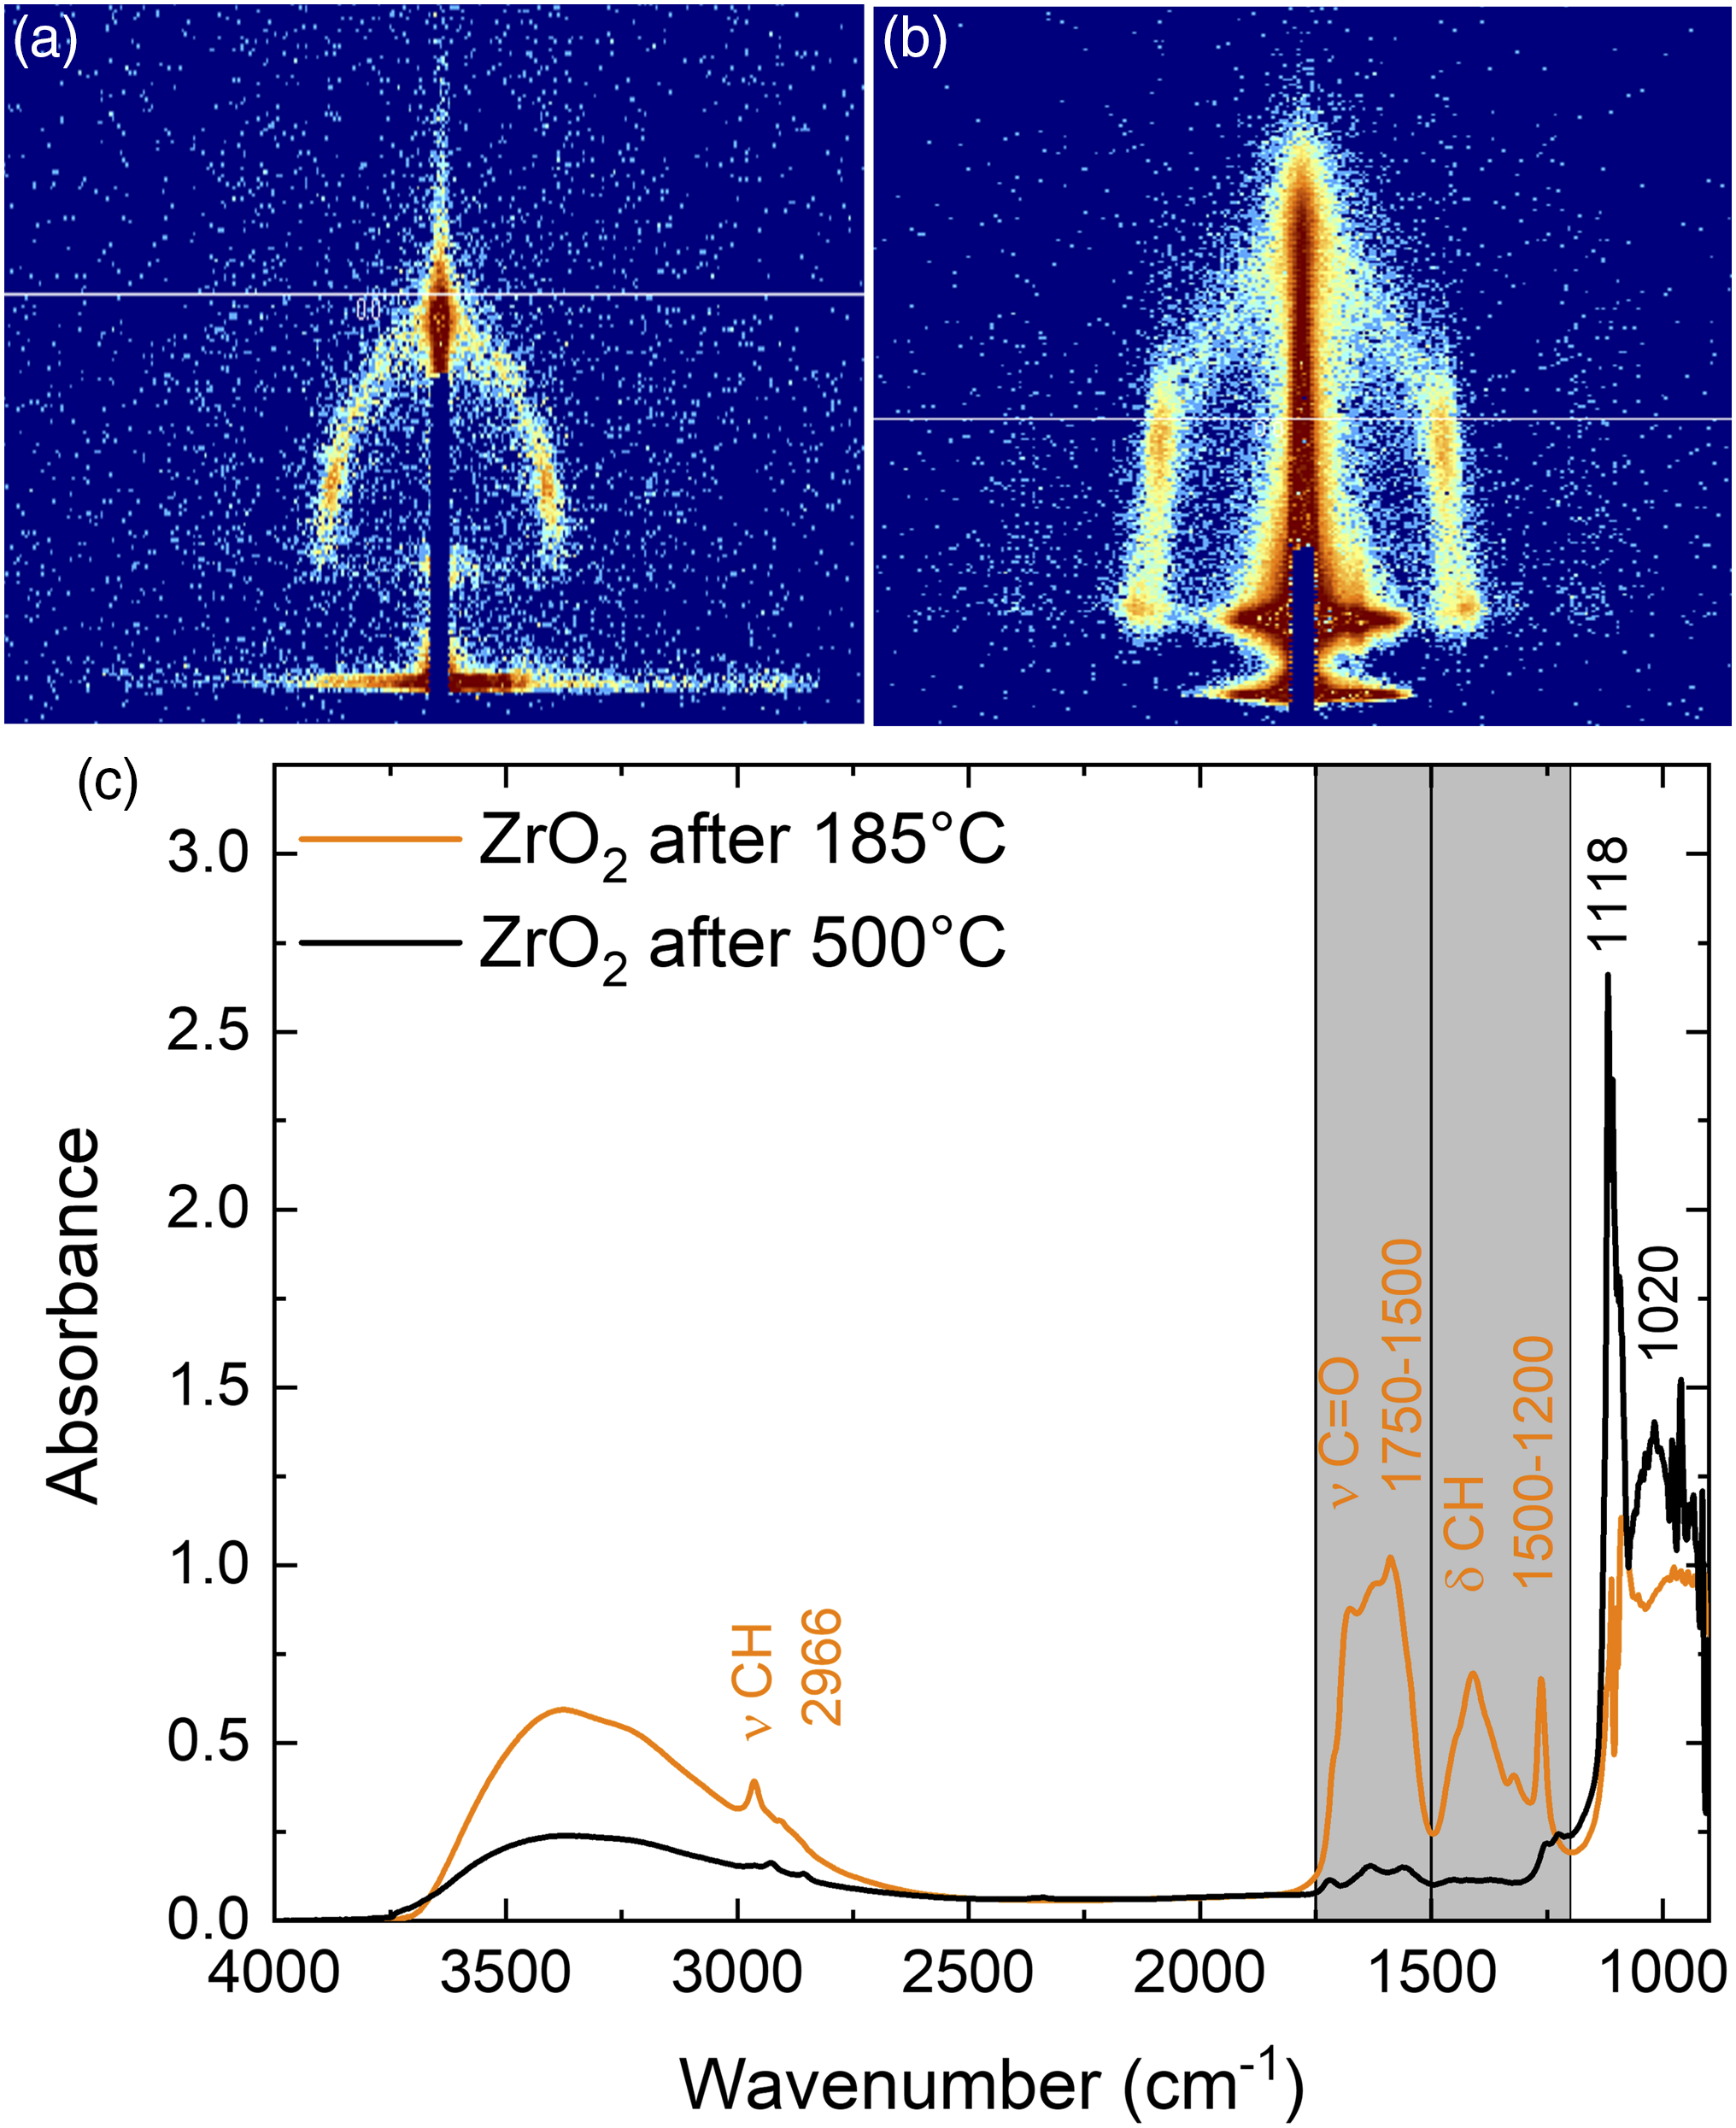
Chemical Stability of Mesoporous Zirconia
The chemical stability of the mesoporous ZrO2 coating compared to an unfunctionalized mesoporous SiO2 coating was investigated. According to the literature, SiO2 is stable at pH values below 8, while ZrO2 is chemically inert between pH = 1 and 14.21,32 To broaden the range of applications for sensing in aqueous media for pH > 7, the chemical stability in alkaline solution was investigated. Both coatings were placed in a flask filled with 0.01 M NaOH solution with a pH value of 12. Microscopic images showed the complete removal of the mesoporous SiO2 coating after 12 h (Fig. S7, Supplemental Material). However, even after 72 h in this solution, the mesoporous ZrO2 coating remained present, but with a change in color. Small-angle XRD patterns confirmed the presence of the mesostructure with a contraction of 10% and the FT-IR spectra only showed minor differences, as seen in Fig. 4. Microscopic images of ZrO2-coated Si ATR crystals (a) before and (b) after placing the coating in the 0.01 M NaOH solution. (c) XRD patterns and (d) FT-IR absorbance spectra before and after placing the coating in the 0.01 M NaOH solution.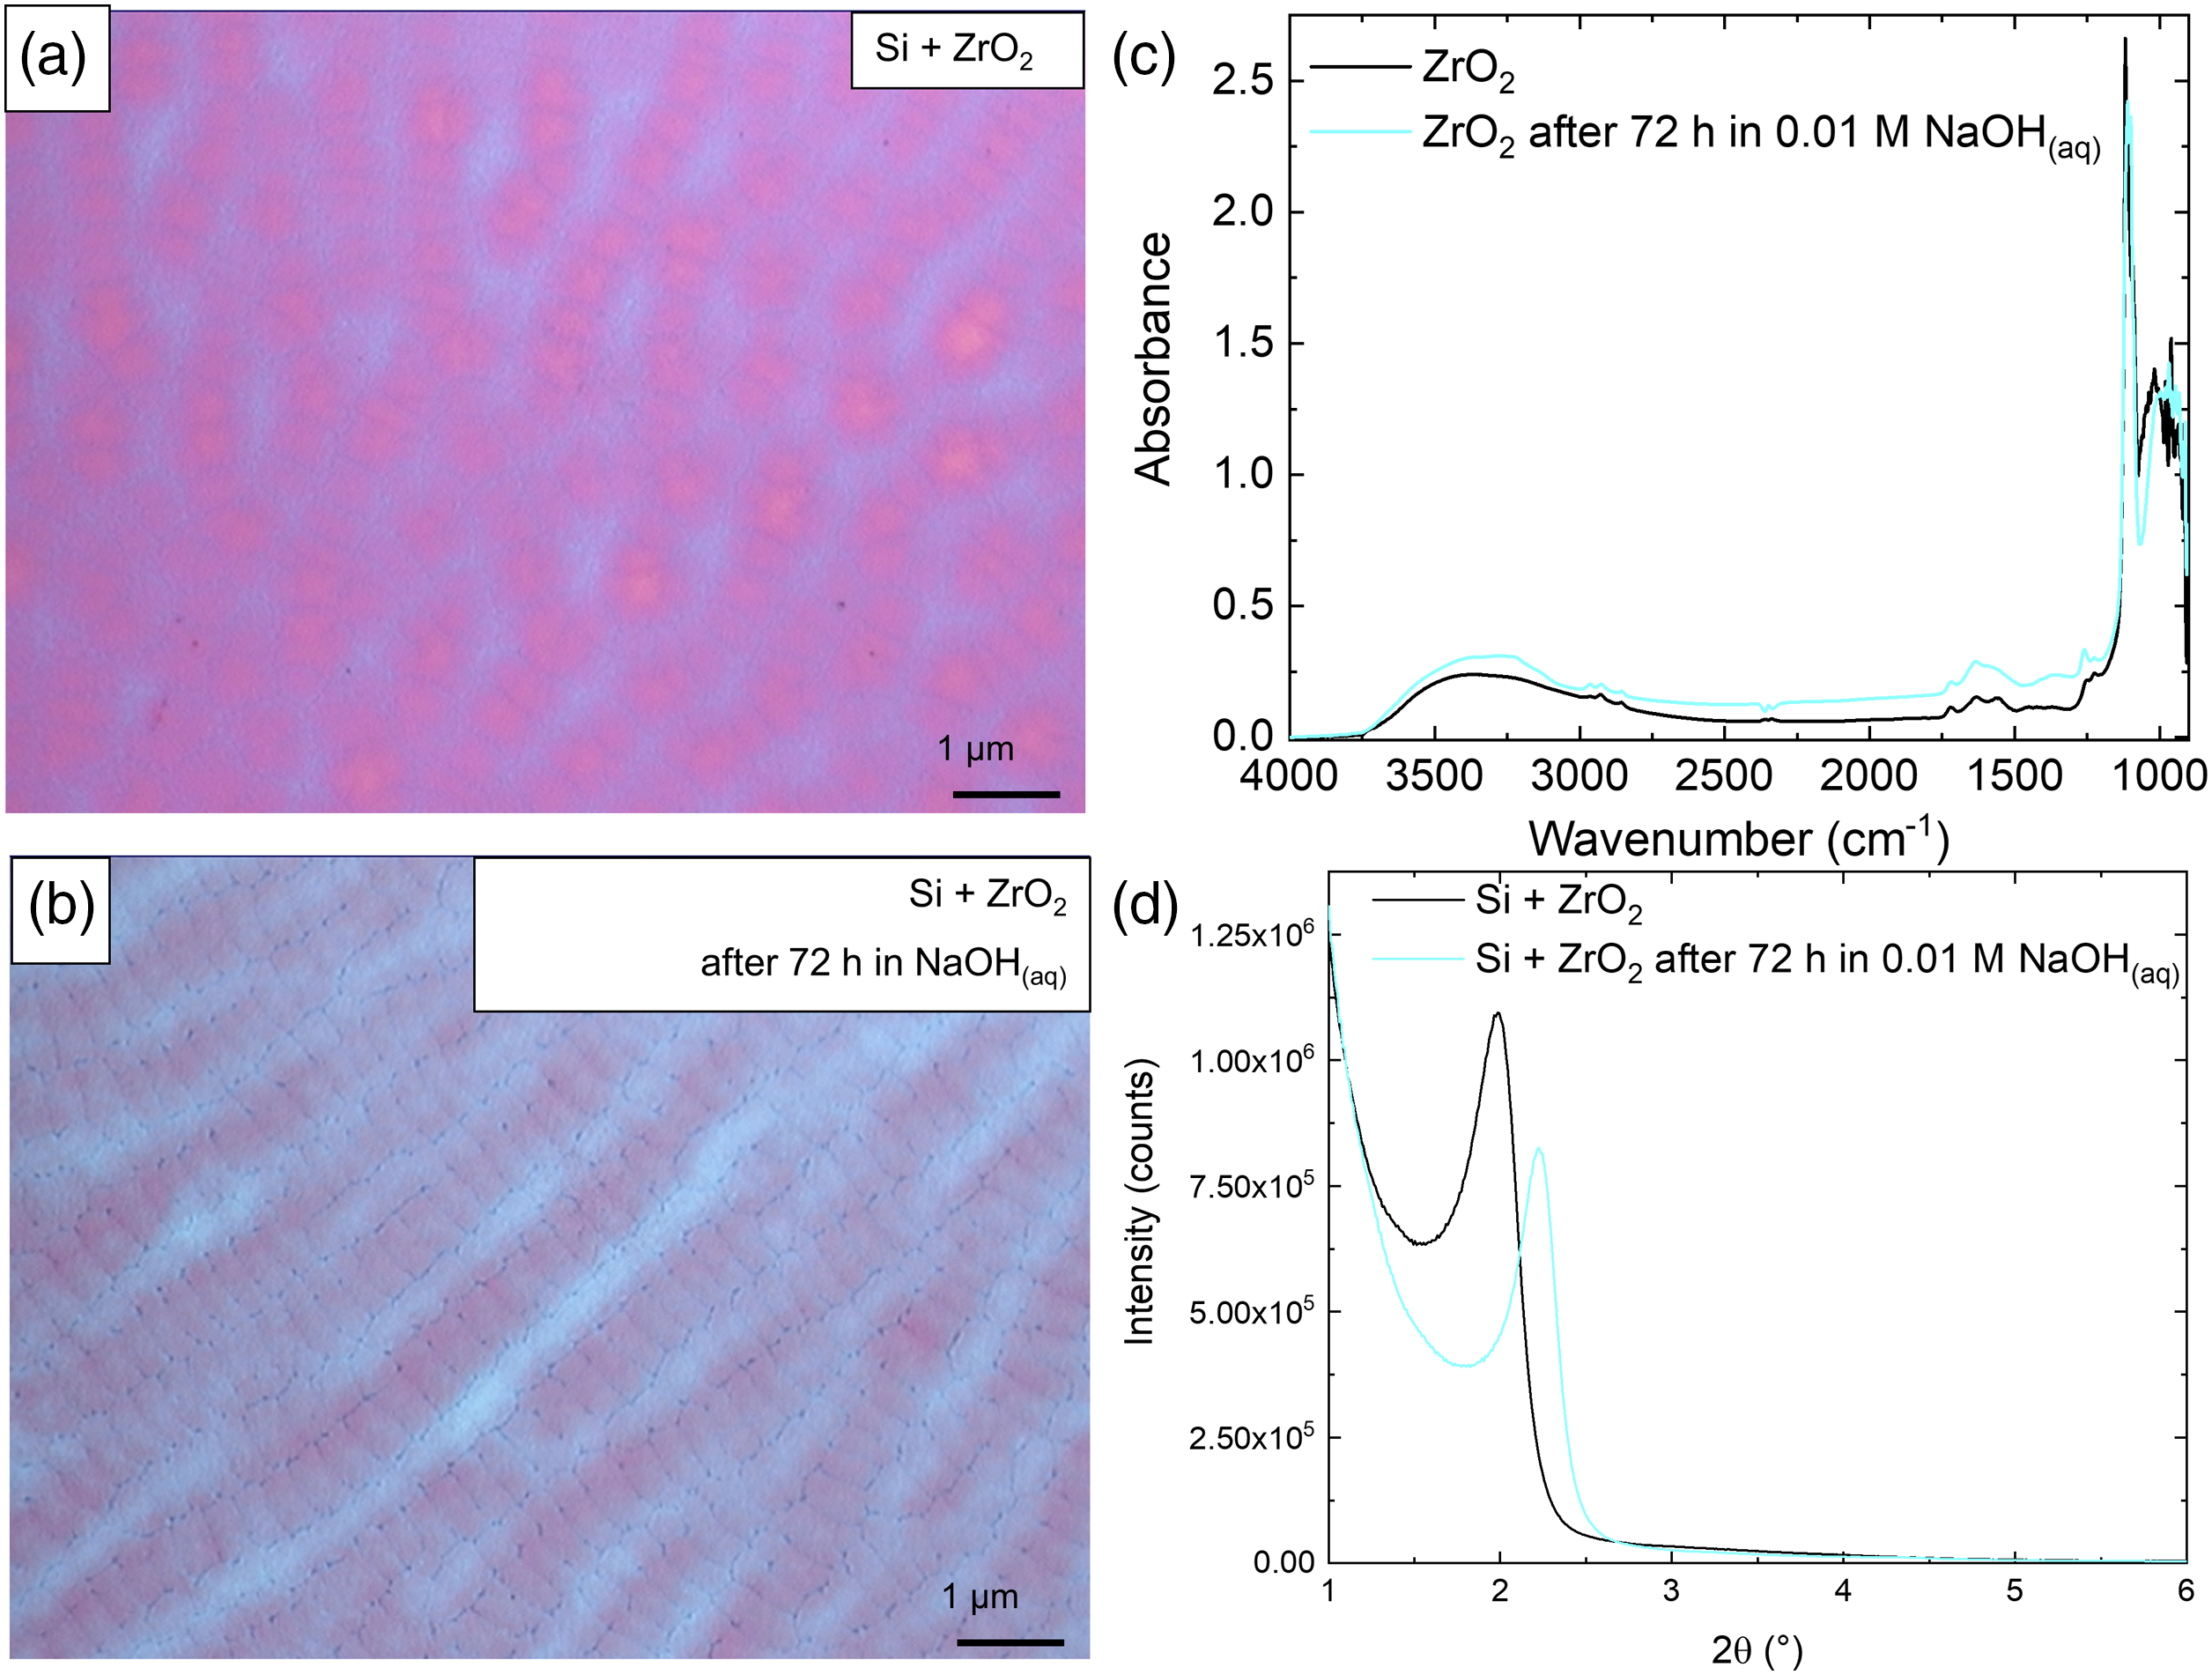
Surface Modification Using Silanes
The surface of a mesoporous ZrO2 coating was modified using trichloro(phenyl)silane. The successful functionalization and increase in hydrophobicity were characterized using static contact angle measurements. The obtained contact angles were 25.0° and 71.8° for the pristine and modified ZrO2 coating, respectively. Additionally, bands of the C–H stretching vibration between 3100 and 2800 cm−1 as well as at approximately 1250 cm−1 confirm the presence of organic moieties.
24
Bands at 1595 and 1430 cm−1 are characteristic of C=C stretching vibrations of the benzene ring and in-plane hydrogen bending, respectively.33,34 The hydrophobicity was further confirmed with FT-IR spectra of water on uncoated and coated Si ATR crystals. The IR bands associated with vibrations of H2O are less intense for the modified coating compared to blank Si-ATR crystals, as seen in Fig. 5. The refractive index of the modified ZrO2 film was determined using mid-IR ellipsometry to be n = 1.72 at 2300 cm–1 by extracting it from the measurement of the combined Si/ZrO2 stack (see Fig. S8, Supplemental Material). This value is approximately 15% lower compared to dense ZrO2, due to a porosity of approx. 30% of the mesoporous film. (a) FT-IR absorbance spectra of ZrO2-coated Si ATR crystals before and after surface modification. (b) FT-IR absorbance spectra of water on an uncoated and ZrO2-coated Si ATR crystal after surface modification.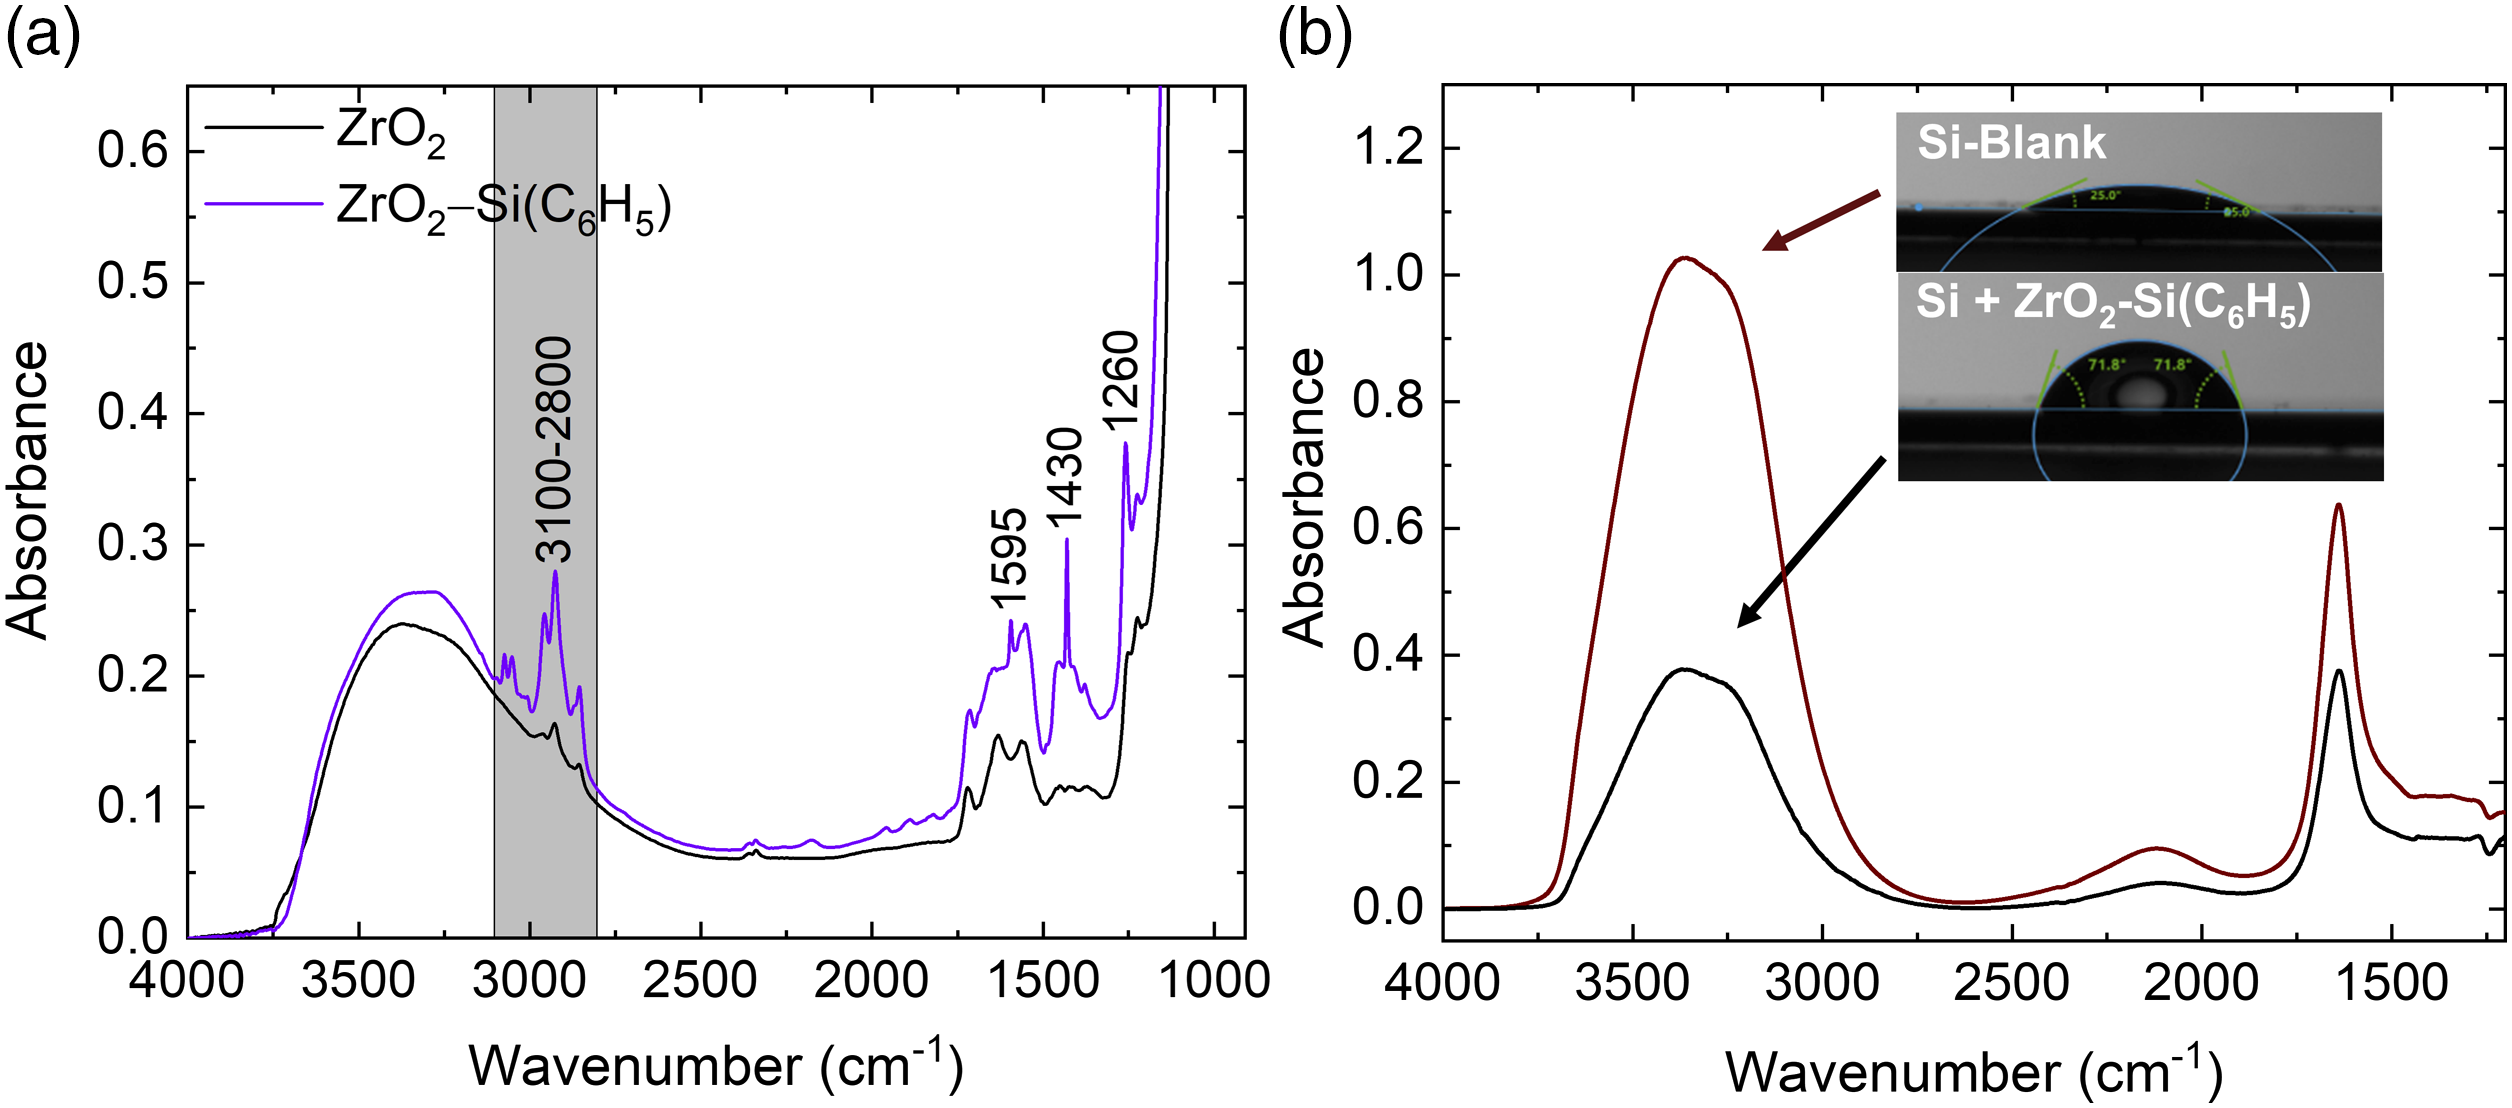
Adsorption/Desorption Studies of Benzonitrile Solutions
Analyte solutions were applied using stainless-steel tubing attached to the flow cell and a peristaltic pump. The speed of adsorption and desorption of benzonitrile was investigated by applying water, 100 mg L−1 benzonitrile in water, and water, consecutively, while collecting FT-IR spectra averaged over 16 scans, resulting in a measuring time of 4 s for each spectrum. For evaluation, the band area of the CN vibration was calculated and displayed in a timeline. Figure 6b shows that it requires 32 s to reach 90% of the maximum IR absorbance during the adsorption and approximately 28 s to reach 10% of the maximum IR absorbance during the desorption process. Variation of the flow rate between 0.5 and 2.0 mL min−1 had little effect on the maximum IR absorption after equilibration (Fig. S9, Supplemental Material). (a) Single channel spectra of Si ATR crystals coated with SiO2 and ZrO2. The maximum transmission of the Si ATR spectrum is highlighted in dark blue. ATR FT-IR spectra of pure benzonitrile and pure valeronitrile with the evaluated νCN at approximately 2250 cm–1. (b) Adsorption and desorption profile of 100 mg L−1 benzonitrile in water onto modified mesoporous ZrO2 using a flow rate of 2.0 mL min−1.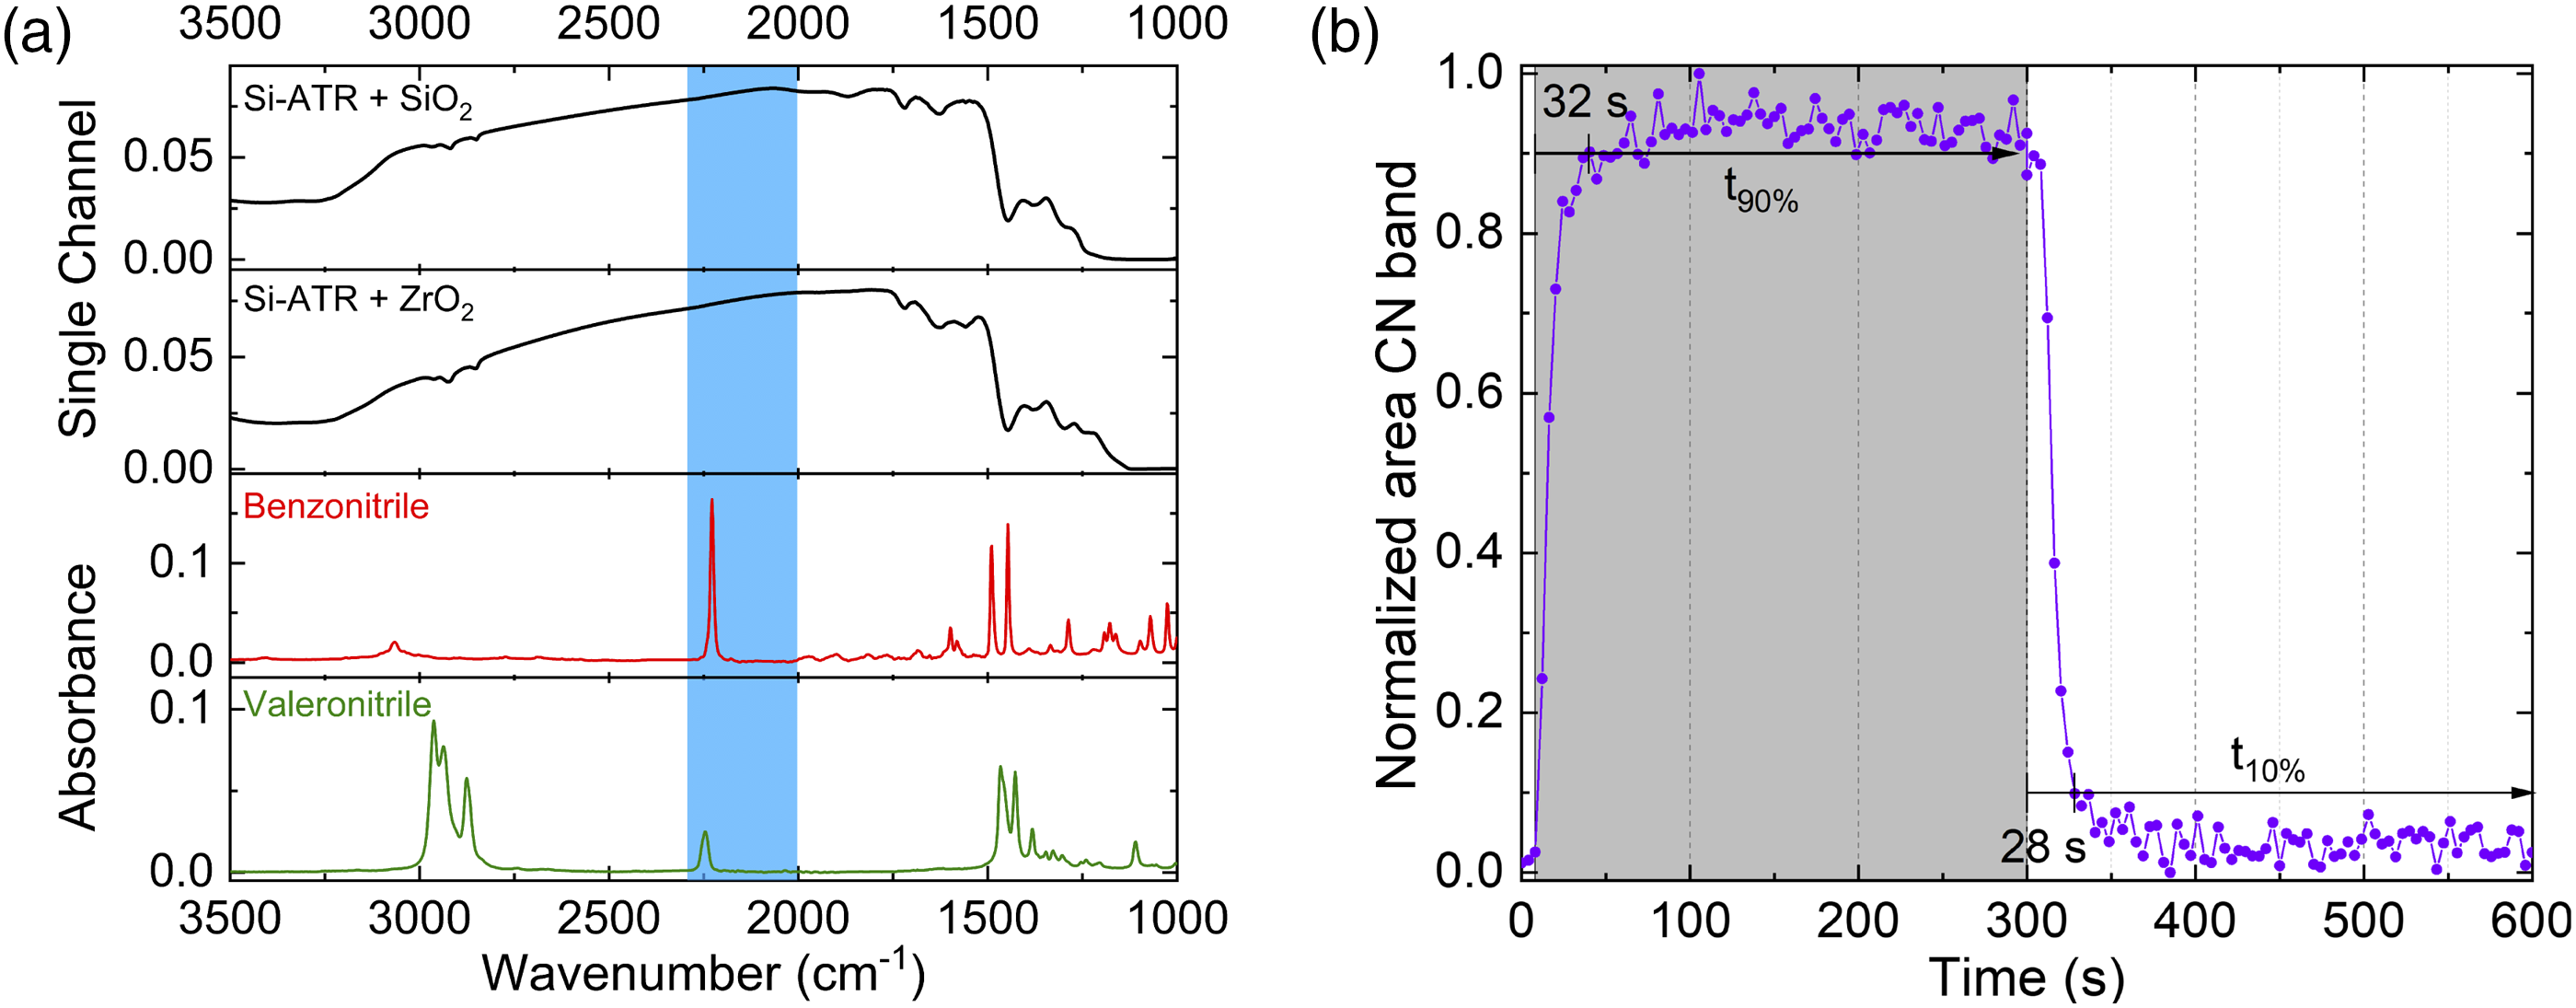
Equilibrium Adsorption Experiments
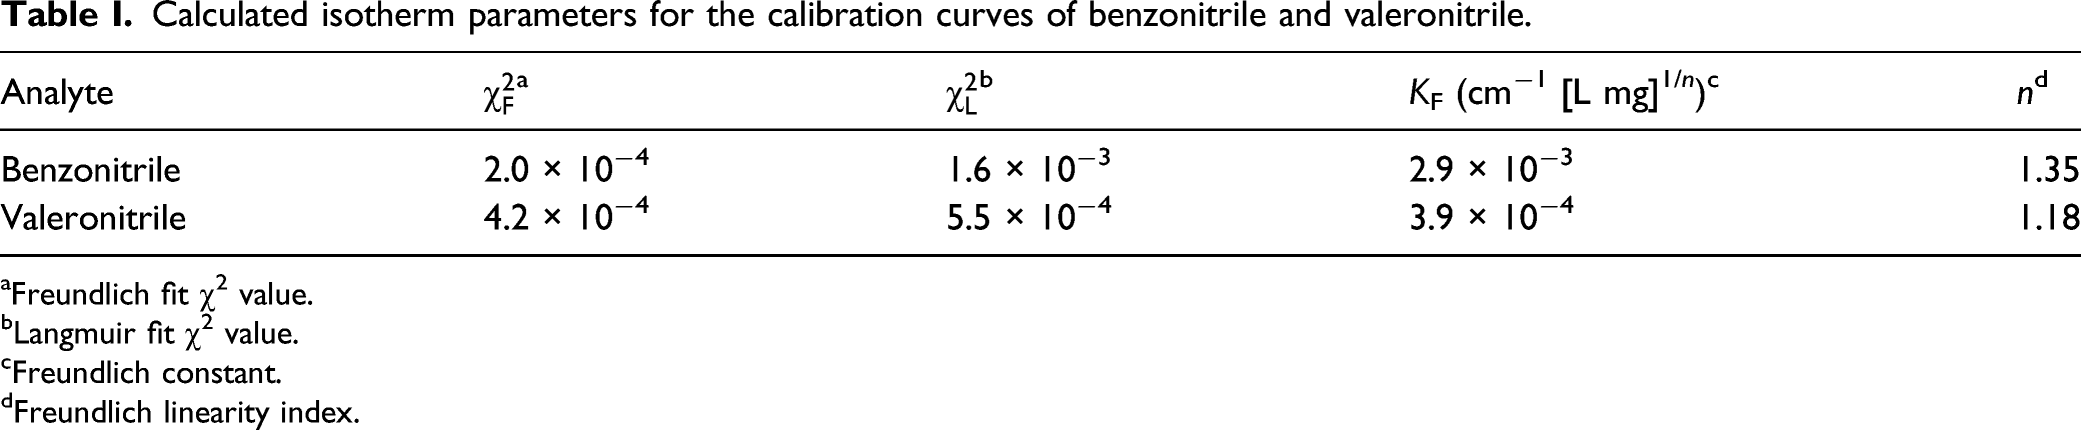
For equilibrium adsorption experiments, benzonitrile and valeronitrile were used as model analytes. Figure 6a shows ATR-IR spectra of the pure compounds. Aqueous solutions of the model compounds with concentrations ranging from 10 to 200 mg L−1 were applied to the modified ZrO2 coating until the maximum IR absorbance was reached. The band areas were calculated after baseline subtraction and are displayed for both benzonitrile and valeronitrile in Fig. 7a. The data were fitted using Langmuir and Freundlich isotherms.
13
The models are expressed by the following equations (a) Calibration curves for the enrichment fitted with the Freundlich model and (b) adsorption isotherms obtained from the Beer–Lambert law of benzonitrile and valeronitrile solutions using the modified ZrO2 coating. Calculated isotherm parameters for the calibration curves of benzonitrile and valeronitrile. aFreundlich fit χ2 value. bLangmuir fit χ2 value. cFreundlich constant. dFreundlich linearity index.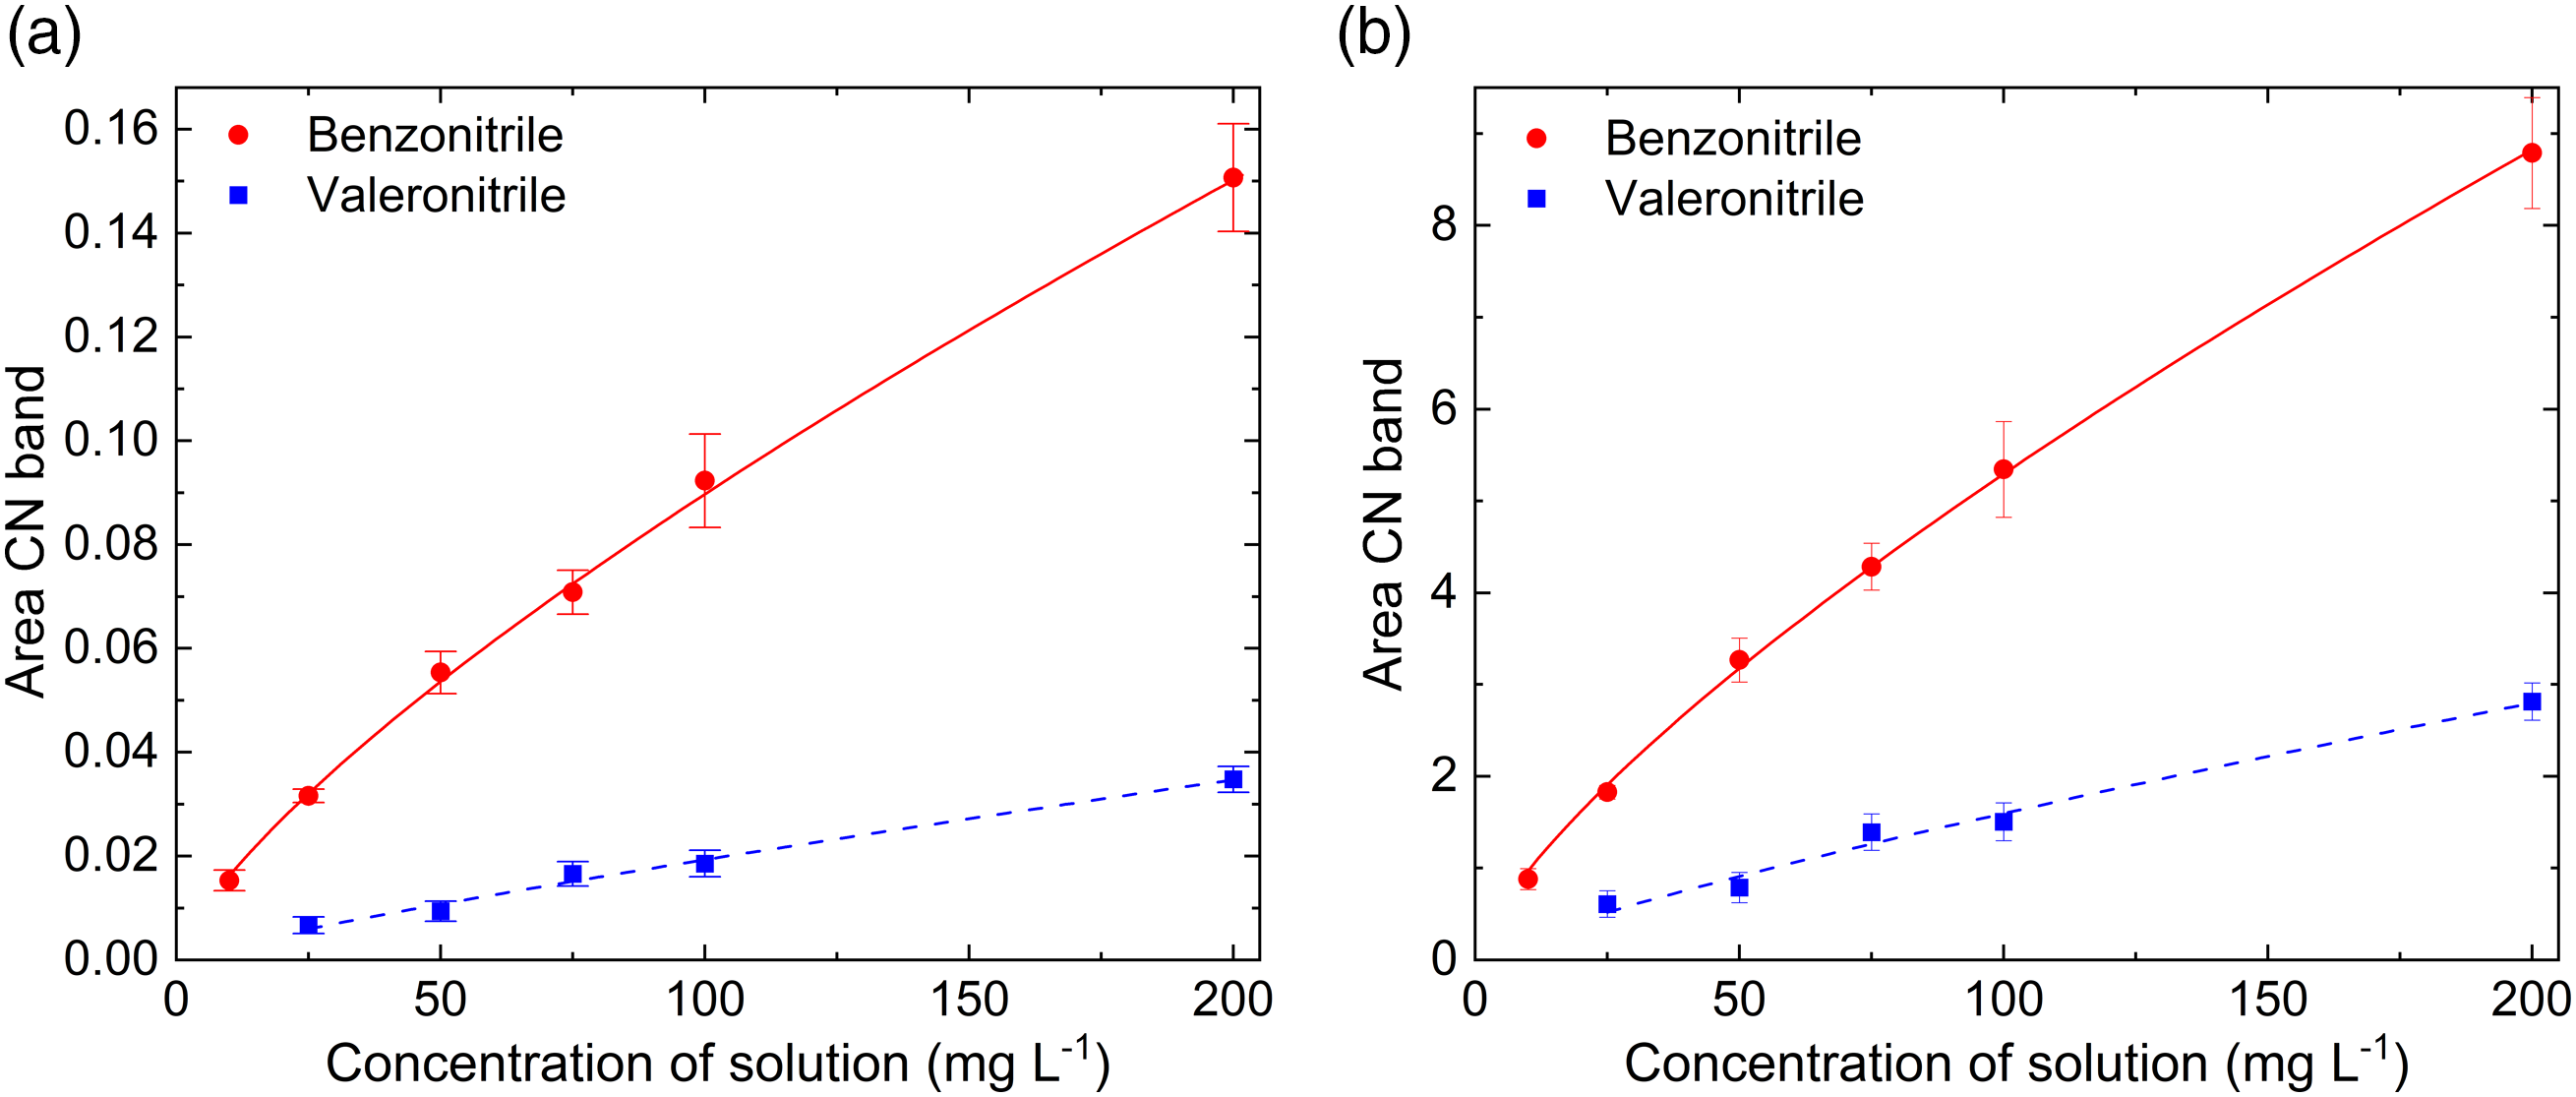


Translation of Infrared Absorbance to Absolute Concentrations
The theoretical considerations for the translation from IR absorbance to absolute concentrations have already been established. 13 In short, the effective path length de, which is defined as the IR identical absorbance that would be obtained from transmission measurements with the same path length and can be used for quantitative analysis, is scaled by the fraction of the evanescent field within the film to yield de,film.13,36 For the given film thickness of th = 237 nm, a fraction of the evanescent wave within the film of s = 0.67 was derived. With the refractive indices of the coating (n1 = 1.72, see Fig. S8 for refractive index spectrum of ZrO2) and the Si ATR crystal (n2 = 3.42), the angle of incidence (θ = 45°), number of active bounces N = 19 and the wavelength (λ0 = 4.45 µm, ν = 2247 cm–1 band position of νCN), a depth of penetration dp of 0.423 µm and an N × de,film of 19 × 0.661 µm = 7.82 µm are obtained.
The insertion of de,film into Beer–Lambert’s law allows to retrieve absolute analyte concentrations: A = c × de,film ×ε × N. Note that the thereby obtained analyte concentrations are given in the unit mass per film volume (mg cm–3, see Fig. 7b), which allows to directly compare the obtained absorption capacities with other typically employed gravimetric techniques. 13 Furthermore, the absolute mass of adsorbed analyte can be determined from the adsorbed nitrile concentration as the volume of the film is known by the film thickness and the size of the ATR crystal’s surface, resulting in a volume of 4.7 × 10⁻⁵ cm3. Applying these considerations to the IR absorbance values obtained from the nitrile adsorption, absolute nitrile masses of 0.25 and 0.07 µg analyte were adsorbed in the coating from 100 mg L–1 solutions of benzonitrile and valeronitrile, respectively. We denote the higher enrichment of benzonitrile compared to valeronitrile to the higher solubility of valeronitrile in water and hence lower affinity toward the apolar surface. 37
Figures of Merit of the Sensing System
With the previously obtained parameters, the limit-of-detection (LOD), defined as qe(LOD) = 3 × σ, with σ being the standard deviation derived from consecutive 100% lines, 13 and the enrichment factors were derived. With the parameters of the Freundlich isotherms in Table I and the noise floor of the measured signal of 10−3 cm−1, LODs of 1.0 and 11 mg L−1 were obtained for benzonitrile and valeronitrile, respectively, which are close the LODs obtained from mesoporous silica films of 1.5 and 6.6 mg L–1. Enrichment factors are calculated from the ratio of adsorbed analyte in the coating and the solution. For benzonitrile, an enrichment factor of 162 was calculated for the 10 mg L−1 solution, whereas an enrichment factor of 26 was obtained for the 25 mg L−1 solution of valeronitrile. Therefore, the phenyl-modified ZrO2 coating shows a higher enrichment for the aromatic nitrile. In comparison to the trimethyl–silane-modified mesoporous silica films of our previous study, the enrichment factor of valeronitrile is four times smaller. We attribute this reduction to a decrease in affinity of the aliphatic analyte towards the phenyl-modified ZrO2 and the higher solubility of valeronitrile in water. In addition, we find the same fast response time of <5 s as we reported for the mesoporous silica film which can be ascribed to the high porosity and hence ease of diffusion of the analytes into the enrichment film.
Conclusion
In this work, we present the synthesis and thorough characterization of mesoporous zirconia coatings combined with IR spectroscopy. The high thermal stability and strong chemical resistance to alkaline solutions was demonstrated using XRD and FT-IR spectroscopy. Application of this coating as enrichment layers on ATR crystals allow in situ monitoring of adsorption/desorption processes using ATR FT-IR spectroscopy. This technique allows to directly access qualitative and quantitative information of the analyte molecules. The broad range of commercially available silanes allows for a wide range of possible surface modifications, which can be used to direct the selectivity toward specific analytes. In this work, the surface of the mesoporous zirconia layer was modified with phenyl moieties for increased sensitivity to aromatic and aliphatic analytes. Benzonitrile and valeronitrile in water were used as model analytes to evaluate the enrichment performance of the film. Even though only small film thicknesses were obtained after calcination, there could be obtained very high enrichment factors for benzonitrile (162) and moderate enrichment factors for valeronitrile (26).
Alternatively, also the pristine zirconia layer can be employed for enrichment of ionic species. In this context, a cationic species of interest is CTAB, which is a frequently used corrosion inhibitor of steel and therefore of great importance in chemical industry. Anionic species that are in the focus of our future research include sulfates and phosphates. Removal of phosphate from wastewater is in the general focus of research due to its contribution to eutrophication. For both of these anionic analytes, the characteristic IR absorption bands are located at approx. 1200 cm–1, so for these applications, the use of mesoporous zirconia enrichment layers is highly beneficial as opposed to, for example, mesoporous silica layers due to higher spectral accessibility in the low wavenumber region.
Supplemental Material
sj-pdf-1-asp-10.1177_00037028211057156 - Supplemental material for Mesoporous Zirconia Coating for Sensing Applications Using Attenuated Total Reflection Fourier Transform Infrared (ATR FT-IR) Spectroscopy
Supplemental material, sj-pdf-1-asp-10.1177_00037028211057156 for Mesoporous Zirconia Coating for Sensing Applications Using Attenuated Total Reflection Fourier Transform Infrared (ATR FT-IR) Spectroscopy by Dominik Wacht, Mauro David, Borislav Hinkov, Hermann Detz, Andreas Schwaighofer, Bettina Baumgartner and Bernhard Lendl in Applied Spectroscopy
Footnotes
Acknowledgments
We acknowledge the CzechNanoLab Research Infrastructure supported by MEYS CR (LM2018110) for the expert technical assistance. Si wafers were provided by the IMEC research group at Ghent University. Si-ATR crystals were prepared at the USTEM sample preparation laboratory at TU Wien. X-ray diffraction measurements were performed at the XRC at TU Wien.
Declaration of Conflicting Interests
The author(s) declared no potential conflicts of interest with respect to the research, authorship, and/or publication of this article.
Funding
The author(s) disclosed receipt of the following financial support for the research, authorship, and/or publication of this article: This work is part of the Hydroptics project, which has received funding from the European Union’s Horizon 2020 research and innovation program under the grant agreement No 871529. This project is an initiative of the Photonics Public Private Partnership. Parts of this work were supported by the Austrian Science Fund (FWF) Meitner Program (M2485-N34). Further financial support has been received from the COMET Center CHASE (project No 868615), which is funded within the framework of COMET (Competence Centers for Excellent Technologies) by BMVIT, BMDW, and the Federal Provinces of Upper Austria and Vienna. The COMET program is run by the Austrian Research Promotion Agency (FFG).
Supplemental Material
All supplemental material mentioned in the text is available in the online version of the journal.
References
Supplementary Material
Please find the following supplemental material available below.
For Open Access articles published under a Creative Commons License, all supplemental material carries the same license as the article it is associated with.
For non-Open Access articles published, all supplemental material carries a non-exclusive license, and permission requests for re-use of supplemental material or any part of supplemental material shall be sent directly to the copyright owner as specified in the copyright notice associated with the article.