






Abstract
Mass spectrometry (MS) is a powerful chemical analysis technique and one of the leading approaches that allows the identification and quantification of thousands of different components via a highly sensitive manner. However, assignment of unknown peaks in a mass spectrum to specific fragments is still a labour-intensive and costly task. Although various approaches and numerous software platforms have been developed, the automatic assignment of unknown peaks remains an unsolved problem. Based on the self-orthogonality of the Hilbert–Noda matrix extensively used in the field of 2D correlation spectroscopy, we develop a new method to generate an auxiliary spectrum to highlight peaks for the fragments containing stable isotopes via the characteristic pattern of the peaks for the isotopologues in the mass spectra. To address the problem of coincidental orthogonality, a modified approach using the second-order Hilbert–Noda matrix is proposed. Moreover, a statistical approach is adopted to suppress the appearance of false-positively highlighted peaks in the auxiliary spectra. The effectiveness of the approach has been showcased in the analysis of the mass spectra of 1,2-dibromoethane and chloroform. Unknown peaks of fragments containing different numbers of bromine or chlorine atoms can be successfully identified.
This is a visual representation of the abstract.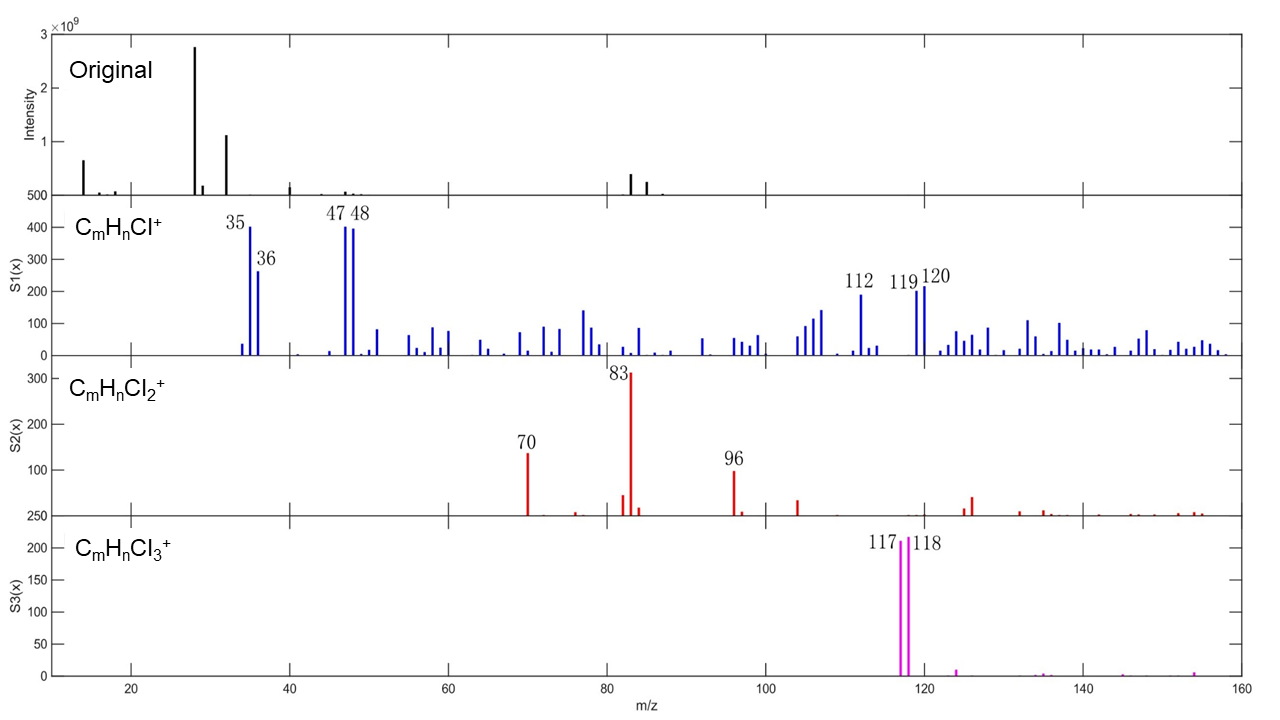
Introduction
Mass spectrometry (MS) is a powerful chemical analysis technique that ionizes, separates, and detects various molecules and fragments. Over a century, numerous revolutionary improvements have been incorporated into MS. Currently, MS has become one of the leading approaches that allows the identification and quantification of thousands of different components in a given sample in a highly sensitive manner.1–3
Therefore, applications of MS continue to expand across various fields, showcasing its importance in enhancing scientific understanding and addressing real-world challenges. In chemistry, materials sciences, and life sciences, MS serves as a fundamental analytical tool to elucidate the structures of organic compounds, biological molecules, coordination complexes, and polymeric materials.4–9 Additionally, MS supports research in developing new materials and innovative processes. Biological and biomedical research heavily rely on MS to identify proteins, peptides, and metabolites in complex biological samples,10–14 thereby facilitating the revelation of metabolic pathways. Thus, MS investigations promote progress in better understanding of disease mechanisms, biomarker discovery, and new drug development.15–18 MS addresses pressing issues in the field of environmental monitoring. The technique can detect and monitor trace amounts of contaminants in air, water, and soil, which pose risks to both human health and ecosystems. The analytical capability allows for better environmental assessment and regulatory compliance, promoting sustainability and safety.19–22 In industries such as pharmaceuticals, agriculture, and food production, MS boosts efficiency and reliability via monitoring raw materials, validating formulations, and ensuring consistent production quality.23,24
Although modern advanced MS experimental techniques make it possible to obtain an MS spectrum with high accuracy and high precision, data analysis in mass spectroscopy still poses a severe challenge. The central task in the analysis is the assignment of the peaks in the MS spectra, i.e., to translate the m/z values of the observed peaks into the corresponding molecular formulae of the fragments. Manual peak assignment for complex spectra is labour-intensive and costly, both in terms of time and investment. In fact, getting a successful assignment of a single peak from a given MS spectrum requires complicated calculations and a sophisticated understanding of versatile experimental evidence and relevant knowledge in the literature. In many cases, a sample may contain multiple components, and a large number of peaks need to be assigned. Many researchers find themselves overwhelmed by large datasets. The complexity is further intensified when considering high-resolution MS spectra, overlapping peaks, and isotopic patterns. Consequently, manual assignment of these unknown peaks becomes tedious work and represents a bottleneck of high-throughput analysis. To address the problem, various software that can perform assignment of the peaks in MS spectra via an automatic or semi-automatic manner have been developed.
Some software adopts a strategy of spectral library search. In this approach, an observed spectrum is queried against a library of mass spectra with known structures. Library search implies finding the reference mass spectrum that best matches the experimental one. 25 Compared with the huge amounts of compounds investigated, the limited size of the spectral library brings about a problem in the assignment. Moreover, it has been demonstrated that reliable library identifications can be achieved only when a spectrum is acquired under the same experimental conditions as the reference spectrum. 25 This problem becomes another hurdle for extensive application on the assignment via spectral library search.
Another method is firstly to use some assigned peaks (via manual assignment or library search, or other methods) as reference peaks. Formula assignment for a series of homologous peaks can be found as mass differences associated with functional groups that exist between the reference peaks and unassigned peaks. For instance, Kendrick mass analysis (KMA) is a special case of this approach and uses CH2 groups as the only chemical and structural relationship between the reference peak and unknown peaks. However, this approach does not apply to every unknown MS peak. 1
The assignment of an unknown mass peak can be achieved by solving the corresponding Diophantine equation shown in Eq. 1.
26

Recently, some people have tried to use the artificial intelligence (AI) technique to perform the assignment of unknown peaks in mass spectra.29,30 Nevertheless, the method is still in its infancy.
Although numerous software techniques and various approaches have been developed,31–34,35–40 the automatic assignment of unknown peaks remains an unsolved problem.
In a mass spectrum, additional information, such as isotopic patterns,1,41 may provide an accessible way to extract more useful information that is important for assigning unknown peaks.
Many elements have two or more stable isotopes. As a result, a series of peaks that reflect the occurrence of isotopologues (molecules/fragments that differ in their isotopic composition) can be observed. Within the series of peaks of isotopologues, the differences in m/z values between different peaks are characteristic of the molecule/fragment containing the isotopic element in a high-resolution MS spectrum. 1 Thus, some software uses such differences to identify peaks containing specific isotopic elements.1,5,42–53 Moreover, the relative intensities among the different peaks of the isotopologues (isotopic distribution), which are relevant to the natural abundance of isotopes and the chemical composition of the molecule/fragment containing the isotopic element, are also characteristic. In many cases, isotopic distributions involve multiple peaks with complex profiles. It is not a straightforward task to identify a complex isotopic distribution from a complicated mass spectrum. Under this situation, many people use the information of isotopic distribution as a verification tool after the assignment of unknown peaks is obtained. 5 That is to say, the potential of characteristic isotopic distribution on the assignment of unknown peaks in mass spectra has not been fully explored. Only recently, Lebedev and his co-workers proposed an isotopic distribution brute force approach for the identification of inorganic ions. However, such a work was only applied to special inorganic complexes. 53
Two-dimensional correlation spectroscopy (2D-COS) is a powerful spectroscopic analysis technique.54–58 Since it was proposed by Noda, 2D -COS has attracted extensive interest and wide application in various research fields.59–67 Many nuanced spectral features, which are difficult to find in the original spectra, can be clearly visualized from the cross peaks in the resultant 2D correlation spectra. A characteristic feature of 2D-COS is that a Hilbert–Noda matrix,
57
which is used in the generation of a 2D asynchronous spectrum, possesses the following self-orthogonality property: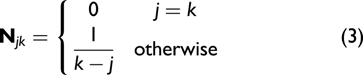

The self-orthogonality of the Hilbert–Noda matrix provides sensitive and powerful tools to excavate or manipulate important and characteristic patterns covered by a complex background in various data sets.59,60,68–71 As a result, many advanced analytical techniques can be developed. For example, the self-orthogonality properties of the Hilbert–Noda matrix are useful to remove the spectral signal that is irrelevant to intermolecular interaction. As a result, a series of methods have been developed and used to reveal subtle spectral variation caused by intermolecular interaction.68–71 Moreover, this basic property of the Hilbert–Noda matrix is useful to retrieve 1D spectra of pure components from a mixture, even if different components cannot be separated.72–77
Herein, an approach based on the self-orthogonality of the Hilbert–Noda matrix is proposed to assign unknown peaks according to the corresponding characteristic isotopic distribution. Mathematical analysis has been performed to illustrate why the new approach works. Moreover, this approach has been applied to real-world mass spectra (1,2-dibromoethane and chloroform). Peaks for fragments containing different numbers of chlorine atoms and different numbers of bromine atoms can be successfully identified.
Experimental
Reagents
1,2-dibromoethane (CP grade) was obtained from Shanghai Chemical Reagent Station Central Chemical Factory. Chloroform, high-performance liquid chromatography (HPLC) grade, was purchased from Beijing Tong Guang Fine Chemicals Company.
Instruments
In thermogravimetric analysis-mass spectrometry (TGA-MS) experiments, the mass spectra of 1, 2-dibromoethane and chloroform have been measured on a TGA quadrupole mass spectrometer (TGA-8000, Clarus SQ8 T, Perkin Elmer). In the experiment, the temperature of the samples was elevated at a rate of 20 °C min−1 and high-purity N2 at a flow rate of 20 mL/min and 40 mL/min were used as sample and balance purging gas, respectively. The emitted gas of the samples was transferred to the Quadrupole Mass spectrometer via high-purity N2. The mass spectra of the sample were measured under an EI mode, and the total ion chromatograms (TIC) of each sample were recorded. The mass spectra obtained via this experiment are low-resolution spectra, and the difference in the mass-to-charge ratio (m/z) between adjacent data points is 1.
The high-resolution GC-MS of 1,2-dibromoethane was performed on a Hybrid Quadrupole-Orbitrap GC-MS System (Q-Exactive GC, Thermo). The data acquisition software was TraceFinder 5.0, and the data analysis software was Xcalibur 4.0. The samples were injected into a TG-5HT, 30 m × 0.25 µm GC column for chromatography, the flow rate was 1.0 mL/min of helium, and the temperature gradient was set as 40 °C for 2 mins; to 350 °C at 15 °C/min and held for 2.25 mins. The injector was heated to 250 °C and was on split mode with a split ratio of 1:10. Electron ionization (EI)-MS spectra were collected at 70 eV.
Data Processing
The assignment of some unknown peaks in mass spectra was accomplished via programs written by our group using the Matlab platform.
Results and Discussion
An Approach to Assigning Unknown Peaks to a Molecule/Fragment Containing Isotopic Elements with a Specific Composition
Herein, we use a fragment containing three chlorine atoms (RCl3+) as an example to describe the basic idea of the approach in this paper. Chlorine has two stable isotopes (35Cl and 37Cl). As a result, four isotopologues are produced:
A fragment containing three 35Cl atoms. The formula and the nominal m/z value of this species are R35Cl3+ and M, respectively. A fragment containing two 35Cl atoms and a 37Cl. The formula and the nominal m/z value of this species are R35Cl237Cl+ and M + 2, respectively. A fragment containing a 35Cl atom and two 37Cl atoms. The formula and the nominal m/z value of this species are R35Cl37Cl2+ and M + 4, respectively. A fragment containing three 37Cl atoms. The formula and the nominal m/z value of this species are R37Cl3+ and M + 6, respectively.
Based on the above result, a characteristic vector to describe the theoretical intensities of the four isotopologues based on the natural abundance of the isotopes of 35Cl/37Cl and the chemical composition of RCl3+ is constructed as Eq. 4.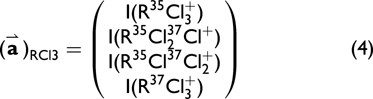
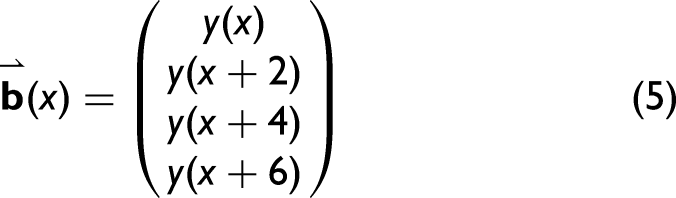
Via vector

For a specific x = m0, if the profiles of


As shown in Eq. 6, |(

Thus, (


The module
Concerning the auxiliary spectrum, the following issues need to be discussed:
When the module of If
To address this problem, a modified auxiliary spectrum is generated via the following procedure.
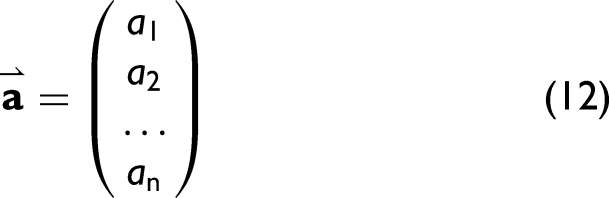
The n-dimensional characteristic vector

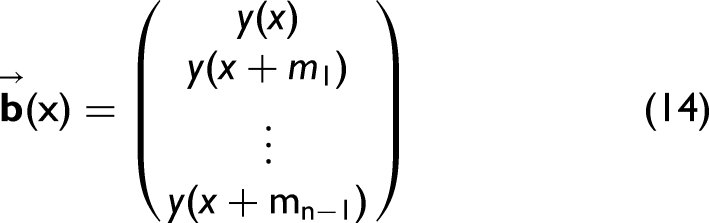
The n-dimensional testing vector

The modified auxiliary spectrum is calculated via Eq. 16.
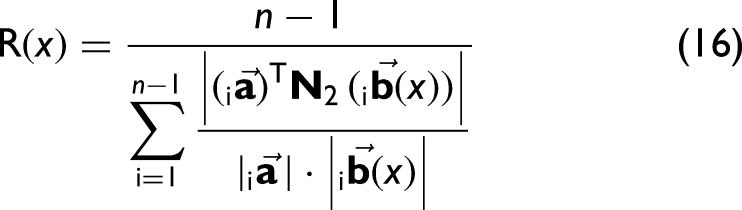

The reason we use Eq. 16 to construct the modified auxiliary spectrum is based on the following consideration:
When both i
Based on the above consideration, we try to use the auxiliary spectra generated via Eq. 6 and Eq. 16 to identify unknown peaks from fragments containing bromine atom/atoms in the mass spectrum of 1,2-dibromoethane (CH2BrCH2Br).
The mass spectra of 1,2-dibromoethane were obtained from a TGA-MS experiment. In the experiment, 3230 mass spectra were acquired. Figure 1 presents the obtained 3230 mass spectra via a contour map.
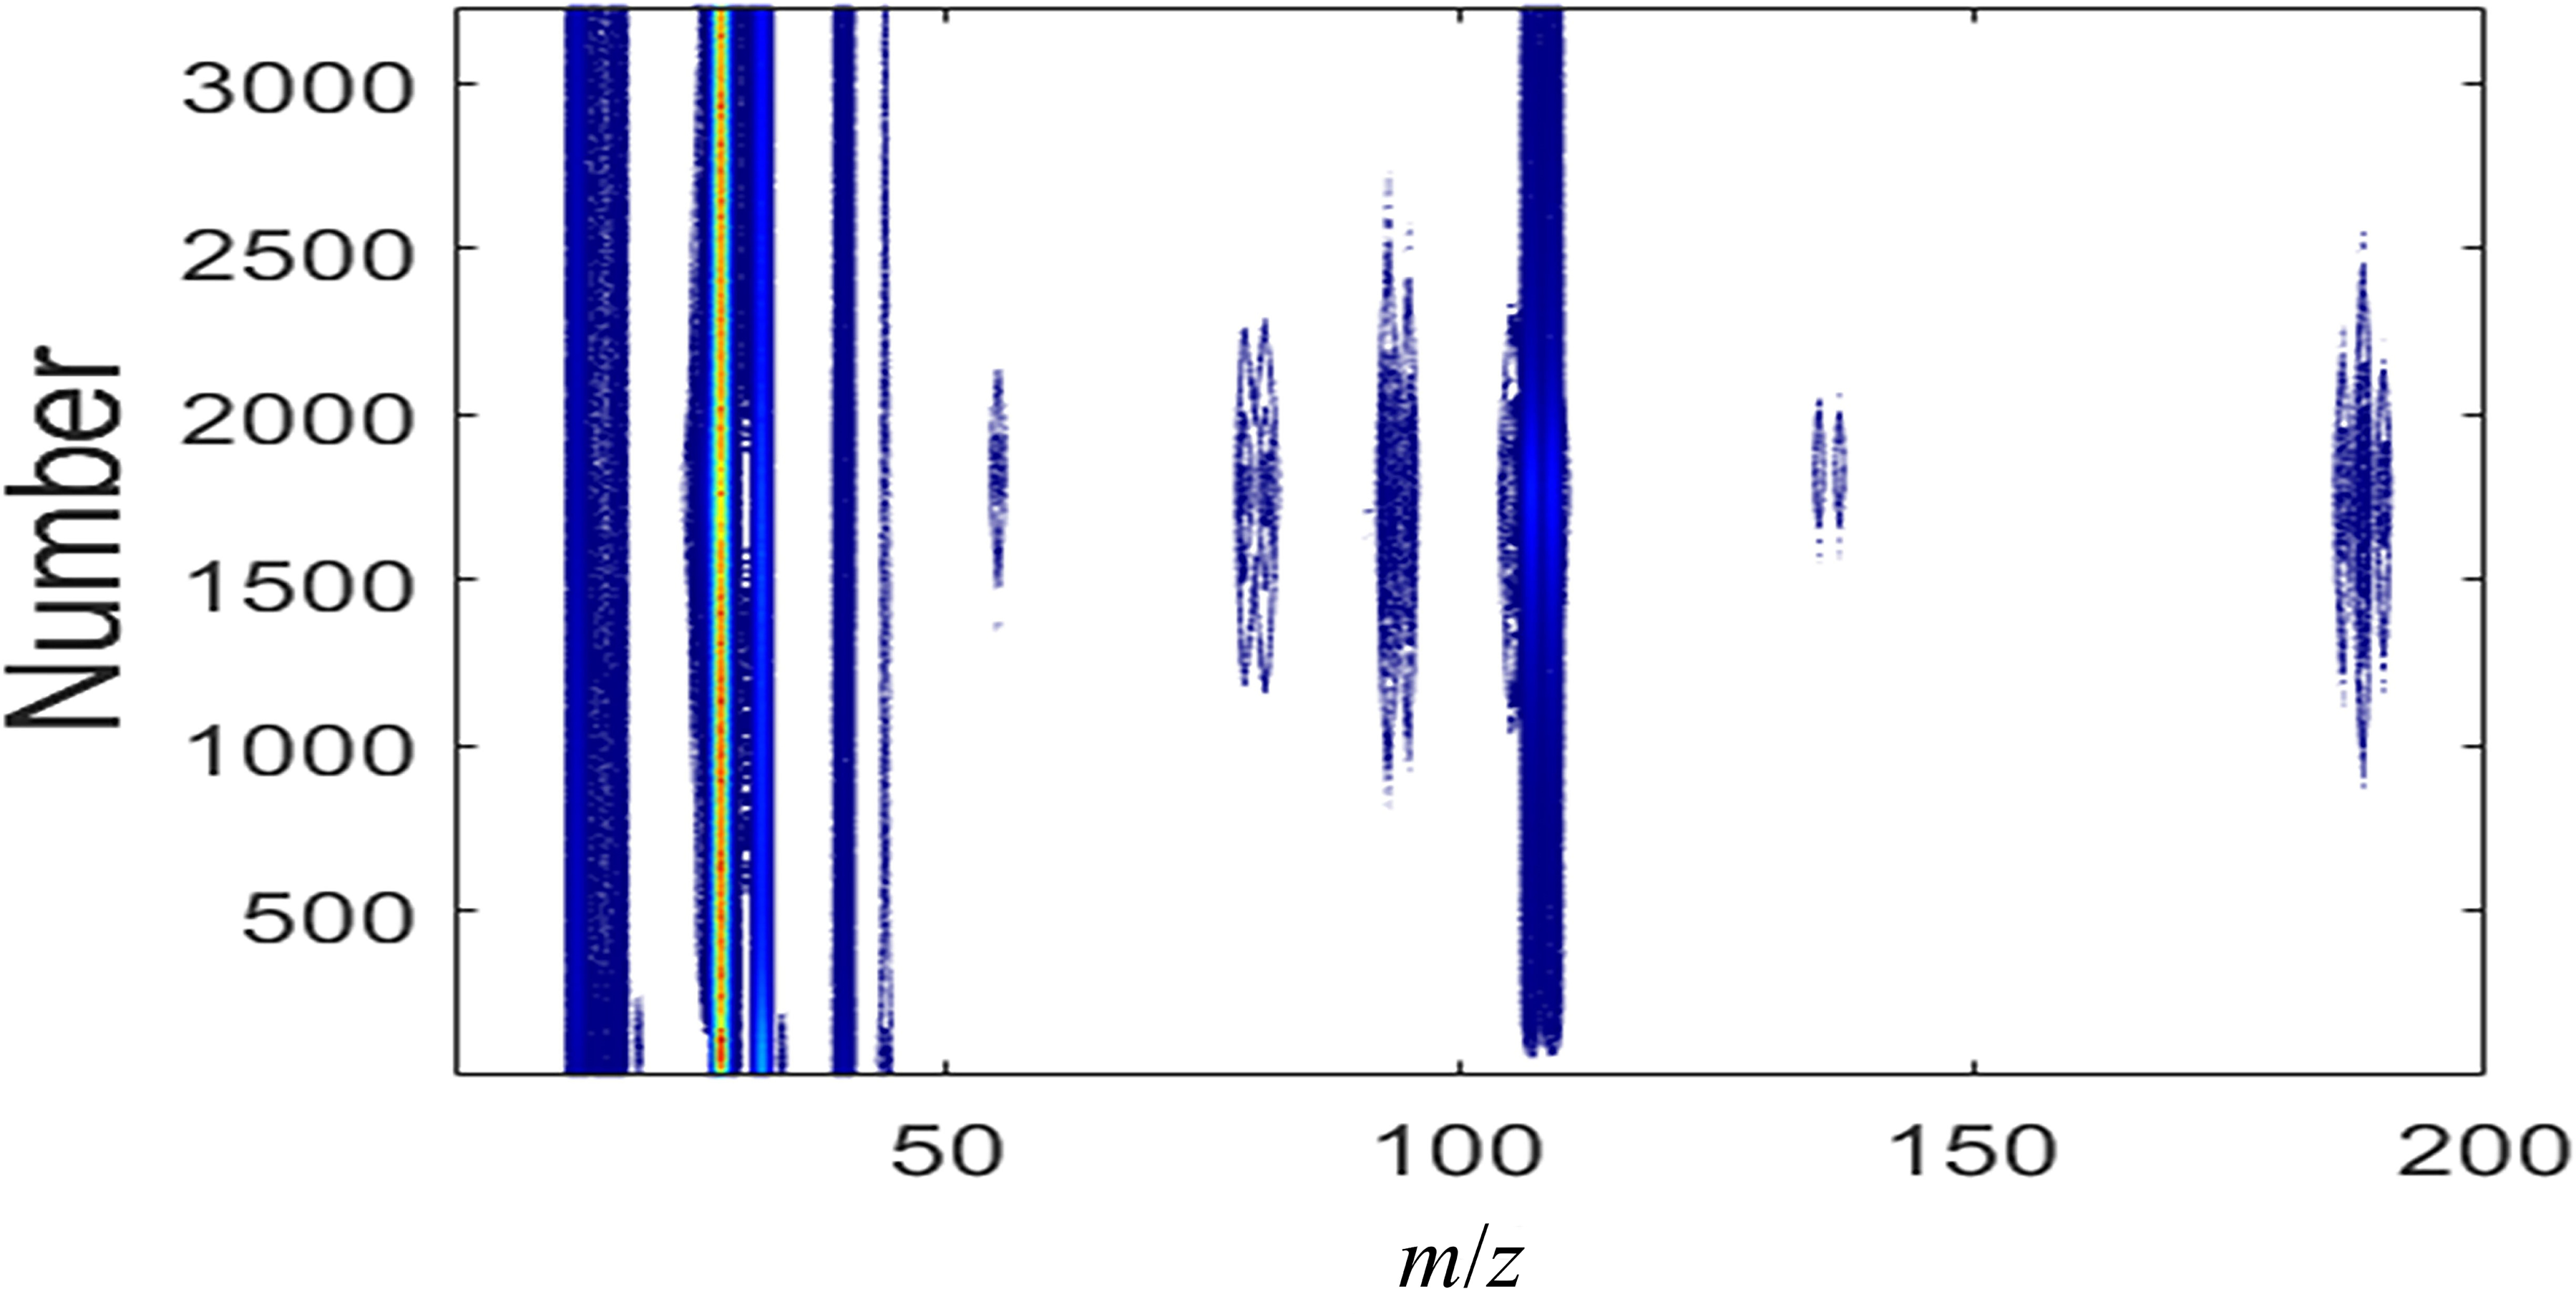
A contour map of the 3230 mass spectra obtained from the TGA-MS experiment.
Herein, we try to use the auxiliary spectra generated via Eq. 6 and Eq. 16 to identify the peaks of fragments containing different amounts of bromine atoms.
Identification of Fragments Containing a Single Bromine Atom
Figure 2a is a typical auxiliary spectrum of 1,2-dibromoethane. From the experimental result, we have never found any peak whose m/z value is larger than 200. Figure 2a only focuses on the mass spectrum whose m/z values are below 200.
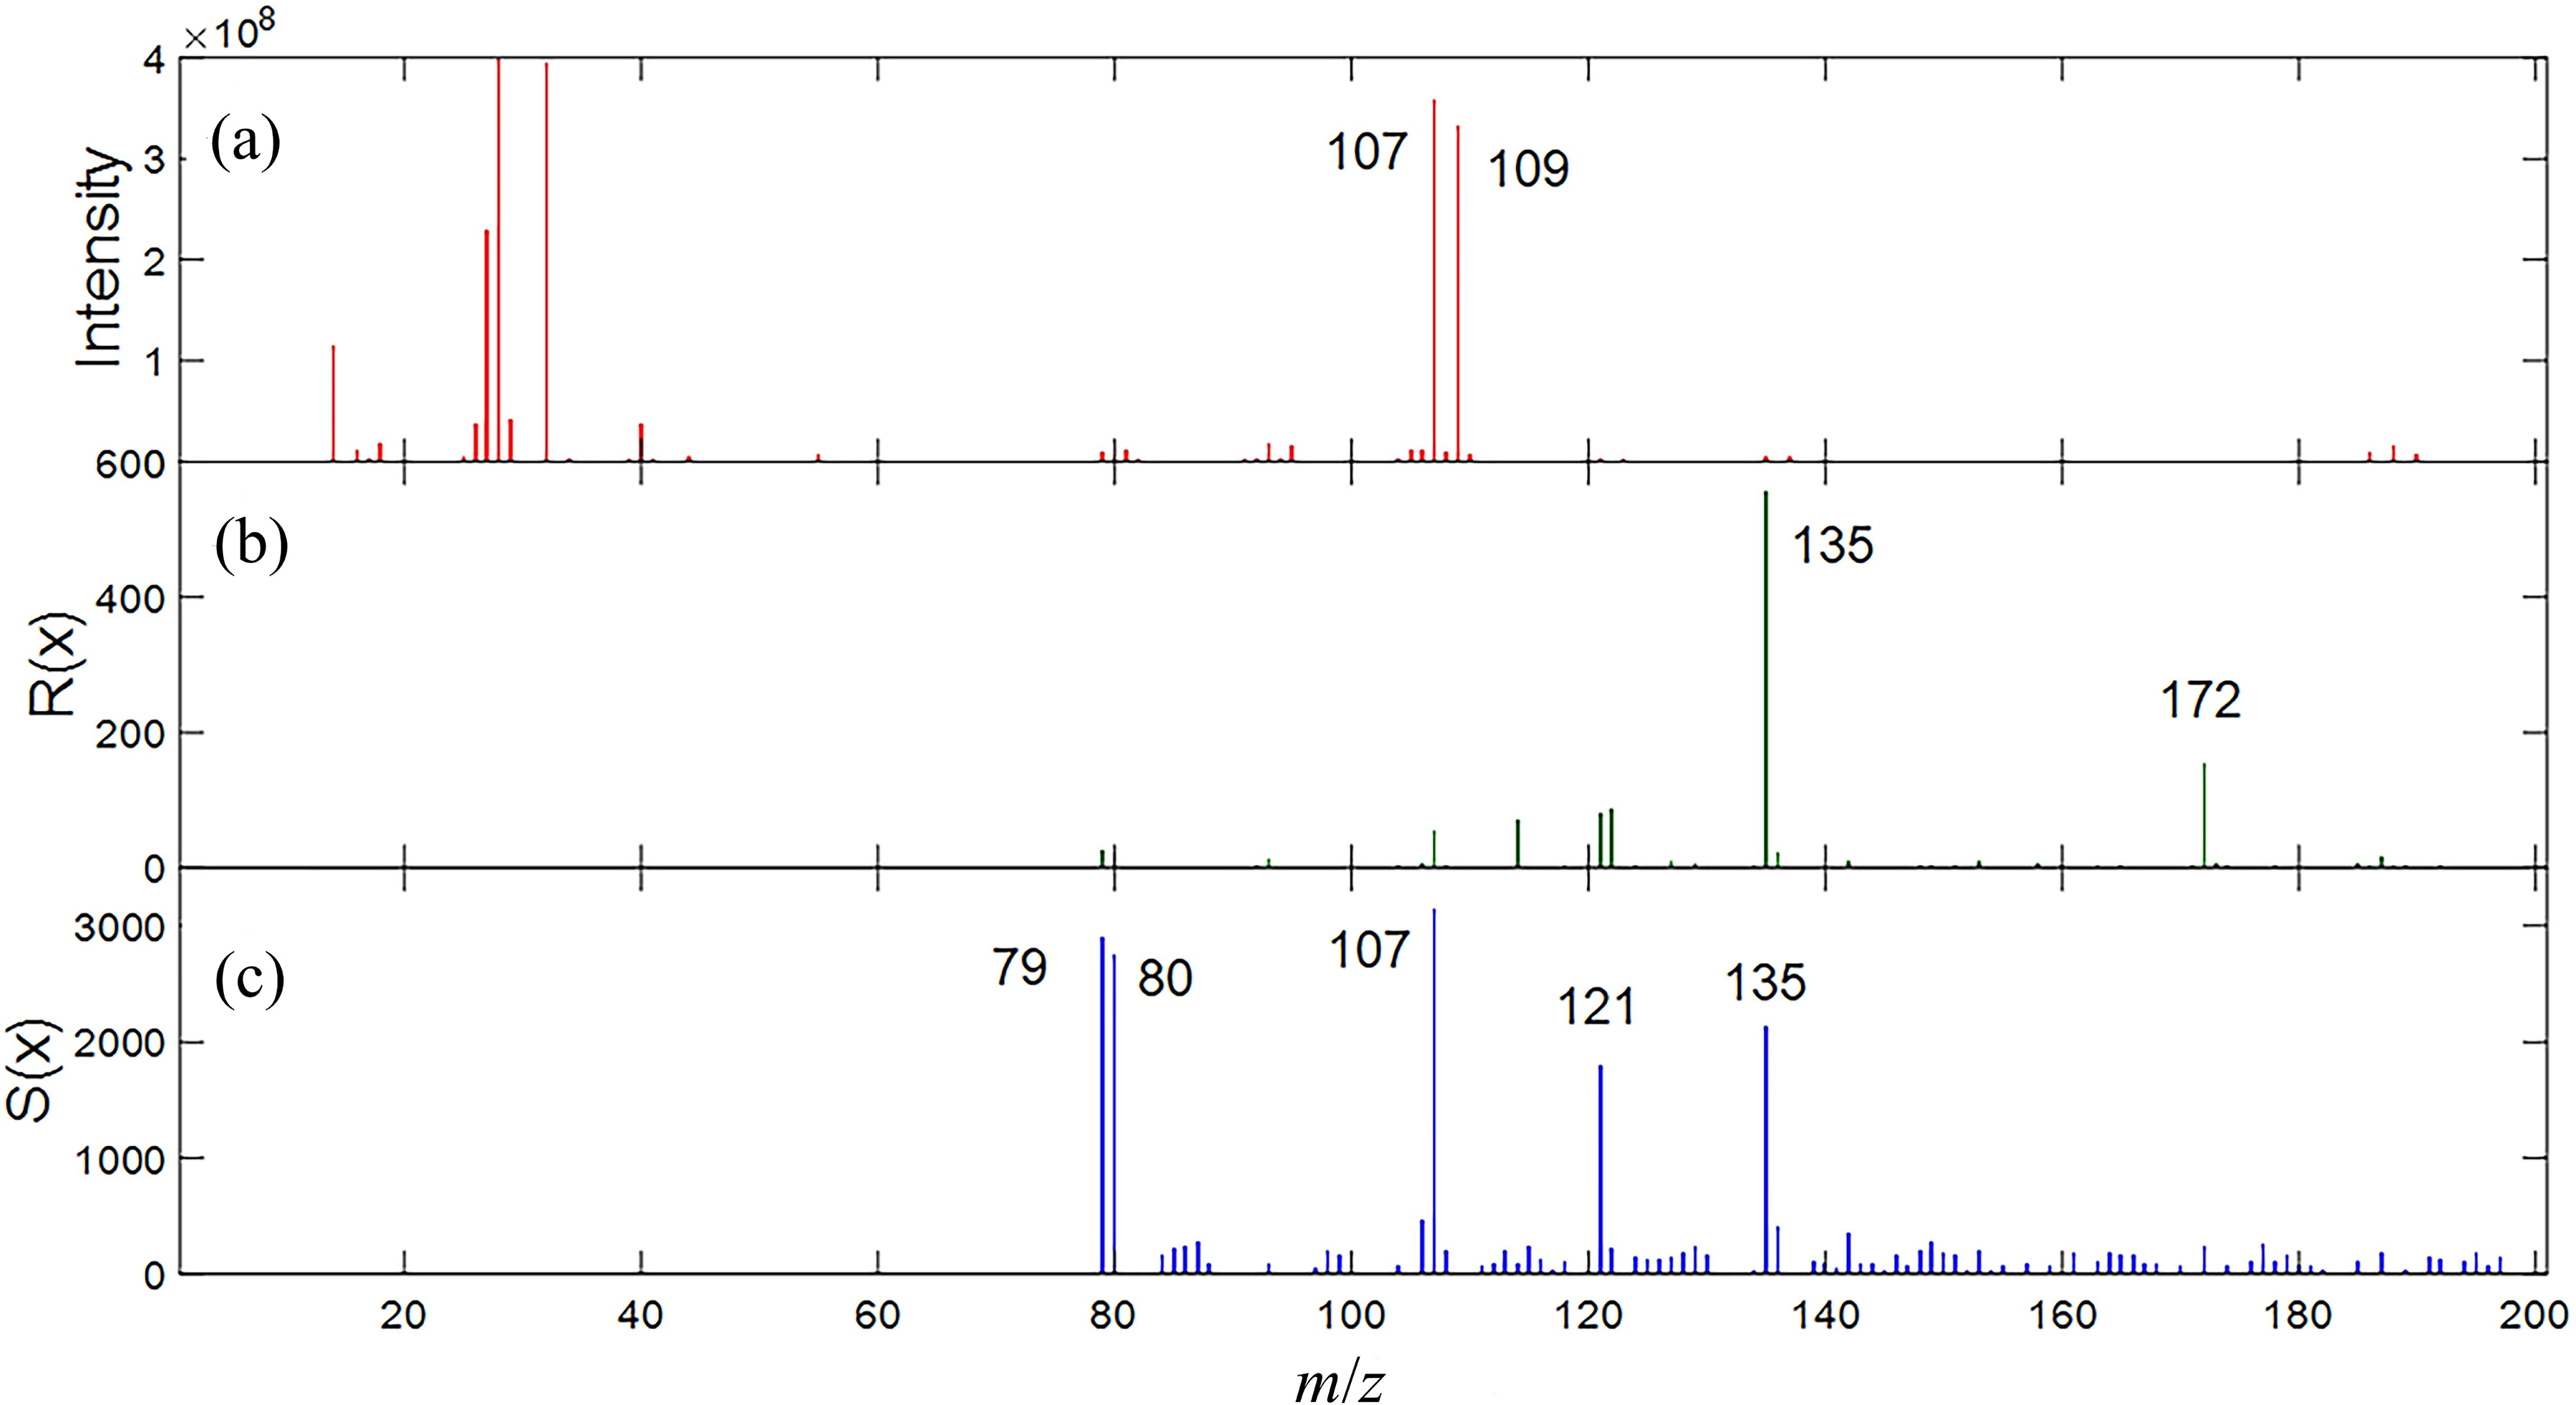
(a) A typical auxiliary spectrum of 1,2-dibromoethane obtained from the TGA-MS experiment. (b) An auxiliary spectrum generated via Eq. 6 to highlight the peaks for possible fragments of CmHnBr+. (c) The corresponding statistically auxiliary spectrum obtained from the 3230 auxiliary spectra.
Firstly, we try to identify the fragments containing a single bromine atom. Bromine has two stable isotopes (79Br and 81Br). The corresponding isotopologues are (CmHn79Br+ and CmHn81Br+). Since the nominal mass difference between CmHn79Br+ and CmHn81Br+ is 2, the corresponding nominal m/z values for CmHn79Br+ and CmHn81Br+ are M and M + 2, respectively.
It should be pointed out that CmHnBr+ contains carbon atoms and hydrogen atoms, which also have stable isotopes (12C, 13C for a carbon atom and 1H, 2H for a hydrogen atom). Thus, the contributions from the isotopologues, including 12Cm-213C21Hn79Br+, 12Cm-113C11Hn-12H179Br+, and 12Cm1Hn-22H279Br+, which have contributions to the peak whose m/z value is M + 2, should also be considered.
However, the natural abundances of 2H and 13C are significantly lower than those of 1H and 12C. Moreover, the maximal number of carbon atoms in the fragment containing a single Br atom is less than five in the mass spectrum of 1,2-dibromoethane. In Section 1 of the Supplemental Material, we have calculated the contents of 12Cm-213C21Hn79Br+, 12Cm-113C11Hn-12H179Br+, and 12Cm1Hn-22H279Br + . The calculation results demonstrate that the contents of 12Cm-213C21Hn79Br+, 12Cm-113C11Hn-12H179Br+, and 12Cm1Hn-22H279Br+ are very low compared with CmHn79Br+ and CmHn81Br + . Thus, the spectral contribution of 12Cm-213C21Hn79Br+, 12Cm-113C11Hn-12H179Br+, and 12Cm1Hn-22H279Br+ can be safely neglected, and CmHn79Br+ and CmHn81Br+ are the dominant species among the possible isotopologues. According to the analysis presented in Section 2 of the Supplemental Material, we have:

Then, we try to generate an auxiliary spectrum to help us to identify fragments containing a single bromine atom. Since both
Fortunately, both TGA-MS and GC-MS experiments produce multiple mass spectra. This experimental setup provides a chance to address the problem that highlighted peaks in an auxiliary spectrum actually originated from accidental orthogonality caused by noise. Herein, the following statistical approach has been adopted.
We generate an auxiliary spectrum for each of the 3230 original mass spectra. For every m/z value (denoted as x), a statistical function S(x) is generated. For each given mass-to-charge ratio (x), the value of S(x) is the number of auxiliary spectra whose R(x) value is larger than a given threshold (herein, the threshold is tentatively set as 20). The selection of the 20 as a threshold is based on the following consideration: according to Eq. 6 and Eq. 16, the better the match between the pattern of
For convenience, the S(x) is called the statistically auxiliary spectrum hereafter in this manuscript. The resultant S(x) for CmHnBr+ is displayed in Figure 2c. We notice that some peaks, which are weak in R(x) shown in Figure 2b, become quite strong in S(x) shown in Figure 2c. For example, the peak at m/z = 79, which is quite weak in Figure 2b, turns out to be a dominant peak in Figure 2c. On the other hand, the peak at m/z = 172 is quite strong in Figure 2b, while the peak at m/z = 172 turns out to be buried in the background in Figure 2c. The statistical nature of the result shown in Figure 2c can effectively suppress the possibility that these peaks are originated from coincidental self-orthogonality. Thus, we believe the peaks highlighted in Figure 2c are reliable and indeed originated from fragments containing a single bromine atom. In Figure 2c, five peaks (the m/z values of these peaks are: 79, 80, 107, 121, and 135) are highlighted in at least 1500 auxiliary spectra.
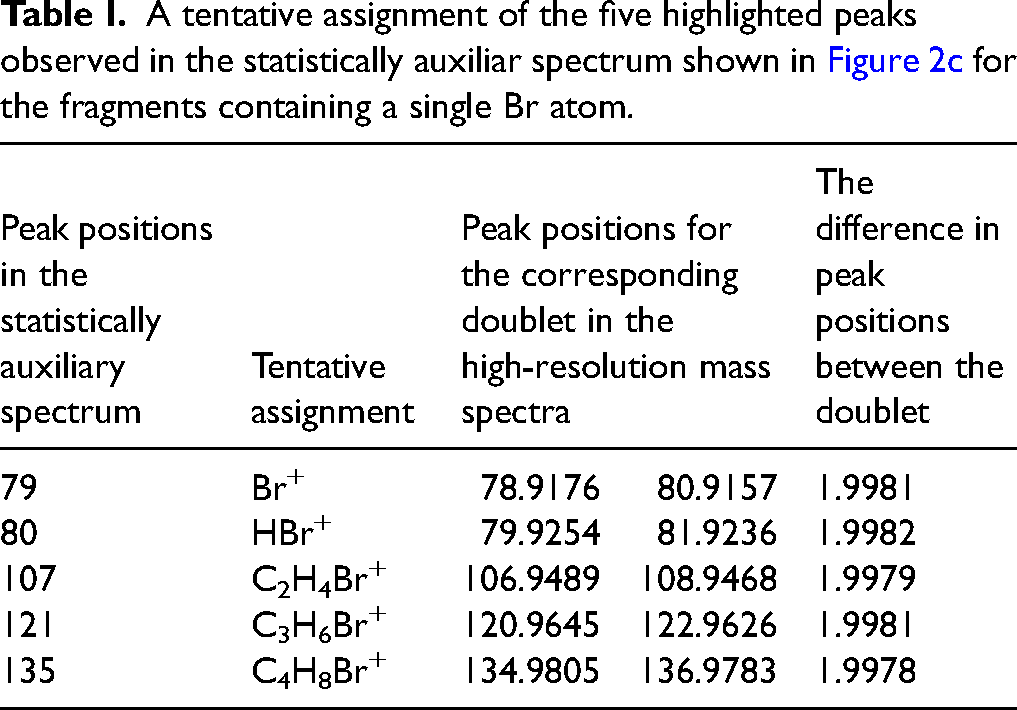
According to the above results, a tentative assignment on the above five peaks is proposed, and the assignments are listed in Table I.
A tentative assignment of the five highlighted peaks observed in the statistically auxiliar spectrum shown in Figure 2c for the fragments containing a single Br atom.
Wu et al. have investigated the mass spectra of 1,2-dibromoethane under an intense femtosecond laser.78,79 In these investigations, they have observed the mass peaks arising from Br+, whose m/z is 79, and C2H4Br+, whose m/z value is 107. These results support our assignment of the two highlighted peaks, whose m/z values are 79 and 107 in Figure 2c.
To validate the above results, the following experiments are carried out: We have recorded the mass spectra of 1,2-dibromoethane via GC coupled with high-resolution mass spectra. Firstly, we examine the mass spectra obtained from the elution peak of 1,2-dibromoethane. The highlighted peak in Figure 2c at m/z = 107 corresponds to the doublet at m/z = 106.948989 and m/z = 108.946758 in the high-resolution mass spectrum. The mass difference between the doublet is 1.997769, which matches the mass difference between 79Br and 81Br perfectly. This result confirms that the fragments for the highlighted peak at m/z = 107 in Figure 2c indeed contain a single bromine atom. Moreover, the exact mass of the peaks whose m/z are 106.9490 and 108.9468 confirms that the two peaks can be safely assigned to C2H479Br+ and C2H481Br+, respectively. The above results support the assignment of the peak whose m/z is 107 in Figure 2c as a fragment of C2H4Br + . Via a similar manner, the peaks whose m/z are 79 and 80 are confirmed to be from Br+ and HBr+ fragments.
Then, we come to the highlighted peak at 121 and 135 in Figure 2c. In the mass spectra obtained from the elution peaks of 1, 2-dibromoethane, we cannot find the doublets corresponding to the highlighted peak around 121 and 135. We have also queried the database of high-resolution spectra. From the records of the mass spectra of 1,2-dibromoethane, no peaks at 121 and 135 are observed. The above results clearly indicate that the two peaks are not from the fragments of 1,2-dibromoethane. From the tentative assignment listed in Table I, the peaks may arise from C3H6Br+ and C4H8Br+, respectively. The assignments suggest the fragments are produced by merging different fragments in the EI process. However, such events can hardly take place in a high-vacuum environment.
Thus, we need to explain why the peaks at 121 and 135 are clearly observed in Figure 2c. As a matter of fact, more than 2000 highlighted peaks at 121 and 135 are found in the 3230 auxiliary spectra. When we examined the GC/high-resolution data of 1,2-dibromoethane, the doublets for the highlighted peaks at 121 and 135 are indeed found. The mass difference between the doublet and the exact mass of these peaks supports that the two peaks at 121 and 135 in Figure 2c are originated from C3H6Br+ and C4H8Br+, respectively. However, the fragments are not produced from the eluted peak of 1, 2-dibromoethane from the GC process, but arise from low-abundance impurities in the sample. Thus, the identified peaks at 121 and 135 via the approach described in this paper really belong to the fragments C3H6Br+ and C4H8Br+ originated from the impurity of the 1,2-dibromoethane sample.
In the work on the mass spectra of 1,2-dibromoethane, Wu et al.78,79 demonstrated that a fragment of CH2Br+ whose m/z value is observed is 93 in the mass spectrum. Such a fragment contains a single bromine atom, and the peak for this fragment should be highlighted in the auxiliary spectrum shown in Figure 2b. However, the peak at 93 was not observed in Figure 2b. In the corresponding results of statistical analysis (S(x)) shown in Figure 2c, the peak at 93 was not highlighted, either. Figure S2 (Supplemental Material) displays the histogram of R(93) of the 3230 auxiliary spectra. The values of most mass spectra are below the threshold (the value of the threshold is set as 20). This is the reason the peak at 93 was not highlighted in the auxiliary spectra in Figure 2c. To find why the values of R(93) are not high enough, we examined the original mass spectra. Some typical mass spectra are present in Figure S3. In these mass spectra, the peaks at 93 and 95 are present. However, the peaks at 93 are stronger than the peak at 95. The values of y(93)/y(95) are larger than 120%. That is to say, the corresponding
Identification of Fragments Containing Two Bromine Atoms
Subsequently, we try to identify fragments containing two bromine atoms (The formula of the fragment is CmHnBr2+) from the mass spectrum. The corresponding isotopologues are (CmHn79Br2+, CmHn79Br81Br+, and CmHn81Br2+). The corresponding m/z values for CmHn79Br2+, CmHn79Br81Br+, and CmHn81Br2 + are M, M + 2, and M + 4, respectively.
Carbon atoms and hydrogen atoms also have stable isotopes. Thus, isotopologues containing multiple 13C, 2H atoms may also have a spectral contribution to the peaks whose m/z are M + 2 and M + 4. Here, the situation of 2H and 13C is similar to the discussion for fragments containing one bromine atom in 1 of the Supplemental Material. The spectral contribution from isotopologues containing multiple 13C, 2H atoms can be safely neglected.
In this case, we only need to consider the following three isotopologues: CmHn79Br2+, CmHn79Br81Br+, and CmHn81Br2+. The natural abundance of 79Br and 81Br is, respectively, a(79Br) = 0.5069 and a(81Br) = 0.4931. Thus, the percentage of CmHn79Br2+ fragment can be calculated as 
Then, we try to use the auxiliary spectra to identify fragments containing two bromine atoms in the mass spectrum. For comparison, Figure 3a presents a typical mass spectrum of 1,2-dibromoethane.
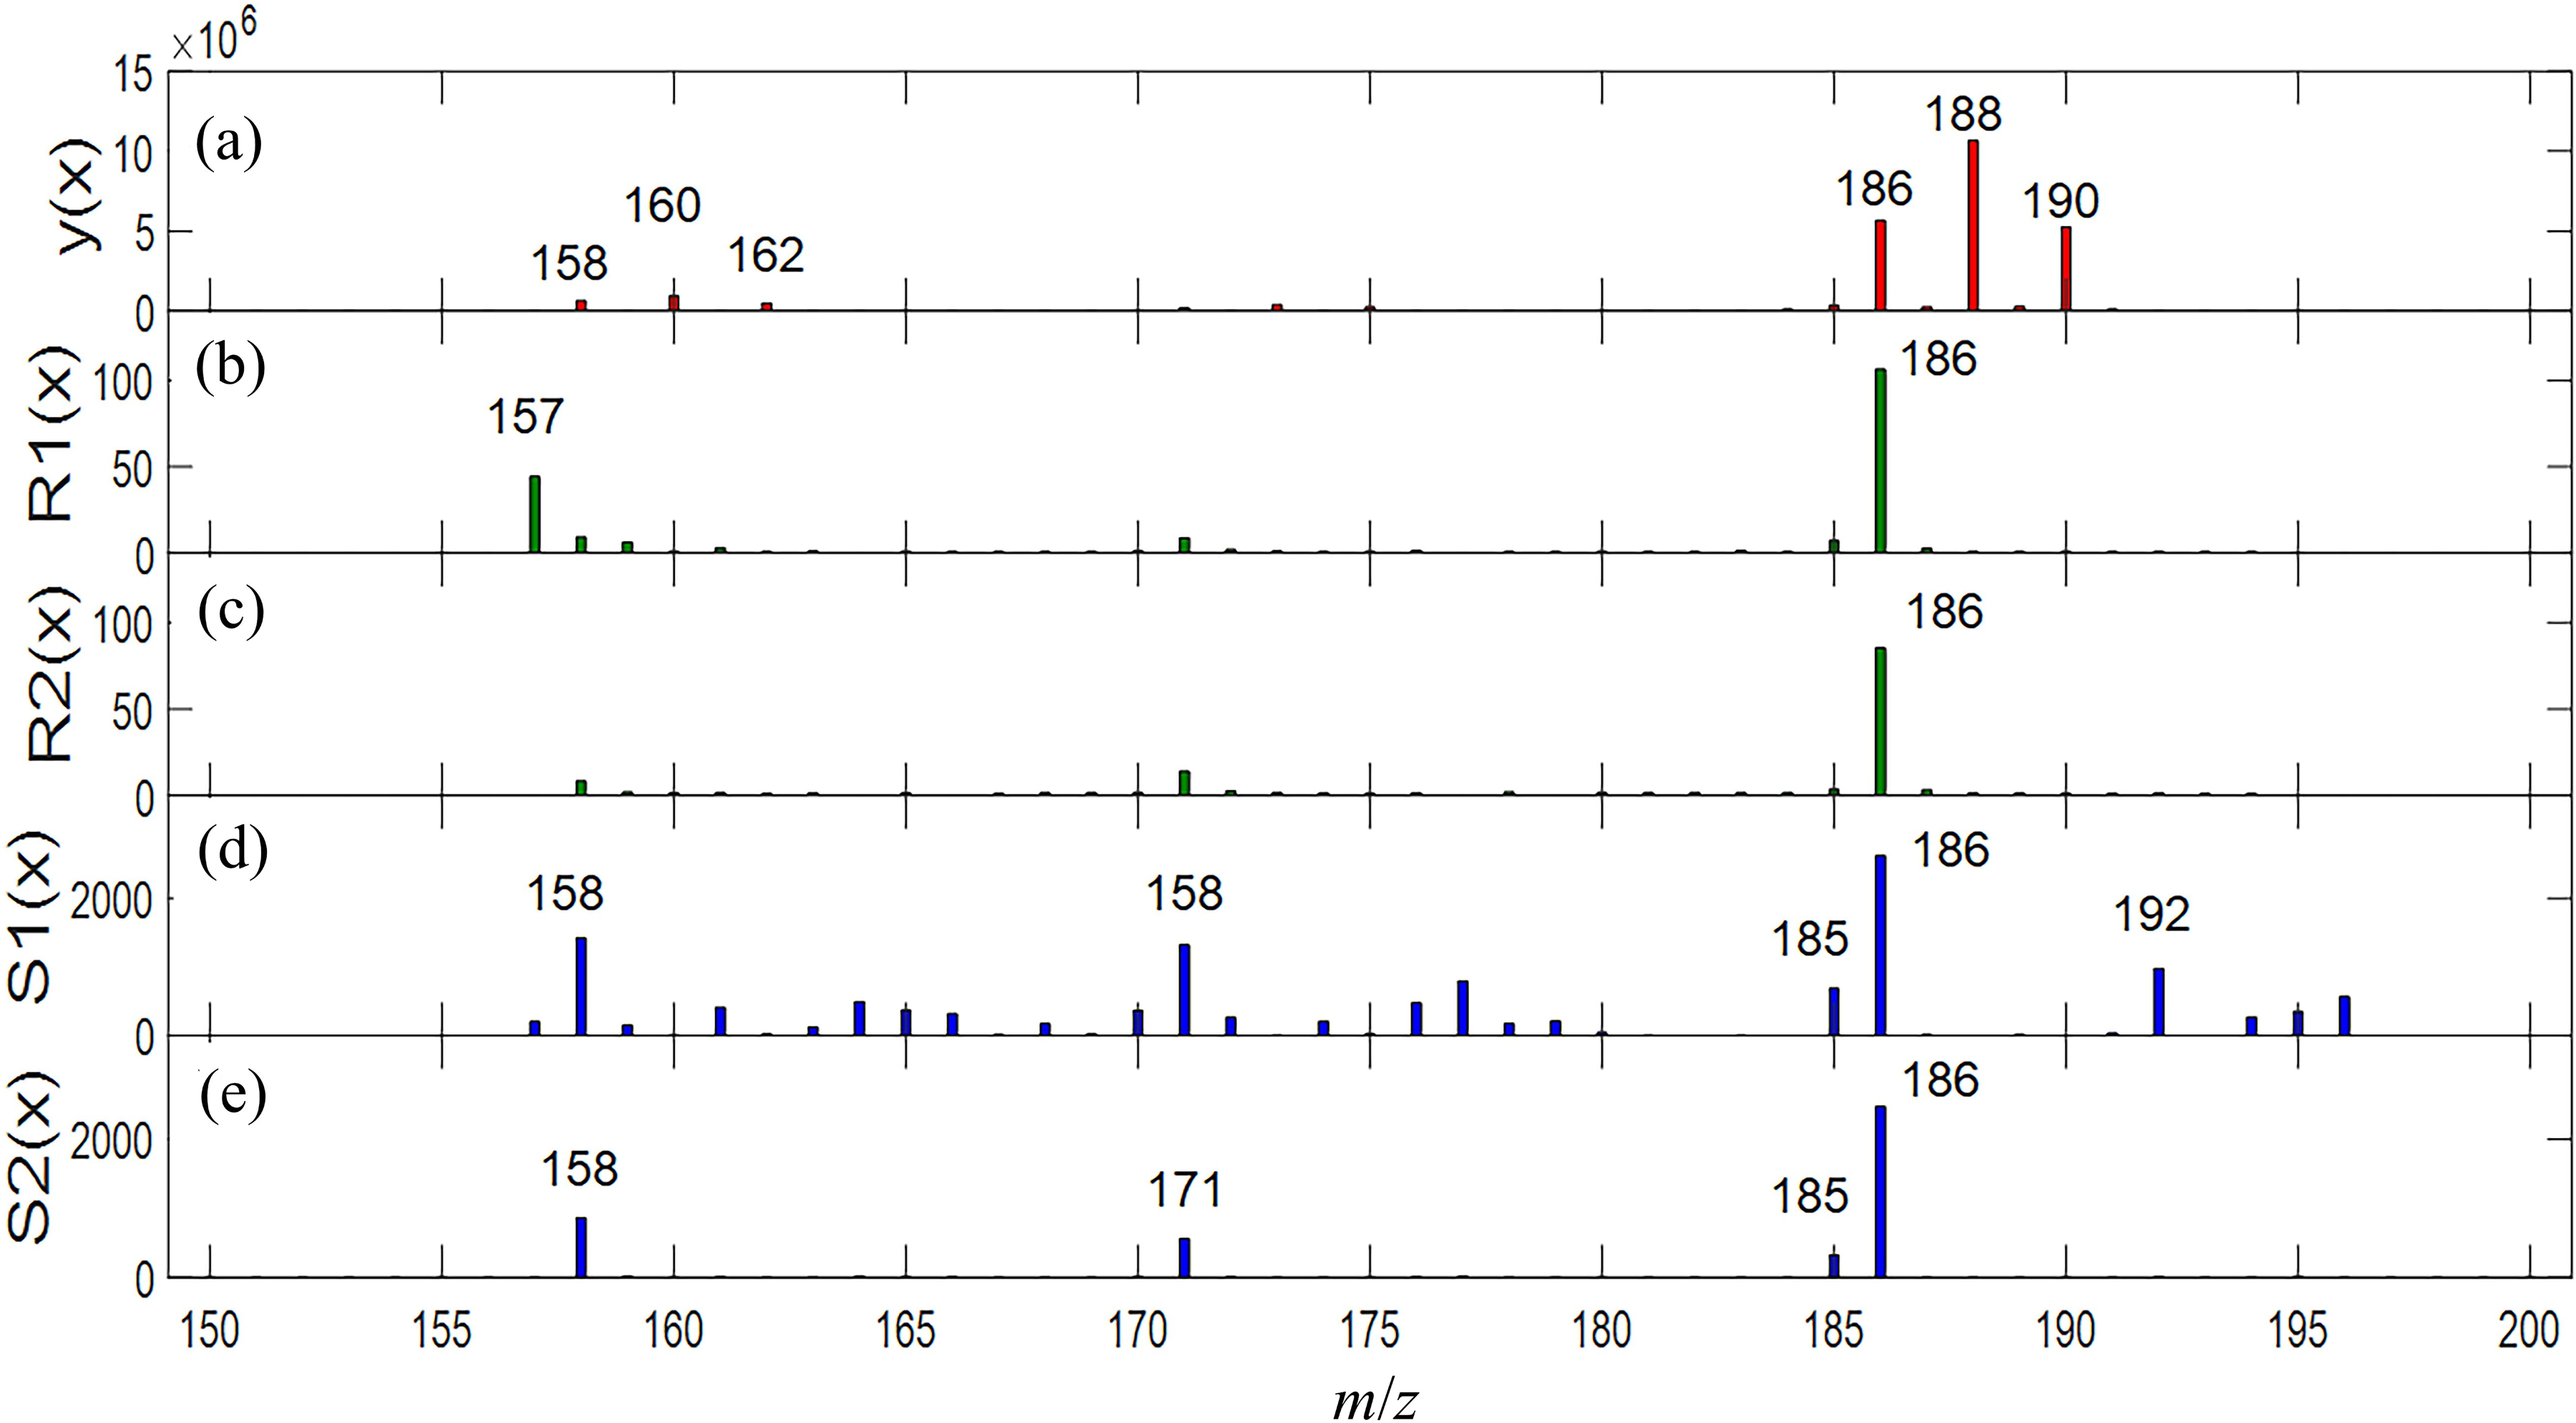
(a) A typical mass spectrum of 1,2-dibromoethane. (b) An auxiliary spectrum generated via Eq. 6 to highlight the peaks for possible fragments of CmHnBr2+. (c) An auxiliary spectrum generated via Eq. 16 to highlight the peaks for possible fragments of CmHnBr2+. (d) The corresponding statistically auxiliary spectrum obtained from the 3230 auxiliary spectra produced with Eq. 6. (e) The corresponding statistically auxiliary spectrum obtained from the 3230 auxiliary spectra produced with Eq. 16.
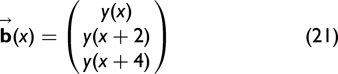
Since the dimension of
We notice that the original peaks that are highlighted in Figure 3b and Figure 3c are too weak. The interference of noise in the original mass spectrum might make the relative intensities of the peaks at M, M + 2, and M + 4 happen to be close to those of the element of vectors showing in Eq. 19. Consequently, some peaks may be false-positively highlighted in the auxiliary spectra via the accidental orthogonality. To avoid the production of false positive peaks, the statistically auxiliary spectra mentioned in the previous paragraphs are adopted. The statistically auxiliary spectrum produced from the 3230 R1(x) is denoted as S1(x), and the statistically auxiliary spectrum produced from the 3230 R2(x) is denoted as S2(x). The resultant S1(x) and S2(x) are displayed in Figure 3d and Figure 3e, respectively. Since the accidental orthogonality can be effectively avoided via the statistical approach, we focus on Figure 3d and Figure 3e. Compared with Figure 3e, more peaks are highlighted in Figure 3d. To find out the reason for the difference in the highlighted peak between Figure 3d and Figure 3e, we selected a peak at 192 as an example. The peak was considerably highlighted in Figure 3d, but was not highlighted in Figure 3e. A typical mass spectrum is shown in Figure S7. If the highlighted peak is really from a fragment of CmHnBr2+, the corresponding triplet should appear at 192, 194, and 196. The ratio of intensities among the three peaks should be roughly 1:2:1. In Figure S7, the peaks at 192 and 194 are present; however, the peak at 196 turns out to be absent. Moreover, the ratio of the intensity between the peaks at 192 and 194 is far from 1 : 2. Thus, the peak at 192 in Figure 3d was false-positively highlighted via Eq. 6 as the dimensions of both
A tentative assignment of the four highlighted peaks observed in the statistically auxiliar spectrum shown in Figure 3e for the fragments containing two Br atoms.
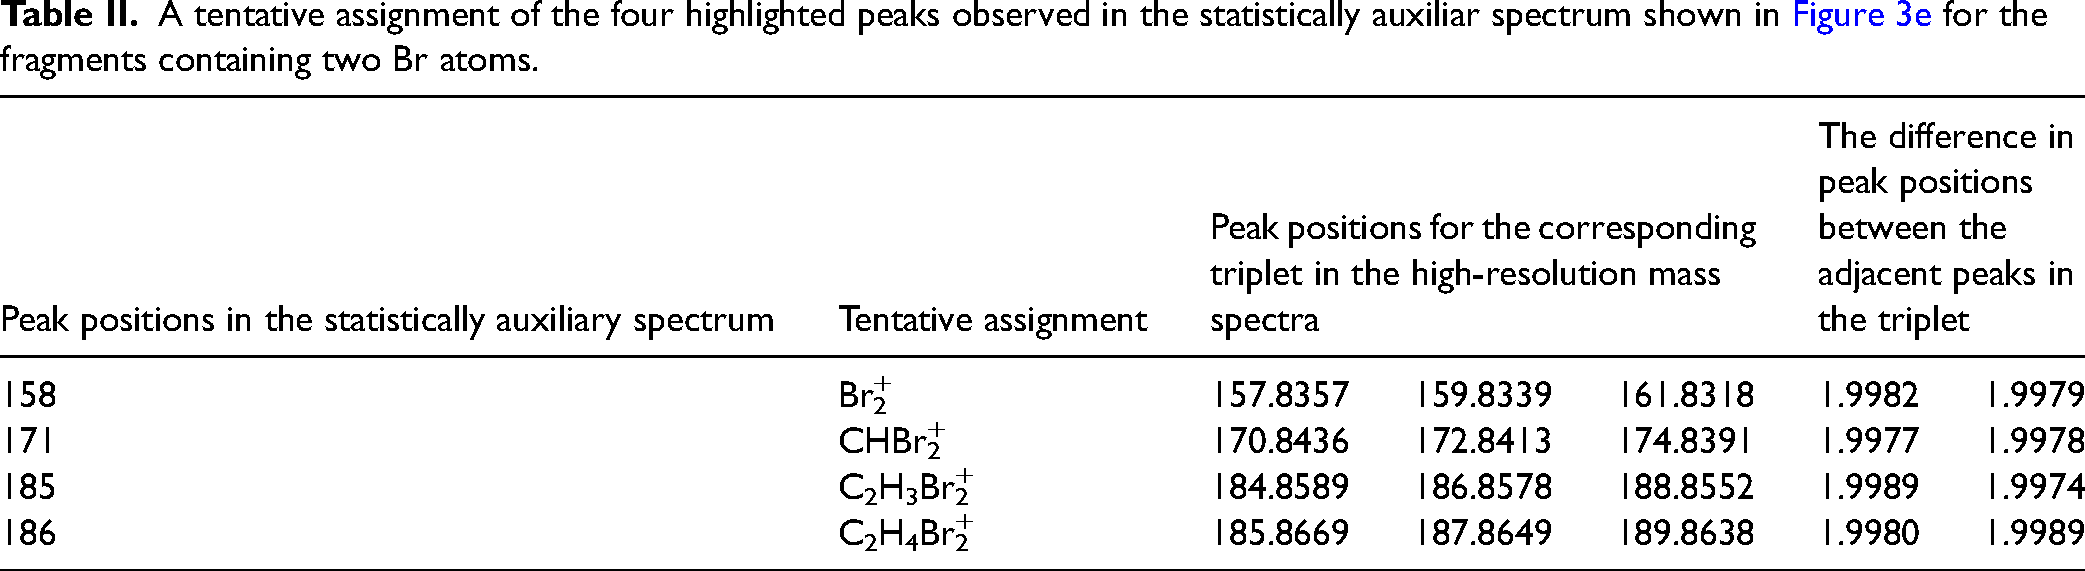
For each of the highlighted peaks shown in Figure 3e, the corresponding triplets in the original mass spectrum are weak, but indeed occur. In addition, we have recorded the mass spectra of 1,2-dibromoethane via a GC coupled with high-resolution mass spectrometric experiment. For each highlighted peak in Figure 3e, the corresponding triplets are observable in the mass spectra obtained from the elution peak of 1,2-dibromoethane. In the triplet, the mass difference between the adjacent peaks is around 1.998, which matches the mass difference between 79Br and 81Br. Moreover, the exact mass of the peaks confirms the assignments of the fragment containing two bromine atoms shown in Table II.
Concerning the Peak from RBr2+
Wu et al claimed the observation of the peak for Br2+ in the spectrum of 1,2-dibromoethane under the excitation of an intense femtosecond laser (800 nm).78,79 We use the approach described in this paper to check whether peaks for CmHnBr2+ occur or not. Figure 4a displays a typical example of the original mass spectrum of 1,2-dibromoethane. The vector for CmHnBr2+ is shown in Eq. 22. Since CmHnBr2+ possesses two positive charges, the corresponding 

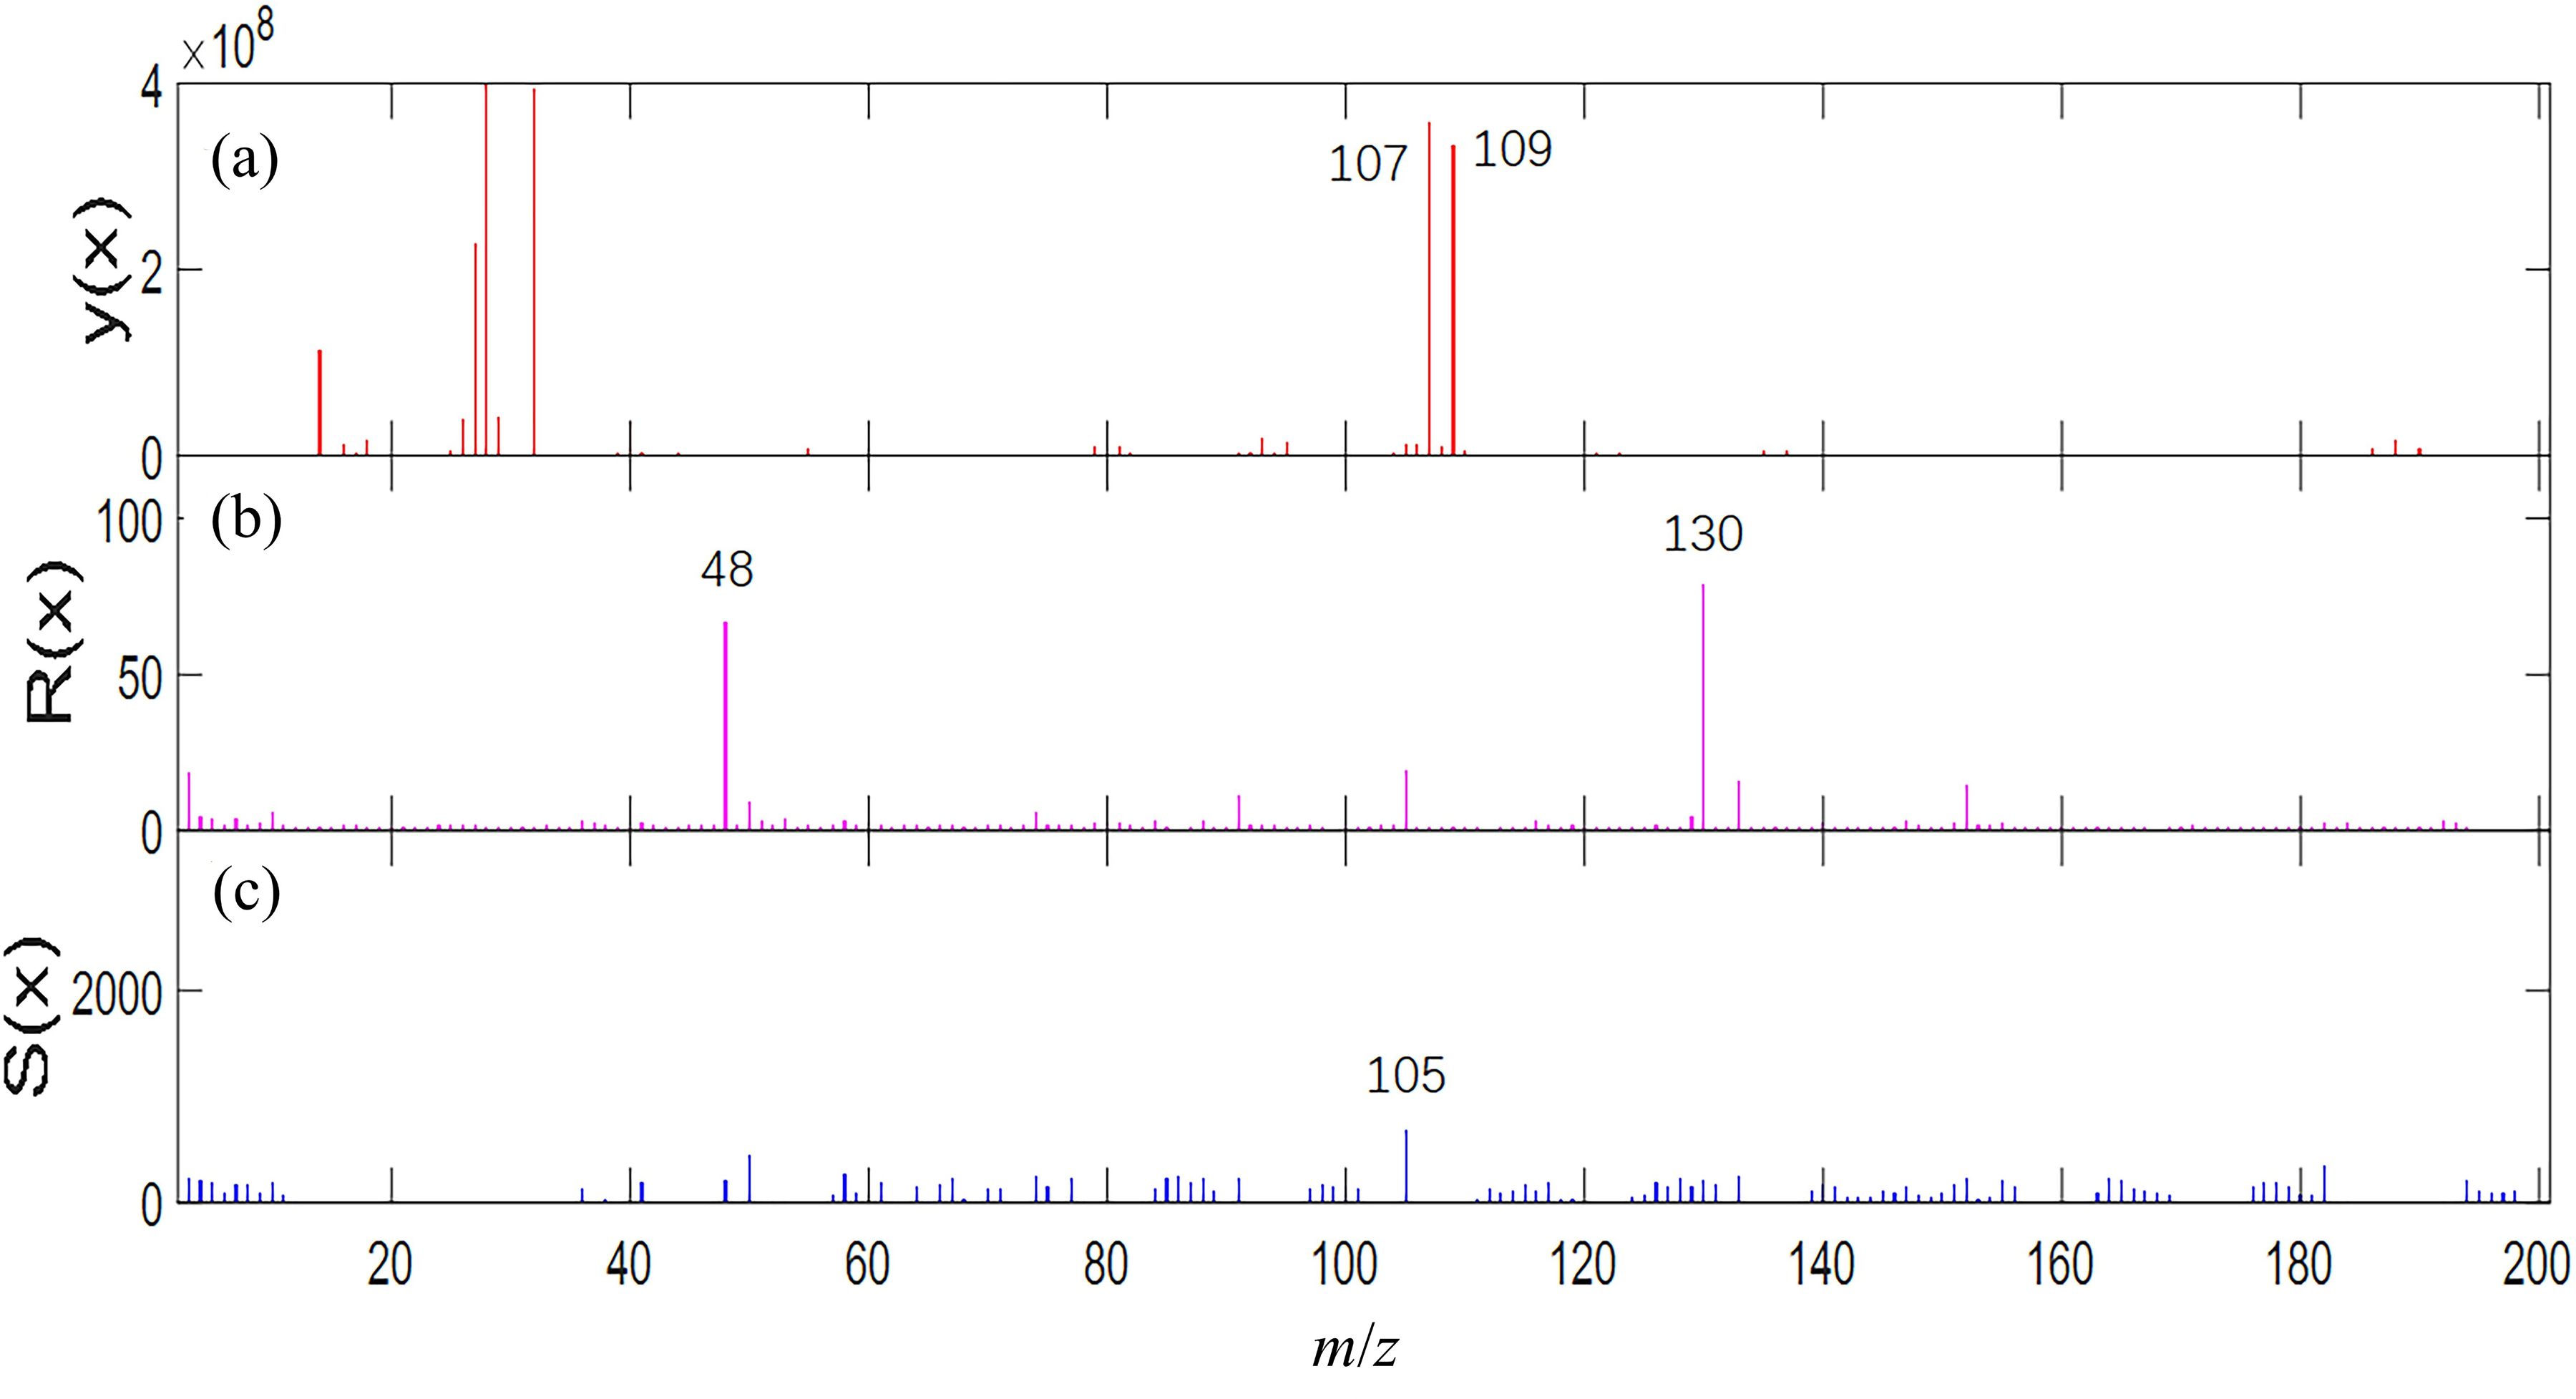
(a) A typical example of the original mass spectrum of 1,2-dibromoethane. (b) The auxiliary spectrum generated via Eq. 6 to highlight the peaks for possible fragments of CmHnBr2 + . (c) The corresponding statistically auxiliary spectrum.
Since the dimensions of both
In addition, we found that no peaks are highlighted in Figure 4c. As a matter of fact, the strongest peak in the statistically auxiliary spectrum shown in Figure 4c is the peak at m/z = 105, and the intensity of the peak is only 693. This result indicates that only the peak at 105 is highlighted in 693 mass spectra among the 3230 mass spectra. Since the peak is highlighted in a low percentage of the mass spectra (693/3230 < 25%). At present, we do not believe the peak at 105 is from fragments of CmHnBr2+, which is present in the mass spectra of 1,2-dibromoethane. According to the literature, Electron ionization (EI) is unlikely to produce fragments that carry multiple positive charges. This may be the reason no peak from either Br2+ or CmHnBr2+ can be found in the mass spectrum of 1,2-dibromoethane in the present work.
Identification of Fragments Containing a Single Chlorine Atom, Two Chlorine Atoms, and Three Chlorine Atoms in the Mass Spectra of Chloroform
Herein, we use the approach to analyze the mass spectra of chloroform as a second real-world example. In the TGA-MS experiment, 429 mass spectra are collected. A typical mass spectrum is present in Figure S9a.
The first task is to identify the fragments containing a single chlorine atom. The corresponding isotopologues are (CmHn35Cl+ and CmHn37Cl+). Since the nominal mass difference between CmHn35Cl+ and CmHn37Cl+ is 2, the corresponding nominal m/z values for CmHn35Cl+ and CmHn37Cl+ are M and M + 2, respectively.
The situation of 2H and 13C is similar to the discussion for fragments containing one bromine atom in 1 of the Supplemental Material. The spectral contribution from isotopologues containing multiple 13C, 2H atoms can be safely neglected. CmHn35Cl+ and CmHn37Cl+ are the dominant species among the possible isotopologues. Thus, we have:
Subsequently, we used the
The second task is to identify the fragments containing two chlorine atoms. Similar to the case of fragments containing a single chlorine atom, the spectral contribution from isotopologues containing 13C, 2H can be neglected. Thus, the resultant isotopologues are (CmHn35Cl2+, CmHn35Cl37Cl+, and CmHn37Cl2+), and the nominal m/z values for the three isotopologues are M, M + 2, and M + 4. Thus, we have:
The third task is to identify the fragments containing three chlorine atoms. Similar to the case of fragments containing a single chlorine atom, the spectral contribution from isotopologues containing 13C, 2H can be neglected. Thus, the resultant isotopologues are (CmHn35Cl3+, CmHn35Cl237Cl+, CmHn35Cl37Cl2+, and CmHn37Cl3+), and the nominal m/z values for the three isotopologues are M, M + 2, M + 4, and M + 6. Thus, we have: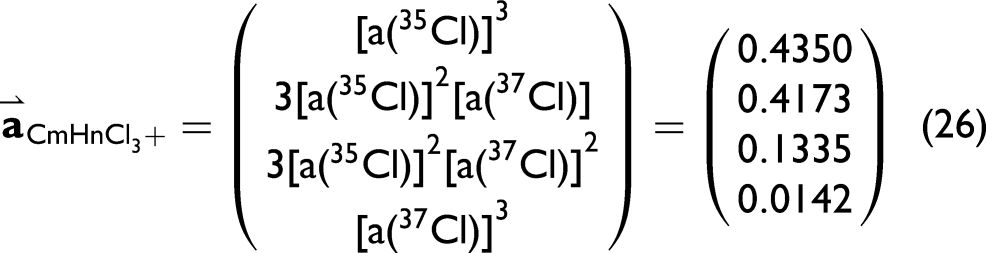
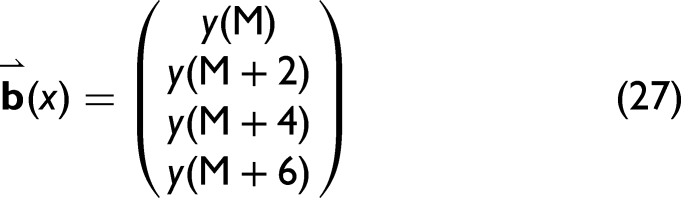
We used the
Most assignments shown in Table S2 are supported by the results of Lago et al. 80 However, the following issues should be noted: (i) The peak at 112 in Figure S9b is tentatively assigned to C6H5Cl+, which may be originated from impurity of the chloroform sample. (ii) The peak at 96 in Figure S9c is preliminarily attributed to C2H2Cl2+, which may also belong to an impurity of the sample. (iii) We believe that the peaks at 119 and 120 in Figure S9d are the peaks from CCl3+ and CHCl3+, respectively. The above two fragments contain three chlorine atoms. The corresponding isotopologues form a quartet. According to Eq. 26, the ratio between the second peak and the third peak is {3[a(35Cl)]2[a(37Cl)]}/{3[a(35Cl)][a(37Cl)]2} = a(35Cl)/a(37Cl). This value happens to be the same as the ratio of the intensities of the doublet for the isotopologues for the fragment containing a single chlorine atom. Consequently, the fragments CCl3+ and CHCl3+ are coincidentally highlighted at 119 and 120 in Figure S9b.4). The highlighted peaks in Figure S9b, Figure S9c, and Figure S9d are quite weak and difficult to be observed in the original mass spectra shown in Figure S9a. However, the corresponding doublets, triplets, and quartets indeed occur in the original mass spectra. In Figure S10, the magnified doublets, triplets, and quartets in the original mass spectra are present.
Conclusion
In this work, we propose an approach to identify fragments based on the characteristic isotopologue pattern from a given mass spectrum. According to the self-orthogonality property of the Hilbert–Noda matrix, auxiliary spectra are generated. When the intensities of a group of peaks match the characteristic isotopologue, highlighted peaks, which suggest the occurrence of a specific composition of isotopes, will be produced in the auxiliary spectrum. Moreover, a modified approach to generate the auxiliary peak to address the problem of false-positively highlighted peaks produced by a high-dimensional characteristic vector for different isotopologues is developed. Additionally, a statistical approach to avoid coincidental orthogonality is also adopted. The approach has been exemplified in the analysis of the mass spectra of 1,2-dibromoethane and chloroform. In the analysis of the mass spectra of 1,2-dibromoethane, weak peaks for fragments containing a single bromine atom and two bromine atoms have been successfully identified. In the analysis of chloroform, weak peaks for fragments containing a single chlorine atom, two chlorine atoms, and three chlorine atoms can also be highlighted.
In future work, we will establish a database where the characteristic patterns of fragments containing different amounts of stable isotopes are stored. In the analysis of an unknown mass spectrum, the characteristic pattern for each fragment containing different amounts of stable isotopes is retrieved from the database and used to generate the corresponding auxiliary spectra. We hope the highlighted peaks may be helpful in identifying unknown peaks from complex fragments based on their isotopic features. Further work is still being carried out.
Supplemental Material
sj-docx-1-asp-10.1177_00037028261450236 - Supplemental material for Identification of Unknown Peaks in Mass Spectra Based on the Characteristic Isotopic Pattern via the Hilbert–Noda Matrix
Supplemental material, sj-docx-1-asp-10.1177_00037028261450236 for Identification of Unknown Peaks in Mass Spectra Based on the Characteristic Isotopic Pattern via the Hilbert–Noda Matrix by Ying Liu, Lei Gao, Anqi He, Honggang Nie, Limin Yang, Yukihiro Ozaki, Isao Noda and Yizhuang Xu in Applied Spectroscopy
Footnotes
Acknowledgments
The work was also supported by the High-Performance Computing Platform of Peking University. We are very grateful for the helpful discussion with Prof. Zhanglan Yang of Peking University.
Ying Liu and Lei Gao contributed equally to this work.
Declaration of Conflicting Interests
The author(s) declared no potential conflicts of interest with respect to the research, authorship, and/or publication of this article.
Funding
The author(s) disclosed receipt of the following financial support for the research, authorship, and/or publication of this article: The financial supports were provided by the cooperated materials project 104 with ICCAS, the National Natural Science Foundation of China (12275011, 22504002, and 51373003), the National Key R&D Program of China (No. 2017YFA0701001), Innovation of Instrumentation and Key Techniques Foundation of Peking University (No. 7101500246/001 and 7101500253/011), and State Key Laboratory of Nuclear Physics and Technology, School of Physics, Peking University (NPT2020KFY14 and NPT2025KFY01).

Supplemental Material
All supplemental material mentioned in the text accompanies this paper online.
References
Supplementary Material
Please find the following supplemental material available below.
For Open Access articles published under a Creative Commons License, all supplemental material carries the same license as the article it is associated with.
For non-Open Access articles published, all supplemental material carries a non-exclusive license, and permission requests for re-use of supplemental material or any part of supplemental material shall be sent directly to the copyright owner as specified in the copyright notice associated with the article.
